genomics overview/wgs and metagenomics€¦ · genomics overview/wgs and metagenomics martin...
TRANSCRIPT

Genomics Overview/WGS and Metagenomics
Martin Wiedmann
Gellert Family Professor of Food Safety
Department of Food Science
Cornell University, Ithaca, NY
E-mail: [email protected]
Phone: 607-254-2838

Outline
• Why are we here?
• Background on tools: from PFGE to WGS
• Case studies on WGS use for outbreak and in-plant environmental investigations
• Metagenomics
• Other WGS and NGS applications in dairy


In addition, whole genome sequencing showed that 5 Listeria isolates collected in 2010 from
the same facility were also closely related genetically to isolates from ill people.

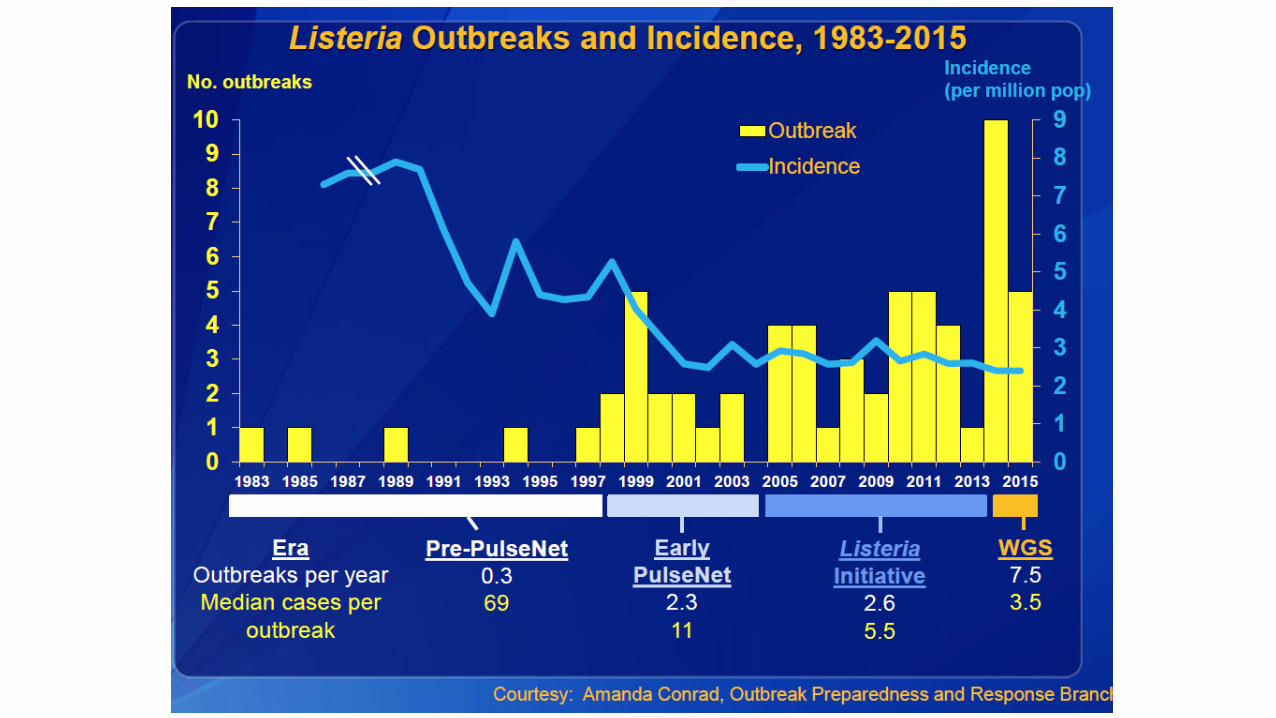
March 2015: Listeriosis cases linked to Blue Bell ice cream


Outline
• Why are we here?
• Background on tools: from PFGE to WGS
• Case studies on outbreak and in-plant environmental investigations
• Metagenomics
• Other WGS and NGS applications in dairy

Bacterial Genomes– Typically between 2 and 10 million nucleotides
(2,000 to 10,000 genes)
– Pan-genome: All genes in a species
• Core genome: ~3,000–5,000 genes, present in most strains of a given species
• Accessory genome: up to thousands of genes, not always present
• Structure
– Double-stranded DNA
– Usually single, circular chromosome

DNA-based strain typing methods using restriction enzyme-based methods
• Include PFGE and ribotyping
• Detect changes (mutations) in restriction enzyme recognition sites (6 – 8 bp in length) and length variations in sequences between recognition sites
– Single bp mutation can potentially create a different subtype
– Only small fraction of genome is “probed” for variation
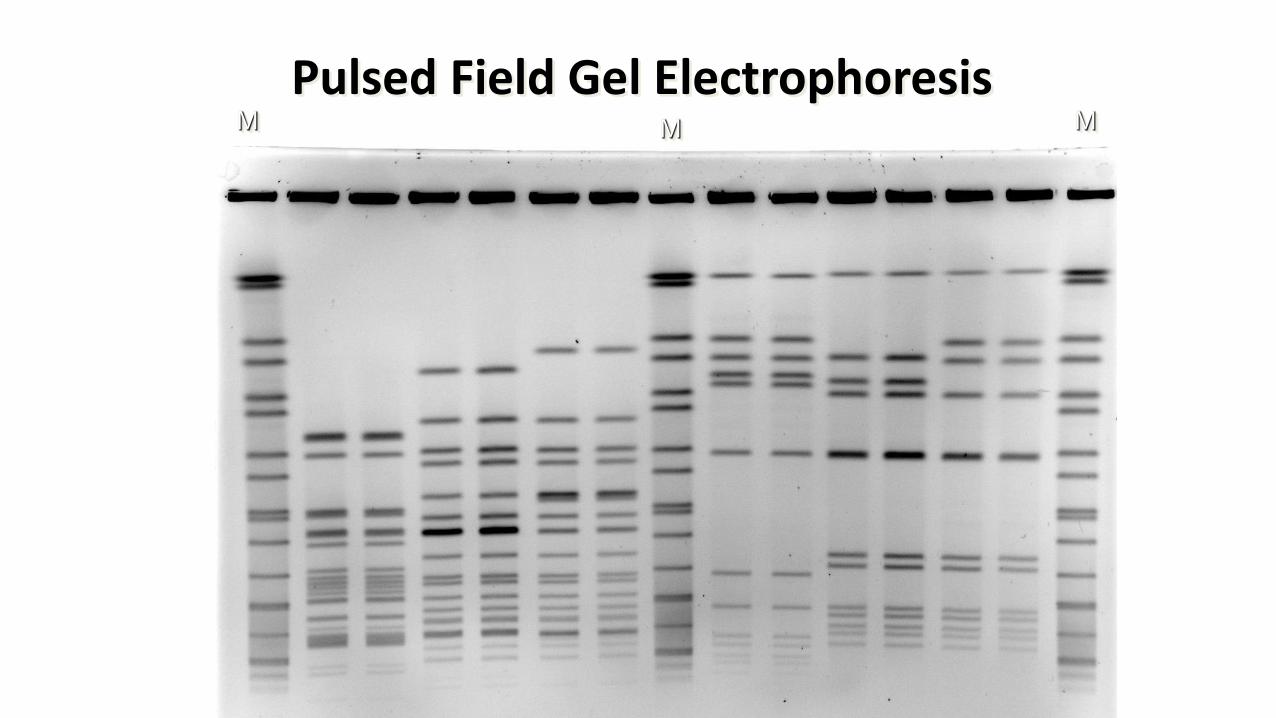
Pulsed Field Gel ElectrophoresisM M M

Challenges with use of PFGE as a subtyping method in outbreak investigations
• Two isolates may show the same PFGE type even though they are genetically distinct• PFGE only interrogates small part of the genome
• Two isolates may show “slightly” (?? - the “3-band rule”) different PFGE patterns despite sharing a very recent common ancestor• Could be due to lateral genes transfer, loss of plasmid,
rearrangements, point mutations etc.

DNA sequencing-based subtyping
Isolate 1 AACATGCAGACTGACGATTCGACGTAGGCTAGACGTTGACTG
Isolate 2 AACATGCAGACTGACGATTCGTCGTAGGCTAGACGTTGACTG
Isolate 3 AACATGCAGACTGACGATTCGACGTAGGCTAGACGTTGACTG
Isolate 4 AACATGCATACTGACGATTCGTCGAAGGCTAGACGTTGACTG
SNP: single nucleotide polymorphism
1
3
2
4

Different sequencing-based methods
• MLST (multi-locus sequence typing): – Typically sequencing of 7 genes (only 600 to 700 nt parts of genes are typically
sequenced)
• Whole genome sequencing– Complete genome is sequenced
– Can be done by different methods, but today is typically done by “next gen sequencing” methods (NGS)
• “NGS” can be used for applications other than WGS:– Metagenomics as an important application
– NGS include 2nd gen methods (Illumina, sequences genomes in short pieces, typically <500 nt) and 3rd gen methods (e.g., MinIon, sequences large fragments, >10,000 nt)


Different approaches to analyzing WGS data
• High quality SNP– Data analysis available through FDA and CDC pipelines; also available through
BioNumerics
• MLST, including wgMLST and cg MLST– Data analyses available in BioNumerics; selected MLST schemes are also available
through free an public platforms• wgMLST: CDC, PHE, PulseNet International
• cgMLST: Institute Pasteur

Analysis of genome wide SNPs (wgSNPs)
• Identifies all high confidence SNPs over whole genome (approx. 3 to 5 million nucleotides)
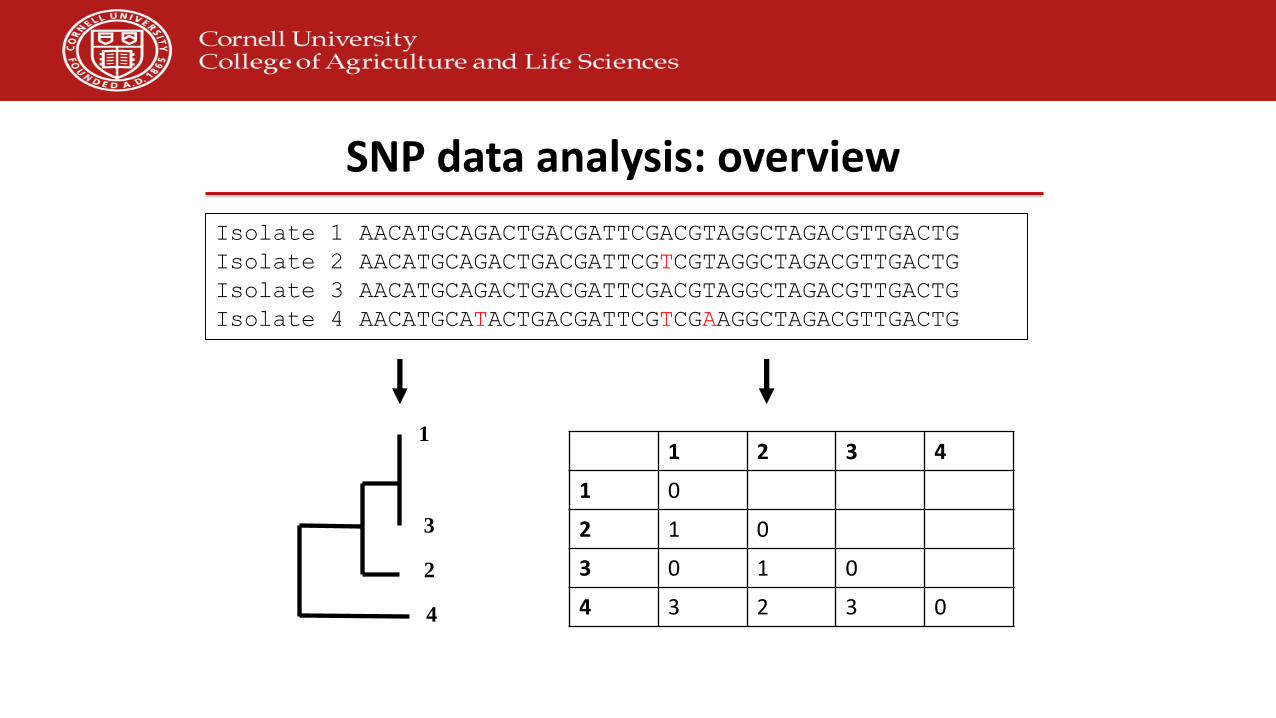
SNP data analysis: overview
Isolate 1 AACATGCAGACTGACGATTCGACGTAGGCTAGACGTTGACTG
Isolate 2 AACATGCAGACTGACGATTCGTCGTAGGCTAGACGTTGACTG
Isolate 3 AACATGCAGACTGACGATTCGACGTAGGCTAGACGTTGACTG
Isolate 4 AACATGCATACTGACGATTCGTCGAAGGCTAGACGTTGACTG
1
3
2
4
1 2 3 4
1 0
2 1 0
3 0 1 0
4 3 2 3 0

Whole genome multilocus sequence typing (wgMLST)
• Allows for simpler analysis and clear naming of subtypes
• Performs comparison on a gene by gene level
Isolate A Isolate B Isolate C
Gene 1 1 1 1
Gene 2 8 8 12
Gene 3 5 5 2
Etc.
Gene 1,005 4 4 4
wgMLST type A A B

Xbal SpeI
L
Den Bakker
et al. 2011.
AEM.
Includes isolates form
Salmonella outbreak
linked to sausages
(Rhode Island) and
isolates from pistachios

Tip-dated maximum clade credibility tree based on SNP data for 47 Montevideo isolates

Outline
• Why are we here?
• Background on tools: from PFGE to WGS
• Case studies on outbreak and in-plant environmental investigations
– Case study 1: outbreak detection
– Case study 2: subtyping of food or environmental isolates

Human listeriosis cases in NYS: 1/97-10/98
0
1
2
3
4
5
6
7
8
Jan
Mar
May Ju
lSep N
ov Jan
Mar Ju
nAu
gOct
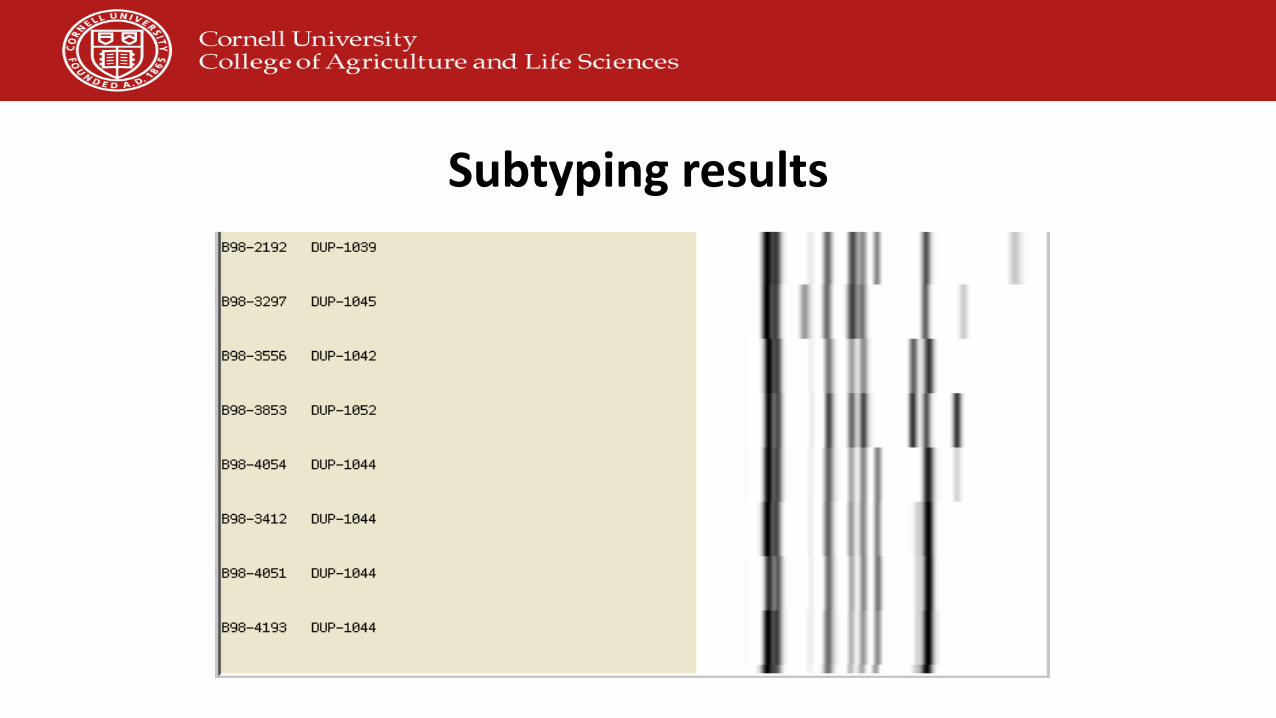
Subtyping results

Epidemic curve for 1/97 - 2/99 in NYS
0
1
2
3
4
5
6
7
8
Jan
MarMay Ju
lSep Nov Ja
nMar Ju
nAug Oct
Dec Feb
1044A
Other Ribotypes


Data sources for food history comparsions
• Case-control studies
• Case-case studies– May identify incorrect likely food sources if sporadic cases are
not matched to outbreak cases
• Historical food consumption data


• Sporadic case
– Food source identification

Some of the challenges
• Identical bacteria (100% match over the whole genome) can be found in different places that can be potential sources of foodborne disease outbreaks
• Minor changes (a “few” SNPs) can occur quickly, for example during growth in enrichment media or in an infected human)

The theoretical background
• Bacteria divide asexually: Bacterial populations can be seen as large populations of “identical twins”
• Mutation rate during replication is low: extremes of the suggested mutation rates range from 2.25 × 10⁻¹¹ to 4.50 × 10⁻¹⁰ per bp per generation– With a genome size of around 5 Million bp per bacterial genome (5 × 10⁶) between approx. 450
and 9,000 generations are needed for a single SNP difference
– Eyre et al. estimated evolutionary rate of 0.74 SNVs per successfully sequenced genome per year for C. difficile (N. Engl. J. Med. 2013)
• “Whole-genome sequencing … identified 13% of cases that were genetically related (≤2 SNVs) but without any evidence of plausible previous contact through a hospital, residential area, or family doctor.”
• Unknown bacterial generation time in different environments complicates interpretation– How often does Salmonella multiply in a dry facility (per year)??

Real world observations

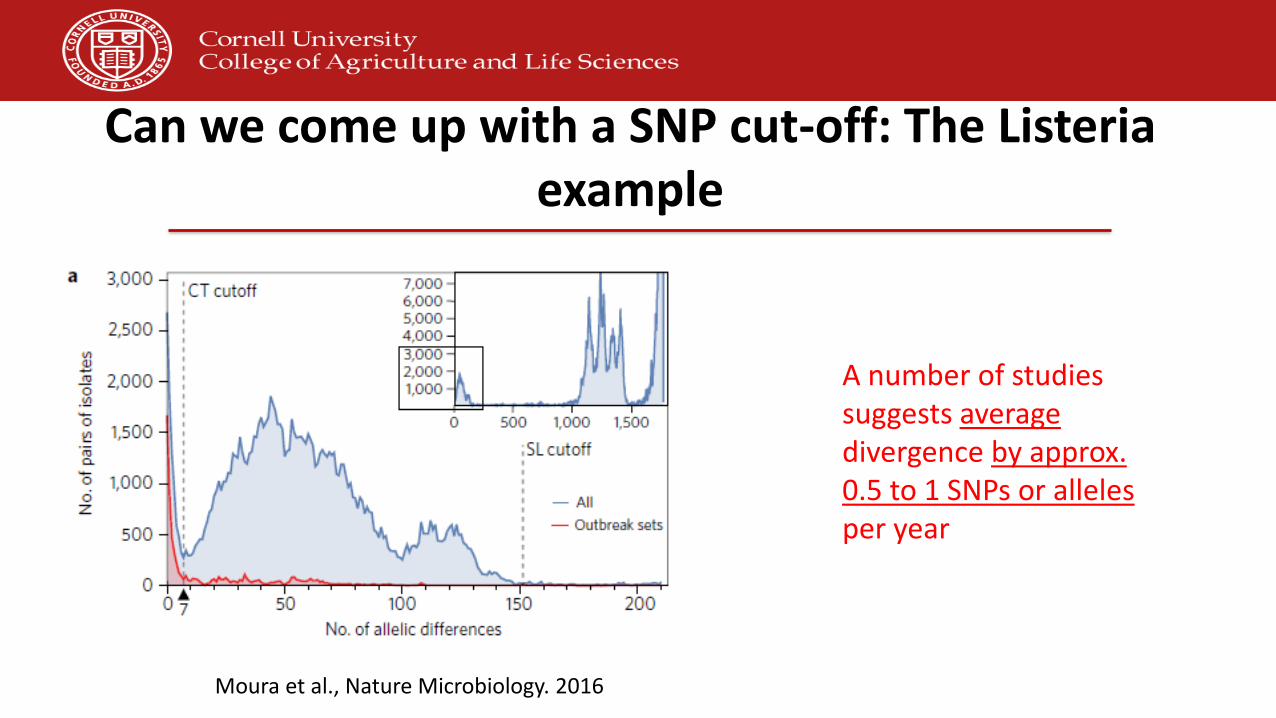
Moura et al., Nature Microbiology. 2016
Can we come up with a SNP cut-off: The Listeria example
A number of studies suggests average divergence by approx. 0.5 to 1 SNPs or allelesper year

A somewhat hypothetical case study
• Three people with listeriosis; the Listeria monocytogenes isolates differ by 2 SNPs
• All three people purchased cheese in super market B
A somewhat hypothetical case study
• Three people with listeriosis; the Listeria monocytogenes isolates differ by 2 SNPs
• All three people purchased deli meat in retail deli B
• L. monocytogenes with WGS type that differs by 1 - 3 SNPs from the human isolates is found in a drain in the retail deli B
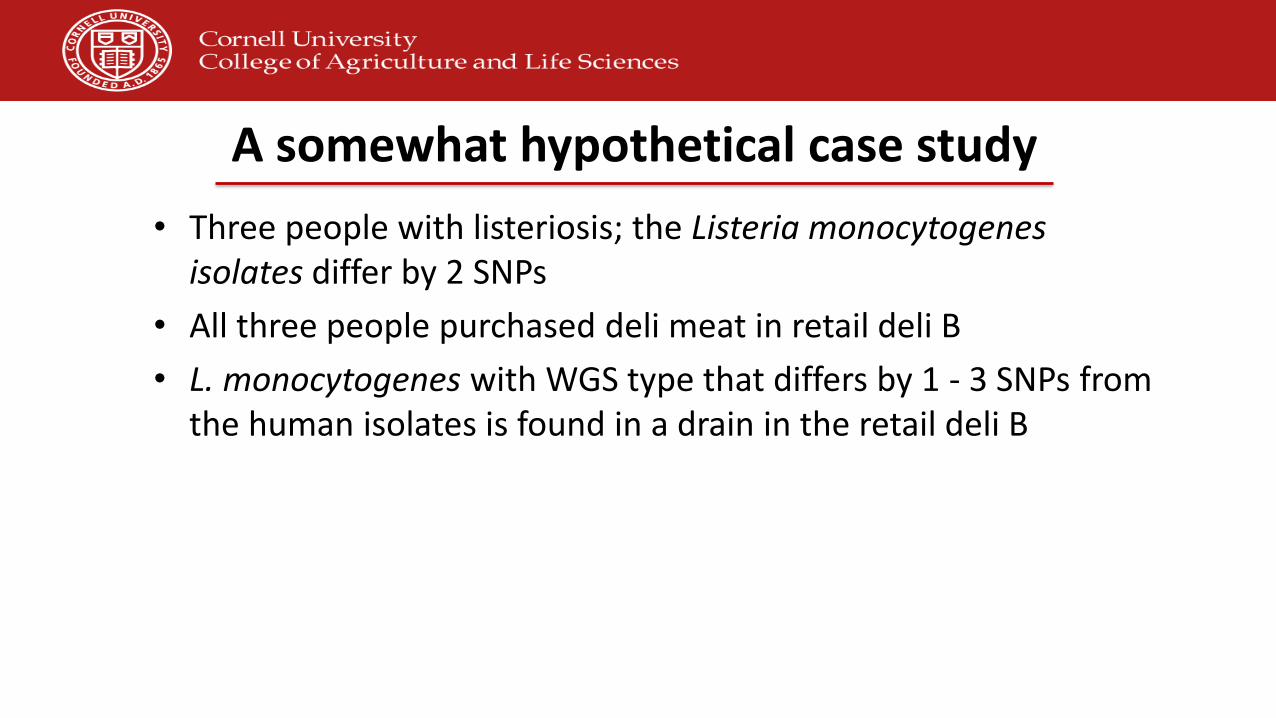
• Subsequent work shows that additional L. monocytogenes isolates with WGS type that differs by 1 - 3 SNPs from the human isolates are found in 2 more retail delis in other states

Real world observations
In one case, isolates with < 3 SNP differences were found in
retail delis in there different states


45
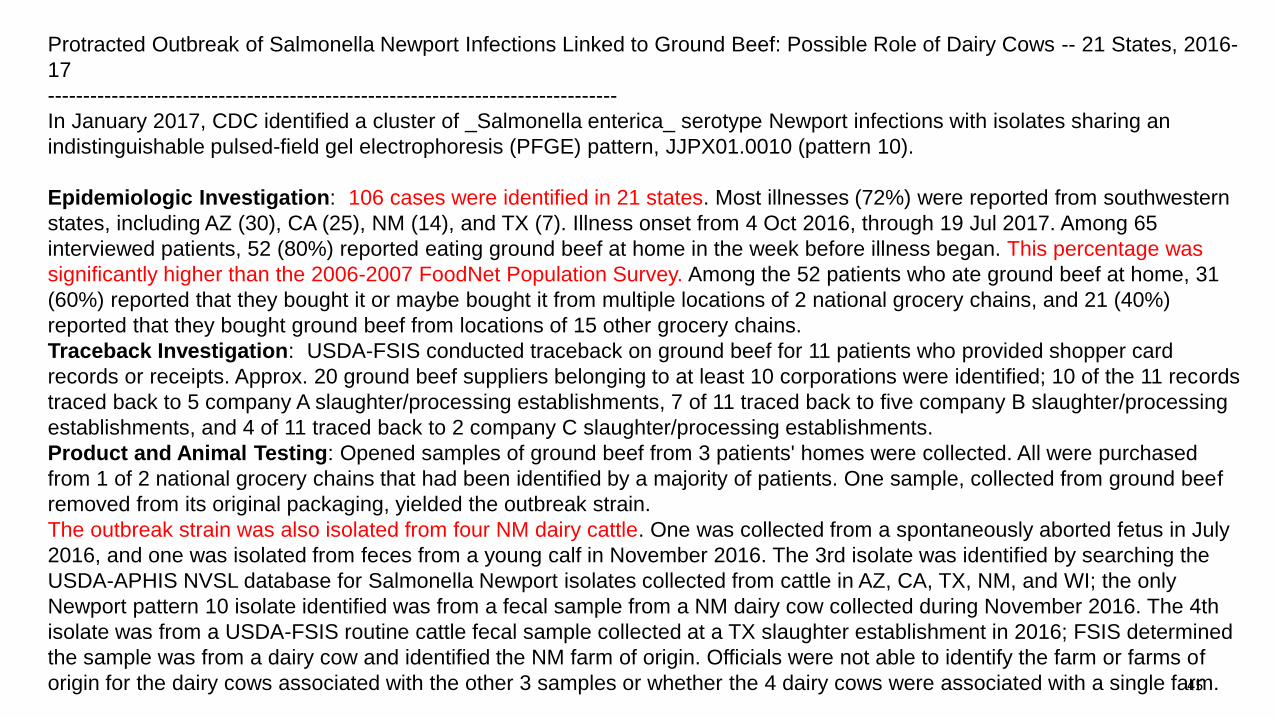
Protracted Outbreak of Salmonella Newport Infections Linked to Ground Beef: Possible Role of Dairy Cows -- 21 States, 2016-
17
--------------------------------------------------------------------------------
In January 2017, CDC identified a cluster of _Salmonella enterica_ serotype Newport infections with isolates sharing an
indistinguishable pulsed-field gel electrophoresis (PFGE) pattern, JJPX01.0010 (pattern 10).
Epidemiologic Investigation: 106 cases were identified in 21 states. Most illnesses (72%) were reported from southwestern
states, including AZ (30), CA (25), NM (14), and TX (7). Illness onset from 4 Oct 2016, through 19 Jul 2017. Among 65
interviewed patients, 52 (80%) reported eating ground beef at home in the week before illness began. This percentage was
significantly higher than the 2006-2007 FoodNet Population Survey. Among the 52 patients who ate ground beef at home, 31
(60%) reported that they bought it or maybe bought it from multiple locations of 2 national grocery chains, and 21 (40%)
reported that they bought ground beef from locations of 15 other grocery chains.
Traceback Investigation: USDA-FSIS conducted traceback on ground beef for 11 patients who provided shopper card
records or receipts. Approx. 20 ground beef suppliers belonging to at least 10 corporations were identified; 10 of the 11 records
traced back to 5 company A slaughter/processing establishments, 7 of 11 traced back to five company B slaughter/processing
establishments, and 4 of 11 traced back to 2 company C slaughter/processing establishments.
Product and Animal Testing: Opened samples of ground beef from 3 patients' homes were collected. All were purchased
from 1 of 2 national grocery chains that had been identified by a majority of patients. One sample, collected from ground beef
removed from its original packaging, yielded the outbreak strain.
The outbreak strain was also isolated from four NM dairy cattle. One was collected from a spontaneously aborted fetus in July
2016, and one was isolated from feces from a young calf in November 2016. The 3rd isolate was identified by searching the
USDA-APHIS NVSL database for Salmonella Newport isolates collected from cattle in AZ, CA, TX, NM, and WI; the only
Newport pattern 10 isolate identified was from a fecal sample from a NM dairy cow collected during November 2016. The 4th
isolate was from a USDA-FSIS routine cattle fecal sample collected at a TX slaughter establishment in 2016; FSIS determined
the sample was from a dairy cow and identified the NM farm of origin. Officials were not able to identify the farm or farms of
origin for the dairy cows associated with the other 3 samples or whether the 4 dairy cows were associated with a single farm.

46
Laboratory Investigation: SNP analysis showed that 106 clinical isolates were closely related to each other genetically, to the
4 dairy cattle isolates, and to the leftover ground beef isolate (range = 0-12 SNP differences), suggesting that the Salmonella
bacteria found in patients, ground beef, and dairy cattle all shared a common source.
Public Health Response: Because the USDA-FSIS traceback investigation did not converge on a common production lot of
ground beef or a single slaughter/processing establishment, and no ground beef in the original packaging yielded the outbreak
strain, a recall of specific product was not requested. A public warning was not issued to consumers because specific,
actionable information was not available (e.g., a specific brand or type of ground beef).

A hypothetical cases study
• July 2010: cheese from creamery X found positive for L. monocytogenes when a sample collected at a supermarket was tested by government lab
– Isolates was subsequently characterized by WGS
• June 2017: Human isolates “matches” July 2010 isolate
– Both isolates are DNI (Darn Near Identical); i.e., 3 SNP difference
• What if the person reports having eaten cheeses labeled ”creamery X”? What if the person did not report eating cheese at all? etc.
Outline
• Why are we here?
• Background on tools: from PFGE to WGS
• Case studies on outbreak and in-plant environmental investigations
– Case study 1: outbreak detection
– Case study 2: subtyping of food or environmental isolates
• Metagenomics
• Other WGS and NGS applications in dairy

2000 US outbreak - Environmental persistence of L. monocytogenes
• 1988: one human listeriosis case linked to hot dogs produced by plant X
• 2000: 29 human listeriosis cases linked to sliced turkey meats from plant X

50
209 cases
28 cases

Implications for food industry
• January 2015: cheese from facility A found positive for Salmonella when a sample collected at a supermarket was tested by government lab
– Regulatory action?

Implications for food industry
• January 2015: cheese from facility A found positive for Salmonella when a sample collected at a supermarket was tested by government lab
• December 2017: environmental sample from facility A found positive for Salmonella when samples were collected and tested by a regional government lab
– Regulatory action?

The real world
FDA re-inspected and re-sampled the SM Fish facility from August 15, 2016 to September 9, 2016 and learned that the firm’s cleaning and sanitation procedures were unsuccessful in solving its environmental Listeria contamination. Testing results showed that Listeria was detected in 12 out of the 116 locations swabbed throughout the facility, including on a direct food contact surface. Other locations found to harbor the bacteria were non-food contact surfaces that are in sufficient proximity to the food and food contact surfaces to create an increased risk of contaminating the food, particularly considering inspection observations. Whole genome sequencing matched some of the Listeria findings genetically to samples collected during the June/July 2016 inspection, as well as to samples collected during the 2015 inspection, indicating that at least three strains of Listeria have been consistently present in this facility during a two-year period.

Case study
• FDA found Listeria monocytogenes in X environmental samples from facility A


Organism Strain Isolate Create date Isolation source Isolation type SNP cluster
Minimum SNP distance within same source type
Minimum SNP difference across different source types
Listeria monocytogenes FDA00011944 PDT000221089.1 6/27/2017 environmental swab environmental/other PDS000014208.1 19 n/a
Listeria monocytogenes FDA00011946 PDT000221090.1 6/27/2017 environmental swab environmental/other PDS000014208.1 16 n/a
Listeria monocytogenes FDA00011935 PDT000221079.1 6/27/2017 environmental swab environmental/other PDS000014208.1 13 n/a
Listeria monocytogenes FDA00011937 PDT000221081.1 6/27/2017 environmental swab environmental/other PDS000014208.1 41 n/a
Listeria monocytogenes FDA00011938 PDT000221085.1 6/27/2017 environmental swab environmental/other PDS000014208.1 13 n/a
Listeria monocytogenes FDA00011950 PDT000221088.1 6/27/2017 environmental swab environmental/other PDS000014209.1 4 n/a
Listeria monocytogenes FDA00011940 PDT000221077.1 6/27/2017 environmental swab environmental/other PDS000014209.1 4 n/a
Listeria monocytogenes FDA00011936 PDT000221082.1 6/27/2017 environmental swab environmental/other PDS000014209.1 11 n/a
Listeria monocytogenes FDA00011933 PDT000221112.1 6/27/2017 environmental swab environmental/other PDS000014209.1 9 n/a
Listeria monocytogenes FDA00011942 PDT000221076.1 6/27/2017 environmental swab environmental/other PDS000014210.1 17 n/a
Listeria monocytogenes FDA00011934 PDT000221083.1 6/27/2017 environmental swab environmental/other PDS000014210.1 4 n/a
Listeria monocytogenes FDA00011943 PDT000221084.1 6/27/2017 environmental swab environmental/other PDS000014210.1 4 n/a
Listeria monocytogenes FDA00011930 PDT000221106.1 6/27/2017 environmental swab environmental/other PDS000014210.1 37 n/a
Listeria monocytogenes FDA00011931 PDT000221113.1 6/27/2017 environmental swab environmental/other PDS000014210.1 49 n/a
Listeria monocytogenes FDA00011932 PDT000221114.1 6/27/2017 environmental swab environmental/other PDS000014210.1 40 n/a
Listeria monocytogenes FDA00011941 PDT000221078.1 6/27/2017 environmental swab environmental/other n/a n/a
Listeria monocytogenes FDA00011939 PDT000221080.1 6/27/2017 environmental swab environmental/other n/a n/a
What if governments find a link with our business? How can we prepare ourselves?
• Do a Mock outbreak investigation for every plan yearly (not just a mock recall)
• Have data available that show that you have validated cleaning and sanitation procedures, so that you can limit recalls
• Have access to different subtyping tools, so you can proof you identified the root cause
– In many cases you will need to show, with subtyping evidence, that you found the root cause of an issue to allow you to re-start a facility

Outline
• Why are we here?
• Background on tools: from PFGE to WGS
• Case studies on WGS use for outbreak and in-plant environmental investigations
• Metagenomics
• Other WGS and NGS applications in dairy

Metagenomcis
• Metagenomics is the characterization of all genetic material in a sample (for example milk or cheese sample)– 16S metagenomics: only sequencing of 16S rDNA
• Easy to do and specific for bacteria• Limited discriminatory power (e.g., can’t differentiates L. monocytogenes and L. innocua)
– Shutgun metagenomics: sequences all DNA in a sample• May detect DNA from dead organisms• Interference in samples with large amounts of host DNA (e.g., milk)
• Allows for comprehensive characterization that can be used for QA and troubleshooting– Already regularly used to identify causes of quality issues – Considerable potential for monitoring of fermentations
• Increasingly used and applied by US FDA, regulatory agencies worldwide, and industry

http://www.research.ibm.com/client-programs/foodsafety/
IBM: Sequencing the Food Supply Chain

50 shades of gray: Pseudomonas causes gray discoloration in HTST milk

Gene name Annotation
trpD Anthranilate phosphoribosyltransferase
trpF N-(5'-phosphoribosyl)anthranilate isomerase
trpA Tryptophan synthase alpha chain
trpB Tryptophan synthase beta chain
iolG Inositol 2-dehydrogenase/D-chiro-inositol 3-
dehydrogenasemdh Malate dehydrogenase
Peptidase M
Xylose Isomerase Domain-Containing Protein
degT Pleiotropic regulatory protein
Oxidoreductase Domain Protein
trpC Indole-3-glycerol phosphate synthase
solR Transcriptional activator protein solR
rhtB Homoserine/homoserine lactone efflux protein
Key gene unique to Pseudomonas causing gray (and blue) color defects
This reaction requires 3 oxygens!!
Could this be the future
• Auditor conducts audit of supplier facility X; collects 5 samples of ingredient (e.g., pepper), which are subsequently characterized by metagenomic analysis
• Subsequently, metagenomic analysis is conducted, at a risk-based frequency, of lots received at customer
• Lots that show “substantial” deviation will trigger further analyses (and possibly other actions?)


Outline
• Why are we here?
• Background on tools: from PFGE to WGS
• Case studies on WGS use for outbreak and in-plant environmental investigations
• Metagenomcis
• Other WGS and NGS applications in dairy

Improved characterization of foodborne pathogens
• WGS data will replace a suite of previous tests as WGS can be used to predict:
– Serotype
– Antimicrobial resistance
– Presence of gene that will allow organisms to cause disease
• Impact includes more rapid identification of unusual and difficult to identify bacteria

Consequences of unreliable differentiation between pathogens and non-pathogens can
be costly
• Suspected botulism-causing bacteria identified in whey products
• ~1,000 tones of products recalled in 7 countries
• No disease cases
• Detailed strain characterization confirmed species misclassification


Standard genetic differentiation among B. cereus group species is not reliable
Miller et al., 2016


Challenges – a few examples


Take home messages
• WGS and other genomics tools will be and already are “game changers” in many areas of microbial food safety and quality, including– Detection of more and smaller foodborne disease outbreaks– Better identification of pathogen and microbial persistence (and “unhygienic
conditions”)– More rapid detection of new pathogens– Improved characterization of (potential) foodborne pathogen isolates – Metagenomics approaches for QA, fraud detection, identification of spoilage root
causes etc.
• WGS and other genomics tools are not magic bullets– There will be a continued need for (good) epidemiology to identify outbreak sources
• Also tremendous need for understanding of potentially complex contemporary supply chains

Concluding thoughts on (industry) needs
• Have access to expertise in WGS and metagenomics– Need to have experts that understand the biology
• Assess your vulnerabilities• Be prepared to see more outbreaks traced back to source
– raw meat– Salmonella Enteritidis
• Make sure you have the data to keep recalls small• We need some sort of safe harbor that will encourage industry
use of WGS


Slides for detailed presentations

Analysis of genome wide SNPs (wgSNPs)
• Identifies all high confidence SNPs over whole genome (approx. 3 to 5 million nucleotides)

Whole genome multilocus sequence typing (wgMLST)
• Allows for simpler analysis and clear naming of subtypes
• Performs comparison on a gene by gene level
Isolate A Isolate B Isolate C
Gene 1 1 1 1
Gene 2 8 8 12
Gene 3 5 5 2
Etc.
Gene 1,005 4 4 4
wgMLST type A A B
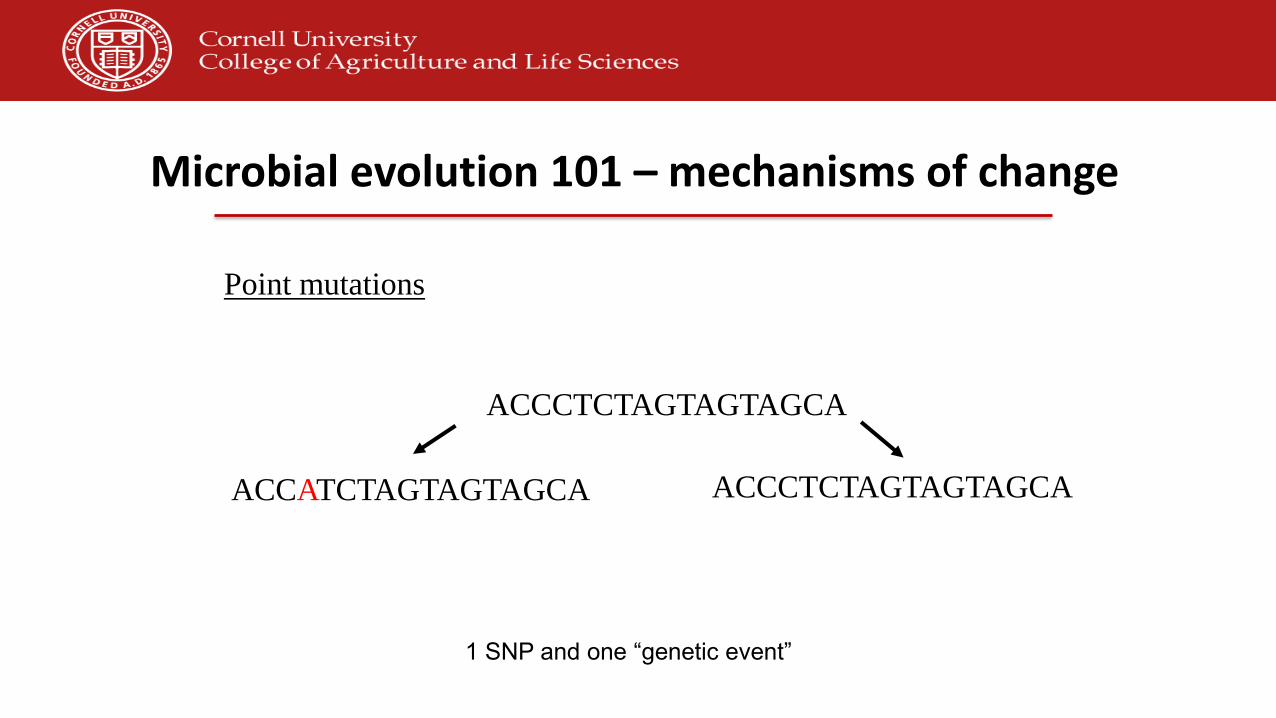
Microbial evolution 101 – mechanisms of change
ACCCTCTAGTAGTAGCA
ACCCTCTAGTAGTAGCAACCATCTAGTAGTAGCA
Point mutations
1 SNP and one “genetic event”

Microbial evolution 101 – mechanisms of change
ACCCTCTAGTAGTAGCA
ACCCTCTAGTAGTAGTAGCAACCATCTAG . . . TAGCA
Insertion or deletion (“indel”)
3 differences (?) and one “genetic event”

Microbial evolution 101 – mechanisms of change
ACCCTCTAGTACTAGCATCC
Horizontal gene transfer of homologous gene sequences
TCCCTCTTGTCCTACCATCA
ACCCTCTTGTCCTACCATCC
CTTGTCCTACCA
ACCCTCTAGTACTAGCATCCCTTGTCCTACCA Alignment:
ACCCTCTAGTACTAGCATCC
ACCCTCTTGTCCTACCATCC
3 SNPs and 1 genetic event

What is a SNP?
Single Nucleotide Polymorphism (SNP)
ATGTTCCTC sequence
ATGTTGCTC reference
*phylogentically informative differences
Insertion or Deletion (Indel)
ATGTTCCCTC sequence
ATGTTC-CTC reference
*differences not used in high quality SNP (hqSNP) analysis
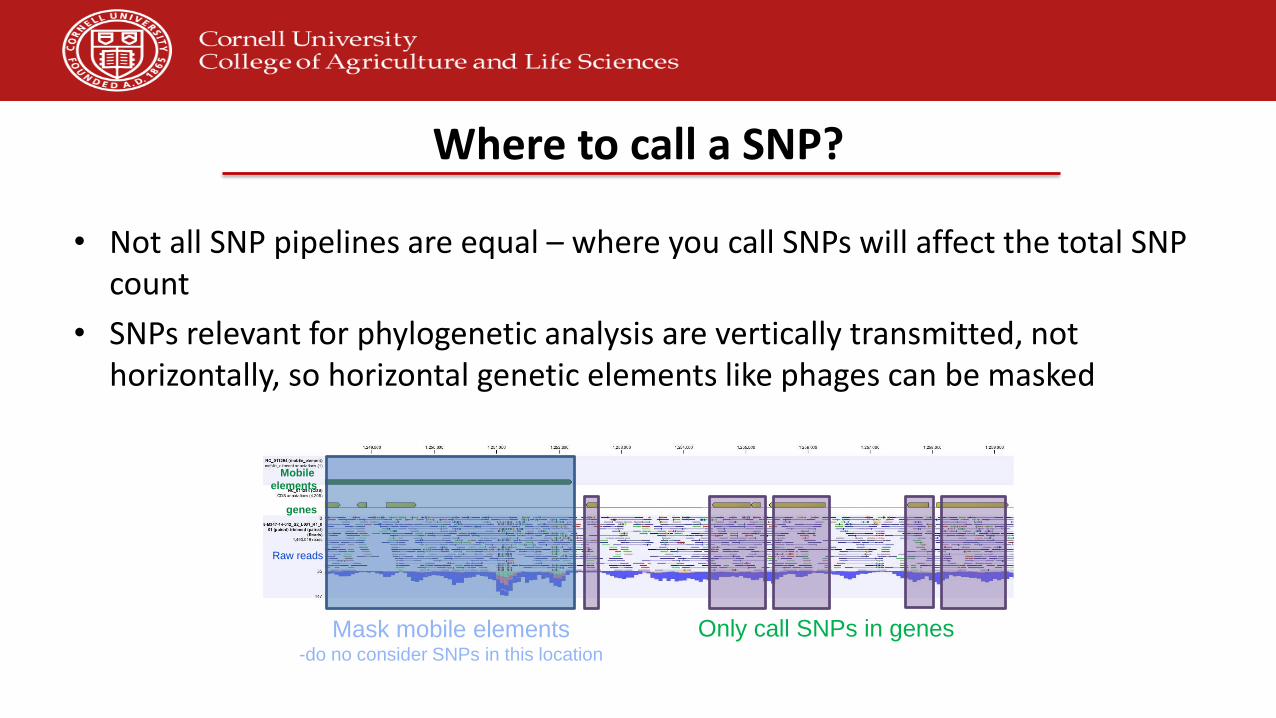
Where to call a SNP?
• Not all SNP pipelines are equal – where you call SNPs will affect the total SNP count
• SNPs relevant for phylogenetic analysis are vertically transmitted, not horizontally, so horizontal genetic elements like phages can be masked
Mask mobile elements-do no consider SNPs in this location
Mobile
elements
genes
Only call SNPs in genes
Raw reads

SNP data analysis: overview
Isolate 1 AACATGCAGACTGACGATTCGACGTAGGCTAGACGTTGACTG
Isolate 2 AACATGCAGACTGACGATTCGTCGTAGGCTAGACGTTGACTG
Isolate 3 AACATGCAGACTGACGATTCGACGTAGGCTAGACGTTGACTG
Isolate 4 AACATGCATACTGACGATTCGTCGAAGGCTAGACGTTGACTG
1
3
2
4
1 2 3 4
1 0
2 1 0
3 0 1 0
4 3 2 3 0