genomic views of the immune system - staudt lab home - national
TRANSCRIPT
Annu. Rev. Immunol. 2000. 18:829–859Copyright q 2000 by Annual Reviews. All rights reserved
0732–0582/00/0410–0829$14.00 829
GENOMIC VIEWS OF THE IMMUNE SYSTEM*
Louis M. Staudt1 and Patrick O. Brown2
1Metabolism Branch, Division of Clinical Sciences, National Cancer Institute, NationalInstitutes of Health, Bethesda, Maryland; e-mail: [email protected]. of Biochemistry and Howard Hughes Medical Institute, Stanford UniversitySchool of Medicine; e-mail: [email protected]
Key Words genomics, microarray, gene expression
Abstract Genomic-scale experimentation aims to view biological processes asa whole, yet with molecular precision. Using massively parallel DNA microarraytechnology, the mRNA expression of tens of thousands of genes can be measuredsimultaneously. Mathematical distillation of this flood of gene expression data revealsa deep molecular and biological logic underlying gene expression programs duringcellular differentiation and activation. Genes that encode components of the samemulti-subunit protein complex are often coordinately regulated. Coordinate regulationis also observed among genes whose products function in a common differentiationprogram or in the same physiological response pathway. Recent application of geneexpression profiling to the immune system has shown that lymphocyte differentiationand activation are accompanied by changes of hundreds of genes in parallel. Thedatabases of gene expression emerging from these studies of normal immuneresponses will be used to interpret the pathological changes in gene expression thataccompany autoimmunity, immune deficiencies, and cancers of immune cells.
INTRODUCTION
The established, model-driven field of immunology is about to collide with theupstart, discovery-driven field of genomics. Traditional research in molecularbiology and molecular immunology can be likened to trying to understand amovie by successively examining a few pixels (genes) at a time from each frame.Genomic approaches allow the scientist to view the entire movie in one sittingand discover complex interrelationships among the plot, characters, and recurringthemes. The tension between genomic approaches and the more traditional singlegene orientation of molecular biology often leads to criticism of genomicapproaches as non-hypothesis-driven. Those who favor a genomic approachembrace this characterization, noting that genomic approaches are deliberatelynot hypothesis-limited and are instead discovery-driven. When the powerful
*The US government has the right to retain a nonexclusive, royalty-free license in and toany copyright covering this paper.

830 STAUDT n BROWN
molecular tools of genomics are applied to a new biological question, discoverieswill almost certainly be made that will generate new hypotheses and necessitatea reworking of existing models.
The field of immunology is especially primed to receive the new insights thatgenomics can provide. Numerous immune cell types have been defined with highprecision, and methods to culture and manipulate these cells are well developed.Such experimental systems are ideal settings in which to study genome-widephenomena under very well controlled circumstances. Powerful techniques forthe analysis of single gene mutations in lymphocytes have been developed in themouse, yielding a plethora of precise genetic models that are ideal substrates forgenomic approaches. Finally, malfunctions of the immune system give rise to ahost of autoimmune diseases, immune deficiency diseases, and malignancies inneed of fresh insights that may be supplied by genomic views of the pathologicalprocesses.
The young field of genomics has already been somewhat arbitrarily subdividedinto two separate disciplines. One branch of genomics, structural genomics, hasas its immediate goal to determine complete genomic DNA sequences of themajor model organisms. To date, the complete genomes of the yeast Saccharo-myces cerevisiae (1), the worm Caenorhabditis elegans (2), and numerous pro-karyotes have been sequenced (3). The complete genomes of these simpleorganisms have yielded a plethora of orthologues of human and mouse genes.New insights into the function of these evolutionarily conserved gene familiesare thus made possible using the more tractable genetics of these modelorganisms.
Much of this review focuses, however, on the newly coined field of functionalgenomics. Broadly construed, functional genomics encompasses any experimen-tal approach that uses genomic structural information to view and understandbiological processes in a systematic and comprehensive fashion. This vast frontier,opened up by the genome sequencing projects, is just beginning to be explored.Even at this early stage, a diversity of approaches have been developed for explor-ing the living genome. In this review, however, we focus primarily on one ofthem: the genome-wide analysis of mRNA expression using DNA microarrays.Because of the central role played by regulation of mRNA levels in developmentand physiology and because of the deep, logical connection between the functionof a gene’s product and its pattern of expression, this specific area of functionalgenomics research has been the richest source of new biological insights. One ofthe defining characteristics of functional genomic approaches is that they generatedata streams that overwhelm the traditional analytical methods of biology andindeed make possible entirely new ways of looking at living systems. Throughoutthis review, we discuss how the field of bioinformatics has faced the challengeof organizing, distilling, and visualizing the information provided by genomicdata in ways that allow biological insights to be found.
The field of genomics naturally intersects with classical genetics in the studyof complex genetic diseases. In polygenic disorders, the contribution of any one

GENOMIC VIEWS OF THE IMMUNE SYSTEM 831
locus to the disease phenotype is small and may be apparent only in the contextof specific alleles in other genes. The current race to define allelic variants ofgenes in human populations is largely fueled by the desire to understand theircontribution to differential disease susceptibility. Millions of single nucleotidepolymorphisms exist in the human population, and recognizing the linkage orassociation of a single polymorphism with a disease state is a considerable chal-lenge (4). Techniques in functional genomics provide information that can com-plement linkage and association methods in making the connection between genesand disease risks. For virtually every gene, variation in its expression, as a func-tion of cell specialization, physiology, or disease, is much richer than allelic vari-ation in that gene. Because the pattern in which each gene is expressed is soclosely connected to the biological role and effects of its product, systematicstudies of variation in gene expression can provide an alternative approach tolinking specific genes with specific diseases and to recognizing heritable variationin genes important for immune function. For example, allelic differences in theregulatory regions of cytokine genes may influence the expression levels of cyto-kines during particular immune responses. An appreciation for such quantitativetraits in the immune system may help unravel the genetics of autoimmune diseasesand lymphoproliferative disorders.
STRUCTURAL GENOMICS AND THE IMMUNE SYSTEM
Systematic studies of genomic expression programs are best pursued in two inde-pendent steps. The first step is to obtain as complete a catalog as possible of allthe expressed genes in the genome. The second step is to use parallel methods,such as DNA microarray hybridization, to measure the expression of each genein the genome over the range of conditions and cell types under investigation.Our still incomplete knowledge of the human and mouse genomic sequence andthe incomplete catalog of genes in these genomes present an important challengein functional exploration of mammalian genomes. Even when a full mammaliangenomic sequence is known, it will not immediately be possible to identify all ofthe segments that are expressed as mRNA. Computer algorithms such as GRAIL(5) use machine learning techniques to identify putative coding regions ingenomic sequences. In practice, however, these algorithms need to be supple-mented by cDNA sequence data to completely annotate the exon-intron structureof a mammalian genome. Indeed, even in microbial genomes with few or nointrons and much higher densities of transcribed and protein-coding sequencesthan are found in mammalian genomes, current algorithms for identifying genesin genomic sequences have significant false positive and false negative rates.Therefore, an indispensable component of any mammalian genome project ishigh-throughput, single-pass sequencing of cDNA libraries to generate expressedsequence tags (ESTs) (6), which provides a systematic set of unique labels foridentifying the mRNAs that can be expressed from a genome. The current release

832 STAUDT n BROWN
of the EST database dbEST [release 070999 (7)] contains 1,476,380 human ESTsand 658,511 mouse ESTs. These numbers are much larger than the numbers ofdistinct transcripts represented in each set because a very large fraction of theESTs in each set is composed of multiple representations of mRNAs that arewidely or highly expressed in the cells from which the source libraries wereobtained. Indeed, despite these large numbers, it is clear that that not all of thehuman genes are represented by an EST in this public database. To illustrate thisdeficiency, consider the representation of interleukin sequences in the dbEST.ESTs representing about half of the known human interleukins can be found inthis database, but no ESTs representing interleukins 2, 3, 5, 9, 11, 12 beta, 14,and 17 have yet been encountered. By contrast, of the 8963 known human geneswith full-length cDNA sequences, 89% are represented by an EST in the dbESTdatabase. This discrepancy reflects the bias in the dbEST database toward genesthat are widely or highly expressed and the fact that very few of the ESTsequences in the public domain have come from cDNA libraries made from acti-vated cells of the immune system. Given this example from the immune system,one wonders how many inducible genes in other specialized or rare cell typeshave yet to be identified.
For the present, filling the gaps in our catalog of human expressed genes is apractical problem for which simple, though technically challenging, incrementalsolutions can often be found. Several years ago, the public EST database wasstrikingly deficient in sequences from B lymphocytes. This void was a seriousimpediment not only to the study of normal B cell development and physiologybut also to the study of human lymphoid malignancies, the majority of which arederived from B cells. In order to fill this void, several libraries were created fromnormal and malignant human B cells and sequenced under the auspices of theCancer Genome Anatomy Project (8, 9). As shown in Table 1, each of thesecDNA libraries yielded a large number of novel ESTs, ranging from 12% to 22%of the total ESTs sequenced, most presumably representing genes never previ-ously identified or studied. In part, this apparent high rate of gene discovery canbe attributed to the paucity of previous EST sequences from B cell libraries andto the normalization process used in creating the NCI_CGAP_GCB1 library (10).Among the non-unique ESTs, some represented genes that were observed onlyin B cell libraries or only in other lymphoid libraries (Table 1). This exampleillustrates the challenge that will be faced in trying to discover the complete setof expressed human genes, including all the genes expressed at low levels or inhighly specialized cells or conditions.
The Unigene project at the National Center for Biotechnology Information hasattempted to provide a systematic classification of EST sequences (11). Unigeneuses sequence alignment methods to group overlapping cDNA sequences intoclusters, each of which provisionally corresponds to a unique gene. The Unigeneanalysis of the B cell library ESTs also reveals a high rate of gene discovery:1652 of the 83,240 Unigene clusters at the time of this writing are defined onlyby ESTs derived from B cells. Viewed in another way, approximately 10% of the
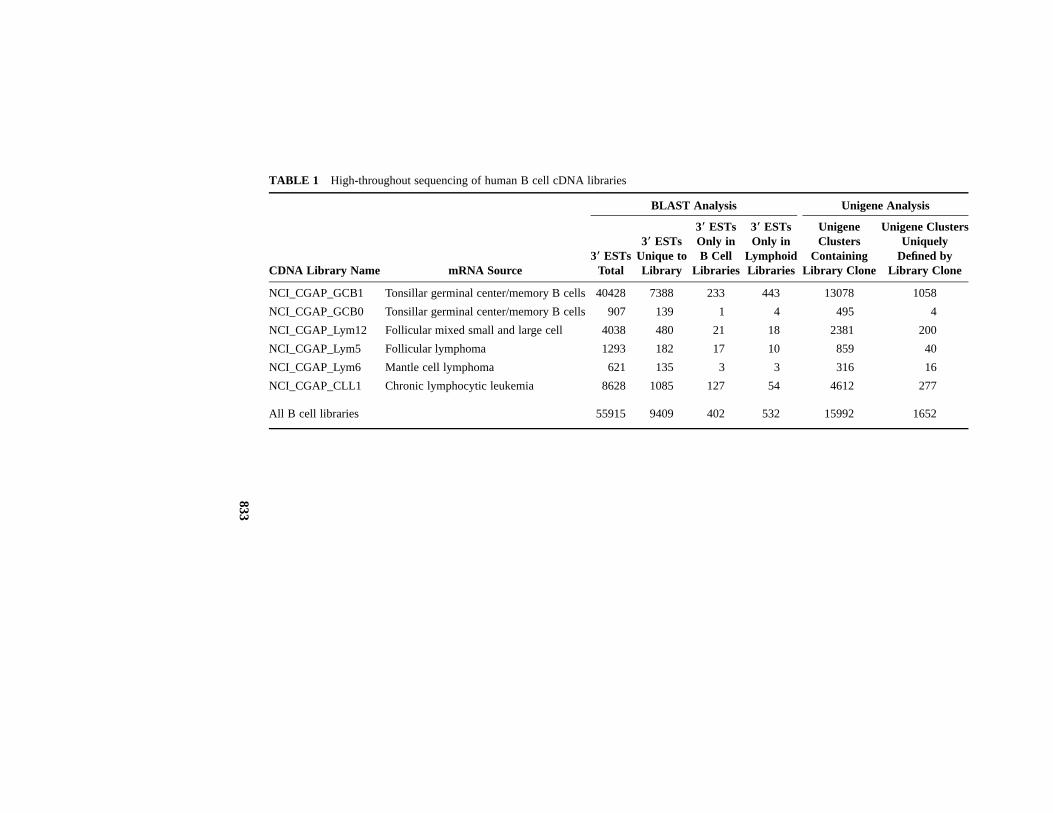
TABLE 1 High-throughout sequencing of human B cell cDNA libraries
BLAST Analysis Unigene Analysis
CDNA Library Name mRNA Source3* ESTs
Total
3* ESTsUnique toLibrary
3* ESTsOnly inB Cell
Libraries
3* ESTsOnly in
LymphoidLibraries
UnigeneClusters
ContainingLibrary Clone
Unigene ClustersUniquely
Defined byLibrary Clone
NCI_CGAP_GCB1 Tonsillar germinal center/memory B cells 40428 7388 233 443 13078 1058
NCI_CGAP_GCB0 Tonsillar germinal center/memory B cells 907 139 1 4 495 4
NCI_CGAP_Lym12 Follicular mixed small and large cell 4038 480 21 18 2381 200
NCI_CGAP_Lym5 Follicular lymphoma 1293 182 17 10 859 40
NCI_CGAP_Lym6 Mantle cell lymphoma 621 135 3 3 316 16
NCI_CGAP_CLL1 Chronic lymphocytic leukemia 8628 1085 127 54 4612 277
All B cell libraries 55915 9409 402 532 15992 1652
833

834 STAUDT n BROWN
genes (Unigene clusters) that were sampled during the sequencing of B cell librar-ies were B cell–restricted. This result dramatically demonstrates our relative igno-rance of the molecular biology of B lymphocytes and the need for systematic,genomic approaches to determine the expression patterns and functions of thesenovel genes in immune responses and other physiological processes.
GENOMIC-SCALE ANALYSIS OF GENE EXPRESSION
Although posttranscriptional mechanisms are important in regulating the expres-sion of many genes, most cellular regulation is achieved by changes in mRNAlevels. Consequently, systematic studies of gene expression patterns have provento be remarkably powerful sources of insight into gene function and biologicalprocesses. Four aspects of genome-wide gene expression analysis are particularlyappealing. First is its feasibility: DNA microarrays make it easy to measure, in asingle hybridization, the mRNA abundance of every gene for which either a cloneor sufficient DNA sequence information exists. Second, there is a biologicallyrational connection between the function of a gene product and its expressionpattern. Natural selection has acted to optimize simultaneously the functionalproperties of the product encoded by a gene and the program that dictates where,when, and in what amounts the product is made. As a rule, each gene is expressedin the specific cells and under the specific conditions in which its product makesa contribution to fitness. The richness and precision with which mRNA levelscan be controlled is such that virtually every gene in the yeast genome can bedistinguished from every other gene based on its pattern of expression. Therefore,even subtle variations in the expression patterns of genes can be related to cor-responding differences in the functions of the products they encode. Third, pro-moters and the regulatory systems that act upon them function as transducers,integrating diverse kinds of information about the identity, environment, andinternal state of a cell. Thus, a diversity of information that is difficult or impos-sible to measure is transformed into a signal that can readily be measured system-atically using DNA microarrays. Learning to decode this transduced informationis one of the immediate priorities of functional genomics. Finally, the set of genesexpressed in a cell determines how the cell is built, what biochemical and regu-latory systems are operative, and what it can and cannot do. Thus, as we learn toinfer the biological consequences of gene expression patterns, using our growingknowledge of the functions of individual genes, we can use microarrays as micro-scopes to see a comprehensive, dynamic molecular picture of the living cell.
Several methods have been developed over the last several years to quantitatethe mRNA expression of thousands of genes in parallel. One method, termedserial analysis of gene expression (SAGE), relies on high-throughput sequencingof 14-bp, gene-specific cDNA tags to enumerate the expression of individualgenes in a cell (12). Because of its reliance on DNA sequencing, SAGE canidentify novel transcripts that have not been observed in other high-throughput

GENOMIC VIEWS OF THE IMMUNE SYSTEM 835
sequencing projects. On the other hand, it is difficult to analyze large numbers ofsamples, or to measure changes in the abundance of rare transcripts, using SAGE,and thus this method is most suited to binary questions in which the transcriptionalresponse to a particular cellular stimulus or to a single transcription factor isassessed. Within the immune system, SAGE has recently been used to analyzegene expression in mast cells before and after stimulation through the high-affinityIgE receptor (13). An interesting and unanticipated finding was the expression inresting mast cells of macrophage inhibition factor (MIF), a cytokine that waspreviously known to be constituitively expressed only in macrophages and ante-rior pituitary cells. MIF is an important mediator of delayed-type hypersensitivity(DTH) reactions, and this observation suggests an important role for mast cellsin some forms of DTH. Despite extensive prior study of cytokine production bymast cells, the expression of MIF had not been reported, pointing to the value ofunbiased, genome-wide gene expression surveys.
In the other common methods of genomic expression analysis, DNA fragmentsderived from individual genes are placed in an ordered array on a solid support.These arrays are then hybridized with radioactive or fluorescent cDNA probesprepared from total cellular mRNA by reverse transcription. Following washing,the hybridization of the cDNA probes to each array element is quantitated usingeither a phosphorimager for radioactive probes or a scanning confocal microscopefor fluorescent probes. Three styles of arrays are used most commonly. Nitrocel-lulose filter arrays are prepared by robotic spotting of purified DNA fragmentsor lysates of bacteria containing cDNA clones, and the filter arrays are hybridizedwith radioactive cDNA probes (14–17). Oligonucleotide arrays can be producedby in situ oligonucleotide synthesis in conjunction with photolithographic mask-ing techniques and are hybridized with fluorescent cDNA probes (18–22).Thesetwo array formats are typically hybridized with a single cDNA probe at a time.In order to compare the mRNA expression profiles of two samples, therefore, twoprobes are generated and hybridized to separate arrays. The relative hybridizationof the two probes to each array element is determined indirectly by mathematicalnormalization of the two data sets. A third type of microarray is fabricated byrobotic spotting of PCR fragments from cDNA clones onto glass microscopeslides (23–29). These cDNA microarrays are simultaneously hybridized with twofluorescent cDNA probes, each labeled with a different fluorescent dye (typicallyCy3 or Cy5). In this format, therefore, the relative mRNA expression in twosamples is directly compared for each gene on the microarray (Figure 1A, seecolor insert). For a given gene, the fluorescence ratio corresponds well with moreconventional measures of relative gene expression including Northern blothybridization and quantitative RT-PCR (23, 29, 30). Scanning and interpretinglarge bodies of relative gene expression data is a formidable task, which is greatlyfacilitated by algorithms designed to organize the results in ways that highlightsystematic features and by visualization tools that represent the differentialexpression of each gene as varying intensities and hues of color (Figure 1B, seecolor insert) (31).

836 STAUDT n BROWN
Mathematical Analysis of Gene Expression Data
The ability to produce large systematic sets of measurements of gene expressionon a genomic scale using DNA microarrays is becoming commonplace. A singlegroup, in a year, can print several thousand microarrays with a single microar-raying robot and can produce tens of millions of individual measurements of geneexpression. The mathematical analysis of the resulting data is a rapidly evolvingscience that is nevertheless based on a rich mathematics of pattern recognitiondeveloped in other contexts (32). Typical goals of these analyses are to identifygroups of genes that are coregulated within a biological system, to recognize andinterpret similarities between biological samples on the basis of similarities ingene expression patterns, and to recognize features of gene expression patternsthat can be related to distinct biological processes or phenotypes. In other words,the biologist wishes to identify systematic features in the data that can be under-stood as a molecular picture of a biological system.
The expression pattern for each gene on an array across n experimental samplescan be represented by a point in n-dimensional space, with each coordinate spec-ified by an expression measurement in one of the n samples. In order to determinethe proximity of points in this gene expression space (a measure of the similarityin the expression patterns of the corresponding genes), one must first define ametric that quantitates the distance between any two of these points. In the clus-tering algorithms that have been implemented thus far, the most commonly usedmetric is essentially the standard correlation coefficient of the two data vectors(31). Although there are other possible ways of measuring distance in geneexpression space, this metric is well suited to gene expression data because itcorresponds well to the intuitive idea of coordinate regulation of two genes (31).
The second step in the mathematical treatment of array data is to apply one ofmany clustering algorithms that use the distance metrics to find clusters of genesin this n-dimensional space, corresponding to genes with similar patterns of vari-ation in expression over a series of experiments. The clustering methods that havebeen applied to array data thus far are hierarchical clustering (31), self-organizingmaps (SOMs) (33), k-means (34), and deterministic annealing (35). Each of thesealgorithms easily captures the main biological features within data sets. For exam-ple, hierarchical clustering, SOMs, and k-means algorithms have all been appliedto cell cycle data in yeast and have each revealed several broad classes of cellcycle–regulated genes (33, 34, 36). Nonetheless, the differences in the variousalgorithms produce views of the data that differ in detail with respect to theassignment of genes or samples to particular clusters. There is no ideal approachto the problem that these clustering methods address, namely the projection of avery high dimensional body of data to a lower-dimensional space (often just aone-dimensional ordered list). A reasonable approach, therefore, is to use a varietyof different algorithms, each emphasizing distinct orderly features of the data, inorder to glean the maximal biological insight.

GENOMIC VIEWS OF THE IMMUNE SYSTEM 837
Figure 2 (see color insert) presents a simple example of hierarchical clusteringapplied to data from T cell and fibroblast activation experiments (30, 37). Hier-archical clustering begins by determining the gene expression correlation coef-ficients for each pair of the n genes studied. The two genes with the mostcorrelated expression across all of the samples are fused into a node that is sub-sequently represented by the average expression of the two genes. This clusteringprocess is then repeated on the n11 genes/nodes that remain. After n11 itera-tions, all genes are incorporated into a dendrogram that connects each of the nodesgenerated during the clustering (Figure 2, see color insert). The length of eachfork in the dendrogram is inversely proportional to the similarity of the two nodesor genes that it connects. The data in Figure 2 are taken from one experimentwith human peripheral blood T cells activated by phytohemagglutinin (PHA) andphorbol-myristoyl-acetate (PMA) and another experiment with human serum-starved fibroblasts activated by readdition of serum. In both experiments, the cellswere initially in the G0 stage of the cell cycle and synchronously entered G1 andS phase following stimulation. Each experiment used microarrays containing thesame set of 9000 human cDNAs to monitor changes in gene expression over time,comparing mRNA from each stimulated culture with mRNA from resting cells.Figure 2 (see color insert) shows data from a subset of the induced and repressedgenes, presented at the left in an unclustered form and, at the right, arranged byhierarchical clustering to reveal coordinately expressed genes.
In this example, the clustering algorithm identified three broad clusters thatcontain genes activated (a) in T cells only, (b) in both T cells and fibroblasts, or(c) in fibroblasts only. The genes upregulated in both T cells and fibroblastsinclude c-myc, a gene known to be important for progression from G0 to S phase,and genes involved in energy metabolism, presumably reflecting the increasedenergy requirements of activated cells. Within the T cell–specific cluster are thechemokines MIP-1-alpha and MIP-1-beta, which are known to be coordinatelyregulated during T cell activation and are important for recruitment of monocytesto regions of immune activation. Interestingly, the aryl-hydrocarbon receptor, themolecular target of dioxin, is specifically induced during T cell activation, perhapsaccounting for the ability of dioxin to induce apoptosis in activated, but notresting, mouse T cells (38). The SH2- and SH3-containing protein SLAP (src-like adapter protein) was preferentially induced in T cells. This is noteworthybecause SLAP has recently been shown to inhibit cell cycle progression in fibro-blasts (39). These microarray data may thus have revealed an unsuspected dif-ferential function of SLAP in T cell and fibroblast mitogenesis. Notable amongthe genes induced preferentially in fibroblasts are basic fibroblast growth factor(basic FGF) and vascular endothelial growth factor (VEGF), both of which areinvolved in a wound healing response (see below) (30). In addition to these threebroad gene expression clusters, there is biologically important fine structure. Forexample, c-fos, jun B, and MAP kinase phosphatase were all downregulated inlate T cell activation, whereas they were induced during the serum response offibroblasts. The above example highlights several general principles that can

838 STAUDT n BROWN
emerge from clustering of gene expression data. As described in the followingsection, studies of global gene expression patterns in yeast have shown that geneswith related biological roles are often tightly coregulated (28, 31, 36, 40, 41). Acorollary is that novel genes of unknown function that are clustered with a largegroup of functionally related genes are likely to participate in the same biologicalprocess. In this light, it is interesting to note that several novel genes were selec-tively induced in T cells rather than fibroblasts (Figure 2, see color insert). Clusteranalysis provides a systematic way to focus attention on subsets of the novelgenes represented in a survey of gene expression patterns that warrant furtherinvestigation in relation to specific biological processes. Finally, Figure 2 dem-onstrates the usefulness of systematic databases of gene expression measurementsthat allow fresh biological insights to be made by juxtaposing and comparing datasets from disparate biological systems.
Genomic-Scale Gene Expression Analysis in Model Systems
Whole Genome Gene Expression Analysis in Yeast The most extensive andsystematic studies of global gene expression patterns to date have been carriedout in Saccharomyces cerevisiae. The yeast genome was the first genome of afree-living organism to be completely sequenced, and it has thus been the firstmodel used for development of many functional genomic approaches that cannow be applied to mammalian genomes. Over the past three years, several groupshave reported studies of genome-wide patterns of gene expression in response tophysiological stimuli, drugs, developmental programs or specific mutations inyeast (28, 36, 40, 42–45).
Each such study has provided a wealth of new information and insight into aspecific process: the switch from glycolysis to respiration, progression throughthe cell division cycle, the program of gametogenesis and spore formation, andthe targets of specific and global transcriptional regulators. Trivially, these studiesprovide comprehensive catalogs of the genes whose expression varies in eachspecific process or in response to each specific perturbation, and the studies definethe temporal pattern of each gene’s response. But the systematic nature of theseobservations, involving comprehensive, quantitative measurements of variationin each transcript from the yeast genome, makes it possible to view the entire setof data as one large and expanding survey of the expression program of the yeastgenome. A new and remarkably useful kind of gene expression map emergesfrom this approach. In contrast to conventional genetic maps based on the physicalorder of genes in the genome, gene expression maps derive their order from thelogic underlying the expression program of a genome.
Gene expression maps are constructed by first organizing the gene expressiondata using any of the various clustering algorithms outlined above. The orderedtables of data are then displayed graphically in a way that allows biologists toassimilate the choreography of gene expression on a broad scale as well as thefine distinctions in expression of individual genes. The large panel on the left of
GENOMIC VIEWS OF THE IMMUNE SYSTEM 839
Figure 3 (see color insert) shows one example of such a map: Each row representsthe expression pattern of one of the 6220 known or predicted genes of yeast, andeach column represents the results of one of 204 genome-wide microarray geneexpression experiments. The expression measurements in this figure were derivedfrom yeast that were placed under 28 distinct physiological or nutritional condi-tions and assayed multiply over time. For this map, the hierarchical clusteringstrategy was used to group genes on the basis of similarity in gene expressionpatterns (31). It is worth noting that this set of over one million measurements ofgene expression represents considerably less than 10% of the genome-wideexpression data that has been collected over the past two years for this oneorganism.
A simple evolutionary logic emerges from an analysis of yeast gene expressionmaps: Genes with similar expression patterns under a particular set of conditionsencode protein products that play related roles in the physiological adaptation tothose conditions. The extent and precision with which this simple organizingprinciple determines the geography represented in this map of the genome isunexpected and remarkable (31, 41). Genes encoding products that invariablyfunction together in a stoichiometric complex are virtually always among the mosthighly coregulated groups in the genome. For example, the vertical bar at theupper right of this map (Figure 3) marks the position of a cluster comprisingabout 2% of the genes in the yeast genome, including, almost exclusively, all thegenes that encode ribosomal proteins. Similar coregulated clusters identify thehistones, the subunits of the proteosome, and subunits of numerous other multi-meric enzymes (31, 41). Genes whose products work together in a metabolicpathway or a discrete physiological or developmental program are typically lesstightly coregulated than components of stoichiometric complexes, but they aresufficiently similar in their expression patterns to cluster together in this genomicexpression map. Expanded views of two such clusters are shown at the right ofFigure 3 (see color insert): One cluster is composed of genes encoding compo-nents of the mitochondrial electron transport and ATP synthase complexes(labeled ‘‘respiration’’), and the other is composed of genes that play key rolesin chromosome synapsis and meiotic recombination (labeled ‘‘meiosis’’). Eachcluster includes genes without a presently identified function. The consistent rela-tionship between a gene’s expression pattern and its function, reflected in thismap, provides the basis for imputing functions to these previously uncharacterizedgenes. Indeed, the essential role in sporulation for one of the previously unchar-acterized genes in the sporulation cluster, YPR007C, which is predicted to encodea putative chromosome cohesion protein, was established following its identifi-cation by this cluster analysis method (40). Conversely, each of the conditionsrepresented in this gene expression map (the vertical columns) is characterizedby a unique and recognizable signature in its gene expression pattern. Each celltransduces variation in its environment, internal state, and developmental stateinto readily measured and recognizable variation in gene expression patterns.

840 STAUDT n BROWN
Thus the global pattern of gene expression provides a distinctive and accessiblemolecular picture of the state and identity of biological samples.
The prospects for mapping the regulatory networks that control gene expres-sion programs and connecting them to the corresponding environmental stimuliand the physiological processes that they mediate are already apparent from stud-ies in yeast. These studies have revealed unsuspected complexity in the relation-ships among regulatory proteins and the genes they control and, at the same time,have provided compelling evidence for the experimental tractability of this prob-lem to systematic dissection (28, 36, 40, 43, 45).
Unconventional Pictures of Biological Responses from Genome-Scale GeneExpression Profiles One of the most useful qualities of the systematic charac-terization of gene expression programs is that the results are much less constrainedby preconceived models than traditional, ‘‘hypothesis-limited,’’ experimentalapproaches. A vivid example of this feature was provided by a genome-scalesurvey of gene expression changes during the response of serum-deprived cul-tured human fibroblasts to serum (30). A cDNA microarray representing approx-imately 9000 different human genes was used to measure gene expression changesat 14 time points following the readdition of serum, beginning 15 min after stimu-lation and continuing for 24 h. The experiment was intended to provide newinsights into the transition from the G0 cell cycle state to a proliferating statesince, historically, the serum response of fibroblasts had been viewed as a simplemodel for this transition. However, the proliferation-related changes in geneexpression accounted for only a small fraction of the program of gene expressionthat was observed in this experiment.
The gene expression program of serum-stimulated fibroblasts was far richerthan anticipated and pointed to an important physiological role of fibroblasts inthe wound healing response. Serum, the soluble fraction of clotted blood, is nor-mally encountered by cells in vivo in the context of a wound. Indeed, the expres-sion program that was observed in response to serum suggested that fibroblastsare programmed to interpret the abrupt exposure to serum not as a general mito-genic stimulus but as a specific physiological signal signifying a wound. Numer-ous genes with known roles in processes relevant to wound healing were inducedby the serum stimulus. These included genes involved in the direct role of fibro-blasts in remodeling the clot and the extracellular matrix as well as genes encodingintercellular signaling proteins that promote inflammation, angiogenesis, and re-epithelialization.
Although this study focused exclusively on the fibroblast and was not intendedor expected to address any aspect of immunity, the observed expression programpointed to an important role for fibroblasts in orchestrating the immune responseto a wound. The serum-induced genes encoded proteins that promote chemotaxisand activation of neutrophils, monocytes and macrophages, T lymphocytes andB lymphocytes, thus providing innate and antigen-specific defenses against

GENOMIC VIEWS OF THE IMMUNE SYSTEM 841
wound infection. In addition, the recruitment of phagocytic cells is required toclear out the debris during wound remodeling.
The results, unexpectedly, remind us of the importance of viewing an immuneresponse as a concerted physiological program, involving not only cells normallyregarded as components of the immune system per se but also virtually any cellthat finds itself in a setting where an immune response is called for. The picturepainted by the transcriptional response to serum suggests that the fibroblast is anactive participant in a conversation among the diverse cells that work together inwound repair, interpreting, amplifying, modifying, and broadcasting signals thatcontrol inflammation, angiogenesis, and epithelial regrowth during the responseto an injury. Another implication of this experiment is that fibroblasts, and verylikely many other cells, are programmed to recognize exposure to serum as asignal representing a serious injury. Inclusion of serum in mammalian cell culturemedium has become a common, almost ubiquitous, practice. Yet, this experimentsuggests that trying to study the normal behavior of cells in the presence of serummay be analogous to trying to study normal human behavior in a burning building.
Signal Transduction One of the natural arenas for genomic-scale gene expres-sion analysis in mammalian systems is signal transduction. It is clear from studiesof protein-protein interactions and inducible phosphorylation events that proximalsignaling pathways are considerably interwoven. However, not yet known is theextent to which the downstream transcriptional targets of different signaling path-ways are overlapping or distinct. For one class of target genes, the immediateearly genes, the answer appears to be that disparate signaling pathways convergeon virtually identical immediate early target genes (46). Oligonucleotide microar-rays were used to compare the immediate early gene response (i.e. genes inducedwithin 4 h of stimulation) of fibroblasts to platelet-derived growth factor (PDGF),fibroblast growth factor (FGF), and epidermal growth factor (EGF), all of whichsignal through distinct tyrosine kinase receptors. Out of 5938 genes on the array,66 genes displayed an immediate early response to PDGF. Almost all of thesegenes were also induced by FGF to the same degree as by PDGF. Correspond-ingly, these two growth factors cause a quantitatively similar mitogenic responsein fibroblasts. Although EGF induced many, but not all, of the same immediateearly genes, the magnitude of the induction was quantitatively lower thanobserved with PDGF and FGF. In this experimental system, therefore, the imme-diate early genes behave as a transcriptional ‘‘module’’ that is invoked to a greateror lesser degree by different cellular stimuli. A second important conclusion fromthis study was that none of the tyrosines in the cytoplasmic tail of the PDGFreceptor was absolutely required for any discrete feature of the immediate earlyresponse. This was a surprise because previous work had shown that each tyrosineserves as the docking site for a different signal transduction protein. The resultstherefore suggest that signal transduction networks must be extensively ramifiedproximal to the membrane tyrosine kinase receptors, converging on a commonset of nuclear immediate early responses.

842 STAUDT n BROWN
This is, of course, only one snapshot of the genomic response to membranesignaling events. Since the serum response of fibroblasts induced a stereotypicalset of genes beyond the immediate early time frame, it is quite plausible thatdifferent receptor kinases will cause distinct delayed transcriptional responses(30). The signaling events through other cell surface receptors certainly will leadto receptor-specific transcriptional responses in some cases. Microarray analysisof cytokine responses, for example, reveals both cytokine-specific and generictranscriptional responses (37). This is not surprising given the direct docking ofdistinct STAT family transcription factors to the various cytokine receptors (47).Thus, when membrane signaling events lead more directly to the activation and/or nuclear translocation of transcription factors without invoking extensivelyinterconnected proximal signaling networks, signature transcriptional responsesmay be elicited. Finally, the cell type chosen for signaling experiments will inevi-tably influence the genomic transcriptional response. For example, a microarrayanalysis of PMA-responsive genes in myeloid and lymphoid cell lines revealedsets of induced genes that were cell line–specific as well as genes that were PMA-responsive in all myeloid cell lines but not in Jurkat T cells (33). The develop-mental history of a cell, preserved within heritable chromatin structure or by DNAmethylation, will shape the outcome of signaling, as will the different repertoiresof transcription factors that are available to various cell types.
The direct target genes of transcription factors can be revealed by genomic-scale gene expression analysis, as illustrated by studies of p53 and BRCA1 (48–51). Inducible overexpression of transcription factors is the experimental designthat is currently adopted in most cases. Although valuable, this approach is some-what risky in that artificial overexpression can lead to nonphysiological titrationof protein-protein interactions and binding of transcription factors to inappropriatesites within the genome. Genomic studies of loss-of-function mutants will be animportant goal in this field. Analysis of cells taken from knockout animals willbe helpful, particularly in cases in which the developmental program has not beenovertly altered by the engineered mutation. Large-scale loss-of-function studiesin somatic cells in culture await the development of robust methods of genedisruption or interference.
Genomic-Scale Gene Expression Analysis in the ImmuneSystem
Ultimately, studies of gene expression in the immune system will examine theentire genomic repertoire of genes in each sample investigated. Although thiscomplete repertoire is not yet available, many insights into the gene expressionprograms evoked during immune responses can be made using large DNAmicroarrays that deliberately include many genes known to be expressed inimmune cells. An example of such a specialized subgenomic microarray is theLymphochip, a specialized human cDNA microarray that is enriched for genesrelated to immune function (8). The Lymphochip microarray is composed of

GENOMIC VIEWS OF THE IMMUNE SYSTEM 843
17,853 cDNA clones derived from three sources. The majority of clones (;80%)were derived from the lymphoid cDNA libraries that were subjected to high-throughput EST sequencing (Table 1). The selection of these clones was basedon bioinformatics algorithms that identified ESTs that were either unique orenriched in lymphoid cDNA libraries (8). A second set of Lymphochip cloneswas identified during the course of previous microarray analyses of immuneresponses using first-generation microarrays of ;10,000 human genes (37). Last,a curated collection of 3183 ‘‘named’’ genes that are of known or suspectedimportance to immune function, cell proliferation, apoptosis, or oncogenesis and57 open reading frames from the pathogenic human viruses HIV-1, HTLV-I, EBV,and HHV-6, 7, and 8 were incorporated into the Lymphochip. One of the virtuesof mechanically printed microarrays like the Lymphochip, in this era of contin-uing gene discovery, is that they can be readily upgraded: New genes that arediscovered during further high-throughput sequencing or as a result of directedmolecular biology experiments can be added to new editions of the Lymphochipin days.
The Genomic Expression Program in Lymphocyte Differentiation Systematicexploration of gene expression programs during human lymphocyte developmentand activation is under way. Early work has focused on late-stage B cell differ-entiation, following mature, naive B cells from the resting state through the ger-minal center reaction and into terminal differentiation. The germinal center is aninducible microenvironment formed during an immune response by the concertedaction of antigen-specific B and T cells together with follicular dendritic antigen-presenting cells (FDCs) (52, 53). The germinal center reaction is initiated whenthe surface immunoglobulin receptor on a B cell encounters its cognate antigen,and activated T cells signal the B cell through CD40. FDCs secrete a gradient ofthe chemokine BLC, which signals the activated B cell through the BLR1/CXCR5receptor to migrate toward the FDC (54). Activated T cells also migrate to thenascent germinal center where they continue to interact with germinal center Bcells. The germinal center becomes polarized, with highly proliferative centroblastB cells in the ‘‘dark’’ zone and less proliferative centrocytes in the ‘‘light’’ zone.The process of somatic hypermutation of immunoglobulin genes is initiated incentroblasts, which then migrate to the light zone to become centrocytes. If thehypermutation process has improved, or at least preserved, the ability of the Bcell to bind antigen on the surface of the FDC, the B cell is rescued from pro-grammed cell death. The B cell may then migrate back to the dark zone andcontinue somatic hypermutation or may terminally differentiate into a memory Bcell or plasma cell.
B cells at each of these stages of differentiation were purified from humantonsils or peripheral blood, and their transcript patterns were characterized usingthe Lymphochip microarray (8). As important controls, B cells were activatedpolyclonally in vitro by ligation of the antigen receptor and activation with CD40ligand, with and without IL-4. Additionally, T cells were mitogenically activated

844 STAUDT n BROWN
with phorbol ester and ionomycin. The gene expression profiles shown in Figure4 (see color insert) reveal that germinal center B cells represent a distinct stageof B cell differentiation that activates a broad gene expression program that isnot observed in mitogenically activated peripheral blood B cells. Germinal centerB cells not only express scores of genes that are missing in activated peripheralblood B cells but also lack expression of many genes that are induced during invitro B cell activation. Thus, coligation of undefined B cell surface receptors,together with stimulation through the antigen receptor and CD40, may be neededto generate the germinal center gene expression profile. Indeed, no convincing invitro culture system has yet been developed that is able to induce resting periph-eral B cells to adopt a full germinal center phenotype. The large set of germinalcenter B cell–specific genes discovered by microarray analysis can therefore serveas a yardstick to measure the success of in vitro cultures in mimicking the ger-minal center state.
Mitogenically activated B and T cells shared a common set of activation genes(Figure 4, see color insert), which may reflect the convergence of multiple sig-naling pathways on common nuclear targets (46) and the fact that the cell cyclegene expression program was activated in both cell types. However, mitogenicallyactivated T cells expressed a distinct set of genes not observed in resting T cellsor in activated B cells (not shown). This set of genes includes, of course, variouscytokines such as IL-2 and TNF alpha but also a number of novel genes. Basedon the coordinate expression of these novel genes with cytokines and the lineagespecificity of their expression, they are attractive candidates for functional anal-ysis in the future.
The Relationship of Lymphoid Malignancies to Normal LymphocyteDifferentiation Genomic-scale gene expression profiling is certain to illuminatemany aspects of cancer pathogenesis, cancer diagnosis, and the mechanismsunderlying treatment resistance and susceptibility. Traditionally, studies of muta-tions, amplifications, and deletions in the genomic DNA of cancer cells haverevealed many of the key genetic events that occur during the progression tocancer. Many of these genetic alterations may have acted for many years prior todiagnosis to bypass key checkpoints and allow cell cycle progression. On theother hand, gene expression profiling of cancer cells reflects the molecular phe-notype of the cancer cell at diagnosis. As a consequence, the detailed pictureprovided by the genomic expression pattern may provide the basis for a newsystematic classification of cancers and more accurate predictions of the responsesof a cancer to treatment.
A major determinant of the biological potential of a cancer cell is likely to bethe normal cell from which it was derived. About 90% of human lymphoid malig-nancies are derived from B cells, and each of these malignancies has been pro-visionally assigned to a particular stage of B cell differentiation based on analysisof immunoglobulin gene rearrangement and mutation together with cell surfacephenotyping. However, the extent to which the gene expression program of nor-
GENOMIC VIEWS OF THE IMMUNE SYSTEM 845
mal B cells is retained in the cancer cell is best addressed by genomic-scale geneexpression analysis.
A particular breeding ground for human lymphomas is thought to be the ger-minal center reaction. This notion is based on analysis of rearranged immuno-globulin genes in these malignancies, which often show extensive somatichypermutation (55). Indeed, in two categories of non-Hodgkin’s lymphoma, fol-licular lymphoma and MALT lymphoma, the immunoglobulin sequences from asingle biopsy specimen show evidence of ongoing mutation (56–59). In othermalignancies in which the immunoglobulin sequences are mutated but invariant,the cell of origin could as well be a postgerminal center B cell. Even the presenceof immunoglobulin mutations in a B cell malignancy is not conclusive evidencethat the cell of origin passed through the germinal center microenvironment, sincein some mutant mouse models, somatic hypermutation of immunoglobulin genescan occur in the absence of detectable germinal centers (60).
The most common form of non-Hodgkin’s lymphoma is diffuse large celllymphoma (DLCL), comprising ;40% of all cases. The immunoglobulin genesin DLCL are invariably mutated. Furthermore, a recurrent translocation in thismalignancy involves the BCL-6 gene, a gene also required for normal germinalcenter development (61–63). However, this translocation occurs in only ;32%of DLCLs, thus revealing potential heterogeneity in this diagnostic category. Pat-terns of gene expression in a large number of DLCLs were therefore analyzed,using the Lymphochip microarray, to determine the relationship of this malig-nancy to normal germinal center cells and to investigate the possibility that thisdiagnostic category may harbor more than one disease entity. Figure 5 (see colorinsert) shows the expression of a subset of 60 genes from the Lymphochip in 25different lymph node biopsies of DLCL and in a variety of normal B cell prep-arations. It is evident that the gene expression patterns in DLCLs are strikinglyheterogeneous and that a subset of DLCLs shows a pattern with a strong resem-blance to the pattern seen in normal germinal center B cells. Distinct patterns ofgene expression identify at least two different subtypes in what has previouslybeen considered a single disease. The similarities in gene expression patternsstrongly imply that the cell of origin of one DLCL subtype is the germinal centerB cell, but the origin of the other cases is enigmatic. These cases could be derivedfrom a postgerminal center B cell that had extinguished the germinal center geneexpression program. Alternatively, the oncogenic transforming event(s) may havedisrupted signaling pathways that are critical to maintain the germinal centerphenotype.
Preliminary surveys of other B cell malignancies demonstrate that each diag-nostic category has its own gene expression signature. Gene expression patternsobserved in follicular lymphomas share significant features with the patterns seenin germinal center B cells, whereas the expression patterns in chronic lymphocyticleukemia cells do not resemble those in germinal center cells but instead arereminiscent of resting peripheral blood lymphocytes. Within each of these diag-nostic categories, however, the molecular heterogeneity reflected in the gene

846 STAUDT n BROWN
expression profiles suggests the existence of disease subtypes, as were revealedin DLCL. The stratification of patients according to gene expression signaturescould ultimately contribute to clinical decisions directing the patient to the mostappropriate therapy.
Gene Expression Changes During Immune Responses Oligonucleotide arrayshave been used to discover gene expression correlates of antigen-induced anergyand activation in B lymphocytes (R Glynne, C Goodnow, personal communica-tion). Transgenic animals expressing heavy and light chains for anti-HEL (henegg lysozyme) antibody provide B cells of near monoclonality that can be eitheranergized or activated depending on the method and form of antigen administra-tion (64). Anergic/tolerant B cells are profoundly resistant to subsequent exposureto antigen under activation conditions. B cell anergy involves activation of somebut not all of the signaling pathways that are engaged during lymphocyte acti-vation: NF-AT and erk MAP kinase pathways are activated in tolerant cells,whereas NF-jB and jnk pathways are not (65).
Microarray analysis of gene expression in antigen-stimulated naı̈ve B cellsdemonstrated that 59 genes were significantly induced or repressed after 1 h ofstimulation, whereas more than 300 genes were altered in expression after 6 h (RGlynne, C Goodnow, personal communication). By contrast, only 8 of these geneswere regulated in tolerant B cells. Instead, tolerant B cells displayed a distinctgene expression signature consisting of 20 upregulated genes and 8 downregu-lated genes that were not altered during activation of naı̈ve B cells. Interestingly,pharmacological inhibition of NF-AT by the immunosuppresive drug FK506 wasless efficient than tolerance in blocking B cell activation responses: One third ofthe antigen-induced gene expression changes in naı̈ve B cells were unaffected byFK506.
These findings could have important implications for the discovery of novelimmunosuppresive drugs. An ideal immunosuppressive drug would have all ofthe functional effects of natural tolerance without eliciting the side effects thatlimit the utility of FK506 and cyclosporin in some patients. The gene expressionsignature of tolerant B cells could by used as a surrogate marker in drug screensfor compounds that might mimic the anergic state (R Glynne, C Goodnow, per-sonal communication). Furthermore, if a novel compound in a drug screen inducesgene expression changes not found in tolerant cells, this might signal an unwanted‘‘off-target’’ effect of that compound (42).
T cell responses to antigenic and mitogenic stimulation have also been ana-lyzed by cDNA and oligonucleotide microarray analysis (37) (P Marrack, per-sonal communication). Since T cell activation is a well-trodden path, many of theinduced genes are well known, including some depicted in Figure 2 (see colorinsert). Interestingly, an equal number of genes were repressed as were inducedduring T cell activation, leaving the total diversity of mRNAs roughly equivalentbetween resting and activated cells. Immunologists have evidently spent less

GENOMIC VIEWS OF THE IMMUNE SYSTEM 847
effort investigating the genes that are downregulated during lymphocyte activa-tion because this class contained more novel genes than the upregulated class.
FUNCTIONAL GENOMICS AND THE GENETICS OFCOMPLEX IMMUNOLOGICAL DISEASES
Positional cloning of susceptibility genes for diseases with simple Mendelianinheritance is now routine. However, the majority of medically important geneticdiseases show familial clustering with an indeterminant inheritance pattern. Theheritable risk for these diseases may be determined by many genes, each of whichcan affect relative risk for the disease phenotype. In human autoimmune diseases,a sibling of an affected individual has a relative risk of developing the sameautoimmune disease of 6–100-fold, compared with the prevalence of the diseasewithin the general population (66). The genetics of autoimmune mouse modelshas been particularly illustrative of the complexity of some immune-mediateddiseases. For example, autoimmune diabetes in the NOD mouse may be controlledby 15 genes on 11 chromosomes (66). The genetic complexity of these diseasesis most likely a reflection of their complex pathophysiology. In most autoimmunediseases, the major histocompatibility complex (MHC) plays a dominant role,presumably by dictating which autoantigens can be presented to the immunesystem. Nevertheless, MHC alleles confer a relative disease risk of only 1.3–8.3-fold (66). Other genetic loci may control the breaking of immunological tolerance,the repertoire of autoimmune T and B cells, the expansion of pathogenic CD4,CD8, and/or B lymphocyte subsets, and the skewing of immune responses bycytokines. One approach to such complex diseases is to artificially simplify thegenetics. In the NOD mouse diabetes model, transgenic expression of a singlepathogenic T cell receptor has been used to short-circuit some of the diseasepathogenesis and to reduce the number of disease susceptibility loci to fivegenomic intervals (67). Further breeding of this simplified mouse model to knock-out animals has revealed a role for interferon gamma in the development ofdiabetes (68).
Recent reviews have focused on the ways in which genome-wide applicationof polymorphic markers can identify which genomic intervals may harbor thedisease susceptibility genes (66), and therefore we do not review this genomicarena extensively here. A large number of genome-wide screens in immune-mediated diseases of humans and animals have been conducted (67, 69–94). Inmost cases, however, the genomic interval containing the susceptibility gene hasnot been narrowed to , 1 centiMorgan (;1 2 106 base pairs) by these methods.Interestingly, the susceptibility loci in these various diseases often coincide, sug-gesting that some common genes may influence many autoimmune and inflam-matory diseases (66, 95).

848 STAUDT n BROWN
The molecular definition of specific susceptibility alleles in complex immune-mediated diseases will clearly require new strategies that complement geneticlinkage analysis. One functional genomics strategy that holds promise is the‘‘positional candidate gene’’ approach (reviewed in 96). Having narrowed thesusceptibility interval by linkage analysis, the known genes that map within theinterval can be identified. Since mutation detection is still technically cumbersomeand a 1-centiMorgan susceptibility region could contain 30 or more genes, it maybe helpful to first focus attention on candidate genes with functions that can beplausibly connected to the disease phenotype. One potential identifying charac-teristic of a candidate susceptibility gene would be expression in the cells ortissues presumed to be at fault in the disease. Soon, public databases of geneexpression measurements will make this analysis routine. Even when geneticlinkage has not been performed, the candidate gene approach may quickly revealpotential disease susceptibility loci. For example, the candidate gene approachwas used to examine the genetic differences between chronic granulomatous dis-ease (CGD) patients who differed in susceptibility to immune-mediated compli-cations (97). CGD results from a primary defect in genes for NADPH oxidasethat control superoxide production in phagocytes. CGD patients differ dramati-cally in the frequency with which they develop a variety of chronic complications,including granulomatous diseases of the gastrointestinal and urinary systems aswell as autoimmune and rheumatological disorders. A priori, such differencesmay be due to differences in the mutations present in the 4-NAPDH oxidasesubunit genes found in different patients. Alternatively, polymorphisms in otherdisease-modifying genes could contribute to the risk of immune complications.Foster et al examined polymorphisms in seven candidate genes encoding mye-loperoxidase, mannose binding lectin, TNF alpha, IL-1 receptor antagonist, andthe Fc gamma receptors IIa, IIIa, and IIIb (97). Alleles of myeloperoxidase andFc gamma receptor IIIb were significantly associated with an enhanced risk forgastrointestinal complications. Alleles of myeloperoxidase were associated withincreased risk of autoimmune and rheumatological disorders. Combinations ofspecific alleles of different genes conferred an even greater relative risk forchronic immune-mediated complications. In this relatively rare genetic disease itwould be difficult, if not impossible, to enroll enough patients to conduct a stan-dard linkage analysis of immune complications; thus the candidate gene approachprovides a tractable alternative.
cDNA microarray analysis of gene expression promises to aid significantly inthe search for disease susceptibility loci. One example of this approach comesfrom analysis of the spontaneously hypertensive SHR rat, which is a model forhuman diabetes, hyperlipidemia, obesity, and hypertension (98). Genetic linkageanalysis of this disorder had focused attention on an interval from rat chromosome4, but the causative gene had not been identified. cDNA microarrays were usedto compare gene expression in adipose tissue from the SHR strain and control,nonhypertensive rat strains. SHR cDNA probes hybridized poorly to a microarrayspot representing CD36, a gene that maps to regions of mouse and human chro-

GENOMIC VIEWS OF THE IMMUNE SYSTEM 849
mosomes that are syntenic to rat chromosome 4. This microarray findingprompted a further analysis of the CD36 gene, which revealed multiple codingregion mutations in the CD36 gene of SHR rats. CD36 is a fatty acid receptorand transporter whose overexpression in transgenic mice or deletion by genedisruption in mice leads to alterations in blood lipid levels (98, 99); thus it is astrong candidate gene for the hyperlipidemic quantitative trait in SHR rats. Theapparently diminished expression of CD36 in SHR rats, detected by cDNAmicroarray hybridization, was traced to a genomic deletion in this strain withinthe CD36 38 untranslated region, the only region of the CD36 gene representedon the array.
Although this may appear to be an exceptional case, in that the genetic lesionin this example directly affected the ability to measure the expression of the gene,it is likely that many disease-causing mutations will be found to affect transcriptlevels. Nonsense mutations and mutations that disrupt normal splicing can leadto reduced mRNA levels via nonsense-mediated decay mechanisms. Many muta-tions, including many classical genetic disease-causing mutations (e.g. manythalassemias), directly alter transcription of the affected gene. Indeed, theevolutionary constraints on mutation in perigenic noncoding regions, reflected inlimited sequence polymorphism observed in these regions as compared to degen-erate positions in coding sequences, argue that the potential for deleterious con-sequences from mutations in regulatory sequences of genes rivals that ofmutations in protein-coding sequences (4, 100).
Perhaps a more common use of cDNA microarrays in the investigation ofgenetic diseases will be to detect quantitative differences in the expression ofgenes between different animal strains or different human individuals. Quantita-tive traits that distinguish individuals of the same species undoubtedly arise as aresult of both coding region polymorphisms that alter the function of a geneproduct and regulatory region polymorphisms that affect the expression level ofthe mRNA or protein. The relative contribution of these two types of allelicdifferences to genetic diversity is unclear at present, but cDNA microarray anal-ysis may soon reveal a broad range of quantitative gene expression traits withinthe immune system. Polymorphisms in the mouse TNF alpha gene have beendescribed that affect TNF alpha levels and can modulate the development ofnephritis in animals predisposed to systemic lupus erythematosis (101). Similarly,regulatory mutations in the human TNF alpha gene have been associated with awide variety of diseases, but the interpretations of such studies in humans iscomplicated by the location of the TNF alpha gene in the MHC and the difficultyin teasing apart the contributions of allelic differences in the TNF alpha gene andthe MHC genes.
An interesting quantitative gene expression trait was recently described involv-ing FRIP, a gene that encodes an adapter protein involved in IL-4 signaling (102).The FRIP gene was mapped to a region of mouse chromosome 14 very close tothe gene for the hairless mutation. The hairless mutation results from the insertionof an endogenous mouse retrovirus into the mouse hairless locus (103). The hair-

850 STAUDT n BROWN
less gene is also mutated in human alopecia universalis and encodes a pioneer pro-tein of unknown function (104). The hairless mouse also has immune abnormali-ties, including lymphadenopathy and augmented response of anti-CD3 stimulatedT cells to IL-4 (102). The FRIP gene is expressed at significantly lower levels inhairless mice compared with wild-type mice, possibly as a result of the sameretroviral insertion event. Given the proximity of FRIP to the hairless gene andthe IL-4-related abnormalities of hairless mice, the FRIP quantitative gene expres-sion trait may well account for the lymphoproliferative disorder in these mice.
Genomic-scale gene expression analysis may help to unravel complex geneticdiseases by defining more precisely the disease ‘‘phenotype.’’ As a hypotheticalexample, suppose one of the disease susceptibility genes involved in a compleximmunological disease regulates responsiveness of T lymphocytes to IL-2. cDNAmicroarray analysis of IL-2-stimulated peripheral blood T cells might thereforereveal a gene expression profile that correlates with the presence of this suscep-tibility allele. This gene expression correlate of the susceptibility gene might beobserved in family members of affected individuals who are clinically ‘‘normal’’due to segregation of other susceptibility alleles. Linkage analysis using poly-morphic markers could be applied to this gene expression phenotype rather thanto the whole clinical syndrome, thereby isolating one component of the complexdisease phenotype.
GENE EXPRESSION PROFILES OF PERIPHERAL BLOODAS SENTINELS OF DISEASE
Immune cells circulate throughout the body responding to internal and externalthreats to homeostasis. Circulating white blood cells are charged with the task ofseeking out, recognizing, and mounting a suitable response to the earliest signsof an infection or injury. The sensitive and diverse repertoire of receptors andsignal transduction systems that cells use to monitor and respond to trouble atany site in the body may well give rise to signature patterns of altered geneexpression in peripheral blood cells reflecting the nature and site of an infectionor injury. It is plausible that gene expression patterns in specific subsets of periph-eral blood cells might be altered in characteristic ways in response to the presenceof specific occult infectious agents. As a consequence, peripheral blood mono-nuclear cells might display a pathognomonic gene expression signature that couldbe used to diagnose occult disease. Gene expression changes induced by cyto-megalovirus (CMV) infection of fibroblasts and HTLV-I infection of T lympho-cytes were studied using microarrays and revealed, not surprisingly, largelydistinct gene expression profiles (105, 106). Infection with CMV invoked a stronginterferon response that was not observed with HTLV-I, whereas HTLV-1 induceda number of NF-jB target genes as a consequence of the nuclear translocation ofNF-jB induced by the HTLV-I tax protein. Recently, the response of monocytic

GENOMIC VIEWS OF THE IMMUNE SYSTEM 851
cells to bacterial exposure in vitro was monitored using Lymphochip cDNAmicroarrays (D Relman, in preparation). B. pertussis, H. pylori, and S. typhimu-rium each induced a distinctive gene expression profile in the monocytes. Further,mutant strains of B. pertussis that lacked individual toxin genes elicited geneexpression changes that differed from the response to the wild-type strain. Thus,gene expression profiles could be used not only to recognize exposure to aninfectious agent but perhaps to identify the agent or category of agent, based onspecific characteristics of the response. This ability would clearly be especiallyuseful in cases in which the agent cannot be readily cultured from the host. Sincegene expression responses to infectious agents take place within the first fewhours after exposure, gene expression profiling might be useful in diagnosinginfectious exposure in advance of clinical symptoms, allowing exposed patientsto be rapidly triaged for treatment. Finally, the course of infection and the ensuinghost response could potentially be monitored by changes in peripheral blood geneexpression. This approach could aid in the management of sepsis, which is adisease characterized by an orderly progression of pathophysiological events(107). Gene expression profiles could thus be used to stratify patients into distinctpathophysiological groups and, ultimately, treat each group with a therapy tailoredto the disease stage.
It is not difficult to imagine a wider range of clinical settings in which periph-eral blood gene expression profiles might aid in patient management. Exposureto toxic xenobiotic compounds such as dioxin should be readily detectable byvirtue of the expression of the aryl hydrocarbon receptor in activated T cells(Figure 2, see color insert). T cells from cancer patients display an anergic phe-notype, partly due to loss of the zeta chain of the T cell receptor (108, 109), whichshould result in a gene expression signature in peripheral blood cells. In cases ofoccult malignancy, such as often occurs in ovarian cancer, this gene expressionsignature might be detectable in advance of clinical symptoms. In autoimmunediseases such as multiple sclerosis, changes in peripheral blood gene expressionmay precede a clinical exacerbation, allowing clinicians to time immunosuppres-sive treatment optimally. Recognition of characteristic patterns of gene expressionin circulating peripheral blood cells may thus prove broadly useful as an approachto noninvasive diagnostics, in effect recruiting these readily accessible cells as‘‘spies’’ to report the presence of occult infection or injury they have encounteredduring their surveillance of the integrity of the body. Of course, as with anyclinical test, gene expression profiling of blood mononuclear cells must be bothsensitive and specific to be useful. If only a small fraction of peripheral bloodcells responds to a pathological event, microarray analysis of gene expressionmay not be a sufficiently sensitive test. Furthermore, we do not yet know theextent of normal variation in gene expression patterns in peripheral blood cells,nor the extent to which they are altered by everyday, non–life threatening events.For example, it will be necessary (and very interesting in its own right) to catalogthe effects of upper respiratory viral infections, stress hormones, age, sex, andeven circadian rhythms on gene expression in peripheral blood cells. As alreadymentioned, genetic variation in immune regulatory genes may be associated with

852 STAUDT n BROWN
quantitative gene expression traits that will need to be considered in interpretinggene expression profiles of blood cells. Given the rich insights that genomic-scalegene expression analysis has already provided, we can be optimistic that thisnew mode of biological discovery will illuminate many issues in clinicalpathophysiology.
ACKNOWLEDGMENTS
The microarray work summarized in this paper results from a collaborative effortof the authors’ laboratories with a variety of researchers at the National CancerInstitute, NIH; Stanford University; Center for Information Technology, NIH;CBER, FDA, University of Nebraska Medical Center, and Research Genetics.Key individuals who contributed to the Lymphochip project are Ash Alizadeh,Mike Eisen, R Eric Davis, Chi Ma, Hajeer Sabet, Truc Tran, John Powell, LimingYang, Gerry Marti, Troy Moore, Jim Hudson, John Chan, Tim Greiner, DennyWeisenburger, Jim Armitage, Izadore Lossos, Ron Levy, and David Botstein. Theauthors thank Richard Glynne, Chris Goodnow, Philippa Marrack, and DavidRelman for communicating results prior to publication.
Visit the Annual Reviews home page at www.AnnualReviews.org.
LITERATURE CITED
1. Goffeau A, Barrell BG, Bussey H, DavisRW, Dujon B, Feldmann H, Galibert F,Hoheisel JD, Jacq C, Johnston M, LouisEJ, Mewes HW, Murakami Y, PhilippsenP, Tettelin H, Oliver SG. 1996. Life with6000 genes. Science 274:546:563–67
2. Consortium TC e S. 1998. Genomesequence of the nematode C. elegans: aplatform for investigating biology. Sci-ence 282:2012–18
3. Clayton RA, White O, Fraser CM. 1998.Findings emerging from complete micro-bial genome sequences. Curr. Opin.Microbiol. 1:562–66
4. Cargill M, Altshuler D, Ireland J, SklarP, Ardlie K, Patil N, Lane CR, Lim EP,Kalayanaraman N, Nemesh J, Ziaugra L,Friedland L, Rolfe A, Warrington J, Lip-shutz R, Daley GQ, Lander ES. 1999.Characterization of single-nucleotidepolymorphisms in coding regions ofhuman genes. Nat. Genet. 22:231–38
5. Uberbacher EC, Xu Y, Mural RJ. 1996.Discovering and understanding genes inhuman DNA sequence using GRAIL.Meth. Enzymol. 266:259–81
6. Adams MD, Dubnick M, Kerlavage AR,Moreno R, Kelley JM, Utterback TR,Nagle JW, Fields C, Venter JC. 1992.Sequence identification of 2,375 humanbrain genes. Nature 355:632–34
7. Boguski MS, Lowe TM, Tolstoshev CM.1993. dbEST—database for ‘‘expressedsequence tags.’’ Nat. Genet. 4:332–33
8. Alizadeh A, Eisen M, Davis RE, Ma C,Sabet H, Tran T, Powell J, Yang L, MartiG, Moore T, Hudson J, Chan WC, Grei-ner T, Weisenburger D, Armitage JO,Lossos I, Levy R, Botstein D, Brown PO,Staudt LM. 1999. The Lymphochip: aspecialized cDNA microarray for thegenomic-scale analysis of gene expres-sion in normal and malignant lympho-

GENOMIC VIEWS OF THE IMMUNE SYSTEM 853
cytes. Cold Spring Harbor Symp. Quant.Biol. In press
9. Strausberg RL, Dahl CA, Klausner RD.1997. New opportunities for uncoveringthe molecular basis of cancer. Nat. Genet.15(Spec. No.):415–16
10. Soares MB, Bonaldo MF, Jelene P, Su L,Lawton L, Efstratiadis A. 1994. Con-struction and characterization of a nor-malized cDNA library. Proc. Natl. Acad.Sci. USA 91:9228–32
11. Schuler GD. 1997. Pieces of the puzzle:expressed sequence tags and the catalogof human genes. J. Mol. Med. 75:694–98
12. Velculescu VE, Zhang L, Vogelstein B,Kinzler KW. 1995. Serial analysis ofgene expression. Science 270:484–87
13. Chen H, Centola M, Altschul SF, Metz-ger H. 1998. Characterization of geneexpression in resting and activated mastcells. J. Exp. Med. 188:1657–68
14. Southern EM, Maskos U, Elder JK.1992. Analyzing and comparing nucleicacid sequences by hybridization to arraysof oligonucleotides: evaluation usingexperimental models. Genomics 13:1008–17
15. Southern EM, Case-Green SC, Elder JK,Johnson M, Mir KU, Wang L, WilliamsJC. 1994. Arrays of complementary oli-gonucleotides for analysing the hybridi-sation behaviour of nucleic acids.Nucleic Acids Res. 22:1368–73
16. Pietu G, Alibert O, Guichard V, Lamy B,Bois F, Leroy E, Mariage-Sampson R,Houlgatte R, Soularue P, Auffray C.1996. Novel gene transcripts preferen-tially expressed in human musclesrevealed by quantitative hybridization ofa high density cDNA array. Genome Res.6:492–503
17. Gress TM, Muller-Pillasch F, Geng M,Zimmerhackl F, Zehetner G, Friess H,Buchler M, Adler G, Lehrach H. 1996. Apancreatic cancer-specific expressionprofile. Oncogene 13:1819–30
18. Pease AC, Solas D, Sullivan EJ, CroninMT, Holmes CP, Fodor SP. 1994. Light-
generated oligonucleotide arrays forrapid DNA sequence analysis. Proc.Natl. Acad. Sci. USA 91:5022–26
19. Chee M, Yang R, Hubbell E, Berno A,Huang XC, Stern D, Winkler J, LockhartDJ, Morris MS, Fodor SP. 1996. Access-ing genetic information with high-density DNA arrays. Science 274:610–14
20. Lipshutz RJ, Morris D, Chee M, HubbellE, Kozal MJ, Shah N, Shen N, Yang R,Fodor SP. 1995. Using oligonucleotideprobe arrays to access genetic diversity.Biotechniques 19:442–47
21. Lockhart DJ, Dong H, Byrne MC, Fol-lettie MT, Gallo MV, Chee MS, Mitt-mann M, Wang C, Kobayashi M, HortonH, Brown EL. 1996. Expression moni-toring by hybridization to high-densityoligonucleotide arrays. Nat. Biotechnol.14:1675–80
22. Wodicka L, Dong H, Mittmann M, HoMH, Lockhart DJ. 1997. Genome-wideexpression monitoring in Saccharomycescerevisiae. Nat. Biotechnol. 15:1359–67
23. Schena M, Shalon D, Davis RW, BrownPO. 1995. Quantitative monitoring ofgene expression patterns with a comple-mentary DNA microarray. Science270:467–70
24. Schena M, Shalon D, Heller R, Chai A,Brown PO, Davis RW. 1996. Parallelhuman genome analysis: microarray-based expression monitoring of 1000genes. Proc. Natl. Acad. Sci. USA93:10614–19
25. Shalon D, Smith SJ, Brown PO. 1996. ADNA microarray system for analyzingcomplex DNA samples using two-colorfluorescent probe hybridization. GenomeRes. 6:639–45
26. Lashkari DA, DeRisi JL, McCusker H,Namath AF, Gentile C, Hwang SY,Brown PO, Davis RW. 1997. Yeastmicroarrays for genome wide parallelgenetic and gene expression analysis.Proc. Natl. Acad. Sci. USA 94:13057–62
27. Heller RA, Schena M, Chai A, Shalon D,Bedilion T, Gilmore J, Woolley DE,

854 STAUDT n BROWN
Davis RW. 1997. Discovery and analysisof inflammatory disease-related genesusing cDNA microarrays. Proc. Natl.Acad. Sci. USA 94:2150–55
28. DeRisi JL, Iyer VR, Brown PO. 1997.Exploring the metabolic and genetic con-trol of gene expression on a genomicscale. Science 278:680–86
29. DeRisi J, Penland L, Brown PO, BittnerML, Meltzer PS, Ray M, Chen Y, Su YA,Trent JM. 1996. Use of a cDNA microar-ray to analyse gene expression patternsin human cancer. Nat. Genet. 14:457–60
30. Iyer VR, Eisen MB, Ross DT, Schuler G,Moore T, Lee JCF, Trent JM, Staudt LM,Hudson J Jr, Boguski MS, Lashkari D,Shalon D, Botstein D, Brown PO. 1999.The transcriptional program in theresponse of human fibroblasts to serum.Science 283:83–87
31. Eisen MB, Spellman PT, Brown PO,Botstein D. 1998. Cluster analysis anddisplay of genome-wide expression pat-terns. Proc. Natl. Acad. Sci. USA95:14863–68
32. Kohonen T. 1997. Self-Organizing Maps.Berlin: Springer
33. Tamayo P, Slonim D, Mesirov J, Zhu Q,Kitareewan S, Dmitrovsky E, Lander ES,Golub TR. 1999. Interpreting patterns ofgene expression with self-organizingmaps: methods and application to hema-topoietic differentiation. Proc. Natl.Acad. Sci. USA 96:2907–12
34. Tavazoie S, Hughes JD, Campbell MJ,Cho RJ, Church GM. 1999. Systematicdetermination of genetic network archi-tecture. Nat. Genet. 22:281–85
35. Alon U, Barkai N, Notterman DA, GishK, Ybarra S, Mack D, Levine AJ. 1999.Broad patterns of gene expressionrevealed by clustering analysis of tumorand normal colon tissues probed by oli-gonucleotide arrays. Proc. Natl. Acad.Sci. USA 96:6745–50
36. Spellman PT, Sherlock G, Zhang MQ,Iyer VR, Anders K, Eisen MB, BrownPO, Botstein D, Futcher B. 1998. Com-
prehensive identification of cell cycle-regulated genes of the yeastSaccharomyces cerevisiae by microarrayhybridization. Mol. Biol. Cell. 9:3273–97
37. Alizadeh A, Eisen M, Botstein D, BrownPO, Staudt LM. 1998. Probing lympho-cyte biology by genomic-scale geneexpression analysis. J. Clin. Immunol.18:373–79
38. Pryputniewicz SJ, Nagarkatti M, Nagar-katti PS. 1998. Differential induction ofapoptosis in activated and resting T cellsby 2,3,7,8-tetrachlorodibenzo-p-dioxin(TCDD) and its repercussion on T cellresponsiveness. Toxicology 129:211–26
39. Roche S, Alonso G, Kazlauskas A, DixitVM, Courtneidge SA, Pandey A. 1998.Src-like adaptor protein (SLAP) is anegative regulator of mitogenesis. Curr.Biol. 8:975–78
40. Chu S, DeRisi J, Eisen M, Mulholland J,Botstein D, Brown PO, Herskowitz I.1998. The transcriptional program ofsporulation in budding yeast. Science282:699–705
41. Brown PO, Botstein D. 1999. Exploringthe new world of the genome with DNAmicroarrays. Nat. Genet. 21:33–37
42. Marton MJ, DeRisi JL, Bennett HA, IyerVR, Meyer MR, Roberts CJ, StoughtonR, Burchard J, Slade D, Dai H, BassettDE Jr, Hartwell LH, Brown PO, FriendSH. 1998. Drug target validation andidentification of secondary drug targeteffects using DNA microarrays. Nat.Med. 4:1293–1301
43. Cho RJ, Campbell MJ, Winzeler EA,Steinmetz L, Conway A, Wodicka L,Wolfsberg TG, Gabrielian AE, Lands-man D, Lockhart DJ, Davis RW. 1998. Agenome-wide transcriptional analysis ofthe mitotic cell cycle. Mol. Cell. 2:65–73
44. Gray NS, Wodicka L, Thunnissen AM,Norman TC, Kwon S, Espinoza FH,Morgan DO, Barnes G, LeClerc S, Mei-jer L, Kim SH, Lockhart DJ, Schultz PG.1998. Exploiting chemical libraries,

GENOMIC VIEWS OF THE IMMUNE SYSTEM 855
structure, and genomics in the search forkinase inhibitors. Science 281:533–38
45. Holstege FC, Jennings EG, Wyrick JJ,Lee TI, Hengartner CJ, Green MR,Golub TR, Lander ES, Young RA. 1998.Dissecting the regulatory circuitry of aeukaryotic genome. Cell 95:717–28
46. Fambrough D, McClure K, KazlauskasA, Lander ES. 1999. Diverse signalingpathways activated by growth factorreceptors induce broadly overlapping,rather than independent, sets of genes.Cell 97:727–41
47. Darnell JE, Kerr IM, Stark GR. 1994.Jak-STAT pathways and transcriptionalactivation in response to IFNs and otherextracellular signaling proteins. Science264:1415–21
48. Harkin DP, Bean JM, Miklos D, SongYH, Truong VB, Englert C, ChristiansFC, Ellisen LW, Maheswaran S, OlinerJD, Haber DA. 1999. Induction ofGADD45 and JNK/SAPK-dependentapoptosis following inducible expressionof BRCA1. Cell 97:575–86
49. Amundson SA, Bittner M, Chen Y, TrentJ, Meltzer P, Fornace AJ Jr. 1999. Fluo-rescent cDNA microarray hybridizationreveals complexity and heterogeneity ofcellular genotoxic stress responses.Oncogene 18:3666–72
50. Hermeking H, Lengauer C, Polyak K, HeTC, Zhang L, Thiagalingam S, KinzlerKW, Vogelstein B. 1997. 14–3-3 sigmais a p53-regulated inhibitor of G2/M pro-gression. Mol. Cell. 1:3–11
51. Polyak K, Xia Y, Zweier JL, Kinzler KW,Vogelstein B. 1997. A model for p53-induced apoptosis. Nature 389:300–5
52. Kelsoe G. 1996. The germinal center: acrucible for lymphocyte selection.Semin. Immunol. 8:179–84
53. MacLennan ICM. 1994. Germinal cen-ters. Annu. Rev. Immunol. 12:117–39
54. Gunn MD, Ngo VN, Ansel KM, EklandEH, Cyster JG, Williams LT. 1998. A B-cell-homing chemokine made in lym-phoid follicles activates Burkitt’s
lymphoma receptor-1. Nature 391:799–803
55. Klein U, Goossens T, Fischer M, KanzlerH, Braeuninger A, Rajewsky K, KuppersR. 1998. Somatic hypermutation in nor-mal and transformed human B cells.Immunol. Rev. 162:261–80
56. Du M, Diss TC, Xu C, Peng H, IsaacsonPG, Pan L. 1996. Ongoing mutation inMALT lymphoma immunoglobulin genesuggests that antigen stimulation plays arole in the clonal expansion. Leukemia10:1190–97
57. Bahler DW, Levy R. 1992. Clonal evo-lution of a follicular lymphoma: evidencefor antigen selection. Proc. Natl. Acad.Sci. USA 89:6770–74
58. Bahler DW, Miklos JA, Swerdlow SH.1997. Ongoing Ig gene hypermutation insalivary gland mucosa-associated lym-phoid tissue-type lymphomas. Blood89:3335–44
59. Qin Y, Greiner A, Hallas C, Haedicke W,Muller-Hermelink HK. 1997. Intraclonaloffspring expansion of gastric low-gradeMALT-type lymphoma: evidence for therole of antigen-driven high-affinity muta-tion in lymphomagenesis. Lab. Invest.76:477–85
60. Matsumoto M, Lo SF, Carruthers CJ,Min J, Mariathasan S, Huang G, PlasDR, Martin SM, Geha RS, Nahm MH,Chaplin DD. 1996. Affinity maturationwithout germinal centres in lympho-toxin-alpha-deficient mice. Nature 382:462–66
61. Fukuda T, Yoshida T, Okada S, HatanoM, Miki T, Ishibashi K, Okabe S, KosekiH, Hirosawa S, Taniguchi M, MiyasakaN, Tokuhisa T. 1997. Disruption of theBcl6 gene results in an impaired germi-nal center formation. J. Exp. Med.186:439–48
62. Ye BH, Cattoretti G, Shen Q, Zhang J,Hawe N, de Waard R, Leung C, Nouri-Shirazi M, Orazi A, Chaganti RS, Roth-man P, Stall AM, Pandolfi PP,Dalla-Favera R. 1997. The BCL-6 proto-

856 STAUDT n BROWN
oncogene controls germinal-centre for-mation and Th2- type inflammation. Nat.Genet. 16:161–70
63. Dent AL, Shaffer AL, Yu X, Allman D,Staudt LM. 1997. Control of inflamma-tion, cytokine expression, and germinalcenter formation by BCL-6. Science276:589–92
64. Goodnow CC, Cyster JG, Hartley SB,Bell SE, Cooke MP, Healy JI, AkkarajuS, Rathmell JC, Pogue SL, Shokat KP.1995. Self-tolerance checkpoints in Blymphocyte development. Adv. Immunol.59:279–368
65. Healy JI, Goodnow CC. 1998. Positiveversus negative signaling by lymphocyteantigen receptors. Annu. Rev. Immunol.16:645–70
66. Vyse TJ, Todd JA. 1996. Genetic analysisof autoimmune disease. Cell 85:311–18
67. Gonzalez A, Katz JD, Mattei MG, Kik-utani H, Benoist C, Mathis D. 1997.Genetic control of diabetes progression.Immunity 7:873–83
68. Wang B, Andre I, Gonzalez A, Katz JD,Aguet M, Benoist C, Mathis D. 1997.Interferon-gamma impacts at multiplepoints during the progression of auto-immune diabetes. Proc. Natl. Acad. Sci.USA 94:13844–49
69. Moser KL, Neas BR, Salmon JE, Yu H,Gray-McGuire C, Asundi N, Bruner GR,Fox J, Kelly J, Henshall S, Bacino D,Dietz M, Hogue R, Koelsch G, Nightin-gale L, Shaver T, Abdou NI, Albert DA,Carson C, Petri M, Treadwell EL, JamesJA, Harley JB. 1998. Genome scan ofhuman systemic lupus erythematosus:evidence for linkage on chromosome 1qin African-American pedigrees. Proc.Natl. Acad. Sci. USA 95:14869–74
70. Todd JA. 1995. Genetic analysis of type1 diabetes using whole genomeapproaches. Proc. Natl. Acad. Sci. USA92:8560–65
71. Concannon P, Gogolin-Ewens KJ, HindsDA, Wapelhorst B, Morrison VA, Stir-ling B, Mitra M, Farmer J, Williams SR,
Cox NJ, Bell GI, Risch N, Spielman RS.1998. A second-generation screen of thehuman genome for susceptibility to insu-lin-dependent diabetes mellitus. Nat.Genet. 19:292–96
72. Satsangi J, Parkes M, Louis E, Hashi-moto L, Kato N, Welsh K, TerwilligerJD, Lathrop GM, Bell JI, Jewell DP.1996. Two-stage genome-wide search ininflammatory bowel disease providesevidence for susceptibility loci on chro-mosomes 3, 7 and 12. Nat. Genet.14:199–202
73. Sundvall M, Jirholt J, Yang HT, JanssonL, Engstrom A, Pettersson U, HolmdahlR. 1995. Identification of murine lociassociated with susceptibility to chronicexperimental autoimmune encephalo-myelitis. Nat. Genet. 10:313–17
74. Ebers GC, Kukay K, Bulman DE, Sadov-nick AD, Rice G, Anderson C, Arm-strong H, Cousin K, Bell RB, Hader W,Paty DW, Hashimoto S, Oger J, DuquetteP, Warren S, Gray T, O’Connor P, NathA, Auty A, Metz L, Francis G, PaulsethJE, Murray TJ, Pryse-Phillips W, RischR, et al. 1996. A full genome search inmultiple sclerosis. Nat. Genet. 13:472–76
75. Sawcer S, Jones HB, Feakes R, Gray J,Smaldon N, Chataway J, Robertson N,Clayton D, Goodfellow PN, CompstonA. 1996. A genome screen in multiplesclerosis reveals susceptibility loci onchromosome 6p21 and 17q22. Nat.Genet. 13:464–68
76. Haines JL, Ter-Minassian M, Bazyk A,Gusella JF, Kim DJ, Terwedow H, Peri-cak-Vance MA, JB Rimmler, Haynes CS,Roses AD, Lee A, Shaner B, Menold M,Seboun E, Fitoussi RP, Gartioux C,Reyes C, Ribierre F, Gyapay G, Weissen-bach J, Hauser SL, Goodkin DE, LincolnR, Usuku K, Oksenberg JR, et al. 1996.A complete genomic screen for multiplesclerosis underscores a role for the majorhistocompatability complex. The Multi-

GENOMIC VIEWS OF THE IMMUNE SYSTEM 857
ple Sclerosis Genetics Group. Nat.Genet. 13:469–71
77. Kuokkanen S, Sundvall M, TerwilligerJD, Tienari PJ, Wikstrom J, Holmdahl R,Pettersson U, Peltonen L. 1996. A puta-tive vulnerability locus to multiple scle-rosis maps to 5p14-p12 in a regionsyntenic to the murine locus Eae2. Nat.Genet. 13:477–80
78. Davies JL, Kawaguchi Y, Bennett ST,Copeman JB, Cordell HJ, Pritchard LE,Reed PW, Gough SC, Jenkins SC,Palmer SM, et al. 1994. A genome-widesearch for human type 1 diabetes suscep-tibility genes. Nature 371:130–36
79. Jacob HJ, Pettersson A, Wilson D, MaoY, Lernmark A, Lander ES. 1992.Genetic dissection of autoimmune type Idiabetes in the BB rat. Nat. Genet. 2:56–60
80. Hashimoto L, Habita C, Beressi JP, Dele-pine M, Besse C, Cambon-Thomsen A,Deschamps I, Rotter JI, Djoulah S, JamesMR, et al. 1994. Genetic mapping of asusceptibility locus for insulin-dependentdiabetes mellitus on chromosome 11q.Nature 371:161–64
81. Hugot JP, Laurent-Puig P, Gower-Rous-seau C, Olson JM, Lee JC, Beaugerie L,Naom I, Dupas JL, Van Gossum A,Orholm M, Bonaiti-Pellie C, Weissen-bach J, Mathew CG, Lennard-Jones JE,Cortot A, Colombel JF, Thomas G. 1996.Mapping of a susceptibility locus forCrohn’s disease on chromosome 16.Nature 379:821–23
82. Matthews D, Fry L, Powles A, Weber J,McCarthy M, Fisher E, Davies K, Wil-liamson R. 1996. Evidence that a locusfor familial psoriasis maps to chromo-some 4q. Nat. Genet. 14:231–33
83. Tomfohrde J, Silverman A, Barnes R,Fernandez-Vina MA, Young M, Lory D,Morris L, Wuepper KD, Stastny P, Men-ter A, et al. 1994. Gene for familial pso-riasis susceptibility mapped to the distalend of human chromosome 17q. Science264:1141–45
84. Daniels SE, Bhattacharrya S, James A,Leaves NI, Young A, Hill MR, Faux JA,Ryan GF, le Souef PN, Lathrop GM,Musk AW, Cookson WO. 1996. Agenome-wide search for quantitative traitloci underlying asthma. Nature 383:247–50
85. Remmers EF, Longman RE, Du Y,O’Hare A, Cannon GW, Griffiths MM,Wilder RL. 1996. A genome scan local-izes five non-MHC loci controlling col-lagen-induced arthritis in rats. Nat.Genet. 14:82–85
86. Kono DH, Burlingame RW, Owens DG,Kuramochi A, Balderas RS, BalomenosD, Theofilopoulos AN. 1994. Lupus sus-ceptibility loci in New Zealand mice.Proc. Natl. Acad. Sci. USA 91:10168–72
87. Morel L, Rudofsky UH, Longmate JA,Schiffenbauer J, Wakeland EK. 1994.Polygenic control of susceptibility tomurine systemic lupus erythematosus.Immunity 1:219–29
88. Baker D, Rosenwasser OA, O’Neill JK,Turk JL. 1995. Genetic analysis of exper-imental allergic encephalomyelitis inmice. J. Immunol. 155:4046–51
89. Jirholt J, Cook A, Emahazion T, SundvallM, Jansson L, Nordquist N, Pettersson U,Holmdahl R. 1998. Genetic linkage anal-ysis of collagen-induced arthritis in themouse. Eur. J. Immunol. 28:3321–28
90. Ghosh S, Palmer SM, Rodrigues NR,Cordell HJ, Hearne CM, Cornall RJ,Prins JB, McShane P, Lathrop GM,Peterson LB, et al. 1993. Polygenic con-trol of autoimmune diabetes in nonobesediabetic mice. Nat. Genet. 4:404–9
91. Dallas-Pedretti A, McDuffie M, HaskinsK. 1995. A diabetes-associated T-cellautoantigen maps to a telomeric locus onmouse chromosome 6. Proc. Natl. Acad.Sci. USA 92:1386–90
92. Rowe RE, Wapelhorst B, Bell GI, RischN, Spielman RS, Concannon P. 1995.Linkage and association between insulin-dependent diabetes mellitus (IDDM) sus-

858 STAUDT n BROWN
ceptibility and markers near theglucokinase gene on chromosome 7. Nat.Genet. 10:240–42
93. Field LL, Tobias R, Magnus T. 1994. Alocus on chromosome 15q26 (IDDM3)produces susceptibility to insulin-dependent diabetes mellitus. Nat. Genet.8:189–94
94. Gaffney PM, Kearns GM, Shark KB,Ortmann WA, Selby SA, Malmgren ML,Rohlf KE, Ockenden TC, Messner RP,King RA, Rich SS, Behrens TW. 1998.A genome-wide search for susceptibilitygenes in human systemic lupus ery-thematosus sib-pair families. Proc. Natl.Acad. Sci. USA 95:14875–79
95. Becker KG, Simon RM, Bailey-WilsonJE, Freidlin B, Biddison WE, McFarlandHF, Trent JM. 1998. Clustering of non-major histocompatibility complex sus-ceptibility candidate loci in humanautoimmune diseases. Proc. Natl. Acad.Sci. USA 95:9979–84
96. Odunsi K, Kidd KK. 1999. A paradigmfor finding genes for a complex humantrait: polycystic ovary syndrome and fol-listatin. Proc. Natl. Acad. Sci. USA96:8315–17
97. Foster CB, Lehrnbecher T, Mol F, Stein-berg SM, Venzon DJ, Walsh TJ, NoackD, Rae J, Winkelstein JA, Curnutte JT,Chanock SJ. 1998. Host defense mole-cule polymorphisms influence the riskfor immune-mediated complications inchronic granulomatous disease. J. Clin.Invest. 102:2146–55
98. Aitman TJ, Glazier AM, Wallace CA,Cooper LD, Norsworthy PF, Wahid FN,Al-Majali KM, Trembling PM, Mann CJ,Shoulders CC, Graf D, St. Lezin E, KurtzTW, Kren V, Pravenec M, Ibrahimi A,Abumrad NA, Stanton LW, Scott J. 1999.Identification of Cd36 (Fat) as an insulin-resistance gene causing defective fattyacid and glucose metabolism in hyper-tensive rats [see comments]. Nat. Genet.21:76–83
99. Febbraio M, Abumrad NA, Hajjar DP,Sharma K, Cheng W, Pearce SF, Silver-stein RL. 1999. A null mutation inmurine CD36 reveals an important rolein fatty acid and lipoprotein metabolism.J. Biol. Chem. 274:19055–62
100. Halushka MK, Fan JB, Bentley K, HsieL, Shen N, Weder A, Cooper R, LipshutzR, Chakravarti A. 1999. Patterns ofsingle-nucleotide polymorphisms in can-didate genes for blood-pressure homeo-stasis. Nat. Genet. 22:239–47
101. Jacob CO, McDevitt HO. 1988. Tumournecrosis factor-alpha in murine autoim-mune ‘lupus’ nephritis. Nature 331:356–58
102. Nelms K, Snow AL, Hu-Li J, Paul WE.1998. FRIP, a hematopoietic cell-specificrasGAP-interacting protein phosphory-lated in response to cytokine stimulation.Immunity 9:13–24
103. Stoye JP, Fenner S, Greenoak GE, MoranC, Coffin JM. 1988. Role of endogenousretroviruses as mutagens: the hairlessmutation of mice. Cell 54:383–91
104. Ahmad W, Faiyaz ul Haque M, Brancol-ini V, Tsou HC, ul Haque S, Lam H, AitaVM, Owen J, deBlaquiere M, Frank J,Cserhalmi-Friedman PB, Leask A,McGrath JA, Peacocke M, Ahmad M,Ott J, Christiano AM. 1998. Alopeciauniversalis associated with a mutation inthe human hairless gene. Science279:720–24
105. Zhu H, Cong JP, Mamtora G, GingerasT, Shenk T. 1998. Cellular gene expres-sion altered by human cytomegalovirus:global monitoring with oligonucleotidearrays. Proc. Natl. Acad. Sci. USA95:14470–75
106. Harhaj EW, Good L, Xiao G, Sun SC.1999. Gene expression profiles in HTLV-I-immortalized T cells: deregulatedexpression of genes involved in apopto-sis regulation. Oncogene 18:1341–49
107. Natanson C, Hoffman WD, SuffrediniAF, Eichacker PQ, Danner RL. 1994.

GENOMIC VIEWS OF THE IMMUNE SYSTEM 859
Selected treatment strategies for septicshock based on proposed mechanisms ofpathogenesis. Ann. Intern. Med. 120:771–83
108. Mizoguchi H, O’Shea JJ, Longo DL,Loeffler CM, McVicar DW, Ochoa AC.1992. Alterations in signal transduction
molecules in T lymphocytes from tumor-bearing mice. Science 258:1795–98
109. Whiteside TL. 1998. Immune cells in thetumor microenvironment. Mechanismsresponsible for functional and signalingdefects. Adv. Exp. Med. Biol. 451:167–71

STAUDT ■ BROWN C-1
Figure 1 A Schematic of cDNA microarray gene expression analysis. In thisillustration, the relative gene expression in a mature B cell and a plasma cellis compared. Gene X represents a gene more highly expressed in the plasmacell. See text for details. B Quantitative analysis of relative gene expressionusing cDNA microarrays. For each spot on the microarray, the fluorescenceintensities of hybridized Cy3- and Cy5-labelled cDNA probes are separatelyquantitated, as shown in the middle panel. The Cy5/Cy3 fluorescence intensi-ty ratio is a measure of relative gene expression in the two starting mRNAsamples. The fluorescence ratios are divided into numerical bins and depictedvisually using the color scale shown at the right.
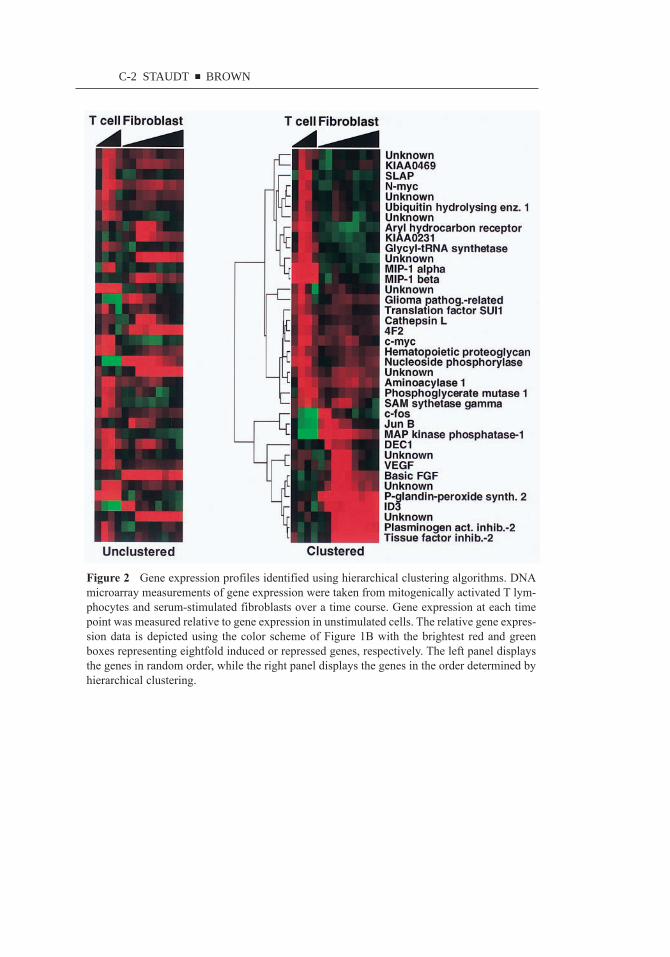
C-2 STAUDT ■ BROWN
Figure 2 Gene expression profiles identified using hierarchical clustering algorithms. DNAmicroarray measurements of gene expression were taken from mitogenically activated T lym-phocytes and serum-stimulated fibroblasts over a time course. Gene expression at each timepoint was measured relative to gene expression in unstimulated cells. The relative gene expres-sion data is depicted using the color scheme of Figure 1B with the brightest red and greenboxes representing eightfold induced or repressed genes, respectively. The left panel displaysthe genes in random order, while the right panel displays the genes in the order determined byhierarchical clustering.

STAUDT ■ BROWN C-3
Figu
re le
gend
app
ears
on
the
follo
win
g pa
ge.

C-4 STAUDT ■ BROWN
Fig
ure
3(s
ee p
rece
ding
pag
e) A
gene
exp
ress
ion
map
of
Sa
cch
aro
myc
es
cere
visi
ae
. T
he l
eft
pane
l de
pict
s th
e re
sults
fro
m 2
04ge
nom
e-w
ide
mic
roar
ray
gene
exp
ress
ion
expe
rimen
ts in
S
acc
ha
rom
yce
s ce
revi
sia
e. Y
east
wer
e pl
aced
und
er 2
8 di
stin
ct p
hysi
olog
i-ca
l or
nut
ritio
nal
cond
ition
s (d
elin
eate
d by
the
ver
tical
bla
ck s
trip
es)
and
assa
yed
mul
tiply
ove
r tim
e. E
ach
colu
mn
repr
esen
ts o
nem
icro
arra
y ex
perim
ent,
and
each
row
rep
rese
nts
one
of t
he 6
220
know
n or
pre
dict
ed g
enes
of
yeas
t. T
he c
oord
inat
e re
gula
tion
ofge
nes
enco
ding
rib
osom
al s
ubun
its is
indi
cate
d. G
enes
invo
lved
in m
eios
is a
nd r
espi
ratio
n fo
rm s
epar
ate
clus
ters
whi
ch a
re e
xpa
nd-
ed a
t th
e rig
ht.

Figure 4 Gene expression signatures in lymphocyte differentiation.Gene expression measurements were taken from four categories of lym-phocyte differentiation/activation: resting peripheral blood B cells (bothnaive and memory), in vitro activated peripheral blood B cells (anti-IgM+/Ð CD40 ligand +/Ð IL-4), tonsillar germinal center and memory Bcells, and resting or activated (PMA + ionomycin) T cells. The geneswere chosen to highlight the difference between germinal center B cellsand in vitro activated peripheral blood B cells.
STAUDT ■ BROWN C-5

Figure 5 Gene expression in normal and malignant B cells. Gene expression in diffuse large Bcell lymphoma (DLCL) lymph node biopsies was compared with gene expression in tonsillar ger-minal center B cells, tonsillar memory B cells, resting peripheral blood B cells, and peripheralblood B cells activated in vitro with anti-IgM + CD40 ligand + IL-4 for 6 and 24 h. A subset ofdiffuse large B cell lymphomas resembles normal germinal center B cells.
C-6 STAUDT ■ BROWN