genomewide mutational diversity in escherichia coli...
TRANSCRIPT

Genomewide Mutational Diversity inEscherichia coli Population Evolving inProlonged Stationary Phase
Savita Chib, Farhan Ali, Aswin Sai Narain SeshasayeeNational Centre for Biological Sciences, Tata Institute of Fundamental Research, Bengaluru, Karnataka, India
ABSTRACT Prolonged stationary phase is an approximation of natural environ-ments presenting a range of stresses. Survival in prolonged stationary phase requiresalternative metabolic pathways for survival. This study describes the repertoire ofmutations accumulating in starving Escherichia coli populations in lysogenybroth. A wide range of mutations accumulates over the course of 1 month instationary phase. Single nucleotide polymorphisms (SNPs) constitute 64% of all mu-tations. A majority of these mutations are nonsynonymous and are located at con-served loci. There is an increase in genetic diversity in the evolving populations overtime. Computer simulations of evolution in stationary phase suggest that the maxi-mum frequency of mutations observed in our experimental populations cannot beexplained by neutral drift. Moreover, there is frequent genetic parallelism acrosspopulations, suggesting that these mutations are under positive selection. Finally,functional analysis of mutations suggests that regulatory mutations are frequent tar-gets of selection.
IMPORTANCE Prolonged stationary phase in bacteria, contrary to its name, is highlydynamic, with extreme nutrient limitation as a predominant stress. Stationary-phasecultures adapt by rapidly selecting a mutation(s) that confers a growth advantage instationary phase (GASP). The phenotypic diversity of starving E. coli populations hasbeen studied in detail; however, only a few mutations that accumulate in prolongedstationary phase have been described. This study documented the spectrum of mu-tations appearing in Escherichia coli during 28 days of prolonged starvation. The ge-netic diversity of the population increases over time in stationary phase to an extentthat cannot be explained by random, neutral drift. This suggests that prolonged sta-tionary phase offers a great model system to study adaptive evolution by natural se-lection.
KEYWORDS prolonged stationary phase, genome analysis, population genetics
Microorganisms often face difficult conditions, including nutrient limitation. Themodel bacterium Escherichia coli doubles its population every 30 min during
exponential phase in rich laboratory medium. This is in contrast to Savageau’s estimatethat in its natural environment—predominantly the lower gut of warm-blooded ani-mals—the average doubling time of E. coli might be as long as 40 h (1). Further, in theirnatural environments, in contrast to standard laboratory media, bacteria are oftenexposed to a variety of other stresses, including pH variation and oxidative stress (2). Inaddition, many natural environments are fluctuating in their nutrient content as well asin their presentation of other stresses. Such environments constantly select for geneticvariants that are better adapted to the prevailing conditions than their parents were,thus driving evolution. A particular laboratory model for approximating stressful anddynamic environments— characterized by a heterogeneous population of a bacterialspecies—is prolonged stationary phase (3, 4).
Received 5 February 2017 Accepted 5 May2017 Published 24 May 2017
Citation Chib S, Ali F, Seshasayee ASN. 2017.Genomewide mutational diversity inEscherichia coli population evolving inprolonged stationary phase. mSphere 2:e00059-17. https://doi.org/10.1128/mSphere.00059-17.
Editor Grant R. Bowman, University ofWyoming
Copyright © 2017 Chib et al. This is an open-access article distributed under the terms ofthe Creative Commons Attribution 4.0International license.
Address correspondence to Savita Chib,[email protected], or Aswin Sai NarainSeshasayee, [email protected].
S.C. and F.A. contributed equally to this work.
RESEARCH ARTICLEEcological and Evolutionary Science
crossm
May/June 2017 Volume 2 Issue 3 e00059-17 msphere.asm.org 1
on July 5, 2018 by guesthttp://m
sphere.asm.org/
Dow
nloaded from

In a typical batch culture of E. coli maintained in a controlled environment, bacterialcells divide rapidly and quickly exhaust readily available nutrients (5, 6). Following abrief exponential growth phase, the population makes a transition to the stationaryphase wherein resources are diverted to maintenance and survival rather than growthand population expansion (7). After 48 h in stationary phase, the medium is unable tosupport large populations, resulting in a population crash; the tempo and intensity ofthe crash vary depending on medium composition as well as the culturing methodsadopted (8, 9). The dead cells lyse and supplement the spent medium with potentialnutrients. A major component of these potential nutrient resources is amino acids andpeptides whose metabolic breakdown results in NH3 production that results in anincrease in pH of the medium (10). These changes in environment select new geneticvariants. This is a continuous process and may extend over a period of several years.This phenomenon is termed growth advantage in stationary phase (GASP), and muta-tions that confer growth advantages in extended stationary phase are referred to asGASP mutations. The GASP phenomenon was demonstrated in E. coli first and has beenshown in other bacteria as well (11–13).
The growth advantage conferred by a GASP mutation is typically demonstrated bymixed-culture competition experiments in which a mutant is directly competed againstthe parent in stationary phase. General trends that have emerged from such GASPstudies include the following: (i) a wide spectrum of mutations is selected in a shortperiod of time, resulting in rapid adaptation (11, 14–17); (ii) nutrient limitation is apredominant force of selection as mutants with enhanced ability to scavenge aminoacids display GASP phenotypes (16, 18, 19); (iii) there is increased phenotypic diversity,as reflected by colony characteristics, in the population over time (20); (iv) the ever-changing biochemical composition of the population continuously redefines the niche(4); and (v) global regulators of transcription are frequent targets of mutation (11, 14,16). Despite these studies, the genetic composition of a population of E. coli overprolonged stationary phase and its dynamics remain incompletely catalogued andunderstood.
In this study, we systematically explored the population diversity emerging in E. colipopulations evolving for 28 days in a lysogeny broth (LB) batch culture incubatedwithout additional nutrient supplementation. Using whole-genome sequencing ofpopulation genomic DNA, we catalogue the rise and fall of multiple mutations duringprolonged stationary phase, assess the extent to which the observed genetic diversitycould be explained by neutral drift, and test for parallelism in the rise of mutationsacross multiple evolving lines.
RESULTSEvolution in batch culture under prolonged stationary phase. We allowed five
replicate populations of E. coli K-12 ZK819 to stay in stationary phase for 28 dayswithout further supplementation with fresh nutrients. Using the dilution platingmethod, we found that the drop in viable cell count was gradual with a reduction ofapproximately 2 orders of magnitude by day 6 (Fig. 1A). Genomic DNA was isolatedfrom a periodically sampled population for next-generation sequencing. ZK819.4 has amutator-like phenotype (Fig. 1B, diamonds) and is excluded from most of the analysis,except where indicated.
Status of rpoS819 during 28 days of evolution. ZK819 is a W3110 variantoriginally isolated from an E. coli culture evolved in Roberto Kolter’s laboratory underan environment similar to that used in our study (11). ZK819 carries an allelic variant ofthe stationary-phase sigma factor gene rpoS, named rpoS819. The rpoS819 mutationalone is sufficient to confer growth advantage on its bearer under prolonged starvation(11, 18). Since rpoS819 is a well-known GASP allele that emerges early in prolongedstationary phase, we used this as the parent for our evolution experiment to search forvariants that emerge in the background of this previously established GASP mutation.
rpoS819 has a 46-bp duplication at the C-terminal end, resulting in a variant thatcodes for a longer sigma factor with attenuated activity (11). In addition, we found an
Chib et al.
May/June 2017 Volume 2 Issue 3 e00059-17 msphere.asm.org 2
on July 5, 2018 by guesthttp://m
sphere.asm.org/
Dow
nloaded from

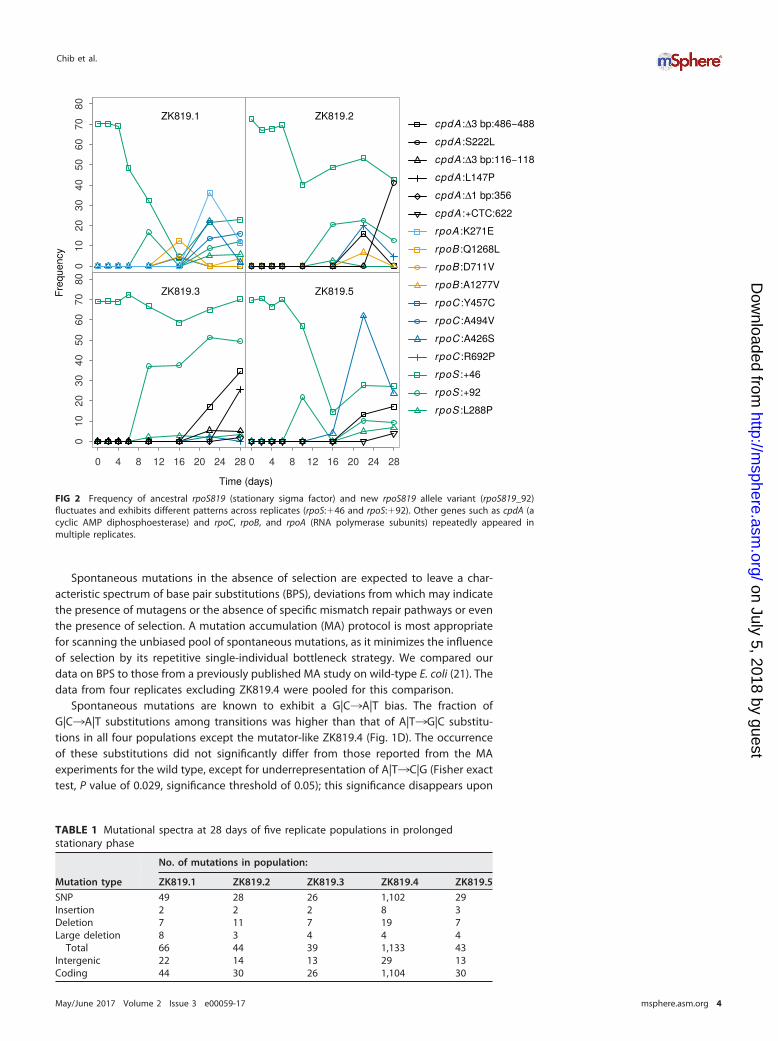
A-to-G substitution 21 bp upstream of rpoS in all our samples. Sanger sequencing of theDNA upstream of rpoS in the genome of the founder strain ZK819 established that it isa preexisting mutation. Genome sequencing data of the population on the first dayshowed heterogeneity at the rpoS locus. The rpoS819 allele was found in only 70% ofthe population—as indicated by the proportion of reads supporting the mutation—after 12 h of growth (Fig. 2). The rest is the wild-type (with the preexisting A-to-Gsubstitution upstream of rpoS) allele. We identified a third allele of rpoS in all replicatesfrom day 10 onward. Sanger sequencing confirmed a 92-bp duplication at theC-terminal end of rpoS. Over the course of the experiment, we found this mutantallele— designated rpoS819_92—in up to 30% of the population (Fig. 2). Curiously, insome replicates, the combined frequency of rpoS819 and rpoS819_92 is more than100%. This was explained by Sanger sequencing of rpoS from various pure colonyisolates, which revealed a fourth allele in the population containing both the 46- andthe 92-bp duplications, 4 bp apart from one another. These data suggest that thefunction of RpoS is constantly tuned and that there is a strong selection favoring itunder prolonged stationary phase.
Spectrum of mutations accumulated over 28 days. The number of mutationsobserved by the end of the experiment for four replicates, namely, ZK819.1, ZK819.2,ZK819.3, and ZK819.5, had a mean value of 26 and a range of 22 to 36. Sixty-fourpercent of these mutations were substitutions (Fig. 1C). Small indels and large dele-tions/insertions created by insertion elements constituted the remaining set of muta-tions (Table 1). In the day 22 sample of the ZK819.4 population, we observed a nearly40-fold increase in substitution mutations. We therefore refer to ZK819.4 as mutator-like.
FIG 1 Mutational spectrum analysis in prolonged stationary-phase populations in comparison with mutationaccumulation lines. (A) Change in population size over time for five replicate populations. (B) Change in observednumber of SNPs over time for five replicate populations. (C) Substitution profiles of five replicates. (D) Comparisonof BPS spectra from prolonged stationary phase with that reported for spontaneous mutations in a neutrallyevolving population.
E. coli Evolution under Prolonged Stationary Phase
May/June 2017 Volume 2 Issue 3 e00059-17 msphere.asm.org 3
on July 5, 2018 by guesthttp://m
sphere.asm.org/
Dow
nloaded from
Spontaneous mutations in the absence of selection are expected to leave a char-acteristic spectrum of base pair substitutions (BPS), deviations from which may indicatethe presence of mutagens or the absence of specific mismatch repair pathways or eventhe presence of selection. A mutation accumulation (MA) protocol is most appropriatefor scanning the unbiased pool of spontaneous mutations, as it minimizes the influenceof selection by its repetitive single-individual bottleneck strategy. We compared ourdata on BPS to those from a previously published MA study on wild-type E. coli (21). Thedata from four replicates excluding ZK819.4 were pooled for this comparison.
Spontaneous mutations are known to exhibit a G|C¡A|T bias. The fraction ofG|C¡A|T substitutions among transitions was higher than that of A|T¡G|C substitu-tions in all four populations except the mutator-like ZK819.4 (Fig. 1D). The occurrenceof these substitutions did not significantly differ from those reported from the MAexperiments for the wild type, except for underrepresentation of A|T¡C|G (Fisher exacttest, P value of 0.029, significance threshold of 0.05); this significance disappears upon
FIG 2 Frequency of ancestral rpoS819 (stationary sigma factor) and new rpoS819 allele variant (rpoS819_92)fluctuates and exhibits different patterns across replicates (rpoS:�46 and rpoS:�92). Other genes such as cpdA (acyclic AMP diphosphoesterase) and rpoC, rpoB, and rpoA (RNA polymerase subunits) repeatedly appeared inmultiple replicates.
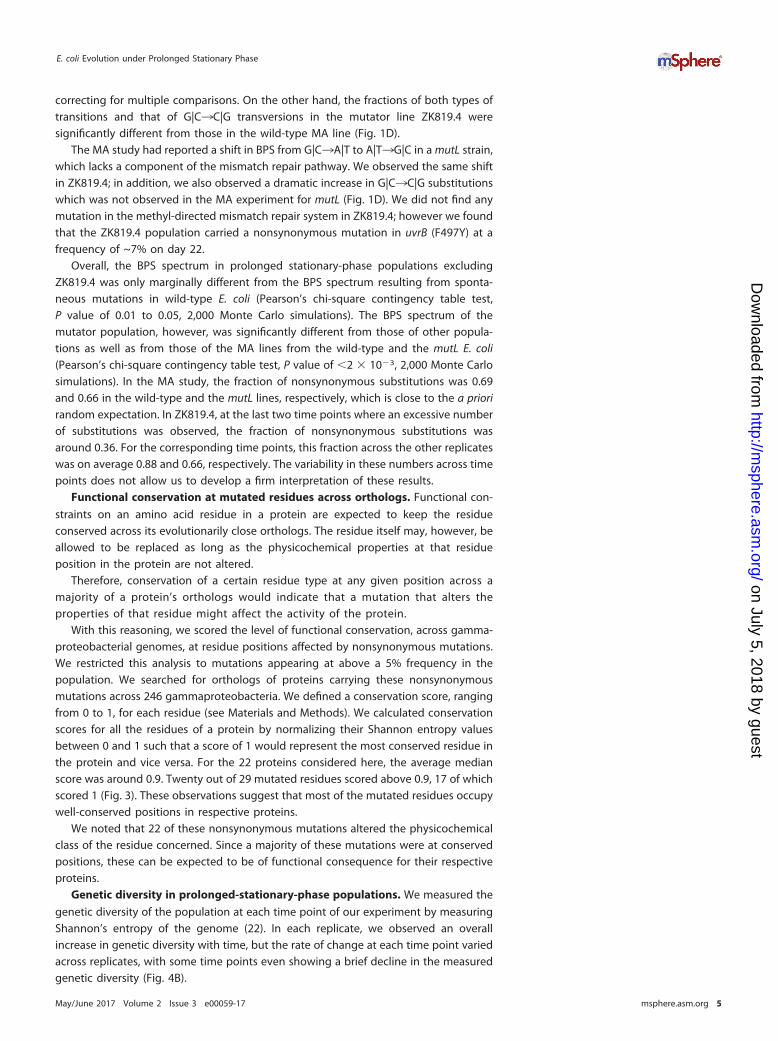
TABLE 1 Mutational spectra at 28 days of five replicate populations in prolongedstationary phase
Mutation type
No. of mutations in population:
ZK819.1 ZK819.2 ZK819.3 ZK819.4 ZK819.5
SNP 49 28 26 1,102 29Insertion 2 2 2 8 3Deletion 7 11 7 19 7Large deletion 8 3 4 4 4
Total 66 44 39 1,133 43Intergenic 22 14 13 29 13Coding 44 30 26 1,104 30
Chib et al.
May/June 2017 Volume 2 Issue 3 e00059-17 msphere.asm.org 4
on July 5, 2018 by guesthttp://m
sphere.asm.org/
Dow
nloaded from
correcting for multiple comparisons. On the other hand, the fractions of both types oftransitions and that of G|C¡C|G transversions in the mutator line ZK819.4 weresignificantly different from those in the wild-type MA line (Fig. 1D).
The MA study had reported a shift in BPS from G|C¡A|T to A|T¡G|C in a mutL strain,which lacks a component of the mismatch repair pathway. We observed the same shiftin ZK819.4; in addition, we also observed a dramatic increase in G|C¡C|G substitutionswhich was not observed in the MA experiment for mutL (Fig. 1D). We did not find anymutation in the methyl-directed mismatch repair system in ZK819.4; however we foundthat the ZK819.4 population carried a nonsynonymous mutation in uvrB (F497Y) at afrequency of ~7% on day 22.
Overall, the BPS spectrum in prolonged stationary-phase populations excludingZK819.4 was only marginally different from the BPS spectrum resulting from sponta-neous mutations in wild-type E. coli (Pearson’s chi-square contingency table test,P value of 0.01 to 0.05, 2,000 Monte Carlo simulations). The BPS spectrum of themutator population, however, was significantly different from those of other popula-tions as well as from those of the MA lines from the wild-type and the mutL E. coli(Pearson’s chi-square contingency table test, P value of �2 � 10�3, 2,000 Monte Carlosimulations). In the MA study, the fraction of nonsynonymous substitutions was 0.69and 0.66 in the wild-type and the mutL lines, respectively, which is close to the a priorirandom expectation. In ZK819.4, at the last two time points where an excessive numberof substitutions was observed, the fraction of nonsynonymous substitutions wasaround 0.36. For the corresponding time points, this fraction across the other replicateswas on average 0.88 and 0.66, respectively. The variability in these numbers across timepoints does not allow us to develop a firm interpretation of these results.
Functional conservation at mutated residues across orthologs. Functional con-
straints on an amino acid residue in a protein are expected to keep the residueconserved across its evolutionarily close orthologs. The residue itself may, however, beallowed to be replaced as long as the physicochemical properties at that residueposition in the protein are not altered.
Therefore, conservation of a certain residue type at any given position across amajority of a protein’s orthologs would indicate that a mutation that alters theproperties of that residue might affect the activity of the protein.
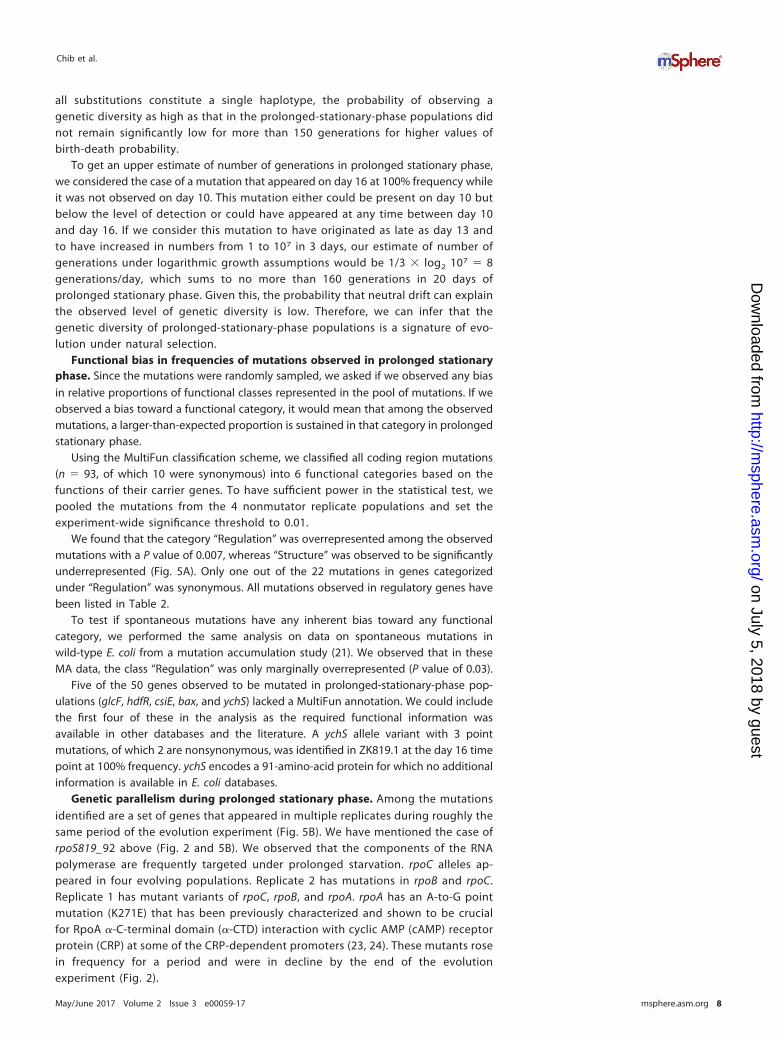
With this reasoning, we scored the level of functional conservation, across gamma-proteobacterial genomes, at residue positions affected by nonsynonymous mutations.We restricted this analysis to mutations appearing at above a 5% frequency in thepopulation. We searched for orthologs of proteins carrying these nonsynonymousmutations across 246 gammaproteobacteria. We defined a conservation score, rangingfrom 0 to 1, for each residue (see Materials and Methods). We calculated conservationscores for all the residues of a protein by normalizing their Shannon entropy valuesbetween 0 and 1 such that a score of 1 would represent the most conserved residue inthe protein and vice versa. For the 22 proteins considered here, the average medianscore was around 0.9. Twenty out of 29 mutated residues scored above 0.9, 17 of whichscored 1 (Fig. 3). These observations suggest that most of the mutated residues occupywell-conserved positions in respective proteins.
We noted that 22 of these nonsynonymous mutations altered the physicochemicalclass of the residue concerned. Since a majority of these mutations were at conservedpositions, these can be expected to be of functional consequence for their respectiveproteins.
Genetic diversity in prolonged-stationary-phase populations. We measured the
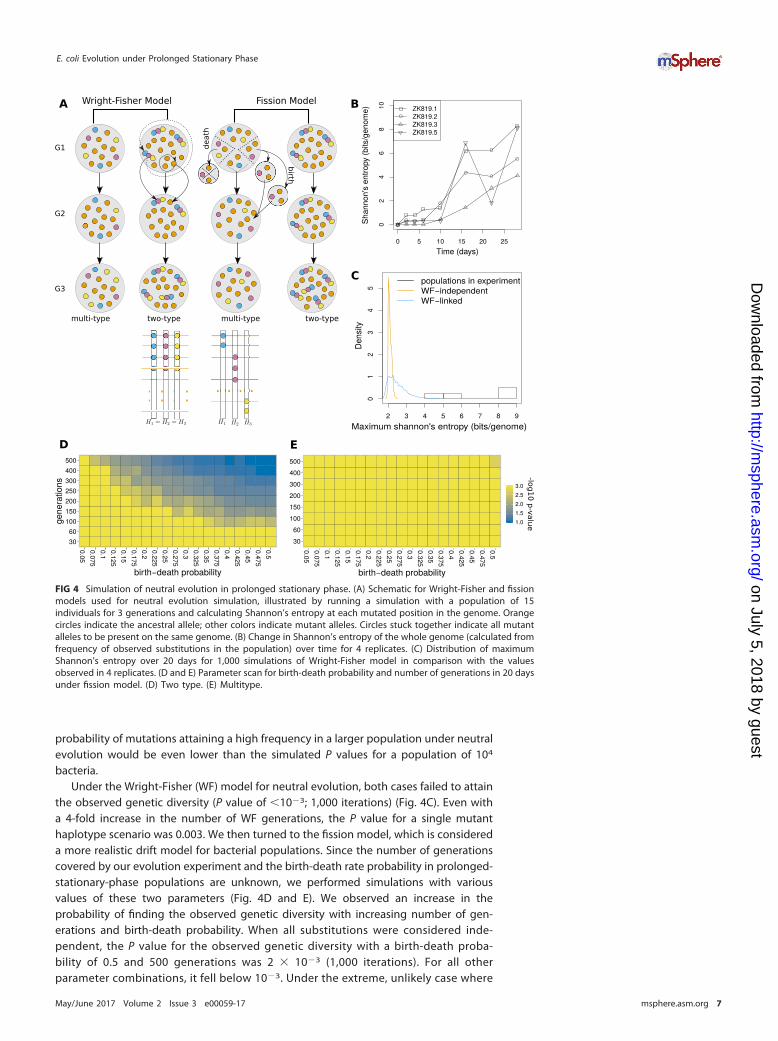
genetic diversity of the population at each time point of our experiment by measuringShannon’s entropy of the genome (22). In each replicate, we observed an overallincrease in genetic diversity with time, but the rate of change at each time point variedacross replicates, with some time points even showing a brief decline in the measuredgenetic diversity (Fig. 4B).
E. coli Evolution under Prolonged Stationary Phase
May/June 2017 Volume 2 Issue 3 e00059-17 msphere.asm.org 5
on July 5, 2018 by guesthttp://m
sphere.asm.org/
Dow
nloaded from

We tested through simulations the null hypothesis that the observed level ofgenetic diversity is attainable under neutral evolution with the same number ofsubstitutions and initial mutant frequencies as those for a prolonged-stationary-phasepopulation. We simulated neutral evolution assuming a constant population size, whichwas appropriate for our prolonged-stationary-phase population from day 10 onward. Inthese simulations, new mutations did not occur de novo, and all mutations wereconsidered to have been present at a frequency of 1% at the initial time point. Weconsidered ZK819.1 the representative case for this analysis, because it has the highestnumber of substitutions at the last time point and the entropy at the starting time pointcan be explained by considering all its 25 substitutions at a frequency no greater than1%. The genetic diversity of ZK819.1 reaches its maximum of 8 bits/genome by the lasttime point, corresponding to an average mutant frequency of 5% per site. We note thatour measure of genetic diversity represents an upper estimate of true diversity in thegenome because all substitutions are considered completely independent, i.e., theknowledge of a substitution at one position does not provide any information aboutthe presence or absence or the nature of a substitution at another position. The valueof this measure would remain the same even under the extreme condition where allsubstitutions constitute a single haplotype. Therefore, in our neutral evolution simula-tions, we considered both the extreme cases: one where we have a single haplotypewith 25 substitutions and another where each substitution is free to be part of anyhaplotype (Fig. 4A). For the former case, we needed to simulate change only in thefrequency of a single allele initially present in 1% of the population. For the lattercase, we needed to observe the change in entropy in a genome of 25 independentsubstitutions, where initially all the substitutions were at 1% frequency in thepopulation. The probability of attaining the observed value of Shannon’s entropy isexpected to be higher in the case of a single mutant haplotype. We note here thatthe chance that a single mutant haplotype scenario would be applicable to oursystem is low, in light of the fact that the frequency profiles of many pairs ofmutations are uncorrelated.
We considered a relatively smaller population of bacteria for simulations (104,approximately 0.1% of our population size estimates from colony-counting experi-ments). Frequency changes become less prominent in a larger population, and so, the
FIG 3 Highly conserved amino acid residues were mutated in prolonged stationary phase. Theconservation score was calculated for each protein using Shannon’s entropy (see Materials and Methods).The width of boxes is indicative of protein size. The dashed line marks the average median score for theseproteins. Triangles mark the score for mutated residues in each protein, and orange indicates anonconservative amino acid change while blue indicates a conservative one.
Chib et al.
May/June 2017 Volume 2 Issue 3 e00059-17 msphere.asm.org 6
on July 5, 2018 by guesthttp://m
sphere.asm.org/
Dow
nloaded from
probability of mutations attaining a high frequency in a larger population under neutralevolution would be even lower than the simulated P values for a population of 104
bacteria.Under the Wright-Fisher (WF) model for neutral evolution, both cases failed to attain
the observed genetic diversity (P value of �10�3; 1,000 iterations) (Fig. 4C). Even witha 4-fold increase in the number of WF generations, the P value for a single mutanthaplotype scenario was 0.003. We then turned to the fission model, which is considereda more realistic drift model for bacterial populations. Since the number of generationscovered by our evolution experiment and the birth-death rate probability in prolonged-stationary-phase populations are unknown, we performed simulations with variousvalues of these two parameters (Fig. 4D and E). We observed an increase in theprobability of finding the observed genetic diversity with increasing number of gen-erations and birth-death probability. When all substitutions were considered inde-pendent, the P value for the observed genetic diversity with a birth-death proba-bility of 0.5 and 500 generations was 2 � 10�3 (1,000 iterations). For all otherparameter combinations, it fell below 10�3. Under the extreme, unlikely case where
FIG 4 Simulation of neutral evolution in prolonged stationary phase. (A) Schematic for Wright-Fisher and fissionmodels used for neutral evolution simulation, illustrated by running a simulation with a population of 15individuals for 3 generations and calculating Shannon’s entropy at each mutated position in the genome. Orangecircles indicate the ancestral allele; other colors indicate mutant alleles. Circles stuck together indicate all mutantalleles to be present on the same genome. (B) Change in Shannon’s entropy of the whole genome (calculated fromfrequency of observed substitutions in the population) over time for 4 replicates. (C) Distribution of maximumShannon’s entropy over 20 days for 1,000 simulations of Wright-Fisher model in comparison with the valuesobserved in 4 replicates. (D and E) Parameter scan for birth-death probability and number of generations in 20 daysunder fission model. (D) Two type. (E) Multitype.
E. coli Evolution under Prolonged Stationary Phase
May/June 2017 Volume 2 Issue 3 e00059-17 msphere.asm.org 7
on July 5, 2018 by guesthttp://m
sphere.asm.org/
Dow
nloaded from
all substitutions constitute a single haplotype, the probability of observing agenetic diversity as high as that in the prolonged-stationary-phase populations didnot remain significantly low for more than 150 generations for higher values ofbirth-death probability.
To get an upper estimate of number of generations in prolonged stationary phase,we considered the case of a mutation that appeared on day 16 at 100% frequency whileit was not observed on day 10. This mutation either could be present on day 10 butbelow the level of detection or could have appeared at any time between day 10and day 16. If we consider this mutation to have originated as late as day 13 andto have increased in numbers from 1 to 107 in 3 days, our estimate of number ofgenerations under logarithmic growth assumptions would be 1/3 � log2 107 � 8generations/day, which sums to no more than 160 generations in 20 days ofprolonged stationary phase. Given this, the probability that neutral drift can explainthe observed level of genetic diversity is low. Therefore, we can infer that thegenetic diversity of prolonged-stationary-phase populations is a signature of evo-lution under natural selection.
Functional bias in frequencies of mutations observed in prolonged stationaryphase. Since the mutations were randomly sampled, we asked if we observed any biasin relative proportions of functional classes represented in the pool of mutations. If weobserved a bias toward a functional category, it would mean that among the observedmutations, a larger-than-expected proportion is sustained in that category in prolongedstationary phase.
Using the MultiFun classification scheme, we classified all coding region mutations(n � 93, of which 10 were synonymous) into 6 functional categories based on thefunctions of their carrier genes. To have sufficient power in the statistical test, wepooled the mutations from the 4 nonmutator replicate populations and set theexperiment-wide significance threshold to 0.01.
We found that the category “Regulation” was overrepresented among the observedmutations with a P value of 0.007, whereas “Structure” was observed to be significantlyunderrepresented (Fig. 5A). Only one out of the 22 mutations in genes categorizedunder “Regulation” was synonymous. All mutations observed in regulatory genes havebeen listed in Table 2.
To test if spontaneous mutations have any inherent bias toward any functionalcategory, we performed the same analysis on data on spontaneous mutations inwild-type E. coli from a mutation accumulation study (21). We observed that in theseMA data, the class “Regulation” was only marginally overrepresented (P value of 0.03).
Five of the 50 genes observed to be mutated in prolonged-stationary-phase pop-ulations (glcF, hdfR, csiE, bax, and ychS) lacked a MultiFun annotation. We could includethe first four of these in the analysis as the required functional information wasavailable in other databases and the literature. A ychS allele variant with 3 pointmutations, of which 2 are nonsynonymous, was identified in ZK819.1 at the day 16 timepoint at 100% frequency. ychS encodes a 91-amino-acid protein for which no additionalinformation is available in E. coli databases.
Genetic parallelism during prolonged stationary phase. Among the mutationsidentified are a set of genes that appeared in multiple replicates during roughly thesame period of the evolution experiment (Fig. 5B). We have mentioned the case ofrpoS819_92 above (Fig. 2 and 5B). We observed that the components of the RNApolymerase are frequently targeted under prolonged starvation. rpoC alleles ap-peared in four evolving populations. Replicate 2 has mutations in rpoB and rpoC.Replicate 1 has mutant variants of rpoC, rpoB, and rpoA. rpoA has an A-to-G pointmutation (K271E) that has been previously characterized and shown to be crucialfor RpoA �-C-terminal domain (�-CTD) interaction with cyclic AMP (cAMP) receptorprotein (CRP) at some of the CRP-dependent promoters (23, 24). These mutants rosein frequency for a period and were in decline by the end of the evolutionexperiment (Fig. 2).
Chib et al.
May/June 2017 Volume 2 Issue 3 e00059-17 msphere.asm.org 8
on July 5, 2018 by guesthttp://m
sphere.asm.org/
Dow
nloaded from

Another case of parallel evolution is mutations in the cpdA gene. CpdA is a cAMPphosphodiesterase that hydrolyzes cAMP (25). We identified multiple alleles of cpdA infour out of five replicates, except ZK819.1. We successfully isolated two alleles of cpdAfrom ZK819.3, a T-to-C point mutation that changes leucine to proline in an alphahelix, and a 3-nucleotide deletion (position 486 to 488) that knocks off a leucineresidue which immediately precedes the stretch of metal binding histidine residues.Both these cpdA alleles were present in the rpoS819_92 background. These two cpdAalleles increase in frequency over time. The 3-nucleotide deletion (position 486 to 488)independently appeared in four replicates. These two mutations are likely to negativelyaffect the function of CpdA. Another locus of interest is the lptD (imp) gene. LptD is anessential outer membrane protein which along with LptE functions in the assembly oflipopolysaccharides at the surface of the outer membrane (26). A 21-nucleotide dele-tion at the N-terminal region of the lptD gene independently appeared in ZK819.2 andZK819.3. The deletion of 21 nucleotides results in the deletion of 7 amino acids. LikecpdA alleles, lptD alleles appeared during the later stages of the experiment.
DISCUSSION
Long-term stationary phase is a dynamic environment characterized by a multitudeof stresses with nutrient limitation as a predominant stress. Previous studies of bacterialevolution in long-term stationary phase have shown the continuous emergence ofvariants which outcompete their parents (3, 11). A few such variants have beengenetically identified (11, 14–16). However, much of the variability has been described
FIG 5 Functional bias among mutations observed in prolonged stationary phase. (A) The top plot showsdeviation (log2 fold change) from the number of mutations expected in each functional category basedon its relative size (total nucleotides) in the genome. The bottom plot shows corresponding �log10 Pvalues (adjusted for multiple testing with Holm-Bonferroni method) for over- and underrepresentation.The “Regulation” category appears to be overrepresented in prolonged stationary phase; no suchsignificant bias was observed for spontaneous mutations under the neutral mutation accumulationexperiment of Lee et al. (21). (B) Binary matrix for genes mutated in four replicates; gray marks theirpresence. The genes highlighted in blue type have regulatory functions.
E. coli Evolution under Prolonged Stationary Phase
May/June 2017 Volume 2 Issue 3 e00059-17 msphere.asm.org 9
on July 5, 2018 by guesthttp://m
sphere.asm.org/
Dow
nloaded from

phenotypically, for example, by examination of colony morphotypes (20). These haveindicated that E. coli populations in long-term stationary phase are neither homoge-neous nor static. In the present study, we have used population genome sequencing toreinforce this at a genetic level.
We show that genetic diversity increases over time in long-term stationary-phasepopulations. It has been suggested that stress could accelerate the generation ofgenetic diversity by inducing the expression of error-prone DNA polymerases and areduction in certain repair activities or by selecting for genetic variants that result inmutator phenotypes (27–37). In our study, one out of the five populations displayed astrong mutator phenotype. The contribution, if any, of stress-induced mutagenesis tothe patterns that we observe is an open question. The expression of various error-proneDNA polymerases is dependent on RpoS (29, 31). Attenuated status of RpoS in ourlong-term stationary-phase cells might dampen the argument in favor of selectiveinduction of these DNA polymerases and their role in generating genetic diversity.Moreover, we have shown that the base pair substitution rates in nonmutator lines inprolonged stationary phase are not significantly different from the underlying muta-
TABLE 2 Some mutations of interest with relevant details and maximum frequency over28 days in each replicatea
Gene Position Mutation Annotation
Maximum frequency (%)in replicate:
1 2 3 5
cpdA 3175000 Δ3 bp Coding (488–490/828 ntb) 0 15.9 34.7 17cpdA 3174825 G¡A S222L (TCG¡TTG) 0 41.1 0 0cpdA 3175372 Δ3 bp Coding (116–118/828 nt) 0 0 5.4 0cpdA 3175050 A¡G L147P (CTG¡CCG) 0 0 25.5 0cpdA 3175134 Δ1 bp Coding (356/828 nt) 0 0 1.8 0cpdA 3174868 �CTC Coding (622/828 nt) 0 0 0 3.9csiE 2664350 T¡C L87S (TTA¡TCA) 0 0 0 3.1cspC 1909037 C¡T G38D (GGT¡GAT) 0 0 6.1 0dcuS 4355098 G¡T L415M (CTG¡ATG) 0 0 1.9 0dgsA 1669599 Δ1 bp Coding (680/1,221 nt) 0 100 0 0glpR 4079921 C¡T R38C (CGC¡TGC) 9.9 0 0 0glpR 4080435 C¡A S209* (TCG¡TAG) 0 2.7 0 0hdfR 3689274 G¡A W187* (TGG¡TGA) 0 0 0 1.4hfq 4405087 T¡A D40E (GAT¡GAA) 0 26.7 0 0hns 1294404 T¡A K32N (AAA¡AAT) 0 6.8 0 0putA 1078290 G¡T R339S (CGC¡AGC) 0 0 0 9.8putA 1078496 G¡T A270D (GCC¡GAC) 0 0 0 10.8rpoS 2865274 �46 bp Coding (817/876 nt) 70.1 72.5 72.2 70.4rpoS 2865278 �92 bp Coding (813/876 nt) 16.8 22.5 51.2 21.9rpoS 2865228 A¡G L288P (CTG¡CCG) 5.8 2.7 3.3 6.8topA 1335341 G¡T W860C (TGG¡TGT) 0 0 2.2 0ubiB 3615064 C¡A L464L (CTG¡CTT) 0 0 3.5 0rpoA 4200197 A¡G K271E (AAA¡GAA) 36.1 0 0 0rpoB 3451634 T¡A Q1268L (CAG¡CTG) 12.5 0 0 0rpoB 3453305 T¡A D711V (GAC¡GTC) 4.9 0 0 0rpoB 3451607 G¡A A1277V (GCG¡GTG) 0 6.8 0 0rpoC 3449962 T¡C Y457C (TAT¡TGT) 4.4 0 0 0rpoC 3449851 G¡A A494V (GCG¡GTG) 15.9 0 0 0rpoC 3450056 C¡A A426S (GCA¡TCA) 22.3 0 0 62rpoC 3449257 C¡G R692P (CGT¡CCT) 0 19.8 2.6 0sdhB 758440 C¡A F110L (TTC¡TTA) 100 0 0 0sdhB 758300 G¡A G64S (GGT¡AGT) 1.7 0 0 9.9sdhB 758562 T¡A L151H (CTC¡CAC) 16 0 0 0sdhB 758579 A¡T T157S (ACC¡TCC) 1.8 0 0 0sdhB 758631 G¡T G174V (GGC¡GTC) 1.2 0 0 0sdhB 758568 C¡A A153E (GCA¡GAA) 2.5 0 0 0sdhB 758628 C¡T A173V (GCA¡GTA) 10.8 0 0 0sdhB 758450 T¡A Y114N (TAT¡AAT) 0 0 0 100aThese mutations include mutations in genes classified as regulatory in MultiFun and in genes involved inRNA polymerization.
bnt, nucleotides.
Chib et al.
May/June 2017 Volume 2 Issue 3 e00059-17 msphere.asm.org 10
on July 5, 2018 by guesthttp://m
sphere.asm.org/
Dow
nloaded from

tional spectrum of wild-type Escherichia coli by making comparisons with data from amutation accumulation study, which reveals the spectrum of mutations that can occurgiven neutral drift (minimal selection) under the growth conditions tested (21). Thisobservation suggests that the substitutions in prolonged stationary phase are gener-ated by mutational processes that are similar to those tested in the MA study. Thiscomparison of prolonged stationary phase with MA was not aimed at drawing anysimilarities between these two experimental systems. At this time, it is unclear how theequivalent of an MA experiment that samples conditions closer to those observed inprolonged stationary phase can be designed.
Can the level of genetic diversity observed in our study be explained by neutraldrift, or was it achieved under selection? The role of neutral evolution versus naturalselection in the evolution of genetic diversity is a subject of great debate, especially inview of arguments from Michael Lynch that even complex regulatory network archi-tectures can evolve purely by drift (38). A recent study of mutations in an exponential-phase laboratory evolution experiment had used parameters such as the number ofnonsynonymous versus synonymous variations to indicate that many of the mutationsobserved in the study are under selection (39). The relatively smaller numbers ofmutations in our nonmutator lines, and the variability in such a parameter across lines,did not permit a similar analysis. However, a comparison of the genetic diversity thatwe had observed against what would be predicted by two different models ofevolution under pure neutral drift reinforced the view that evolution of geneticdiversity in long-term stationary phase is driven by selection. Further, many nonsyn-onymous mutations that we see will result in a switch in the physiochemical charac-teristics of residues that are conserved to a high degree across bacteria. The prevalenceof the repeated occurrence of a large fraction of mutations in certain genes acrossmultiple lines might also be evidence for selection favoring these variants. A recentstudy has shown that populations evolve rapidly under complex environmental con-ditions involving a variety of stresses wherein genetic parallelism appears to be aprevalent feature (17). We observed a strong enrichment of mutations in regulatorygenes, which was not the case for a pool of spontaneous mutations under minimalselection (MA data). Moreover, several of these regulators were independently mutatedin more than one replicate population. This may suggest strong genetic parallelism andselection favoring mutations with pleiotropic effects. This includes further duplicationswithin rpoS. One or more RNA polymerase subunit genes were frequently mutated infour of the five replicates, suggesting global changes in transcription.
A strong case of this genetic parallelism is reflected at the cpdA locus. The appearanceof various cpdA alleles with unique mutations in four of the five populations suggests thatthere is a strong selection for cpdA genetic variants. cAMP-CRP and RpoS control the twolargest regulons in E. coli by controlling alternate carbon utilization and general stressresponse during stationary phase (40–43). However, the interaction between these regu-lators is unclear. Frequent mutations in rpoS and the cpdA locus in our study may suggestremodulation of regulatory interactions between these two regulatory networks, generat-ing adaptation under prolonged stationary phase. Experiments to evaluate the fitness effectof rpoS and cpdA mutations and the underlying molecular mechanisms are under way inour laboratory. Evolution by variation in regulatory networks is rapidly gaining groundthrough various examples in natural populations as well as in laboratory evolution, and thepresent study provides yet another example in this field.
MATERIALS AND METHODSEvolution experiment. Five biological replicate cultures of E. coli K-12 strain ZK819 —a derivative of
W3110 —were seeded at a 1:1,000 dilution in lysogeny broth (LB), from overnight-grown cultures. Thestarting culture volume was 200 ml in a 500-ml-capacity flask. The incubator shaker was set at 37°C and200 rpm. To compensate for evaporation, 1 ml of sterile water was added every alternate day. Additionof water did not compensate for the culture volumes withdrawn for making glycerol stock, plate cellcount, and genomic DNA isolation. Population size for each replicate was tracked by serial dilutionplating of 0.1 ml of the culture every 24 h during the experiment. One milliliter of culture was drawn fromthe evolving population each day, and duplicate glycerol stocks—for storage at �80°C—were made.One milliliter of sample was drawn from each evolving population during the first-week time points to
E. coli Evolution under Prolonged Stationary Phase
May/June 2017 Volume 2 Issue 3 e00059-17 msphere.asm.org 11
on July 5, 2018 by guesthttp://m
sphere.asm.org/
Dow
nloaded from
extract genomic DNA, and 5 ml was drawn for the rest of the 3-week time points for whole-genomeresequencing. Two hundred nanograms of genomic DNA was sheared, of which 50 ng was used forlibrary preparation.
Sequencing and data analysis. Genomic DNA was isolated from a sample of the evolving popu-lation at days 0, 2, 4, 6, 10, 16, 22, and 28. The isolation was performed using the GenElute bacterialgenomic DNA kit (Sigma-Aldrich), according to the manufacturer’s protocol. Sequencing libraries wereprepared using Illumina’s TruSeq Nano DNA LT library preparation kit. Whole-genome sequencing wasperformed at the Centre for Cellular and Molecular Platforms (C-CAMP) on the Illumina HiSeq1000platform according to the manufacturer’s instructions. The mean number of 101-base-long readsmapped to the reference genome for 40 sequenced samples was 13.45 million, resulting in a meancoverage of 292�.
The reads were mapped to the reference E. coli genome W3110 (GenBank accession no.NC_007779.1), and putative single nucleotide polymorphisms (SNPs), small indels, and structural variantswere called using the breseq pipeline, which uses Bowtie for sequence alignment (44, 45). Variant callingfor the founder population was done to identify preexisting mutations. breseq was run with its defaultparameters (using the -p option to identify mutations covered by only a subset of reads), and only thosemutations predicted with high confidence (under the heading “predicted mutations”) were used forfurther analysis. Details of mutations identified through breseq for all samples can be accessed from thewebsite http://bugbears.ncbs.res.in/ZK819_ltsp_evol/. Mutations observed to be present at 100% fre-quency in all samples were considered parental mutations and were excluded from the analysis (seeTable S1 in the supplemental material). The following mutants were validated by Sanger sequencingusing specific primers: cpdA Δ3 (486 to 488), cpdA (L147P), rpoS819_92, rpoS819_46�92, rpoA (K271E),and imp Δ21 (Table 2). All subsequent data analyses on this set of mutations were performed using thestatistical programming language R (v.3.3.0).
Scoring functional conservation for nonsynonymous mutations. Sites carrying nonsynonymousmutations in protein-coding genes were tested for their level of conservation across gammaproteobac-teria. Amino acids were grouped into six physicochemical classes (aliphatic, aromatic, polar, positive,negative, and special amino acids) as described earlier (45) and listed in Table S2. A mutation wasclassified as conservative if the substitute amino acid was in the same physicochemical class as theoriginal. Only those mutations which were observed at a frequency higher than 5% in any sample wereselected for this analysis.
Homolog search for these proteins was carried out using phmmer (HMMER 3.1b1) across 246reference proteomes listed under Gammaproteobacteria in UniProtKB (46, 47). The ortholog call wasbased on the bidirectional best-hit method using an inclusion threshold of 10�10 (48). A global alignmentof each ortholog was performed with the query sequence using the Needleman-Wunsch algorithmimplemented in EMBOSS, and orthologs that shared more than 50% identity were selected (EMBOSS:6.6.0.0) (49). A multiple sequence alignment was built using these orthologs and then used to score theconservation of each residue of the protein. MUSCLE software (v.3.8.31) was used to build the multiplesequence alignment (50). Shannon’s entropy (22), measuring the physicochemical diversity at eachresidue position across a protein’s orthologs, was calculated as follows:
H � ��i�1
6
fi � log2�fi�
where fi represents the frequency of each of the six categories of amino acids considered here.This was then transformed to a conservation score using the following expression:
S �Hmax � H
Hmax � Hmin
where Hmax � Shannon’s entropy of the least conserved residue of the protein and Hmin � Shannon’sentropy of the most conserved residue of the protein.
Functional class overrepresentation test. A functional classification of all genes in which codingregion substitutions and indels were found was done using the MultiFun classification scheme (51). Sixbroad functional categories—namely, metabolism, information transfer, regulation, transport, cell pro-cesses, and cell structure—were considered. Only those genes listed in both MultiFun and the “Ecogene”database were considered for the analysis. This excludes 81 of the 3,398 genes functionally annotated inMultiFun. Out of the remaining 3,317, 3,041 fell in the six functional categories mentioned above and therest were categorized as “Others.”
A statistical overrepresentation test was performed (52). The sum total of the length of all genes ina functional category was used to get the probability of a mutation occurring in any gene of thatfunctional category in the genome. The P values were calculated under the binomial probabilitydistribution for the proportion of mutations observed in genes for each functional category. The P valueswere adjusted for multiple testing using the Holm-Bonferroni method.
Genetic diversity and models of neutral evolution. The genetic diversity was measured in termsof Shannon’s entropy (22) of the genome. Shannon’s entropy at each substitution site of the genome wascalculated as:
H � � �i��m,a�
fi � log2�fi�
where fi represents the fraction of genomes in the population with a mutant (m) or the ancestral (a) baseat the site of substitution.
Chib et al.
May/June 2017 Volume 2 Issue 3 e00059-17 msphere.asm.org 12
on July 5, 2018 by guesthttp://m
sphere.asm.org/
Dow
nloaded from
The Shannon’s entropy of the genome was then calculated as:
G � �i�1
n
Hi
where Hi represents the Shannon’s entropy at each substitution site and n represents the total numberof observed substitution sites in the population.
Neutral evolution simulations were performed under two models of genetic drift in a bacterialpopulation of constant size with no recombination or de novo generation of novel mutations. The twomodels—namely, the Wright-Fisher (53, 54) and the fission (55) models— differ from one another in therate at which the frequency of one type of individuals changes over time in the population. For bothmodels, the change in genetic diversity over time was simulated under a two-type or a multitype system,as defined below.
In a two-type system, all observed substitutions constitute a single mutant haplotype. A haplotypeis defined here as a unique copy of the bacterial chromosome that is identified by a set of SNPs in apopulation. The change in frequency of the mutant over a span of 20 days, if initially present at 1%, wassimulated, and the fraction of simulations in which the mutant attained a frequency of 5% or above wasdefined as being equivalent to the P value for the observed genetic diversity.
In a multitype system, substitutions are distributed over several haplotypes. If the number ofsubstitutions is much smaller than the population size, then each substitution is likely to represent onehaplotype. The overall change in entropy was simulated by building an ensemble of genomes of lengthequal to the number of substituted sites. The simulation was begun by randomly selecting 1% ofgenomes to carry a substitution at each site. The ensemble was rebuilt after every generation basedon the number of copies that each haplotype would leave for the next generation. Any site with amutant frequency lower than 1% was considered to have zero entropy. To compensate for the lossof entropy from about half of the substituted sites, the P value was determined by the fraction ofsimulations in which the ensemble attained a diversity equal to or more than half of the observedgenetic diversity.
Under the Wright-Fisher model, the number of descendants that each individual leaves in thenext generation is approximately Poisson distributed with an average of 1 descendant/generation.With only two types of individuals, carrying either an ancestral or the mutant allele, the frequencyof occurrence of each type in any given generation can be calculated from a binomial sampling ofalleles from the previous generation. The maximum number of offspring left by any individual at theend of a generation is solely limited by the population size. Note that a generation here is notequivalent to the bacterial doubling time but to any span of time at the end of which the populationis observed to be constant.
Under the fission model, the population size is maintained, as in any generation the number ofbacteria dividing is equal to the number of bacteria perishing while the rest of the population is allowedto continue to the next generation without dividing. The birth-death probability and the number ofgenerations govern the extent of diversity that a population attains in the given duration of time.
Accession number(s). Genomic deep-sequencing data can be accessed from the NCBI SequenceRead Archive under accession number SRP094816.
SUPPLEMENTAL MATERIALSupplemental material for this article may be found at https://doi.org/10.1128/
mSphere.00059-17.TABLE S1, PDF file, 0.1 MB.TABLE S2, PDF file, 0.04 MB.
ACKNOWLEDGMENTSThis work was supported by DBT grant BT/PR3695/BRB/10/979/2011 and Ramanujan
fellowship SR/S2/RJN-49/2010 to A.S.N.S. A.S.N.S. is supported by a Wellcome Trust-DBTIndia Alliance Intermediate fellowship (IA/I/16/2/502711). S.C. is supported by DST-SERByoung scientist grant SB/YS/LS-148/2014.
Illumina sequencing was performed at the Centre for Cellular and Molecular Plat-forms (C-CAMP), Bangalore, India.
REFERENCES1. Savageau MA. 1983. Escherichia coli habitats, cell types, and molecular
mechanisms of gene control. Am Nat 122:732–744. https://doi.org/10.1086/284168.
2. Tenaillon O, Skurnik D, Picard B, Denamur E. 2010. The populationgenetics of commensal Escherichia coli. Nat Rev Microbiol 8:207–217.https://doi.org/10.1038/nrmicro2298.
3. Finkel SE. 2006. Long-term survival during stationary phase: evolutionand the GASP phenotype. Nat Rev Microbiol 4:113–120. https://doi.org/10.1038/nrmicro1340.
4. Zinser ER, Kolter R. 2004. Escherichia coli evolution during stationaryphase. Res Microbiol 155:328 –336. https://doi.org/10.1016/j.resmic.2004.01.014.
5. Sezonov G, Joseleau-Petit D, D’Ari R. 2007. Escherichia coli physiology inLuria-Bertani broth. J Bacteriol 189:8746 – 8749. https://doi.org/10.1128/JB.01368-07.
6. Wang CH, Koch AL. 1978. Constancy of growth on simple and complexmedia. J Bacteriol 136:969 –975.
7. Ferenci T. 2005. Maintaining a healthy SPANC balance through regula-
E. coli Evolution under Prolonged Stationary Phase
May/June 2017 Volume 2 Issue 3 e00059-17 msphere.asm.org 13
on July 5, 2018 by guesthttp://m
sphere.asm.org/
Dow
nloaded from
tory and mutational adaptation. Mol Microbiol 57:1– 8. https://doi.org/10.1111/j.1365-2958.2005.04649.x.
8. Kram KE, Finkel SE. 2014. Culture volume and vessel affect long-termsurvival, mutation frequency, and oxidative stress of Escherichia coli.Appl Environ Microbiol 80:1732–1738. https://doi.org/10.1128/AEM.03150-13.
9. Kram KE, Finkel SE. 2015. Rich medium composition affects Escherichiacoli survival, glycation, and mutation frequency during long-term batchculture. Appl Environ Microbiol 81:4442– 4450. https://doi.org/10.1128/AEM.00722-15.
10. McFall E, Newman EB. 1996. Amino acids as carbon sources, p 358 –379.In Neidhardt FC, Curtiss R, III, Ingraham JL, Lin ECC, Low KB, MagasanikB, Reznikoff WS, Riley M, Schaechter M, Umbarger HE (ed), Escherichiacoli and Salmonella: cellular and molecular biology, 2nd ed, vol 1. ASMPress, Washington, DC.
11. Zambrano MM, Siegele DA, Almirón M, Tormo A, Kolter R. 1993. Micro-bial competition: Escherichia coli mutants that take over stationary phasecultures. Science 259:1757–1760. https://doi.org/10.1126/science.7681219.
12. Martínez-García E, Tormo A, Navarro-Lloréns JM. 2003. GASP phenotype:presence in enterobacteria and independence of sigmas in its acquisi-tion. FEMS Microbiol Lett 225:201–206.
13. Silby MW, Giddens SR, Mahanty HK. 2005. Mutation of a LysR-typeregulator of antifungal activity results in a growth advantage in station-ary phase phenotype in Pseudomonas aureofaciens PA147-2. Appl Envi-ron Microbiol 71:569 –573. https://doi.org/10.1128/AEM.71.1.569-573.2005.
14. Chib S, Mahadevan S. 2012. Involvement of the global regulator H-NS inthe survival of Escherichia coli in stationary phase. J Bacteriol 194:5285–5293. https://doi.org/10.1128/JB.00840-12.
15. Madan R, Kolter R, Mahadevan S. 2005. Mutations that activate the silentbgl operon of Escherichia coli confer a growth advantage in stationaryphase. J Bacteriol 187:7912–7917. https://doi.org/10.1128/JB.187.23.7912-7917.2005.
16. Zinser ER, Kolter R. 2000. Prolonged stationary-phase incubation selectsfor lrp mutations in Escherichia coli K-12. J Bacteriol 182:4361– 4365.https://doi.org/10.1128/JB.182.15.4361-4365.2000.
17. Kram KE, Geiger C, Ismail WM, Lee H, Tang H, Foster PL, Finkel SE. 2017.Adaptation of Escherichia coli to long-term serial passage in complexmedium: evidence of parallel evolution. mSystems 2:e00192-16. https://doi.org/10.1128/mSystems.00192-16.
18. Farrell MJ, Finkel SE. 2003. The growth advantage in stationary-phasephenotype conferred by rpoS mutations is dependent on the pH andnutrient environment. J Bacteriol 185:7044 –7052. https://doi.org/10.1128/JB.185.24.7044-7052.2003.
19. Zinser ER, Kolter R. 1999. Mutations enhancing amino acid catabolismconfer a growth advantage in stationary phase. J Bacteriol 181:5800 –5807.
20. Finkel SE, Kolter R. 1999. Evolution of microbial diversity during pro-longed starvation. Proc Natl Acad Sci U S A 96:4023– 4027. https://doi.org/10.1073/pnas.96.7.4023.
21. Lee H, Popodi E, Tang H, Foster PL. 2012. Rate and molecular spectrumof spontaneous mutations in the bacterium Escherichia coli as deter-mined by whole-genome sequencing. Proc Natl Acad Sci U S A 109:E2774 –E2783. https://doi.org/10.1073/pnas.1210309109.
22. Shannon CE. 1948. A mathematical theory of communication. Bell SystTech J 27:623– 656. https://doi.org/10.1002/j.1538-7305.1948.tb00917.x.
23. Savery NJ, Lloyd GS, Busby SJW, Thomas MS, Ebright RH, Gourse RL.2002. Determinants of the C-terminal domain of the Escherichia coli RNApolymerase alpha subunit important for transcription at class I cyclicAMP receptor protein-dependent promoters. J Bacteriol 184:2273–2280.https://doi.org/10.1128/JB.184.8.2273-2280.2002.
24. Thomas MS, Glass RE. 1991. Escherichia coli rpoA mutation which impairstranscription of positively regulated systems. Mol Microbiol 5:2719–2725.https://doi.org/10.1111/j.1365-2958.1991.tb01980.x.
25. Imamura R, Yamanaka K, Ogura T, Hiraga S, Fujita N, Ishihama A, Niki H.1996. Identification of the cpdA gene encoding cyclic 3=,5=-adenosinemonophosphate phosphodiesterase in Escherichia coli. J Biol Chem 271:25423–25429. https://doi.org/10.1074/jbc.271.41.25423.
26. Braun M, Silhavy TJ. 2002. Imp/OstA is required for cell envelope bio-genesis in Escherichia coli. Mol Microbiol 45:1289 –1302. https://doi.org/10.1046/j.1365-2958.2002.03091.x.
27. Layton JC, Foster PL. 2003. Error-prone DNA polymerase IV is controlled
by the stress-response sigma factor, RpoS, in Escherichia coli. Mol Micro-biol 50:549 –561. https://doi.org/10.1046/j.1365-2958.2003.03704.x.
28. Galhardo RS, Do R, Yamada M, Friedberg EC, Hastings PJ, Nohmi T,Rosenberg SM. 2009. DinB upregulation is the sole role of the SOSresponse in stress-induced mutagenesis in Escherichia coli. Genetics182:55– 68. https://doi.org/10.1534/genetics.109.100735.
29. Lombardo MJ, Aponyi I, Rosenberg SM. 2004. General stress responseregulator RpoS in adaptive mutation and amplification in Escherichia coli.Genetics 166:669 – 680. https://doi.org/10.1534/genetics.166.2.669.
30. Foster PL. 1999. Mechanisms of stationary phase mutation: a decade ofadaptive mutation. Annu Rev Genet 33:57– 88. https://doi.org/10.1146/annurev.genet.33.1.57.
31. Frisch RL, Su Y, Thornton PC, Gibson JL, Rosenberg SM, Hastings PJ.2010. Separate DNA Pol II- and Pol IV-dependent pathways of stress-induced mutation during double-strand-break repair in Escherichia coliare controlled by RpoS. J Bacteriol 192:4694 – 4700. https://doi.org/10.1128/JB.00570-10.
32. Rosenberg SM, Thulin C, Harris RS. 1998. Transient and heritable muta-tors in adaptive evolution in the lab and in nature. Genetics 148:1559 –1566.
33. Maharjan RP, Liu B, Li Y, Reeves PR, Wang L, Ferenci T. 2013. Mutationaccumulation and fitness in mutator subpopulations of Escherichia coli.Biol Lett 9:20120961. https://doi.org/10.1098/rsbl.2012.0961.
34. Barrick JE, Yu DS, Yoon SH, Jeong H, Oh TK, Schneider D, Lenski RE, KimJF. 2009. Genome evolution and adaptation in a long-term experimentwith Escherichia coli. Nature 461:1243–1247. https://doi.org/10.1038/nature08480.
35. Shaver AC, Dombrowski PG, Sweeney JY, Treis T, Zappala RM,Sniegowski PD. 2002. Fitness evolution and the rise of mutator alleles inexperimental Escherichia coli populations. Genetics 162:557–566.
36. Notley-McRobb L, Seeto S, Ferenci T. 2002. Enrichment and eliminationof mutY mutators in Escherichia coli populations. Genetics 162:1055–1062.
37. Gutierrez A, Laureti L, Crussard S, Abida H, Rodríguez-Rojas A, BlázquezJ, Baharoglu Z, Mazel D, Darfeuille F, Vogel J, Matic I. 2013. �-Lactamantibiotics promote bacterial mutagenesis via an RpoS-mediated reduc-tion in replication fidelity. Nat Commun 4:1610. https://doi.org/10.1038/ncomms2607.
38. Lynch M. 2007. The evolution of genetic networks by non-adaptiveprocesses. Nat Rev Genet 8:803– 813. https://doi.org/10.1038/nrg2192.
39. Tenaillon O, Barrick JE, Ribeck N, Deatherage DE, Blanchard JL, DasguptaA, Wu GC, Wielgoss S, Cruveiller S, Médigue C, Schneider D, Lenski RE.2016. Tempo and mode of genome evolution in a 50,000-generationexperiment. Nature 536:165–170. https://doi.org/10.1038/nature18959.
40. Martínez-Antonio A, Collado-Vides J. 2003. Identifying global regulatorsin transcriptional regulatory networks in bacteria. Curr Opin Microbiol6:482– 489. https://doi.org/10.1016/j.mib.2003.09.002.
41. Hengge-Aronis R. 1993. Survival of hunger and stress: the role of rpoS inearly stationary phase gene regulation in E. coli. Cell 72:165–168. https://doi.org/10.1016/0092-8674(93)90655-A.
42. Landini P, Egli T, Wolf J, Lacour S. 2014. Sigmas, a major player in theresponse to environmental stresses in Escherichia coli: role, regulationand mechanisms of promoter recognition: gene regulation by the sig-mas protein in E. coli. Environ Microbiol Rep 6:1–13. https://doi.org/10.1111/1758-2229.12112.
43. Franchini AG, Ihssen J, Egli T. 2015. Effect of global regulators RpoS andcyclic-AMP/CRP on the catabolome and transcriptome of Escherichia coliK12 during carbon- and energy-limited growth. PLoS One 10:e0133793.https://doi.org/10.1371/journal.pone.0133793.
44. Deatherage DE, Barrick JE. 2014. Identification of mutations inlaboratory-evolved microbes from next-generation sequencing data us-ing breseq. Methods Mol Biol 1151:165–188. https://doi.org/10.1007/978-1-4939-0554-6_12.
45. Langmead B, Trapnell C, Pop M, Salzberg SL. 2009. Ultrafast and memory-efficient alignment of short DNA sequences to the human genome.Genome Biol 10:R25. https://doi.org/10.1186/gb-2009-10-3-r25.
46. The UniProt Consortium. 2015. UniProt: a hub for protein information.Nucleic Acids Res 43:D204 –D212. https://doi.org/10.1093/nar/gku989.
47. Karplus K, Barrett C, Hughey R. 1998. Hidden Markov models for detect-ing remote protein homologies. Bioinformatics 14:846 – 856. https://doi.org/10.1093/bioinformatics/14.10.846.
48. Overbeek R, Fonstein M, D’Souza M, Pusch GD, Maltsev N. 1999. The useof gene clusters to infer functional coupling. Proc Natl Acad Sci U S A96:2896 –2901. https://doi.org/10.1073/pnas.96.6.2896.
49. McWilliam H, Li W, Uludag M, Squizzato S, Park YM, Buso N, Cowley AP,
Chib et al.
May/June 2017 Volume 2 Issue 3 e00059-17 msphere.asm.org 14
on July 5, 2018 by guesthttp://m
sphere.asm.org/
Dow
nloaded from

Lopez R. 2013. Analysis Tool Web services from the EMBL-EBI. NucleicAcids Res 41:W597–W600. https://doi.org/10.1093/nar/gkt376.
50. Edgar RC. 2004. MUSCLE: multiple sequence alignment with high accu-racy and high throughput. Nucleic Acids Res 32:1792–1797. https://doi.org/10.1093/nar/gkh340.
51. Serres MH, Riley M. 2000. MultiFun, a multifunctional classificationscheme for Escherichia coli K-12 gene products. Microb Comp Genomics5:205–222. https://doi.org/10.1089/omi.1.2000.5.205.
52. Mi H, Muruganujan A, Casagrande JT, Thomas PD. 2013. Large-scale
gene function analysis with the PANTHER classification system. NatProtoc 8:1551–1566. https://doi.org/10.1038/nprot.2013.092.
53. Fisher RA. 1930. The genetical theory of natural selection: a completevariorum edition. Oxford University Press, Oxford, United Kingdom.
54. Wright S. 1990. Evolution in Mendelian populations. 1931. Bull Math Biol52:241–295.
55. Schierup MH, Wiuf C. 2010. The coalescent of bacterial populations, p1–18. In Robinson DA, Falush D, Feil EJ (ed), Bacterial population genet-ics in infectious disease. John Wiley & Sons, Hoboken, NJ.
E. coli Evolution under Prolonged Stationary Phase
May/June 2017 Volume 2 Issue 3 e00059-17 msphere.asm.org 15
on July 5, 2018 by guesthttp://m
sphere.asm.org/
Dow
nloaded from