genome-wide mapping of rna pol-ii promoter usage in mouse
TRANSCRIPT

Genome-wide mapping of RNA Pol-II promoterusage in mouse tissues by ChIP-seqHao Sun1, Jiejun Wu2, Priyankara Wickramasinghe1, Sharmistha Pal1, Ravi Gupta1,
Anirban Bhattacharyya1, Francisco J. Agosto-Perez1, Louise C. Showe1,
Tim H.-M. Huang2 and Ramana V. Davuluri1,*
1Center for Systems and Computational Biology, Molecular and Cellular Oncogenesis Program, The WistarInstitute, 3601 Spruce Street, Philadelphia, PA 19104 and 2Human Cancer Genetics, Comprehensive CancerCenter, Dept. of Mol. Virology, Immunology & Med. Genetics, Ohio State University, 460 W 12th Avenue,BRT, Columbus, OH 43210, USA
Received May 28, 2010; Revised August 13, 2010; Accepted August 17, 2010
ABSTRACT
Alternative promoters that are differentially used invarious cellular contexts and tissue types add to thetranscriptional complexity in mammalian genome.Identificationofalternativepromotersandtheannota-tion of their activity in different tissues is one of themajorchallenges inunderstanding the transcriptionalregulationofthemammaliangenesandtheirisoforms.Todeterminetheuseofalternativepromotersindiffer-ent tissues, we performed ChIP-seq experimentsusing antibody against RNA Pol-II, in five adult mousetissues (brain, liver, lung, spleen and kidney). Ouranalysis identified 38 639 Pol-II promoters, including12 270 novel promoters, for both protein coding andnon-coding mouse genes. Of these, 6384 promotersare tissue specific which are CpG poor and we findthat only 34% of the novel promoters are located inCpG-rich regions, suggesting that novel promotersare mostly tissue specific. By identifying the Pol-IIbound promoter(s) of each annotated gene in a giventissue, we found that 37% of the protein coding genesuse alternative promoters in the five mouse tissues.The promoter annotations and ChIP-seq data pre-sented here will aid ongoing efforts of characterizinggene regulatory regions in mammalian genomes.
INTRODUCTION
Recent analyses of mammalian genomes and microarraydata suggest that the majority of mammalian genes
generate multiple transcripts and protein isoforms withdistinct functional roles. This transcript diversity isgenerated, in part, through the use of alternative pro-moters (1) and alternative splicing (2), which producepre-mRNA and mRNA isoforms respectively. The useof alternative promoters plays a fundamental role inregulating different gene isoforms, e.g. LEF1, TP73,RUNX1 and MYC in various mammalian tissues and atdifferent developmental stages. For example, in case ofLEF1, the protein isoforms generated from the two pro-moters perform opposing biological functions. While thefull-length LEF1, transcribed from upstream promoter,interacts with b-catenin and regulates Wnt target genes,the shorter isoform is incapable of binding b-catenin andsuppresses the regulation of Wnt targets through b-catenin(3). Moreover, activation of upstream promoter andsilencing of the internal promoter is observed in mostcolon cancers (4). Therefore, identifying primary and al-ternative gene promoters in various normal tissues iscritical to understanding a diversity of physiologicalprocesses associated with normal and diseased states indifferent tissues. The advent of high-throughput moleculartechnologies and computational methods to support thistechnology has significantly improved our ability toannotate mammalian gene regulatory regions.High-throughput technologies, such as cap analysis geneexpression (CAGE); chromatin immunoprecipitation(ChIP) followed by microarray analysis (ChIP–chip);ChIP coupled with pair-end ditag sequencing analysis(ChIP-PET) (5,6); and, more recently, ChIP coupledwith sequencing (ChIP-seq) (7) are enabling thegenome-wide identification of alternative promoters andtheir patterns of use. This information will help us to
*To whom correspondence should be addressed. Tel: +215 495 6903; Fax: +215 495 6848; Email: [email protected] address:Hao Sun, Li Ka Shing Institute of Health Sciences and Department of Chemical Pathology, The Chinese University of Hong Kong, Prince of WalesHospital, Shatin, New Territories, Hong Kong SAR, China.
The authors wish it to be known that, in their opinion, the first five authors should be regarded as joint First Authors.
190–201 Nucleic Acids Research, 2011, Vol. 39, No. 1 Published online 14 September 2010doi:10.1093/nar/gkq775
� The Author(s) 2010. Published by Oxford University Press.This is an Open Access article distributed under the terms of the Creative Commons Attribution Non-Commercial License (http://creativecommons.org/licenses/by-nc/2.5), which permits unrestricted non-commercial use, distribution, and reproduction in any medium, provided the original work is properly cited.
Downloaded from https://academic.oup.com/nar/article-abstract/39/1/190/2409650by gueston 13 February 2018

understand the use of alternative promoters in a widevariety of cell/tissue types, different developmentalstages and their misuse in disease conditions.
Growing evidence suggests that about half of the mam-malian genes have multiple alternative promoters that canspan up to thousands of bases (8–12). For example, acomprehensive analyses of 1% of the human genome in16 diverse human cell lines, using transient transfectionreporter assays demonstrated the presence of functionalalternative promoters in >20% of genes (12). Similarly,it has been reported that 35% of 100 human erythroidgenes examined have alternative promoters and that24% of active genes in human fibroblast cells possessmultiple promoters (13). This is quite a high percentageof genes showing multiple promoter usage in a single bio-logical process or cell type suggesting extensive use ofmultiple promoters by mammalian genes. The knowledgeof alternative promoter usage in different mammaliantissues is very limited and cannot be addressed withouthigh-resolution genome-wide mapping of the promoterregions. However, the high-throughput approaches, suchas CAGE (14), deepCAGE (15), ChIP–chip (16,17) orChIP-seq (7), to annotate promoters at genome levelneed to be applied with caution because of the inherentproblems with each method. For example, cytoplasmicenzyme complexes can add caps to 50-monophosphateRNA molecules generated by ribonuclease cleavage (18),and hence CAGE tags could represent 50 ends of RNAsgenerated by cleavage and subsequent re-capping (19).CAGE analysis can also capture some non-capped tran-scripts that may represent cleaved decaying mRNA (20).Furthermore, a large number of CAGE tags aredistributed throughout the gene transcripts rendering itinefficient as a sole source of promoter identifier.Previously, we (16) and others (17) have performedChIP–chip analyses to identify the activity of mammalianpromoters across different cell and tissue types. However,ChIP–chip requires design of genome-wide microarray toprobe the ChIP-bound DNA sequences. Additionally,with either ChIP-chip or ChIP-seq technology promoterscannot be identified solely on the presence of Pol-II en-richment on a genomic location because of its enrichmentthroughout the transcribed genomic region and lack ofhighly specific antibodies that can distinguish promoterbound Pol-II from elongating Pol-II. In order toovercome these limitations of previous studies, wepursued a combined Pol-II ChIP-seq and bioinformaticspromoter prediction approach to identify promoterregions and their activity in five different mouse tissues.We provide a genome-wide catalog of active promoters infive tissues of adult mouse along with tissue-specific pro-moters that will help future studies of transcriptional regu-lation in mammalian genomes.
MATERIALS AND METHODS
Chromatin immunoprecipitation, massive parallelsequencing and real-time polymerase chain reaction
About 1 g of freshly dissected brain, kidney, liver, lung orspleen tissue from 2-month-old FBV mice was minced
finely and cross-linked with 1% formaldehyde for 10minat room temperature. To stop cross-linking, glycine wasadded to a final concentration of 0.125M. Next, the tissuesample was treated to isolate individual cells andcross-linked chromatin was fragmented to a size rangeof 0.2–0.8 kb as previously described (21). ChIP was per-formed using 10 mg of Pol-II antibody bound Dynalmagnetic beads. The antibodies against Pol-II werepurchased from Abcam Inc (ab5408) and Santa CruzBiotechnology (sc-899X). Following immunopre-cipitation, the bound nucleoprotein complexes were exten-sively washed six times with wash buffer 1 and once withwash buffer 2 [Wash buffer 1: 50mM HEPES-KOH(pH 7.55), 500mM LiCl, 1mM EDTA, 1.0% NP-40 and0.7% Na-deoxycholate; wash buffer 2: TE containing50mM NaCl] and the ChIP enriched DNA was elutedand purified by phenol:chloroform:isoamyl alcohol extrac-tion. This purified DNA (10 ng) was further processed ac-cording to the Illumina Inc. instructions to prepare thelibrary for sequencing ChIP enriched DNA. ForChIP-qPCR, Pol-II ChIP was conducted the same wayas described above and same amount of either input orPol-II enriched DNA was PCR amplified in the presenceof specific primers using the SYBR green-based detection(Applied Biosystems, Foster City, CA, USA) as describedpreviously (22). The primers used were as follows:Promoter forward: 50 gacggttggagaagaaggtg 30, Promoterreverse: 50 aggagaggaggaggttttgg 30 and Control regionforward: 50 gtaacctctgccgttcagga 30, Control regionreverse: 50 tttctccctttccggagatt 30.
ChIP-seq data processing
We have adapted a similar approach used by previouspublished studies (7,23) for ChIP-seq data analysis.Briefly, the analysis involves the following steps: (i)Identification of statistically significant sequenceread-enriched genomic regions (of length 1 kb). A regionwill be considered statistically significant if the number ofreads within that region is higher than the numberexpected due to random background. We used Poissondistribution to estimate the background read count at agiven significant level P (P� 0.01). (ii) Creating the readoverlapping profile for each identified region from step 1,by extending the sequence reads from the 50 end to the 30
end of the reads up to 400 bp (the average length of theChIP–DNA fragment sequenced from the Solexa GA withIllumina standard ChIP-seq protocol). (iii) Peak identifi-cation—by counting the number of overlapped reads ateach nucleotide position and defining the genomicposition with the highest number as the peak positionwithin the 1 kb significant region.
Identification and annotation of Pol-II promoter peaks
To identify the Pol-II bound promoters from the ChIP-seqdata we used our recently developed program to discrim-inate Pol-II enrichment peak associated with promoterregion from peaks associated with non-promoter region(24). The method uses DNA sequence composition,physico-chemical-structural property of DNA sequences,CAGE tags, Pol-II and H3K4me3 enrichment profiles
Nucleic Acids Research, 2011, Vol. 39, No. 1 191
Downloaded from https://academic.oup.com/nar/article-abstract/39/1/190/2409650by gueston 13 February 2018

from ChIP-seq data sets as features for discrimination. Intotal, 39 features were calculated for each peak and asdescribed in ref. 24. Classification model using the afore-mentioned features was constructed with three differentstate-of-the-art ensemble and meta classifiers: Randomforest (25), Bagging (26) and LogitBoost (27–30). The per-formance of the model was evaluated based on thepromoter prediction metrics suggested by (31): sensitivity(SN), positive predictive value (PPV), correlation coeffi-cient (CC) and true-positive cost (TPC). The performancemeasures were calculated for 10-fold cross-validation andindependent test set.For annotating the predicted promoters, we referred to
gene information tracks from various sources available atUCSC genome browser. The tracks include protein codingand non-coding genes from Refseq gene, UCSC gene,Ensembl gene, Vega gene and miRNA. We also down-loaded recently discovered large intervening non-codingRNAs (lincRNA) (32) information for annotating pro-moters related to non-coding genes. The other non-codingRNAs gene information including snoRNA and snRNAare part of the Refseq gene, UCSC gene, Ensembl geneand Vega gene models. A non-redundant set of coding andnon-coding transcripts was generated after combing thetranscript information from various gene models statedabove. A total of 42 924 and 38 159 coding andnon-coding transcripts, respectively, were obtained for an-notation of Pol-II peaks (Supplementary Table S1A inadditional data file 2). The known protein-coding andnon-coding genes for organism other than mouse werealso considered for annotation. This was done toidentify those promoters that are evolutionarily conservedand are known in other organisms but still unknown inmouse. The non-mouse gene track was also downloadedfrom UCSC genome browser and is referred as XenoRefGene. A non-redundant set of promoters for XenoRefGene track genes (Supplementary Table S1B in additionaldata file 2) was also generated for annotation.We divided the result of promoter annotation into three
categories: (i) known promoters, (ii) novel promoters and(iii) novel promoters-unassigned. All those promoters thatoverlapped with first exon of known mouse transcripts arecategorized as ‘known promoters’. The rest of the pro-moters are categorized as ‘novel promoters’. Further, thenovel promoters are assigned to known genes if those fallinside a transcript of known mouse genes (or orthologousnon-mouse genes) or within �10 kb of the 50end of knownmouse genes (or orthologous non-mouse genes). The restof the novel promoters are left as ‘Novel promoters –un-assigned’. Those promoter peaks that overlap with the50ends of both protein coding and non-coding genes areassigned to both.
Cloning novel promoters and luciferase assay
PCR on mouse genomic DNA was performed with specificprimers to amplify 0.5–1.0 kb of the randomly selectednovel promoter (0.5–1.0 kb) and non-promoter(�0.9 kb) regions. The genomic coordinates of eachcloned promoter/non-promoter region is provided inSupplementary Table S2. As a positive control for the
luciferase assay, the promoter of DLL1 gene was alsoamplified. Amplified PCR products were cloned in pCRIIvector (Invitrogen) and the clones were confirmed bysequencing. The confirmed clones were subcloned in thepromoter less luciferase vector pGL3basic (PromegaInc.). DNA for the pGL3 basic constructs (1.8 mg forcalcium chloride method, 0.9mg for Lipofectamine 2000or Fugene) along with pGL4-renilla-luciferase (0.2 mg forcalcium chloride method, 0.1 mg for Lipofectamine 2000 orFugene) were individually transfected in HEK293 (calciumchloride-based transfection), A549,HepG2 (Lipofectamine2000, Invitrogen Inc.), NIH3T3 and DAOY (Fugene,Roche Inc.) cell lines in triplicates in six-well plate forabout 48 h. After 48 h, cells were washed and lyzed in200 ml of passive lysis buffer provided in the dual luciferaseassay kit (Promega Inc.). The lysates were cleared by cen-trifugation and luciferase assay was performed with 5–20 mlof the lysate as per manufacturer’s instructions (PromegaInc.). Renilla luciferase activity was used to normalize fortransfection efficiencies and fold enrichment of luciferaseactivity was calculated relative to the vector backbone(pGL3 basic alone).
Core promoter identification and analysis
We searched for core-promoter elements for eachidentified promoter, by scanning a sequence of length200 bp (–100 to +100 around the Pol-II peak position).The sequences were analyzed by MATCH program (33)for the five known core-promoter elements (INR, TATA,MTE, BRE and DPE) using the position weight matricespublished earlier (34). We used the default parameters forthe MATCH search with the following cutoffs for eachelement (INR-0.85 and 0.8; TATA-0.73 and 0.58;MTE-0.79 and 0.53; BRE-0.70 and 0.65; DPE-0.92 and0.92). In this process, search was done first for the INRelement because it is the most abundant core promoterelement, and if found, that position plus 3 was consideredas the true TSS for the corresponding promoter. If INRwas not found, the rest of the elements (TATA, MTE,BRE and DPE) were searched in that order of importance,and then the TSS was assigned relative to the first elementfound, by adjusting the relative distance between the TSSand the corresponding element (34). The next priority wasgiven to TATA because though MTE is the second mostabundant core promoter element it shows highco-occurrence with INR and the co-occurrence tendenciesof TATA element with others is least. If there are morethan one element identified in a sequence, priority is givento the one with highest score. Once this assignment isdone, we looked for the presence of the remaining corepromoter elements in that promoter. If none of theelements were present, the original peak position wasconsidered as the true TSS.
RESULTS
Pol-II ChIP-sequencing data quality
To identify the active promoter regions in the adult mousegenome, we used the ChIP-seq approach to findgenome-wide binding regions of Pol-II in five mouse
192 Nucleic Acids Research, 2011, Vol. 39, No. 1
Downloaded from https://academic.oup.com/nar/article-abstract/39/1/190/2409650by gueston 13 February 2018

tissues (brain, kidney, liver, lung, and spleen). Throughmappingof thePol-II binding regions,we seek to investigatethe usage of alternative promoters and uncover novel pro-moters in the mouse genome. Previous studies haveindicated that performing two biological replicates forChIP-seq studies is enough to achieve the sequencingdepth required for robust identification of target bindingsites (35,36), and hence we performed two replicates ofPol-II ChIP-seq experiment on each tissue and analyzedtheir overlap. Following the ENCODE consortium stand-ards (36), we analyzed the agreement between our two bio-logical replicates and since our results indicate a goodcorrelation we combined the two datasets for furtheranalysis (Supplementary Figure S1 in additional datafile 1). Sequencing of Pol-II enriched DNA from two bio-logical replicates in the five tissues yielded a total of over 102million sequence reads of 36 bp length. Using the ELAND(Illumina, Inc., San Diego, CA, USA) and Bowtie (37)programs and allowing a maximum of two mis-matches,�62% (63.2 million) of the reads were uniquely mappedback to the mouse reference genome (version mm9). Thealigned reads were processed to identify significantlyenriched Pol-II binding regions and significant peaks asdescribed in ‘Materials and Methods’ section. Following athree-phase peak identification approach, we identified atotal of 335 468 significantly Pol-II-enriched peaks acrossthe five tissues with brain showing the maximum numberof peaks followedbykidney, lung, liver and spleen (Table 1).
As Pol-II binding is expected to be highly enriched inpromoter regions compared to intragenic locations, welooked at the enrichment profile of reads relative toknown transcription start sites (TSS). The distribution ofread counts per million mapped reads for each tissue indi-cates an increased enrichment of Pol-II near TSS ascompared to intra and inter-genic regions (Figure 1A).To further verify the quality of the ChIP-seq experimentaldata, we performed ChIP-qPCR experiment on the ubiqui-tous Polr2a locus. We analyzed the enrichment of Pol-II atthe promoter region as well as at a downstream region ofPolr2a gene as indicated in Figure 1B. Consistent with ourChIP-seq data, we observed significant Pol-II enrichmentonly at the promoter region (Figure 1B and C).
Identification and annotation of active promoters in themouse tissues
The major challenge in identifying promoters based onPol-II enriched regions/peaks is the presence of the
Figure 1. Pol-II ChIP-seq data quality. (A) Plot to show the distribu-tion of ChIP-seq reads as normalized read counts per million aroundknown transcription start site (TSS) of known genes in the five tissues.High Pol-II enrichment is observed around known TSS.(B) Real-time-PCR results show the enrichment of Polr2a promoterin Pol-II ChIP-enriched DNA from five mouse tissues (brain,lung, liver, spleen and kidney). The primers (sequences providedin the ‘Materials and Methods’ section) used in this ChIP-PCRcover both the promoter region of Polr2a and the downstreamcontrol region. The promoter region of Polr2a gene shows highrecruitment of Pol-II while no significant enrichment is observedin downstream Polr2a region. (C) Enrichment of ChIP-seq readsaround Polr2a sgene. The black box under the wiggle profileshows the position of the predicted promoters and the linebelow identifies the peaks that are statistically significant. The y-axisrepresents the normalized read counts per million mapped reads.All five tissues show huge enrichment of read around promoterregion of Polr2a gene. The enrichment profile is low inside gene forall tissues.
Table 1. Summary of Pol II Chip-seq data processing for five tissues
Number of Brain Kidney Liver Lung Spleen
Read obtained from Solexa sequencer 1 79 59 062 2 05 12 406 2 49 55 539 1 76 62 905 2 10 81 878Read aligned back to mouse genome (mm9) 1 02 92 266 1 37 86 546 1 49 64 945 1 08 46 984 1 32 83 139Read in identified enriched region 54 82 173 67 44 056 68 23 960 53 09 423 54 24 148Peaks identified 91 712 81 375 57 816 72 971 31 594Peaks predicted as promoters 18 900 17 548 14 145 19 415 10 589
After alignment to the mouse genome, the enriched regions were first identified and, using a statistical cutoff, the significantly enriched peaks weredetermined. The promoter prediction algorithm identified the significantly enriched peaks that reside in promoter regions.
Nucleic Acids Research, 2011, Vol. 39, No. 1 193
Downloaded from https://academic.oup.com/nar/article-abstract/39/1/190/2409650by gueston 13 February 2018
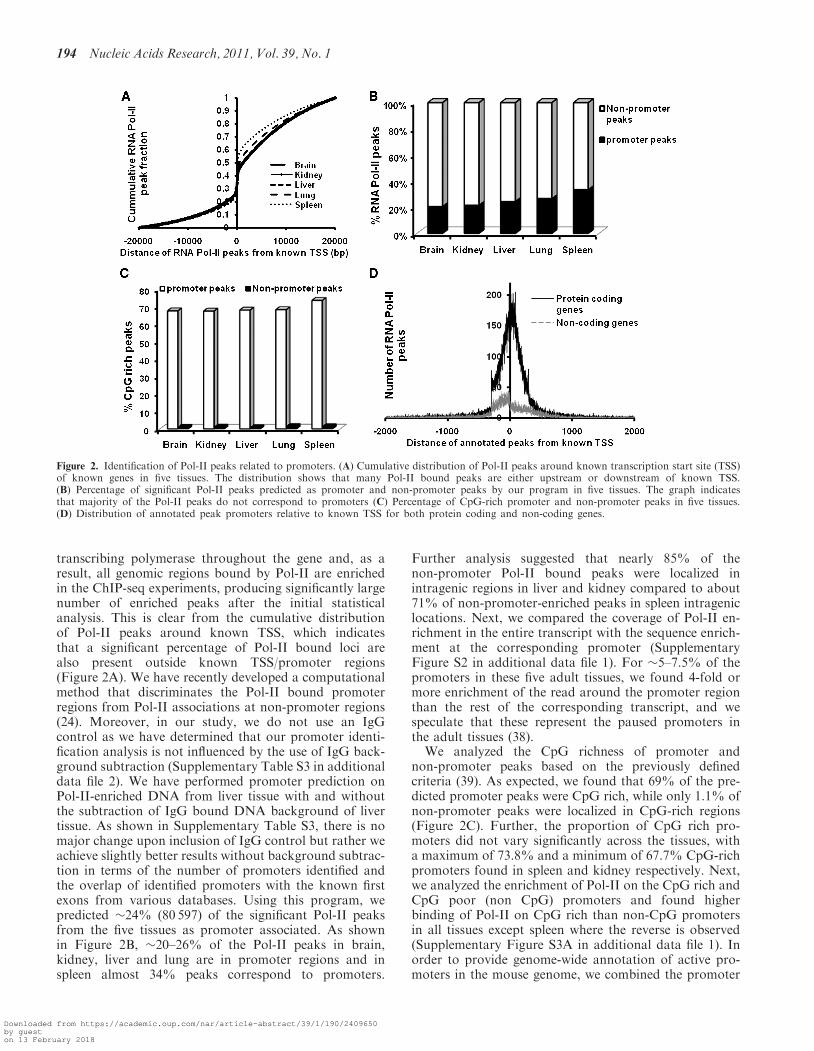
transcribing polymerase throughout the gene and, as aresult, all genomic regions bound by Pol-II are enrichedin the ChIP-seq experiments, producing significantly largenumber of enriched peaks after the initial statisticalanalysis. This is clear from the cumulative distributionof Pol-II peaks around known TSS, which indicatesthat a significant percentage of Pol-II bound loci arealso present outside known TSS/promoter regions(Figure 2A). We have recently developed a computationalmethod that discriminates the Pol-II bound promoterregions from Pol-II associations at non-promoter regions(24). Moreover, in our study, we do not use an IgGcontrol as we have determined that our promoter identi-fication analysis is not influenced by the use of IgG back-ground subtraction (Supplementary Table S3 in additionaldata file 2). We have performed promoter prediction onPol-II-enriched DNA from liver tissue with and withoutthe subtraction of IgG bound DNA background of livertissue. As shown in Supplementary Table S3, there is nomajor change upon inclusion of IgG control but rather weachieve slightly better results without background subtrac-tion in terms of the number of promoters identified andthe overlap of identified promoters with the known firstexons from various databases. Using this program, wepredicted �24% (80 597) of the significant Pol-II peaksfrom the five tissues as promoter associated. As shownin Figure 2B, �20–26% of the Pol-II peaks in brain,kidney, liver and lung are in promoter regions and inspleen almost 34% peaks correspond to promoters.
Further analysis suggested that nearly 85% of thenon-promoter Pol-II bound peaks were localized inintragenic regions in liver and kidney compared to about71% of non-promoter-enriched peaks in spleen intrageniclocations. Next, we compared the coverage of Pol-II en-richment in the entire transcript with the sequence enrich-ment at the corresponding promoter (SupplementaryFigure S2 in additional data file 1). For �5–7.5% of thepromoters in these five adult tissues, we found 4-fold ormore enrichment of the read around the promoter regionthan the rest of the corresponding transcript, and wespeculate that these represent the paused promoters inthe adult tissues (38).
We analyzed the CpG richness of promoter andnon-promoter peaks based on the previously definedcriteria (39). As expected, we found that 69% of the pre-dicted promoter peaks were CpG rich, while only 1.1% ofnon-promoter peaks were localized in CpG-rich regions(Figure 2C). Further, the proportion of CpG rich pro-moters did not vary significantly across the tissues, witha maximum of 73.8% and a minimum of 67.7% CpG-richpromoters found in spleen and kidney respectively. Next,we analyzed the enrichment of Pol-II on the CpG rich andCpG poor (non CpG) promoters and found higherbinding of Pol-II on CpG rich than non-CpG promotersin all tissues except spleen where the reverse is observed(Supplementary Figure S3A in additional data file 1). Inorder to provide genome-wide annotation of active pro-moters in the mouse genome, we combined the promoter
Figure 2. Identification of Pol-II peaks related to promoters. (A) Cumulative distribution of Pol-II peaks around known transcription start site (TSS)of known genes in five tissues. The distribution shows that many Pol-II bound peaks are either upstream or downstream of known TSS.(B) Percentage of significant Pol-II peaks predicted as promoter and non-promoter peaks by our program in five tissues. The graph indicatesthat majority of the Pol-II peaks do not correspond to promoters (C) Percentage of CpG-rich promoter and non-promoter peaks in five tissues.(D) Distribution of annotated peak promoters relative to known TSS for both protein coding and non-coding genes.
194 Nucleic Acids Research, 2011, Vol. 39, No. 1
Downloaded from https://academic.oup.com/nar/article-abstract/39/1/190/2409650by gueston 13 February 2018

regions identified in all the five tissues into a master table(additional data file 3). We merged any two consecutivepromoters into a single promoter region if the distancebetween corresponding Pol-II peaks in those promoterregions was <300 bp.
Next, we annotated the identified promoters using anon-redundant set of 42 924 known protein-coding tran-scripts and 38 159 known non-coding transcripts asdescribed in ‘Materials and Methods’ section(Supplementary Table S1A in additional data file 2). Aschematic representation of the step-wise pipeline thatwas followed for promoter annotation is shown inSupplementary Figure S4 in additional data file 1. Weidentified 21 926, 20 301, 15 720, 21 599 and 11 401 pro-moters that are active in brain, kidney, liver, lung andspleen, respectively (Table 2). About 8173 (21%) of thepromoters were left unassigned to any gene based on ourannotation strategy. In order to account for thefalse-negative predictions of the program (known pro-moters that were not predicted by the program despitethe presence of significantly enriched Pol-II peak), all thePol-II significantly enriched peaks that were predicted asnon-promoters but overlap with the first exons of knowntranscripts were added into the final promoter annotationspresented in Table 2. Using this strategy we had furtherannotated 5356 (2.1%), and 8374 (3.2%) ofPol-II-enriched peaks to known protein-coding andnon-coding genes, respectively (Supplementary Table S4in additional data file 2). Eventually, we have identified atotal of 38 639 promoters and annotated 21 739 promotersto only protein-coding genes (15 503), another 7406 pro-moters to only non-coding genes (5354) and 1321 pro-moters were assigned to both protein coding andnon-coding genes. The list of all annotated promotersalong with the annotation is provided in additional datafile 4. Many of these promoters were tissue specific, whileothers were shared between two or more tissues as shownin the Venn diagram (Supplementary Figure S5 in add-itional data file 1). In particular, our analysis has identified8727 promoters for Pol-II transcribed non-coding geneswith 856, 184, 31 and nine promoters assigned tolincRNA, miRNA, snoRNA and snRNA genes, respect-ively (Table 3). As promoters are localized around TSS,we analyzed the positioning of the identified promotersrelative to the known TSS and found that for bothprotein coding and non-coding genes, promoters were
mostly upstream of the known TSS (Figure 2D). Next,we examined the presence of bidirectional promotersamong the identified promoters. We consider a promoteras bidirectional if it is shared between two genes which arein opposite orientation and the promoter region eitheroverlaps with the first exon of the transcripts or iswithin �1 kb of known TSS as previously described (40).We identified 1093, 1029, 989, 1125 and 852 bidirectionalpromoters in brain, kidney, liver, lung and spleen, respect-ively. Interestingly, we found that more than 93% of thebidirectional promoters were CpG rich (SupplementaryTable S5 in additional data file 2).
Novel promoter identification and experimental validation
One of the major goals of this study was the identificationof novel promoters in the mouse genome. We haveidentified a total of 12 270 novel promoters, which repre-sents 32% of all the identified promoters. This suggeststhat a large number of promoters that are active in atleast one of the five tissues were unknown in any of thecurrent genome-wide annotations. The tissue-wise distri-bution of the novel promoters is presented in Table 4. Weobserved higher enrichment of Pol-II on the novel pro-moters than known promoters in spleen, while in brainand lung the reverse was true. In contrast, in kidney andliver the binding of Pol-II near TSS was similar for knownand novel promoters (Supplementary Figure S3B in add-itional data file 1). Additionally, we found that about 34%of the novel promoters were CpG rich and these novelpromoter regions show similar level of conservation asknown promoters across 30 vertebrate species(Supplementary Figure S6 in additional data file 1).When we analyzed the novel promoters with the known
Table 2. Summary of identified promoters across five tissues
Tissue Known promoters Novel promoters Total
Protein-coding Non-coding Both Protein-coding Non-coding Both Unassigned
Brain 11 611 3873 207 6274 152 27 4241 21 926Kidney 11 141 3520 217 5729 153 25 3520 20 301Liver 9441 2421 114 3889 104 21 2322 15 720Lung 12 020 3259 187 6375 169 37 4033 21 599Spleen 7163 1492 63 2742 70 3 1638 11 401Total number of non-redundant promoters identified 38 639
The breakup of Pol-II bound promoters in each tissue is provided as known and novel promoters and their assignment to either protein coding or/and non-coding genes is indicated.
Table 3. Summary of identified promoters assigned to non-coding
RNA class across five tissues
Tissue lincRNA miRNA snoRNA snRNA Others All
Brain 405 113 21 9 4058 4547Kidney 419 70 19 8 3729 4186Liver 315 55 17 9 2701 3048Lung 460 64 16 8 3489 3974Spleen 249 32 13 6 1752 2011Overall 856 184 31 9 7740 8727
This table shows the number of promoters assigned to each category ofnon-coding RNA in each tissue.
Nucleic Acids Research, 2011, Vol. 39, No. 1 195
Downloaded from https://academic.oup.com/nar/article-abstract/39/1/190/2409650by gueston 13 February 2018

promoters of homologous genes, we found that 671 ofthese promoters had corresponding known promoters inother organisms. Next, we looked for the overlap of novelpromoters from our study with CAGE tag clustersgenerated by the FANTOM4 project (41). CAGE tagclusters are found at the 50 end of transcript as well as inother regions including the internal exons, introns, 30UTRand intergenic regions. Because CAGE analysis relies on 50
Cap trapper techniques, thus capturing evenpost-transcriptionally re-capped mRNA, it has inherentdeficiencies as a sole tool to identify promoters (20). Wehave observed that for our promoter peaks, 95–97% aresupported by CAGE clusters and surprisingly even 53–59% of non-promoter peaks also show the presence ofCAGE clusters (Supplementary Figure S7 andSupplementary Table S6). When we focused on theoverlap of novel promoters with CAGE clusters, asexpected, we observed a 97% correlation. It is worthnoting that only 1.4% of all CAGE tag based predictedpromoters are actually identified as active promoter byour approach in the five adult tissues (SupplementaryFigure S7A). Additionally, we compared non-redundantEST sequences with the novel promoters and found thatabout 62.4% of the novel promoters overlapped with the50 ends of the ESTs. Furthermore, using the publishedmRNA-seq data from mouse brain and liver, wedetected mRNA-seq reads for 68% and 60% of novelpromoters identified in brain and liver, respectively(example shown in Supplementary Figure S8 in additionaldata file 1) (42). Thus, the novel promoters identified byour approach of promoter prediction on Pol-II-enrichedChIP-seq data are supported by other independent experi-mental methods. To further validate the activity of thesenovel promoters, we cloned 10 of the randomly selectednovel promoters (NP1-10) and two non-promoter regions(Ctrl1, 2) upstream of a promoter-less luciferase gene andmeasured promoter activity (Supplementary Table S2 inadditional data file 2). As shown by the wiggle tracks inFigure 3A, we have identified a new promoter in all fivemouse tissues that lies �16 kb upstream of the knownmKIAA1632 gene promoter (NP1). The homologousregion in humans represents the promoter for the humanKIAA1632 gene. Similarly, we have identified a newpromoter in three of the mouse tissues for GPM6A that
lies �175 kb upstream of the known GPM6A genepromoter in mouse (NP8). The homologous region inhumans represents the promoter for the human GPM6Agene (Figure 3B). These promoters either represent theunidentified promoters for KIAA1632 and GPM6A ordrive the expression of unknown genes. Figure 3C showsthe Pol-II binding in one of the regions that was not pre-dicted as a promoter in our analysis and is considered asnon-promoter. Using transient transfection experiments,we introduced these constructs in five different cell lines(HEK293, DAOY, A549, HepG2 and NIH3T3) andmeasured the expression of luciferase gene which iscontrolled by the novel promoters or non-promoterregions. We observed significant luciferase expression(7-fold for NP5 to 304-fold for NP1) from nine of the10 selected promoters in at least one of the cell lines(Figure 3D). We did not observe any promoter activityfor the novel promoter NP7 which was identified inspleen tissue and it is possible that this is due to theabsence of the proper cell system in our luciferase assaysor NP7 is a false promoter prediction. Based on ourresults, we conclude that non-CpG promoters areunderrepresented in the current promoter inventory andadvances in high-throughput sequencing technologycoupled with bioinformatics analysis can help to identifythese.
Alternative promoter usage in the mouse tissues
It is well established that many mammalian genes havemultiple promoters and that these are differentially usedin different cellular context. In agreement, we found23 060 promoters for 16 330 protein-coding and 8727 pro-moters for 6314 (24%) non-coding genes in the five mousetissues that were analyzed. To identify the genes that usealternative promoters in these different tissues, weadopted a two-step procedure. The first step involvedidentification of the promoter(s) with bound Pol-II foreach gene in each tissue individually. In the second step,we compared the identified promoter for each gene acrossthe five tissues. In case the promoters from two or moretissues overlap with each other by at least 300 bp then theyare considered as the same promoter, otherwise they aredefined as distinct promoters (additional data file 4).Examples of alternative promoter genes identified by
Table 4. Novel promoters and relationship with existing information
Tissue Numberof novelpromoters
Percentageof CpG-richpromoters
Number of promoters
Homologous toother organisms(overlap with 50endsof XenoRef mRNAs)
Supported byCAGE cluster
Found inBing Ren’sstudy (17)
Overlap with50 of ESTs
Brain 6649 41.21 405 6479 184 4320Kidney 5857 42.38 372 5722 177 3728Liver 3972 36.61 250 3887 131 2670Lung 6507 42.98 392 6318 208 4015Spleen 2809 42.11 160 2724 95 1775Overall 12 270 33.85 671 11 902 371 7663
This table shows the support of the identified novel promoters from other experimental sources in every tissue.
196 Nucleic Acids Research, 2011, Vol. 39, No. 1
Downloaded from https://academic.oup.com/nar/article-abstract/39/1/190/2409650by gueston 13 February 2018

our approach are shown for Adar1and Hdgf gene inFigure 4A. In case of Adar1, there are two active pro-moters that are differentially used in the five tissues. Theupstream promoter P1 is used in brain, kidney and lung,while downstream P2 promoter has been identified asactive in kidney, liver, lung and spleen. Similarly forHdgf, four distinct active promoters have been identifiedthat are differentially enriched with Pol-II. Based on thisanalysis, we have found the distribution of multi-promoterusage in five mouse tissues (Figure 4B and C). Weobserved that 37% of the annotated protein-codinggenes and 31% of the non-coding genes use alternativepromoters in the five mouse tissues. Furthermore, wefound that the use of alternative promoters changes thecoding protein in 34.5% of the alternative promoter genes.As our analysis is based on only five tissues, it suggests
that a significant number of mouse genes use alternativepromoters.
Identification of tissue-specific promoters
Having identified the promoters that are active in one ormore of the five tissues, we further investigated the usageof promoters in a tissue-specific manner. Two differentparameters were used for identifying tissue-specific pro-moters in our study. The first parameter is based onShannon entropy that was previously employed for iden-tifying tissue-specific promoters from ChIP–chip (17),gene expression and EST data (43). As the second param-eter, we define fold change for each promoter (p) asfp=max1/max2, where max1 and max2 are the first andsecond highest normalized read counts for promoter p
Figure 3. Identification of novel promoters and experimental verification. (A–C) The wiggle profile shows the enrichment of Pol-II and prediction ofnovel promoters for mouse KIAA1632 (A) and GPM6 (B) gene in brain, kidney, liver, lung, and spleen tissues and (C) shows the Pol-II profile on anon-promoter region that lies within the transcripts (AK090117 and U58494). Y-axis shows the normalized read counts/million mapped reads andthe black boxes below the Pol-II-binding profile represent the identified novel promoters by our program. The two novel promoters shown abovehave a corresponding conserved promoter in human genome. (D) Luciferase activity of the novel promoters in five distinct cell lines. The x-axisrepresents either the vector alone background (pGL3 basic) or the activity of novel promoters (NP1-10) and non-promoter region (ctrl1 and 2).On the y-axis, the normalized luciferase activity has been plotted in a logarithmic scale to the base of 2. Thus, the value of 1on the y-axis represents a2-fold activity of the promoter. Only if a promoter shows an activity that is more than 2-fold it is considered as active in that cell line. NP7 does notshow any luciferase activity in any of the five cell lines. Luciferase activity is expressed as log2 of the fold change over the vector alone (pGL3basic)after normalization with Renilla-luciferase for transfection efficiency. Dll1 promoter has been included as a positive control and Ctrl1, 2 representsthe negative controls (non-promoter regions).
Nucleic Acids Research, 2011, Vol. 39, No. 1 197
Downloaded from https://academic.oup.com/nar/article-abstract/39/1/190/2409650by gueston 13 February 2018

among the five tissues, respectively. To define tissue spe-cificity, we have set the maximum cutoff as 1.25 forShannon entropy and a minimum cutoff of 2.0 for thefold change determinant. Note that while Shannonentropy is inversely correlated, the fold-change parameteris directly correlated with tissue specificity. Using theabove-defined parameters, we have identified 6384tissue-specific promoters across the five mouse tissues(Supplementary Table S7 in additional data file 2 andadditional data file 5). These results are further supportedby the box plot, which shows as an example for thebrain-specific promoters a significantly higher read countin brain compared to the other four tissues in the distri-bution of normalized read counts (Figure 5A). Similarresults were obtained for other tissue-specific promoters(Supplementary Figure S9 in additional data file 1). Thehighest number of tissue-specific promoters was identifiedin brain while spleen has the least number of tissue-specificPol-II-associated promoters. Further analysis revealedthat overall only 29% of the tissue-specific promoterswere CpG rich, with brain and lung exhibiting highestCpG richness (�41%), while in spleen only 9% of pro-moters were CpG rich. We further studied the relationshipof tissue-specific parameters: Shannon entropy andnormalized read fold change with CpG richness in pro-moters of genes (Figure 5B and C). A direct relationship isobserved between CpG richness and Shannon entropy and
an inverse relationship is observed between CpG richnessand normalized read fold-change for promoters, suggest-ing that globally the tissue-specific promoters are CpGpoor compared to ubiquitous promoters. Furthermore,detailed analysis of core promoter elements in thetissue-specific promoters versus ubiquitous promotersshow that TATA (p=1.75e-14) and INR (p=1.69e-12)elements are more enriched in tissue-specific promoters,while BRE (p=4.56e-29) and MTE (p=6.82e-18)elements are significantly enriched in ubiquitous genes(Supplementary Table S8A and B in additional data file2, statistical significance was calculated using proportiontest). DPE element did not show any preference for eitherclass of promoters. Thus, our data suggests hat CpG-poortissue-specific promoters and CpG-rich ubiquitous pro-moters tend to possess different core promoter compos-ition (44).
Correlation of Pol-II binding at promoter and thecorresponding transcript expression
As binding of Pol-II precedes transcription, we expectedthat promoters with high occupancy of Pol-II will betranscribed at a higher rate than others. To address thisissue, we studied the correlation of Pol-II recruitment tothe promoter and the consequential transcript expressionin the mouse tissues. We performed this analysis for only
Figure 4. Alternative promoter usage in five mouse tissues (A) Wiggle profile showing examples of alternative promoter usage identified by ouranalysis in the five mouse tissues. For Adar1 and Hdgf our approach has identified the use of two and four known promoters among the five tissues,which are indicated by arrows on the transcripts at the bottom of the figure. Y-axis shows the normalized read count per million reads, the black boxbelow the Pol-II enrichment shows the position of the identified promoters and the black line under it indicates the significantly enriched peaks ofeach track. It is evident that only few of the enriched peaks reside in the promoter region. (B and C) Pie chart shows distribution of alternativepromoter usage for protein coding (B) and non-coding genes (C) in the five tissues analyzed from mouse.
198 Nucleic Acids Research, 2011, Vol. 39, No. 1
Downloaded from https://academic.oup.com/nar/article-abstract/39/1/190/2409650by gueston 13 February 2018

brain and liver using the publicly available mRNA-seqdata (42). We used Cufflinks software (45) to estimatethe transcript expression from the mRNA-seq data setsusing the default parameters. For each tissue, the expres-sion scores from promoters were broken up into fourquartiles: high, medium, low and very low. Next, wecalculated the average Pol-II ChIP-seq read countaround annotated TSS at base pair resolution for pro-moters found in the four quartiles and plotted thePol-II-enriched profile around annotated TSS (Figure 6).Because there is no mRNA-seq data available for kidney,lung and spleen, we performed similar analysis at thegene level using microarray gene expression data(Supplementary Figure S10). The gene expression data
used in our present study for brain, kidney, liver, lungand spleen were downloaded from NCBI (GEO ID:GDS592) (46). As these data contained profiles for eightdifferent brain tissues, (frontal cortex, cerebral cortex,substantia nigra, cerebellum, amygdala, hypothalamus,hippocampus and dorsal striatum), the average of thesescores for each gene was taken as the expression of thecorresponding gene in brain. Altogether, we observe thatthe promoters driving higher mRNA expression exhibitincreased Pol-II recruitment, suggesting that the bindingof Pol-II at the promoter is a good signature for globalexpression from a promoter.
DISCUSSION
Identification and annotation of all human and mousegene promoters that are differentially used in differentcell/tissue types, during development, or aberrantlyactivated in disease conditions are still incomplete andare essential for defining the transcriptome andproteome of the mammalian genome. It is well knownthat differential gene expression is a characteristic of dif-ferent tissues; however, not much work has been done tocharacterize the global isoform specific expression of genesin various tissues (47,48). One of the important aspects tounderstand the regulation of gene expression is the studyof all the promoters of a gene. Currently, our promoterknowledge is partial and our goal in this study was toexpand our promoter inventory and to determine thetissues where each promoter is active. To provide acatalog of active promoters in various tissues andidentify tissue-specific promoter usage, we used a combin-ation of ChIP-seq and bioinformatics approaches. In thisstudy, we focused on five adult tissues—brain, kidney,liver, lung and spleen, and have successfully identified38 639 promoters for both protein coding and non-codinggenes. Our approach has identified 12 270 novel promotersincluding promoters for genes such as Dnmt1, Bmp4,Jmjd3, Cyclin E1 and D1, MeCP2, which have beenassociated with tumorigenesis. We have been able toannotate a large number of the newly discovered pro-moters to known genes like 60% in case of brain, andwe anticipate that the remaining 40% un-annotated pro-moters might mostly represent the promoters of unknownnon-coding genes. Our results also show that about 37%of the protein coding genes possess alternative promoters.This is lower than the expected 50–60% genes from othergenome-wide analysis due to the small number of tissuesassayed as well as the sole use of adult tissue in this study(11,44). This is supported by our analysis where wecompared the alternative promoter use in two, three,four, five tissues and observed an increase in alternativepromoter usage from 27% (two-tissue) to 37%(five-tissue). The use of alternative promoters results indifferent proteins in about 34% of multi-promoter genesas seen for Adar1, Hdgf (Figure 4A). In case of Adar1, theupstream promoter P1 is responsive to interferon andproduces a 150-kDa protein compared to the constitutivepromoter P2 that produces an N-terminally truncated110-kDa protein (49). We have found that 5–8% of the
Figure 5. Identification of tissue specific promoters and their relation-ship to CpG islands. (A) Box plot shows the normalized read counts ofpromoters that have been assigned to be brain specific in all five mousetissues. The plot shows that the brain specific promoters indeed showspecific and increased Pol-II binding in brain relative to other tissues.(B and C) Tissue specificity of promoters and its association with CpGrichness. An inverse relationship is observed between tissue-specific pro-moters and CpG richness when we look at either the Shannon entropy(B) or normalized read count fold change (C) measures of tissue spe-cificity across all five tissues. The left-hand side of y-axis represents thetotal promoter count. The right side of y-axis represents fraction ofCpG-rich promoters. The x-axis in (B) represents Shannon entropyand in (C) it represents log2 (fold change) in read count valuearound annotated promoters.
Nucleic Acids Research, 2011, Vol. 39, No. 1 199
Downloaded from https://academic.oup.com/nar/article-abstract/39/1/190/2409650by gueston 13 February 2018

promoters in these tissues are bidirectional and 4–6% ofthe promoters are shared by protein coding andnon-coding genes in each tissue. Our analysis suggeststhat nearly 17% of the promoters in the mouse genomeare used in a tissue-specific manner and these tissue re-strictive promoters tend to be CpG poor. We found thatalmost 70% of the known promoters are CpG rich, while66% of the novel promoters are CpG poor suggesting thatmany of these new promoters are tissue-specific and noteasily identifiable without high-throughput genome-wideanalysis. This is supported by the finding that, while 1/4thof the highly tissue restrictive (active in only one tissue)novel promoters are CpG rich, 2/3rd of the novel pro-moters active in the five tissues show CpG richness. Inconclusion, we have identified the active promoters infive mouse tissues and we plan to expand our study toidentify the differential and overlapping use of promotersin normal human tissues and diseased tissue counterparts.
SUPPLEMENTARY DATA
Supplementary Data are available at NAR Online. ChIP-seq data has been deposited in GEO under accessionnumber GSE 21773.
ACKNOWLEDGEMENTS
The use of Genomics core facility and computational re-sources in the Centre for Systems and ComputationalBiology and Bioinformatics Facility of Wistar CancerCentre (supported by grant # P30CA010815) are grateful-ly acknowledged.
FUNDING
National Human Genome Research Institute (grant #R01HG003362 to R.D.). R.D. holds a PhiladelphiaHealthcare Trust Endowed Chair Position and this workis also supported by Philadelphia Healthcare Trust.
Funding for open access charge: National Institutes ofHealth (grant # R01HG003362 to R.D.).
Conflict of interest statement. None declared.
REFERENCES
1. Davuluri,R.V., Suzuki,Y., Sugano,S., Plass,C. and Huang,T.H.(2008) The functional consequences of alternative promoter usein mammalian genomes. Trends Genet., 24, 167–177.
2. Wang,E.T., Sandberg,R., Luo,S., Khrebtukova,I., Zhang,L.,Mayr,C., Kingsmore,S.F., Schroth,G.P. and Burge,C.B. (2008)Alternative isoform regulation in human tissue transcriptomes.Nature, 456, 470–476.
3. Van de Wetering,M., Castrop,J., Korinek,V. and Clevers,H.(1996) Extensive alternative splicing and dual promoter usagegenerate Tcf-1 protein isoforms with differential transcriptioncontrol properties. Mol. Cell. Biol., 16, 745–752.
4. Hovanes,K., Li,T.W., Munguia,J.E., Truong,T., Milovanovic,T.,Lawrence,M.J., Holcombe,R.F. and Waterman,M.L. (2001)Beta-catenin-sensitive isoforms of lymphoid enhancer factor-1 areselectively expressed in colon cancer. Nat. Genet., 28, 53–57.
5. Sandelin,A., Carninci,P., Lenhard,B., Ponjavic,J., Hayashizaki,Y.and Hume,D.A. (2007) Mammalian RNA polymerase II corepromoters: insights from genome-wide studies. Nat. Rev. Genet.,8, 424–436.
6. Kapranov,P., Willingham,A.T. and Gingeras,T.R. (2007)Genome-wide transcription and the implications for genomicorganization. Nat. Rev. Genet., 8, 413–423.
7. Robertson,G., Hirst,M., Bainbridge,M., Bilenky,M., Zhao,Y.,Zeng,T., Euskirchen,G., Bernier,B., Varhol,R., Delaney,A. et al.(2007) Genome-wide profiles of STAT1 DNA association usingchromatin immunoprecipitation and massively parallel sequencing.Nat. Methods, 4, 651–657.
8. Baek,D., Davis,C., Ewing,B., Gordon,D. and Green,P. (2007)Characterization and predictive discovery of evolutionarilyconserved mammalian alternative promoters. Genome Res., 17,145–155.
9. Sun,H., Palaniswamy,S.K., Pohar,T.T., Jin,V.X., Huang,T.H. andDavuluri,R.V. (2006) MPromDb: an integrated resource forannotation and visualization of mammalian gene promoters andChIP-chip experimental data. Nucleic Acids Res., 34, D98–D103.
10. Takeda,J., Suzuki,Y., Nakao,M., Kuroda,T., Sugano,S.,Gojobori,T. and Imanishi,T. (2007) H-DBAS: alternative splicingdatabase of completely sequenced and manually annotatedfull-length cDNAs based on H-Invitational. Nucleic Acids Res.,35, D104–D109.
Figure 6. Correlation of Pol-II enrichment on promoters with the expression of corresponding transcripts. (A and B) Based on the mRNA expres-sion estimated by Cufflinks software the promoters were divided into four groups for brain and liver (high, medium, low and very low). Thenormalized read/tag count of Pol-II bound DNA for each group of promoters at base pair resolution from –1 kb to +1kb relative to TSS wascalculated and plotted as a function of distance from TSS. Total reads of gene promoter were counted based on our annotation for each group ineach tissue. The x-axis represents distance of reads from annotated TSS and the y-axis represents total number of reads per million mapped reads.
200 Nucleic Acids Research, 2011, Vol. 39, No. 1
Downloaded from https://academic.oup.com/nar/article-abstract/39/1/190/2409650by gueston 13 February 2018

11. Kimura,K., Wakamatsu,A., Suzuki,Y., Ota,T., Nishikawa,T.,Yamashita,R., Yamamoto,J., Sekine,M., Tsuritani,K.,Wakaguri,H. et al. (2006) Diversification of transcriptionalmodulation: large-scale identification and characterization ofputative alternative promoters of human genes. Genome Res., 16,55–65.
12. Cooper,S.J., Trinklein,N.D., Anton,E.D., Nguyen,L. andMyers,R.M. (2006) Comprehensive analysis of transcriptionalpromoter structure and function in 1% of the human genome.Genome Res., 16, 1–10.
13. Bajic,V.B., Tan,S.L., Christoffels,A., Schonbach,C., Lipovich,L.,Yang,L., Hofmann,O., Kruger,A., Hide,W., Kai,C. et al. (2006)Mice and men: their promoter properties. PLoS Genet., 2, e54.
14. Maeda,N., Nishiyori,H., Nakamura,M., Kawazu,C., Murata,M.,Sano,H., Hayashida,K., Fukuda,S., Tagami,M., Hasegawa,A.et al. (2008) Development of a DNA barcode tagging method formonitoring dynamic changes in gene expression by using an ultrahigh-throughput sequencer. Biotechniques, 45, 95–97.
15. Balwierz,P.J., Carninci,P., Daub,C.O., Kawai,J., Hayashizaki,Y.,Van Belle,W., Beisel,C. and van Nimwegen,E. (2009) Methodsfor analyzing deep sequencing expression data: constructingthe human and mouse promoterome with deepCAGE data.Genome Biol., 10, R79.
16. Singer,G.A., Wu,J., Yan,P., Plass,C., Huang,T.H. andDavuluri,R.V. (2008) Genome-wide analysis of alternativepromoters of human genes using a custom promoter tiling array.BMC Genomics, 9, 349.
17. Barrera,L.O., Li,Z., Smith,A.D., Arden,K.C., Cavenee,W.K.,Zhang,M.Q., Green,R.D. and Ren,B. (2008) Genome-widemapping and analysis of active promoters in mouse embryonicstem cells and adult organs. Genome Res., 18, 46–59.
18. Otsuka,Y., Kedersha,N.L. and Schoenberg,D.R. (2009)Identification of a cytoplasmic complex that adds a cap onto50-monophosphate RNA. Mol. Cell. Biol., 29, 2155–2167.
19. Affymetrix/Cold Spring Harbor Laboratory ENCODETranscriptome Project et al. (2009) Post-transcriptional processinggenerates a diversity of 50-modified long and short RNAs. Nature,457, 1028–1032.
20. Schoenberg,D.R. and Maquat,L.E. (2009) Re-capping themessage. Trends Biochem. Sci., 34, 435–442.
21. Lee,T.I., Johnstone,S.E. and Young,R.A. (2006) Chromatinimmunoprecipitation and microarray-based analysis of proteinlocation. Nat. Protoc., 1, 729–748.
22. Cheng,A.S., Jin,V.X., Fan,M., Smith,L.T., Liyanarachchi,S.,Yan,P.S., Leu,Y.W., Chan,M.W., Plass,C., Nephew,K.P. et al.(2006) Combinatorial analysis of transcription factor partnersreveals recruitment of c-MYC to estrogen receptor-alpharesponsive promoters. Mol. Cell, 21, 393–404.
23. Zhang,Z.D., Rozowsky,J., Snyder,M., Chang,J. and Gerstein,M.(2008) Modeling ChIP sequencing in silico with applications.PLoS Comput. Biol., 4, e1000158.
24. Gupta,R., Wikramasinghe,P., Bhattacharyya,A., Perez,F.A., Pal,S.and Davuluri,R.V. Annotation of gene promoters by integrativedata-mining of ChIP-seq Pol-II enrichment data. BMCBioinformatics, 11(Suppl. 1), S65.
25. Breiman,L. (2001) Random forests. Mach. Learn., 45, 5–32.26. Breiman,L. (1996) Bagging predictors. Mach. Learn., 24, 123–140.27. Friedman,J., Hastie,T. and Tibshirani,R. (1998) Additive logistic
regression: a statistical view of boosting. Ann. Stat., 28, 337–407.28. Freund,Y. and Schapire,R.E. (1996) Thirteenth International
Conference on Machine Learning. Morgan Kaufmann, SanFrancisco, pp. 148–156.
29. Freund,Y. and Schapire,R. (1997) A decision-theoreticgeneralization of on-line learning and an application to boosting.J. Comput. Syst. Sci., 55, 119–139.
30. Ratsch,G., Onoda,T. and Muller,K.R. (2001) Soft margins forAdaBoost. Mach. Learn, 42, 287–320.
31. Bajic,V.B., Tan,S.L., Suzuki,Y. and Sugano,S. (2004) Promoterprediction analysis on the whole human genome. Nat. Biotechnol.,22, 1467–1473.
32. Guttman,M., Amit,I., Garber,M., French,C., Lin,M.F.,Feldser,D., Huarte,M., Zuk,O., Carey,B.W., Cassady,J.P. et al.
(2009) Chromatin signature reveals over a thousand highlyconserved large non-coding RNAs in mammals. Nature, 458,223–227.
33. Kel,A.E., Gossling,E., Reuter,I., Cheremushkin,E., Kel-Margoulis,O.V. and Wingender,E. (2003) MATCH: A tool forsearching transcription factor binding sites in DNA sequences.Nucleic Acids Res., 31, 3576–3579.
34. Jin,V.X., Singer,G.A., Agosto-Perez,F.J., Liyanarachchi,S. andDavuluri,R.V. (2006) Genome-wide analysis of core promoterelements from conserved human and mouse orthologous pairs.BMC Bioinformatics, 7, 114.
35. Blahnik,K.R., Dou,L., O’Geen,H., McPhillips,T., Xu,X.,Cao,A.R., Iyengar,S., Nicolet,C.M., Ludascher,B., Korf,I. et al.(2010) Sole-Search: an integrated analysis program for peakdetection and functional annotation using ChIP-seq data.Nucleic Acids Res., 38, e13.
36. Rozowsky,J., Euskirchen,G., Auerbach,R.K., Zhang,Z.D.,Gibson,T., Bjornson,R., Carriero,N., Snyder,M. andGerstein,M.B. (2009) PeakSeq enables systematic scoring ofChIP-seq experiments relative to controls. Nat. Biotechnol., 27,66–75.
37. Langmead,B., Trapnell,C., Pop,M. and Salzberg,S.L. (2009)Ultrafast and memory-efficient alignment of short DNAsequences to the human genome. Genome Biol., 10, R25.
38. Wu,J.Q. and Snyder,M. (2008) RNA polymerase II stalling:loading at the start prepares genes for a sprint. Genome Biol., 9,220.
39. Davuluri,R.V., Grosse,I. and Zhang,M.Q. (2001) Computationalidentification of promoters and first exons in the human genome.Nat. Genet., 29, 412–417.
40. Koyanagi,K.O., Hagiwara,M., Itoh,T., Gojobori,T. andImanishi,T. (2005) Comparative genomics of bidirectional genepairs and its implications for the evolution of a transcriptionalregulation system. Gene, 353, 169–176.
41. Kawaji,H., Severin,J., Lizio,M., Waterhouse,A., Katayama,S.,Irvine,K.M., Hume,D.A., Forrest,A.R., Suzuki,H., Carninci,P.et al. (2009) The FANTOM web resource: from mammaliantranscriptional landscape to its dynamic regulation. Genome Biol.,10, R40.
42. Mortazavi,A., Williams,B.A., McCue,K., Schaeffer,L. andWold,B. (2008) Mapping and quantifying mammaliantranscriptomes by RNA-Seq. Nat. Methods, 5, 621–628.
43. Schug,J., Schuller,W.P., Kappen,C., Salbaum,J.M., Bucan,M. andStoeckert,C.J. Jr (2005) Promoter features related to tissuespecificity as measured by Shannon entropy. Genome Biol., 6,R33.
44. Carninci,P., Sandelin,A., Lenhard,B., Katayama,S.,Shimokawa,K., Ponjavic,J., Semple,C.A., Taylor,M.S.,Engstrom,P.G., Frith,M.C. et al. (2006) Genome-wide analysis ofmammalian promoter architecture and evolution. Nat. Genet., 38,626–635.
45. Trapnell,C., Williams,B.A., Pertea,G., Mortazavi,A., Kwan,G.,van Baren,M.J., Salzberg,S.L., Wold,B.J. and Pachter,L. (2010)Transcript assembly and quantification by RNA-Seq revealsunannotated transcripts and isoform switching during celldifferentiation. Nat. Biotechnol., 28, 511–515.
46. Su,A.I., Wiltshire,T., Batalov,S., Lapp,H., Ching,K.A., Block,D.,Zhang,J., Soden,R., Hayakawa,M., Kreiman,G. et al. (2004) Agene atlas of the mouse and human protein-encodingtranscriptomes. Proc. Natl Acad. Sci. USA, 101, 6062–6067.
47. Zhang,W., Morris,Q.D., Chang,R., Shai,O., Bakowski,M.A.,Mitsakakis,N., Mohammad,N., Robinson,M.D., Zirngibl,R.,Somogyi,E. et al. (2004) The functional landscape of mouse geneexpression. J. Biol., 3, 21.
48. Naef,F. and Huelsken,J. (2005) Cell-type-specific transcriptomicsin chimeric models using transcriptome-based masks.Nucleic Acids Res., 33, e111.
49. Patterson,J.B. and Samuel,C.E. (1995) Expression and regulationby interferon of a double-stranded-RNA-specific adenosinedeaminase from human cells: evidence for two forms of thedeaminase. Mol. Cell. Biol., 15, 5376–5388.
Nucleic Acids Research, 2011, Vol. 39, No. 1 201
Downloaded from https://academic.oup.com/nar/article-abstract/39/1/190/2409650by gueston 13 February 2018