genetic linkage maps for asian and american lotus constructed
TRANSCRIPT
RESEARCH ARTICLE Open Access
Genetic linkage maps for Asian and Americanlotus constructed using novel SSR markersderived from the genome of sequenced cultivarMei Yang1†, Yanni Han1,3†, Robert VanBuren2, Ray Ming2, Liming Xu1, Yuepeng Han3* and Yanling Liu1*
Abstract
Background: The genus Nelumbo Adans. comprises two living species, N. nucifera Gaertan. (Asian lotus) and N.lutea Pers. (American lotus). A genetic linkage map is an essential resource for plant genetic studies and cropimprovement but has not been generated for Nelumbo. We aimed to develop genomic simple sequence repeat(SSR) markers from the genome sequence and construct two genetic maps for Nelumbo to assist genome assemblyand integration of a genetic map with the genome sequence.
Results: A total of 86,089 SSR motifs were identified from the genome sequences. Di- and tri-nucleotide repeatmotifs were the most abundant, and accounted for 60.73% and 31.66% of all SSRs, respectively. AG/GA repeatsconstituted 51.17% of dinucleotide repeat motifs, followed by AT/TA (44.29%). Of 500 SSR primers tested, 386(77.20%) produced scorable alleles with an average of 2.59 per primer, and 185 (37.00%) showed polymorphismamong two parental genotypes, N. nucifera ‘Chinese Antique’ and N. lutea ‘AL1’, and six progenies of their F1population. The normally segregating markers, which comprised 268 newly developed SSRs, 37 previouslypublished SSRs and 53 sequence-related amplified polymorphism markers, were used for genetic map construction.The map for Asian lotus was 365.67 cM with 47 markers distributed in seven linkage groups. The map for Americanlotus was 524.51 cM, and contained 177 markers distributed in 11 genetic linkage groups. The number of markersper linkage group ranged from three to 34 with an average genetic distance of 3.97 cM between adjacent markers.Moreover, 171 SSR markers contained in linkage groups were anchored to 97 genomic DNA sequence contigs of‘Chinese Antique’. The 97 contigs were merged into 60 scaffolds.
Conclusion: Genetic mapping of SSR markers derived from sequenced contigs in Nelumbo enabled the associatedcontigs to be anchored in the linkage map and facilitated assembly of the genome sequences of ‘Chinese Antique’.The present study reports the first construction of genetic linkage maps for Nelumbo, which can serve as referencelinkage maps to accelerate characterization germplasm, genetic mapping for traits of economic interest, andmolecular breeding with marker-assisted selection.
Keywords: Genetic linkage map, Genome sequence, Nelumbo, SRAP, SSR
* Correspondence: [email protected]; [email protected]†Equal contributors3Key Laboratory of Plant Germplasm Enhancement and Specialty Agricultrue,Wuhan Botanical Garden, Chinese Academy of Sciences, Wuhan, Hubei430074, China1Key Laboratory of Aquatic Plant and Watershed Ecology, Wuhan BotanicalGarden, Chinese Academy of Sciences, Wuhan, Hubei 430074, ChinaFull list of author information is available at the end of the article
© 2012 Yang et al.; licensee BioMed Central Ltd. This is an Open Access article distributed under the terms of the CreativeCommons Attribution License (http://creativecommons.org/licenses/by/2.0), which permits unrestricted use, distribution, andreproduction in any medium, provided the original work is properly cited.
Yang et al. BMC Genomics 2012, 13:653http://www.biomedcentral.com/1471-2164/13/653

BackgroundThe genus Nelumbo Adans. comprises two living spe-cies, N. nucifera Gaertn. (distributed in Asia, Australiaand Russia) and N. lutea Pers. (restricted to easternand southern North America) [1,2]. The two speciesdiffer in features of their external morphologies, suchas plant size, leaf shape, petal shape and color [1,2],and have significant genetic differences as revealed byDNA markers [3-7]. The species share the samechromosome number (2n = 16) and there is no inter-specific reproductive barrier [8]. In Asia, lotus hasbeen cultivated as a food crop for its rhizomes andseeds and as an ornamental plant for its magnificentflowers, in addition to its propagation for reasonsrelated to its cultural and religious significance.Although lotus is an important ornamental plant and a
commercial crop, knowledge of the genomic constitutionof Nelumbo species is limited. However, such informationis a prerequisite for the identification of molecular markerslinked to agronomic traits to facilitate breeding of improvedlotus cultivars. A genetic linkage map is a powerful researchtool for studies on plant genetics. Such a map may provideinsights into genome organization, evolution and compara-tive genomics with related species [9]. From the perspectiveof improving crops, a genetic map is useful for map-basedgene cloning, analysis of quantitative trait loci (QTL)underlying traits of economic importance, and molecularbreeding using marker-assisted selection (MAS) [10,11].Several DNA marker types, including random amplifiedpolymorphic DNA (RAPD) [12-14], inter simple sequencerepeats (ISSRs) [15,16], simple sequence repeats (SSRs)[3,6,7] amplified fragment length polymorphisms (AFLPs)[4,5], and sequence-related amplified polymorphisms(SRAPs) [17], have been developed for Nelumbo. The highdegree of genetic diversity with Nelumbo revealed by theseDNA markers facilitates the development of genetic linkagemaps. Linkage maps have been constructed for manyspecies, but as yet no genetic map has been developedfor Nelumbo.Simple sequence repeats are tandem repeats of one to
six nucleotides present in all eukaryotic genomes [18].Given their codominant inheritance, high polymorphism,and abundant distribution throughout genomes, SSRshave been used widely for genetic mapping, comparativeanalysis, and QTL analysis in plants [19,20]. Extensiveefforts have been made to develop SSR markers inNelumbo through genomic library screening using probesthat contain repeated motifs and expressed sequence tags(ESTs) [3,5-7,21-23]. However, the total number ofcurrently developed SSR markers (123 genomic SSRs and39 EST-SSRs) is insufficient for genetic analysis in lotus.Moreover, such experimental approaches to developingSSR markers are laborious, time-consuming and costly.Therefore, there is a strong demand for additional SSR
markers for lotus genome research and breeding. With theever-increasing number of DNA sequences available inpublic databases, genomic sequences provide a more rapidand economic method for develop SSR markers. Based onSSRs developed from the genome sequence, high-densitygenetic linkage maps can be constructed [24-27].Recently, we sequenced the genome of an ancient
lotus cultivar, ‘Chinese Antique’, at 60 × coverage using ashotgun sequencing strategy, and the DNA sequenceswere assembled into 43,197 contigs. The total length ofall contigs was 804 Mb, which represented 86.5% of theestimated 929 Mb lotus genome [28]. The availability oflotus genomic sequences provides an excellent opportunityto survey SSR motifs at a genome-wide level. The SSRsdeveloped from the contig sequences can anchor corre-sponding contigs onto a genetic map and further establishdirect links between genetic, physical, and sequence-basedmaps [25,29,30]. Therefore, a SSR-based reference geneticmap is essential for assembly of the Nelumbo genomesequences and for integration of the genetic and physicalmaps of Nelumbo.In the study reported herein, we identified SSRs from
the contig sequences of the lotus cultivar ‘ChineseAntique’ and developed a new set of SSR markers toconstruct two genetic linkage maps. Our objectives wereto: (1) assess the distribution of SSRs in the Nelumbogenome; (2) develop a large number of SSR markers andevaluate SSR polymorphism between N. nucifera ‘ChineseAntique’ and N. lutea ‘AL1’; (3) construct SSR-based refer-ence linkage maps for Asian lotus and American lotus; and(4) anchor the SSR-associated contigs to the genetic mapand facilitate assembly of the contig sequences.
ResultsIdentification and distribution of SSRs in the genomeA total of 86,089 SSR motifs with a minimum of fivecontiguous repeating units were identified within thecontig sequences. Of the total SSRs identified, di- andtri-nucleotide repeat motifs were the most abundantrepeat types, with frequencies of 60.73% and 31.66%,respectively (Table 1). Tetra- and penta-nucleotide repeatswere the least frequent repeat types (5.77% and 1.21%).The number of each major SSR type identified within thelotus genome is summarized in Table 1. The mostabundant dinucleotide motifs were AG/GA (31.08%) andAT/TA (26.90%). However, rare CG/GC motifs were iden-tified. Among trinucleotide repeats, the AAG/AGA/GAAmotif was the most common (11.79%), followed by theAAT/ATA/TAA (10.70%) and ATG/GAT/TGA (4.05%)motifs. GC-rich trinucleotide repeats were the least fre-quent. Of tetra-nucleotide repeats, AAAT/TAAA/ATAA/AATA was the most abundant, accounting for 26.47% of alltetra-nucleotide repeats, and followed by ATAC/TACA/ACAT/CATA (25.32%). Among pentanucleotide repeats,
Yang et al. BMC Genomics 2012, 13:653 Page 2 of 11http://www.biomedcentral.com/1471-2164/13/653

AGAAG/GAAGA/AAGAG/AGAGA/GAGAA motif wasmore common than other combinations. These datareflected AG/GA and AT/TA repeat motifs were the mostabundant SSRs in the N. nucifera genome.
Development of SSR markers and detection ofpolymorphismAll microsatellites were selected for SSR marker devel-opment. From the 86,089 SSR-containing sequences incontigs, 73,246 non-redundant SSR primer pairs wereidentified. Priority was given to di- and tri-nucleotiderepeats, which accounted for 61.20% and 31.05% of thetotal number of SSR primers, respectively. Among themarkers that contained dinucleotide repeats, the largestproportion was for AG/GA, followed by AT/TA motifs(Table 1). Only three markers that contained CG/GCmotifs were identified because this motif was very rarein the genome sequences analyzed. Of the markers fortrinucleotide repeats, the AAG/AGA/GAA motif was
the most common (11.83%), followed by the AAT/ATA/TAA (9.62%) and ATG/GAT/TGA (4.31%) motifs.Only 500 pairs of primers were tested for their amplifica-
tion potential in the two parents and their six F1progenies.Primer sequence information, repeat motifs, amplicon sizesand polymorphism features for these 500 primers are listedin Additional file 1. Among these primers, 459 amplified atleast one fragment in the genetic materials, and 73 primersthat produced ambiguous fragments or smears wereexcluded from the genotype analysis of the F1 lines. Of thesuccessfully amplified primers (386 pairs), the number ofalleles per primer ranged from one to seven with a mean of2.59, and a majority of them amplified two (218 pairs of pri-mers) or three (82 pairs of primers) alleles. For 386 pairs ofprimers, 185 showed polymorphism among all eight lines,and 54 showed polymorphism in the two parents but nosegregation in the six lines of the F1 population. Finally, 175SSR primers were used to analyze the genotypes of all F1progenies, which produced 450 markers with an average of2.57 per primer (Table 2).
Table 1 Distributions of the major SSR motifs identified from the genome of Nelumbo nucifera ‘Chinese Antique’
Motif Number Frequency (%) Range (bp) Primers designed Proportion (%)
Dinucleotide 52282 60.73 16-110 44824 61.20
AG/GA 26753 31.08 16-98 23084 31.52
AT/TA 23158 26.90 16-110 19656 26.84
AC/CA 2367 2.75 16-72 2081 2.84
CG/GC 4 0.00 16-20 3 0.00
Trinucleotide 27258 31.66 15-141 22745 31.05
AAG/AGA/GAA 10146 11.79 15-141 8668 11.83
AAT/ATA/TAA 9212 10.70 15-102 7049 9.62
ATG/GAT/TGA 3485 4.05 15-84 3158 4.31
AAC/ACA/CAA 1160 1.35 15-90 962 1.31
AGG/GAG/GGA 1099 1.28 15-48 958 1.31
other 2156 2.50 15-138 1950 2.66
Tetranucleotide 4964 5.77 20-184 4276 5.84
AAAT/TAAA/ATAA/AATA 1314 1.53 20-164 1190 1.62
ATAC/TACA/ACAT/CATA 1257 1.46 20-184 1071 1.46
TATC/ATCT/TCTA/CTAT 858 1.00 20-84 741 1.01
TTTC/TTCT/TCTT/CTTT 740 0.86 20-60 596 0.81
TTAA/TAAT/AATT/ATTA 179 0.21 20-36 164 0.22
Other 616 0.72 20-144 514 0.70
Pentanucleotide 1045 1.21 25-145 964 1.32
AGAAG/GAAGA/AAGAG/AGAGA/GAGAA 253 0.29 25-80 211 0.29
AAAAG/AAAGA/AAGAA/AGAAA/GAAAA 109 0.13 25-45 106 0.14
TTTCC/TTCCT/TCCTT/CCTTT/CTTTC 104 0.12 25-145 102 0.14
AAAGG/AAGGA/AGGAA/GGAAA/GAAAG 98 0.11 25-70 90 0.12
ATATA/TATAA/ATAAT/TAATA/AATAT 95 0.11 25-95 90 0.12
Other 386 0.45 25-80 365 0.50
The SSR motifs represent variants of both strands of the DNA sequence (e.g., AAT/ATA/TAA includes the reverse complements ATT, TTA and TAT).
Yang et al. BMC Genomics 2012, 13:653 Page 3 of 11http://www.biomedcentral.com/1471-2164/13/653

Analysis of genotypes in the F1 populationFor 450 markers identified using the 175 novel SSRprimers, 202 (44.89%) segregated in the female parentand 248 (55.11%) segregated in the male parent (Table 2).Thirty-three out of 95 previously published SSR primerswere polymorphic among the parents and six F1 progenies(Additional file 2), which produced 68 segregating markersin all seedlings of the mapping population. The averagenumber of markers per primer was 1.93. Among these 68SSR markers, 27 (39.71%) segregated in the female parentand 41 (60.29%) segregated in the male parent (Table 2).Of the 32 SRAP primers tested, 28 reproducibly amplified
clear polymorphic fragments in the parents and all F1progenies. A total of 91 SRAP markers were identified inthe mapping population (Table 2). On average, there were3.25 markers per primer combination, and the number ofmarkers ranged from one to eight. Of the 91 SRAPmarkers, 18 (19.78%) originated from the female parentand the remaining of 73 SRAP markers (80.22%) originatedfrom the male parent.The goodness-of-fit of observed-to-expected allelic
ratios was analyzed using the χ2 test. Of the total of 609markers, 234 (38.42%) showed a significant deviationfrom Mendelian expectations (P < 0.05). 129 markersdeviated toward the female parent and 105 markerstoward the male parent. The 129 SSR distorted markersderived from the female parent showed no segregationin the F1 progenies, which indicated a high level ofhomozygosity in the female parent. The 234 distortedmarkers were excluded from the linkage analysis becausethey could lead to false linkage between some markersor linkage groups. The remaining 375 markers, whichcomprised 118 maternal markers and 257 paternal markers,showed the expected 1:1 segregation ratio and were used toestablish the linkage groups.
Construction of two linkage mapsA framework map was constructed using 305 SSR markers(Additional file 3). Only 32 markers were identified in thematernal map and were assigned to eight small linkagegroups (LG1-F to LG8-F) with a total length of 362.52 cM.The number of markers per linkage group varied fromthree to seven. In contrast, 137 SSR markers were assignedto the paternal map, which consisted of eight major linkagegroups (LG1-M to LG8-M) and three triplets (LG9-M to
LG11-M) that covered a total length of 495.37 cM. Thenumber of markers in LG1-M to LG8-M varied from eightto 27 with an average of 12.8 (Additional file 3).To increase map coverage, SRAP markers were added
to the framework map to construct an integrated map.A total of 375 markers, including 268 novel SSRmarkers, 37 previously published SSR markers, and 70SRAP markers were available for map construction. Theaddition of SRAP markers to the framework mapallowed the SSR markers that were originally unlinkedor floating to be placed as accessory markers. Using theSSR marker orders in the framework map as thepreferred orders, 47 markers composed of 36 SSR and11 SRAP markers were identified in the maternal map.These were assigned to seven linkage groups (LG1-F toLG7-F), with three to 18 markers in each group. Themap spanned 365.67 cM with an average interval of7.78 cM between adjacent markers (Table 3 and Figure 1).The paternal linkage map consisted of 177 markers dis-tributed over 11 linkage groups (LG1-M to LG11-M).There were from three to 34 markers per linkage group.The paternal map spanned 524.51 cM with an averageinterval of 2.96 cM between adjacent markers. The geneticlength of each linkage group varied from 3.14 cM(LG11-M) to 98.45 cM (LG1-M) (Table 3 and Figure 2).
DiscussionIn the study, we analyzed the frequency of microsatellitesidentified from 43,197 contig sequences of N. nucifera‘Chinese Antique’. The 804 Mb of genomic sequenceanalyzed covers 86.5% of the lotus genome. One SSR wasdetected in every 9.33 kb in the genome sequences. Thefrequency of SSRs in lotus is much lower than that reportedin the genome sequences of Brassica [24,29,31,32] and rice[33], but higher than the estimated frequency of SSRs inthe genome of sorghum [27]. In the contig sequences,dinucleotide repeat motifs (60.73%) were the mostfrequently detected, followed by tri- (31.66%), tetra- (5.77%)and penta-nucleotide (1.21%) motifs. The most abundantdinucleotide motif detected was the AG/GA type (31.08%),followed by AT/TA (26.90%) and AC/CA (2.75%). Themost common trinucleotide motif detected was the AAG/AGA/GAA type, followed by AAT/ATA/TAA and ATG/GAT/TGA (Table 1). These motif types and their propor-tions in the lotus genome are in close agreement with the
Table 2 Markers generated for the genetic mapping
Marker Number of primerused
Number of polymorphicprimer
Maternalmarkers
Paternalmarkers
Totalmarkers
Number of distortedmarker
Novel SSR 500 175 202 248 450 182
Previous SSR 95 33 27 41 68 31
SRAP 32 28 18 73 91 21
Total 627 238 247 362 609 234
Yang et al. BMC Genomics 2012, 13:653 Page 4 of 11http://www.biomedcentral.com/1471-2164/13/653

patterns observed in dicots such as Arabidopsis [34], Bras-sica [24,31,32] and papaya [35], and in the monocot sor-ghum [27], in which AT and AG combinations of base pairmotif types are predominant. The distribution of SSRs inthe lotus genome is different from those observed inhumans and Drosophila, in which AC is the most frequentdinucleotide repeat motif, followed by AT and AG [18].The GC repeat motif is extremely rare in eukaryotic gen-omes, except in rice [33,34], and was absent from the lotusgenome. These data suggested that AG and AT motifs wererich in the lotus genome.The pseudo-testcross strategy is suitable for construction
of genetic maps using a F1 population and was applied firstfor genetic mapping in Eucalyptus [36]. Given that lotus isprotogynous and cross-pollinated, a high level of heterozy-gosity is predicted for the genomes of Nelumbo species.With this prediction in mind, we created a F1 mappingpopulation to construct genetic maps of Nelumbo in thepresent study. The two parents, N. nucifera ‘ChineseAntique’ and N. lutea ‘AL1’, diverge strongly in theirgeographical distributions and important morphologicaltraits, such as plant size, and shape and color of the leavesand petals. The two parents also show considerable geneticdifferences [3-7], which was confirmed here by the high
polymorphism (61.91%) detected using the novel SSRmarkers (Additional file 1). Of 609 markers identified inthe mapping population, the markers originated from thefemale parent (40.56%) were less than those inherited fromthe male parent (59.44%).234 markers (38.42%) showed distorted segregation at
the P < 0.05 level (Table 2), which was higher than thedistorted segregation ratio reported for Dendrobium[37], strawberry [38] and ryegrass [39]. Segregationdistortion is a common phenomenon in mapping studieswith a F1 population [37-39]. Distortion of segregationratios may result from biological factors, such as geneticisolation mechanisms, chromosome loss, locus duplica-tion, and gamete selection [40,41]. Nonbiological factors,such as scoring errors and sampling errors, also can leadto distortion in segregation ratios [42,43]. In the presentstudy, both biological factors and technical problemsmay have caused the observed segregation distortion inthe F1 population. The high level of homozygosity of thefemale parent ‘Chinese Antique’, which was unexpected,has contributed to the considerable segregation distortionin the F1 population. Hence, 129 of the markers withdistorted segregation ratios derived from the femaleparent showed no segregation in the F1 progenies. Our
Table 3 Number of markers and the length per linkage group of the integrated map, and the number of contigscorresponded to every linkage group
Linkage group Number of markers Total length(cM)
Numberof contigsNovel SSR Previous SSR SRAP Total
Female (Asian lotus) map
LG1-F 9 1 8 18 111.34 9
LG2-F 5 2 1 8 78.14 4
LG3-F 5 1 2 8 27.16 5
LG4-F 4 0 0 4 62.68 2
LG5-F 2 1 0 3 30.8 2
LG6-F 3 0 0 3 30.52 1
LG7-F 2 1 0 3 25.02 2
Male (American lotus) map
LG1-M 20 5 9 34 98.46 19
LG2-M 16 0 3 19 49.89 12
LG3-M 14 4 5 23 80.02 12
LG4-M 7 1 9 17 62.15 4
LG5-M 11 2 2 15 58.49 6
LG6-M 17 1 3 21 51.58 11
LG7-M 16 2 4 22 46.67 13
LG8-M 8 2 4 14 34.76 5
LG9-M 3 0 2 5 30.72 2
LG10-M 2 1 1 4 8.62 3
LG11-M 2 1 0 3 3.14 3
Total 146 25 53 224 890.16 97
Yang et al. BMC Genomics 2012, 13:653 Page 5 of 11http://www.biomedcentral.com/1471-2164/13/653

recent analysis of the F1 population estimate heterozygosityto be 0.03% for ‘Chinese Antique’, and 0.37 for ‘AL1’(unpublished data). Thus, the similarly low heterozygosityin the male parent aggravated the distorted segregation inthe F1 population. We observed that 96 markers skewedto the male parent showed similar segregation ratiosand were distributed in a group spanning 20.23 cM(data not shown).Molecular marker selection for genetic mapping is crucial
for the credibility of linkage maps. Due to their inheritedcharacteristics, SSR markers have many advantages in gen-etic mapping. They can also serve as anchor markers dur-ing comparative mapping with related species [20].However, the high level of homozygosity of the female par-ent precluded the availability of SSR markers assigned tothe maternal map. Moreover, using a single type of DNAmarker to construct a lotus linkage map would easily leadto uneven marker distribution and large intervals betweenadjacent markers. Therefore, in order to increase the
coverage of the linkage map and reduce the gap betweenmarkers, SRAP markers were selected to analyze the geno-types of the F1 population. Given that SRAP primers usu-ally amplify the genomic intron and exon regions offunctional genes [44], they complement the use of SSRmarkers. When SRAP markers were added to the frame-work map constructed using SSR markers, the total lengthof linkage groups increased from 857.89 to 890.16 cM, andthe average interval between two adjacent markersdecreased from 5.08 to 3.97 cM. Moreover, SSR markers inLG4-F and LG6-F of the maternal framework map wereincorporated into one linkage group LG1-F in the inte-grated map. No large gaps (> 25 cM) were detected in thesegenetic linkage maps (Additional file 3 and Additional file4). Thus, to some extent, the application of SSR and SRAPmarkers increased the length of the linkage map andreduced the distance between two adjacent markers.Using normally segregating markers, genetic linkage
maps for Nelumbowere constructed successfully (Figures 1
Figure 1 Genetic linkage map of Asian lotus (Nelumbo nucifera) constructed with SSR and SRAP markers. Map distances in centi-Morgans(cM) and marker names are shown on the left and right sides of each linkage group (LG1-F to LG7-F), respectively. The marker nomenclaturecorresponds to the primer name followed by “s” (abbreviation of “size”) and the size of product (in base pair).
Yang et al. BMC Genomics 2012, 13:653 Page 6 of 11http://www.biomedcentral.com/1471-2164/13/653

Figure 2 (See legend on next page.)
Yang et al. BMC Genomics 2012, 13:653 Page 7 of 11http://www.biomedcentral.com/1471-2164/13/653
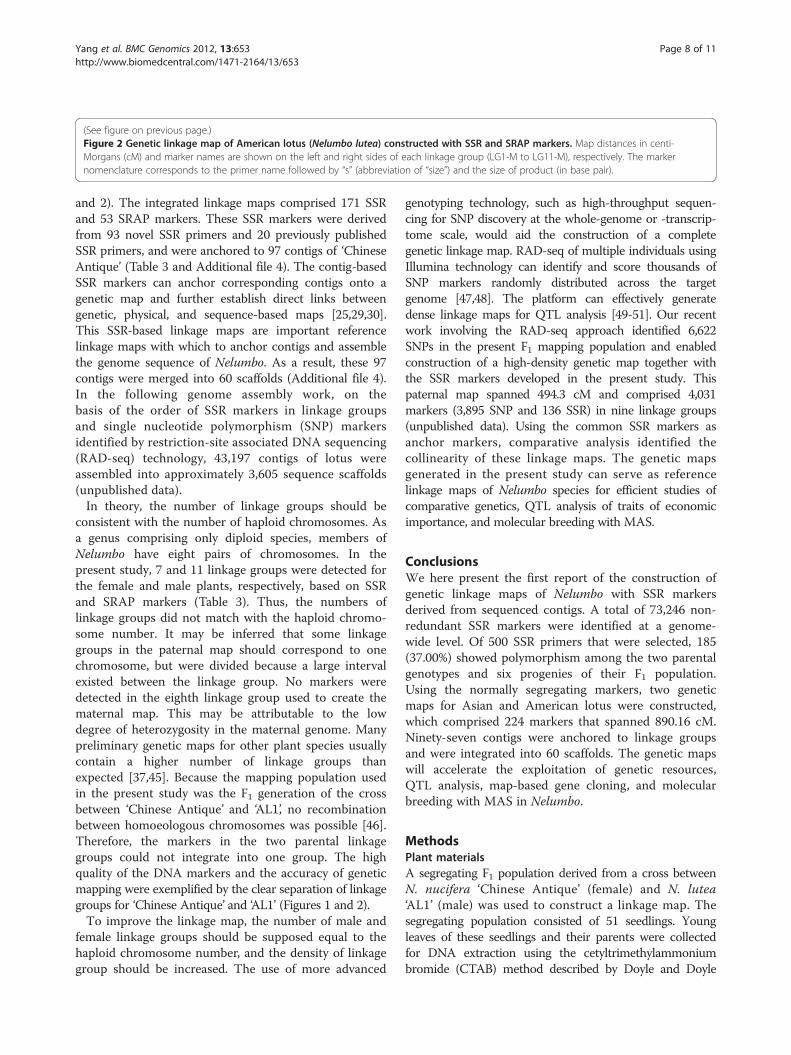
and 2). The integrated linkage maps comprised 171 SSRand 53 SRAP markers. These SSR markers were derivedfrom 93 novel SSR primers and 20 previously publishedSSR primers, and were anchored to 97 contigs of ‘ChineseAntique’ (Table 3 and Additional file 4). The contig-basedSSR markers can anchor corresponding contigs onto agenetic map and further establish direct links betweengenetic, physical, and sequence-based maps [25,29,30].This SSR-based linkage maps are important referencelinkage maps with which to anchor contigs and assemblethe genome sequence of Nelumbo. As a result, these 97contigs were merged into 60 scaffolds (Additional file 4).In the following genome assembly work, on thebasis of the order of SSR markers in linkage groupsand single nucleotide polymorphism (SNP) markersidentified by restriction-site associated DNA sequencing(RAD-seq) technology, 43,197 contigs of lotus wereassembled into approximately 3,605 sequence scaffolds(unpublished data).In theory, the number of linkage groups should be
consistent with the number of haploid chromosomes. Asa genus comprising only diploid species, members ofNelumbo have eight pairs of chromosomes. In thepresent study, 7 and 11 linkage groups were detected forthe female and male plants, respectively, based on SSRand SRAP markers (Table 3). Thus, the numbers oflinkage groups did not match with the haploid chromo-some number. It may be inferred that some linkagegroups in the paternal map should correspond to onechromosome, but were divided because a large intervalexisted between the linkage group. No markers weredetected in the eighth linkage group used to create thematernal map. This may be attributable to the lowdegree of heterozygosity in the maternal genome. Manypreliminary genetic maps for other plant species usuallycontain a higher number of linkage groups thanexpected [37,45]. Because the mapping population usedin the present study was the F1 generation of the crossbetween ‘Chinese Antique’ and ‘AL1’, no recombinationbetween homoeologous chromosomes was possible [46].Therefore, the markers in the two parental linkagegroups could not integrate into one group. The highquality of the DNA markers and the accuracy of geneticmapping were exemplified by the clear separation of linkagegroups for ‘Chinese Antique’ and ‘AL1’ (Figures 1 and 2).To improve the linkage map, the number of male and
female linkage groups should be supposed equal to thehaploid chromosome number, and the density of linkagegroup should be increased. The use of more advanced
genotyping technology, such as high-throughput sequen-cing for SNP discovery at the whole-genome or -transcrip-tome scale, would aid the construction of a completegenetic linkage map. RAD-seq of multiple individuals usingIllumina technology can identify and score thousands ofSNP markers randomly distributed across the targetgenome [47,48]. The platform can effectively generatedense linkage maps for QTL analysis [49-51]. Our recentwork involving the RAD-seq approach identified 6,622SNPs in the present F1 mapping population and enabledconstruction of a high-density genetic map together withthe SSR markers developed in the present study. Thispaternal map spanned 494.3 cM and comprised 4,031markers (3,895 SNP and 136 SSR) in nine linkage groups(unpublished data). Using the common SSR markers asanchor markers, comparative analysis identified thecollinearity of these linkage maps. The genetic mapsgenerated in the present study can serve as referencelinkage maps of Nelumbo species for efficient studies ofcomparative genetics, QTL analysis of traits of economicimportance, and molecular breeding with MAS.
ConclusionsWe here present the first report of the construction ofgenetic linkage maps of Nelumbo with SSR markersderived from sequenced contigs. A total of 73,246 non-redundant SSR markers were identified at a genome-wide level. Of 500 SSR primers that were selected, 185(37.00%) showed polymorphism among the two parentalgenotypes and six progenies of their F1 population.Using the normally segregating markers, two geneticmaps for Asian and American lotus were constructed,which comprised 224 markers that spanned 890.16 cM.Ninety-seven contigs were anchored to linkage groupsand were integrated into 60 scaffolds. The genetic mapswill accelerate the exploitation of genetic resources,QTL analysis, map-based gene cloning, and molecularbreeding with MAS in Nelumbo.
MethodsPlant materialsA segregating F1 population derived from a cross betweenN. nucifera ‘Chinese Antique’ (female) and N. lutea‘AL1’ (male) was used to construct a linkage map. Thesegregating population consisted of 51 seedlings. Youngleaves of these seedlings and their parents were collectedfor DNA extraction using the cetyltrimethylammoniumbromide (CTAB) method described by Doyle and Doyle
(See figure on previous page.)Figure 2 Genetic linkage map of American lotus (Nelumbo lutea) constructed with SSR and SRAP markers. Map distances in centi-Morgans (cM) and marker names are shown on the left and right sides of each linkage group (LG1-M to LG11-M), respectively. The markernomenclature corresponds to the primer name followed by “s” (abbreviation of “size”) and the size of product (in base pair).
Yang et al. BMC Genomics 2012, 13:653 Page 8 of 11http://www.biomedcentral.com/1471-2164/13/653

[52]. DNA samples were diluted to 50 ng μL-1, and storedat −20°C until use.
Mining of microsatellites from the contig sequences andprimer designA total of 43,197 sequenced contigs of ‘Chinese Antique’were screened for SSR motifs with the Msatfinder scriptimplemented in PERL (http://www.genomics.ceh.ac.uk/msatfinder). All SSRs with repeat motifs of two or morebase pairs and greater than five repeating units wererecorded.All microsatellites were analyzed for SSR marker
development. To eliminate redundancy and to avoiddesigning redundant sets of primers for the same locus, theselected SSR-containing sequences were screened forredundancy by comparisons among the primer sequencesand by means of BLASTN analysis against genomicsequences. The resultant contigs were parsed to design pri-mer pairs, employing the standalone Primer3 (http://frodo.wi.mit.edu/) program with a MISA-generated Primer3input file [53]. The primer length was set between 18 and23 nucleotides with an optimum size of 20 nucleotides. Themelting temperatures ranged from 50°C to 70°C with anoptimum temperature of 55°C. The optimum GC contentwas set to 50% with a minimum of 30% and a maximumof 70%. The predicted PCR products ranged from 100 to300 bp.
Evaluation of SSR polymorphismA total of 500 primers were selected from newly designedSSR markers and used to evaluate SSR polymorphism.Primers were designated ‘SSR’. Their sequences are listedin Additional file 1. All primers were synthesized byInvitrogen Biotech (Shanghai, China). All of the 500 SSRs,together with 95 previously published SSRs, were used todetect polymorphism among six F1 progenies and theirparents. The previously published primers prefixed by‘Nelumbo’, ‘NSh’, ‘PR’ and ‘NS’ were derived from gen-omic sequences of N. nucifera [6,21-23]. Primer pairs pre-fixed ‘NNEST’ and ‘NSe’ were developed from ESTsequences by Pan et al. [7] and Kubo et al. [6]. The poly-morphic SSR markers were applied for subsequent con-firmation in all F1 lines.All PCR amplifications were conducted in a 10-μL
reaction mixture that contained 50 ng of DNA, 10 ×PCR buffer, 2.0 mmol L-1 Mg2+, 0.2 mmol L−1 dNTPs,0.8 mmol L−1 of each primer, and 0.5 U Taq DNA poly-merase (MBI Fermentas Burlington, Ontario, Canada). ABio-Rad MyCycler Thermal Cycler (Bio-Rad, California,USA) and the following program were used: initial de-naturation at 94°C for 5 min; 35 cycles of 40 s at 94°C,30 s at the appropriate annealing temperature, and 40 s ofextension at 72°C; and a final elongation step at 72°C for10 min.
All PCR products were separated in a 6% denaturingpolyacrylamide gel that contained 7 mol L−1 urea and0.5 × Tris-borate-EDTA (TBE) electrophoretic buffer.The gel was pre-run in 0.5 × TBE buffer at 75 W con-stant power for 30 min. After the samples had beenloaded, the gel was run until the xylene cyanol trackingdye had passed through two-thirds of the gel. After elec-trophoresis, the gel was stained with silver nitrate solution.Allele sizes were compared with a 50-bp DNA Step Ladder(Promega, Madison, WI, USA). SSR markers were namedaccording to SSR primer names followed by the sizes(in base pair) of the DNA fragments scored.
Genotyping analysis by SRAP markerCombination of the previously published ME forwardprimers (ME1 to ME8) and EM reverse primers (EM1 toEM4) for sequence-related amplified polymorphism(SRAP) marker were used to analyze the genotypes of theF1 population [44]. Each 10-μL PCR mixture consisted of50 ng DNA, 10 × PCR buffer, 2.0 mmol L−1 Mg2+,0.2 mmol L−1 dNTPs, 0.8 mmol L−1 of each primer, and0.75 U Taq DNA polymerase. The PCR amplification pro-cedure was as follows: 5 min of denaturation at 94°C; fivecycles of 1 min of denaturation at 94°C, 1 min of anneal-ing at 35°C, and 1 min of elongation at 72°C, then30 cycles with the annealing temperature at 50°C; and afinal elongation step of 7 min at 72°C. The amplifiedSRAP fragments were separated and visualized usingthe same procedure for the SSR fragments.
Segregation analysis and construction of genetic linkagemapThe genotypic data for the F1 population analyzed withSSR and SRAP markers were used for the constructionof a genetic map of lotus. The linkage analysis wasperformed using JoinMap version 4.0 [54]. Two heterozy-gous alleles from either parent were expected to segregateat a 1:1 ratio. The observed and expected allelic ratios forall markers were compared using the chi-squared (χ2) test.Markers were excluded from the linkage analysis whenthey showed significantly distorted segregation (P < 0.05).Only the markers with a P value higher than 0.05 wereused for further linkage analysis.To construct a suitably robust map, we followed the
strategy described by Yang et al. [55]. This involved firstusing SSR markers to construct a preliminary frameworkmap, and then joining SRAP markers to construct anintegrated map using the order of the SSR markers inthe framework as preferred orders (the ‘fixed order’function). During construction of the framework andintegrated maps, maternal and paternal data sets werecreated using the function ‘Create Maternal and PaternalPopulation Node’ in the JoinMap program. Maternaland paternal data were used to construct maternal and
Yang et al. BMC Genomics 2012, 13:653 Page 9 of 11http://www.biomedcentral.com/1471-2164/13/653

paternal maps, respectively. The regression mappingalgorithm was used for map construction. The thresholdfor goodness of fit was set to ≤ 5.0 with logarithm of theodds ratio (LOD) scores > 1.0 and a combination frequency< 0.35. Map distances were calculated using Kosambi’smapping function, and denoted in centi-Morgans (cM).
Additional files
Additional file 1: Primer sequence information, repeat motifs,amplicon sizes, and polymorphism features for novel simplesequence repeat (SSR) markers from the genome sequences ofNelumbo nucifera 'Chinese Antique'.
Additional file 2: Details on previously published simple sequencerepeat (SSR) markers of Nelumbo nucifera.
Additional file 3: Framework map constructed using simplesequence repeat (SSR) markers for Nelumbo.
Additional file 4: Integrated map constructed using simplesequence repeat (SSR) and sequence-related amplifiedpolymorphism (SRAP) markers for Nelumbo.
Competing interestsThe authors declare that there are no competing interests.
Authors’ contributionsMY carried out genetic mapping, analyzed the data, and drafted themanuscript. YNH participated in the marker development and polymorphismdetected. RVB participated in the sequence analyses and the markerdevelopment. RM participated in the design of the study and helped draftthe manuscript. LMX cultivated and provided the plant materials. YPHparticipated in genetic mapping and drafted the manuscript. YLL conceivedthe study, participated in its design and coordination, and helped to draftthe manuscript. All authors read and approved the final manuscript.
AcknowledgmentsThis research was financially supported by Knowledge Innovation Project ofChinese Academy of Sciences (KSCX2-EW-J-20) and National Natural ScienceFoundation of China (31272195).
Author details1Key Laboratory of Aquatic Plant and Watershed Ecology, Wuhan BotanicalGarden, Chinese Academy of Sciences, Wuhan, Hubei 430074, China.2Department of Plant Biology, University of Illinois at Urbana-Champaign,Urbana, IL 61801, USA. 3Key Laboratory of Plant Germplasm Enhancementand Specialty Agricultrue, Wuhan Botanical Garden, Chinese Academy ofSciences, Wuhan, Hubei 430074, China.
Received: 21 May 2012 Accepted: 7 November 2012Published: 21 November 2012
References1. Wang QC, Zhang XY: Colored Illustration of Lotus Cultivars in China. Beijing:
China Forestry Publishing House; 2005.2. Zhang XY, Chen LQ, Wang QC: New lotus flower cultivars in China. Beijing:
China forestry Publishing House; 2011.3. Pan L, Quan ZW, Hu JH, Wang GY, Liu SN, He Y, Ke WD, Ding Y: Genetic
diversity and differentiation of lotus (Nelumbo nucifera) accessionsassessed by simple sequence repeats. Ann Appl Biol 2011, 159(3):428–441.
4. Fu J, Xiang Q, Zeng X, Yang M, Wang Y, Liu Y: Assessment of the geneticdiversity and population structure of lotus cultivars grown in China byamplified fragment length polymorphism. J Am Soc Hortic Sci 2011,136(5):339–349.
5. Hu J, Pan L, Liu H, Wang S, Wu Z, Ke W, Ding Y: Comparative analysis ofgenetic diversity in sacred lotus (Nelumbo nucifera Gaertn.) using AFLPand SSR markers. Mol Biol Rep 2012, 39(4):3637–3647.
6. Kubo N, Hirai M, Kaneko A, Tanaka D, Kasumi K: Classification and diversityof sacred and American Nelumbo species: the genetic relationships of
flowering lotus cultivars in Japan using SSR markers. Plant GeneticResources 2009, 7(03):260–270.
7. Pan L, Xia Q, Quan Z, Liu H, Ke W, Ding Y: Development of novel EST-SSRfrom sacred Lotus (Nelumbo nucifera Gaertn) and their utilization for thegenetic diversity analysis of N. nucifera. J Hered 2010, 101(1):71–82.
8. Huang XQ, Chen JY, Huang GC: Preliminary studies on biosystematicalrelationship between the two Nelumbo species. Acta Horticulture Sinica1992, 19(2):164–170.
9. Shibaike H: Molecular genetic mapping and plant evolutionary biology.J Plant Res 1998, 111(3):383–388.
10. Collard B, Jahufer M, Brouwer J, Pang E: An introduction to markers,quantitative trait loci (QTL) mapping and marker-assisted selection forcrop improvement: The basic concepts. Euphytica 2005, 142(1–2):169–196.
11. Collard BCY, Mackill DJ: Marker-assisted selection: an approach for precisionplant breeding in the twenty-first century. Philosophical Transactions of theRoyal Society B:Biological Sciences 2008, 363(1491):557–572.
12. Guo HB, Li S, Peng J, Ke W: Genetic diversity of Nelumbo accessionsrevealed by RAPD. Genet Resour Crop Evol 2007, 54(4):741–748.
13. Li Z, Liu X, Gituru RW, Juntawong N, Zhou M, Chen L: Genetic diversity andclassification of Nelumbo germplasm of different origins by RAPD andISSR analysis. Sci Hortic 2010, 125(4):724–732.
14. Na A, Guo HB, Ke WD: Genetic variation in rhizome lotus (Nelumbonucifera Gaertn. ssp. nucifera) germplasms from China assessed by RAPDmarkers. Agricultural Sciences in China 2009, 8(1):31–39.
15. Chen YY, Zhou RC, Lin XC, Wu KQ, Qian XE, Huang SZ: ISSR analysis of geneticdiversity in sacred lotus cultivars. Aquatic Botanty 2008, 89(3):311–316.
16. Han YC, Teng CZ, Wahiti G, Zhou MQ, Hu ZL, Song YC: Mating system andgenetic diversity in natural populations of Nelumbo nucifera(Nelumbonaceae) detected by ISSR markers. Plant Systematics andEvolution 2009, 277(1):13–20.
17. Yang M, Han YN, Xu LM, Zhao JR, Liu YL: Comparative analysis of geneticdiversity of lotus (Nelumbo) using SSR and SRAP markers. Sci Hortic 2012,142:185–195.
18. Katti MV, Ranjekar PK, Gupta VS: Differential distribution of simplesequence repeats in eukaryotic genome sequences. Mol Biol Evol 2001,18(7):1161–1167.
19. Park YJ, Lee JK, Kim NS: Simple sequence repeat polymorphisms (SSRPs)for evaluation of molecular diversity and germplasm classification ofminor crops. Molecules 2009, 14(11):4546–4569.
20. Varshney RK, Graner A, Sorrells ME: Genic microsatellite markers in plants:features and applications. Trends Biotechnol 2005, 23(1):48–55.
21. Kubo N, Hirai M, Kaneko A, Tanaka D, Kasumi K: Development andcharacterization of simple sequence repeat (SSR) markers in the waterlotus (Nelumbo nucifera). Aquatic Botanty 2009, 90(2):191–194.
22. Pan L, Quan Z, Li S, Liu H, Huang X, Ke W, Ding Y: Isolation andcharacterization of microsatellite markers in the sacred lotus (Nelumbonucifera Gaertn). Mol Ecol Notes 2007, 7(6):1054–1056.
23. Tian HL, Chen XQ, Wang JX, Xue JH, Wen J, Mitchell G, Zhou SL:Development and characterization of microsatellite loci for lotus(Nelumbo nucifera). Conserv Genet 2008, 9(5):1385–1388.
24. Li HT, Chen X, Yang Y, Xu JS, Gu JX, Fu J, Qian XJ, Zhang SC, Wu JS, Liu KD:Development and genetic mapping of microsatellite markers fromwhole genome shotgun sequences in Brassica oleracea. Mol Breed 2011,28(4):585–596.
25. Thudi M, Bohra A, Nayak SN, Varghese N, Shah TM, Penmetsa RV,Thirunavukkarasu N, Gudipati S, Gaur PM, Kulwal PL, et al: Novel SSRmarkers from BAC-end sequences, DArT arrays and a comprehensivegenetic map with 1,291 marker loci for chickpea (Cicer arietinum). PLoSOne 2011, 6(11):e27275.
26. Geethanjali S, Kadirvel P, Pe AR, Rao E, Wang JF: Development of tomatoSSR markers from anchored BAC clones of chromosome 12 and theirapplication for genetic diversity analysis and linkage mapping. Euphytica2011, 178(2):283–295.
27. Yonemaru J, Ando T, Mizubayashi T, Kasuga S, Matsumoto T, Yano M:Development of genome-wide simple sequence repeat markers usingwhole-genome shotgun sequences of sorghum (Sorghum bicolor (L.)Moench). DNA Res 2009, 16(3):187–193.
28. Diao Y, Chen L, Yang GX, Zhou MQ, Song YC, Hu ZL, Liu JY: Nuclear DNAC-values in 12 species in nymphaeales. Caryologia 2006, 59(1):25–30.
29. Xu JS, Qian XJ, Wang XF, Li RY, Cheng XM, Yang YA, Fu J, Zhang SC, KingGJ, Wu JS, et al: Construction of an integrated genetic linkage map for
Yang et al. BMC Genomics 2012, 13:653 Page 10 of 11http://www.biomedcentral.com/1471-2164/13/653

the A genome of Brassica napus using SSR markers derived fromsequenced BACs in B. rapa. BMC Genomics 2010, 11:594.
30. Han Y, Zheng D, Vimolmangkang S, Khan MA, Beever JE, Korban SS:Integration of physical and genetic maps in apple confirms whole-genome and segmental duplications in the apple genome. J Exp Bot2011, 62(14):5117–5130.
31. Iniguez-Luy F, Voort A, Osborn T: Development of a set of public SSRmarkers derived from genomic sequence of a rapid cycling Brassicaoleracea L. genotype. Theor Appl Genet 2008, 117(6):977–985.
32. Cheng XM, Xu JS, Xia S, Gu JX, Yang Y, Fu J, Qian XJ, Zhang SC, Wu JS, LiuK: Development and genetic mapping of microsatellite markers fromgenome survey sequences in Brassica napus. Theor Appl Genet 2009,118(6):1121–1131.
33. Temnykh S, DeClerck G, Lukashova A, Lipovich L, Cartinhour S, McCouch S:Computational and experimental analysis of microsatellites in rice(Oryza sativa L.): frequency, length variation, transposon associations,and genetic marker potential. Genome Res 2001, 11(8):1441–1452.
34. Lawson MJ, Zhang LQ: Distinct patterns of SSR distribution in theArabidopsis thaliana and rice genomes. Genome Biol 2006, 7:R14.
35. Wang J, Chen C, Na J-K, Yu Q, Hou S, Paull R, Moore P, Alam M, Ming R:Genome-wide comparative analyses of microsatellites in papaya. TropicalPlant Biology 2008, 1(3):278–292.
36. Grattapaglia D, Sederoff R: Genetic linkage maps of Eucalyptus grandisand Eucalyptus urophylla using a pseudo-testcross: mapping strategyand RAPD Markers. Genetics 1994, 137(4):1121–1137.
37. Lu JJ, Zhao HY, Suo NN, Wang S, Shen B, Wang HZ, Liu JJ: Genetic linkagemaps of Dendrobium moniliforme and D. officinale based on EST-SSR,SRAP, ISSR and RAPD markers. Sci Hortic 2012, 137:1–10.
38. Sargent DJ, Passey T, Surbanovski N, Lopez Girona E, Kuchta P, Davik J,Harrison R, Passey A, Whitehouse AB, Simpson DW: A microsatellite linkagemap for the cultivated strawberry (Fragaria × ananassa) suggests extensiveregions of homozygosity in the genome that may have resulted frombreeding and selection. Theor Appl Genet 2012, 124(7):1229–1240.
39. Jones EJ, Dupal MD, Dumsday JD, Hughes LH, Forster JF: An SSR-basedgenetic linkage map for perennial ryegrass (Lolium perenne L.).Theor Appl Genet 2002, 105(4):577–584.
40. Liebhard R, Koller B, Gianfranceschi L, Gessler C: Creating a saturatedreference map for the apple (Malus × domestica Borkh.) genome.Theor Appl Genet 2003, 106(8):1497–1508.
41. Moyle LC, Graham EB: Genome-wide associations between hybrid sterilityQTL and marker transmission tatio distortion. Mol Biol Evol 2006,23(5):973–980.
42. Devey ME, Fiddler TA, Liu BH, Knapp SJ, Neale DB: An RFLP linkage mapfor loblolly pine based on a three-generation outbred pedigree.Theor Appl Genet 1994, 88(3):273–278.
43. Echt CS, Nelson CD: Linkage mapping and genome length in easternwhite pine (Pinus strobus L.). Theor Appl Genet 1997, 94(8):1031–1037.
44. Li G, Quiros CF: Sequence-related amplified polymorphism (SRAP), a newmarker system based on a simple PCR reaction: its application tomapping and gene tagging in Brassica. Theor Appl Genet 2001,103(2):455–461.
45. Varshney RK, Bertioli DJ, Moretzsohn MC, Vadez V, Krishnamurthy L, Aruna R,Nigam SN, Moss BJ, Seetha K, Ravi K, et al: The first SSR-based geneticlinkage map for cultivated groundnut (Arachis hypogaea L.). Theor ApplGenet 2009, 118(4):729–739.
46. Pearl HM, Nagai C, Moore PH, Steiger DL, Osgood RV, Ming R: Construction ofa genetic map for arabica coffee. Theor Appl Genet 2004, 108(5):829–835.
47. Davey JW, Blaxter ML: RADSeq: next-generation population genetics.Briefings in Functional Genomics 2010, 9(5–6):416–423.
48. Davey JW, Hohenlohe PA, Etter PD, Boone JQ, Catchen JM, Blaxter ML:Genome-wide genetic marker discovery and genotyping using next-generation sequencing. Nat Rev Genet 2011, 12(7):499–510.
49. Pfender W, Saha M, Johnson E, Slabaugh M: Mapping with RAD (restriction-site associated DNA) markers to rapidly identify QTL for stem rustresistance in Lolium perenne. Theor Appl Genet 2011, 122(8):1467–1480.
50. Scaglione D, Acquadro A, Portis E, Tirone M, Knapp SJ, Lanteri S: RAD tagsequencing as a source of SNP markers in Cynara cardunculus L. BMCGenomics 2012, 13:3.
51. Barchi L, Lanteri S, Portis E, Acquadro A, Vale G, Toppino L, Rotino GL:Identification of SNP and SSR markers in eggplant using RAD tagsequencing. BMC Genomics 2011, 12:304.
52. Doyle JL, Doyle JJ: Isolation of plant DNA from fresh tissue. Focus 1990,12:13–15.
53. Rozen S, Skaletsky H: Primer3 on the WWW for General Users and forBiologist Programmers. 1999, 132:365–386.
54. JW VO: JoinMapW4.0: software for the calculation of genetic linkage maps inexperimental populations. Wageningen, Netherlands: Kyazma BV; 2006.
55. Yang M, Ding G, Shi L, Feng J, Xu F, Meng J: Quantitative trait loci for rootmorphology in response to low phosphorus stress in Brassica napus.Theor Appl Genet 2010, 121(1):181–193.
doi:10.1186/1471-2164-13-653Cite this article as: Yang et al.: Genetic linkage maps for Asian andAmerican lotus constructed using novel SSR markers derived from thegenome of sequenced cultivar. BMC Genomics 2012 13:653.
Submit your next manuscript to BioMed Centraland take full advantage of:
• Convenient online submission
• Thorough peer review
• No space constraints or color figure charges
• Immediate publication on acceptance
• Inclusion in PubMed, CAS, Scopus and Google Scholar
• Research which is freely available for redistribution
Submit your manuscript at www.biomedcentral.com/submit
Yang et al. BMC Genomics 2012, 13:653 Page 11 of 11http://www.biomedcentral.com/1471-2164/13/653