genetic diversity of madurese bambara...
TRANSCRIPT

101
SABRAO Journal
of Breeding and Genetics 50 (2) 101-114, 2018
GENETIC DIVERSITY OF MADURESE BAMBARA GROUNDNUT (Vigna
subterranea L. Verdc.) LINES BASED ON MORPHOLOGICAL AND
RAPD MARKERS
S. FATIMAH 1, 2, ARIFFIN3, N.R. ARDIARINI 3 and KUSWANTO*3
1Post Graduate Program, Faculty of Agriculture, Brawijaya University, Indonesia 2Faculty of Agriculture, University of Trunojoyo Madura, Jl. Raya Telang
PO BOX 2 Bangkalan Madura, East Java, Indonesia 3Faculty of Agriculture, Brawijaya University, Jl. Veteran Malang, East Java, Indonesia
*Corresponding author’s e-mail: [email protected]
Email addresses of coauthors: [email protected], [email protected],
SUMMARY
Comparison of different methods in the calculation of genetic diversity can be
useful in plant breeding and conservation programs. This study used twelve potential bambara groundnut lines. A total of 41 morphological characters and 10
RAPD primers were used to assess the genetic relationships based on the
morphological characters and RAPD markers and to determine the potential lines
of bambara groundnut with the desired traits for line development in plant
breeding and conservation programs. Cluster analysis based on the similarity
coefficient of 12 bambara groundnut lines using both morphological and RAPD
markers produced 2 clusters with a similarity degree of 52% for morphological markers and 51% for RAPD markers. There were differences between
morphological and RAPD dendrograms. DNA markers derived from RAPD analysis
were unrelated to morphological characters. Therefore, the selection of Bambara
groundnut could not be conducted on the basis of the difference in morphological
characters.
Key words: Bambara groundnuts, morphological markers, RAPD markers
Key findings: The genetic relationships among local Madurese lines (G8, G9, and
G10) had similarity coefficients of 0.83 to 0.94. Three potential bambara
groundnut lines (G5, G9, and G11) for development in breeding and cultivation
programs were obtained.
Manuscript received: January 6, 2018; Decision on manuscript: April 27, 2018; Accepted: May 10, 2018.
© Society for the Advancement of Breeding Research in Asia and Oceania (SABRAO) 2018
Communicating Editor: Prof. Dr. Desta Wirnas
RESEARCH ARTICLE
SABRAO J. Breed. Genet. 50 (2) 101-114
102
INTRODUCTION
The Bambara groundnut (Vigna
subterranea L.Verdc.) is a legume plant that originated from Africa.
This crop has the potential to be one
of the future alternative food sources
since its dry seed contains 1621%
protein, 5060% carbohydrate,
4.56.6% fat, calcium, phosphorus,
iron, and vitamin B1 (Suwanprasert
et al., 2006). This crop could also be
developed for dry land areas, such as
Madura. Bambara groundnut has the advantage of being able to survive in
a dry environments with low nutrient
content (Goli, 1995; Zeven, 1998;
Berchie et al., 2012).
Bambara groundnut has not
been widely developed in Indonesia. In East Java, it is only cultivated in
Gresik, Lamongan, and Bangkalan
Madura. This crop gains less
attention in Indonesia and the
productivity at the farm level
remains low. A study by Redjeki
(2003) showed that planting seeds of various colors produces 0.7 to 2.0
tons per hectare of dry seeds. This
crop is capable of producing 4.0 tons
per hectare of dry grains at optimal
growing conditions (Kouassi and
Zoro-Bi, 2010). One of the causes of low
productivity of bambara groundnut at
the farm level is the use of local
lines. Kuswanto et al. (2011) showed
that among the 50 tested local lines
of bambara groundnut originated from East Java and West Java, there
were high levels of diversity in both
within and between the lines,
including the character of plant
growth habit, leaf shape, and stem
hairiness. Hence, plant breeding
activities should be done immediately to improve the local lines by
purifying the potential local lines
followed by selection. Furthermore,
these lines are expected to be
developed into new varieties or to
serve as parents in crossbreeding. Development of the new
varieties requires information on the
genetic relationships among the
materials serving as the prospective
parents. Information on genetic
relationships based on both morphological and molecular
characteristics are required to select
parents for breeding programs
(Pabendon et al., 2007). The genetic
relationships are then used to
determine the genetic diversity and genetic distance among the genotypes
tested. Information on genetic
diversity could be obtained based on
morphological characters both
quantitative and qualitative (Collinson
et al., 1999; Massawe, 2000).
Morphological characters have weaknesses because the characters
are often influenced by environmental
factors (Hadiati and Sukmadjaja,
2002; Massawe et al., 2003; Amzeri,
2015). Therefore, identification at the
molecular level is required to complement the morphological
characters (Galvan et al., 2001).
Identification at the molecular
level is a highly effective method for
analyzing plant genomes (Yuwono,
2006). One of the molecular markers
for identification at the DNA level is the RAPD (random amplified
polymorphic DNA) method. The RAPD
method effectively and rapidly
detects polymorphisms at some loci
(Azrai, 2005). According to Tingey et
al. (1994), the advantage of RAPD method is it does not require to have
knowledge of the genome of the
plant. RAPD markers have been
widely used for tropical plants,
especially for Araceae species (Irwin
et al., 1998; Jimenez et al, 2002;

Siti et al. (2018)
103
Prana and Hartati 2003; Nowbuth et
al., 2005; Poerba and Yuzammi,
2008).
The objectives of this study were: (1) to examine the genetic
relationships among bambara
groundnut lines based on the
morphological and RAPD characters,
and (2) to determine the genotypes
of bambara groundnut lines with potential characters for development
in breeding and cultivation programs.
MATERIALS AND METHODS
Genetic materials
The study was conducted at
Pagesangan village, Surabaya-East
Java, Indonesia with altitude of 3-6
m above sea level, from December of
2016 until May of 2017. The genetic materials used were 11 potential
lines of bambara groundnut derived
from purification of local lines
originating from various regions in
Indonesia and one reference line
from the collection of the Breeding Laboratory, Faculty of Agriculture,
Brawijaya University Malang (UB
Cream) (Table 1). Twelve potential
lines under study resulted from the
four cyles of selection of inbred lines
on the basis of similarity of
characters and high yield among the 158 bambara groundnut genotypes
of Indonesia.
Morphological characterization
Morphological characterization was observed by planting 12 potential lines
in a pot using grumosol soil during the
wet season with an average rainfall of
100.7 to 465.7 mm and 7 to25 days of
rain (Indonesian Agency for
Meteorological, Climatological and
Geophysics, Juanda Sidoarjo, East
Java, Indonesia). The morphological
characterization was done in a
completely randomized design (CRD) replicated three times.
The morphological characters
observed were quantitative and
qualitative characters. The
quantitative characters were sprout
age (SA), first leaf (FL), flowering age (FA), number of harvest days (NHD),
number of leave (NL), number of
flowers (NF), plant height (PH), plant
diameter (PD), leaf thickness (LT),
terminal leaf width (TLW), terminal
leaf length (TLL), internode length (IL), petiole length (PL), number of
branches (NB), root length (RL), fresh
weight of crop residues (FWtC),
number of stem segments (NSS),
number of pods (NP), fresh weight of
pods per plant (FWtP), fresh weight of
pod per pod (FWtPP), dry weight of crop residues (DWtC), dry weight of
pod per plant (DWtP), pod length (PL),
pod width (PW), skin weight (SW),
number of seeds (NS), seed weight
per plant (SWP), and seed weight per
seed (SWS). While the qualitative characters were hypocothyl pigment,
hypocothyl groove, color of terminal
leaflet, terminal leaflet shape, growth
habit, pigmentation on wing, stem
hairiness, pod color, pod shape, pot
texture, two seed pods, seed color,
and seed shape.
Isolation of DNA
DNA was isolated using CTAB
method, in which 0.1 g sample of
fresh leaves was crushed in a mortar. A total of 1500 l of CTAB
buffer solution (consisting of 2%
CTAB, 1.4 M NaCl, 100 mM Tris HCl pH 8, 20 mM EDTA pH 8, 2% PVP-40
1, and 2% mercaptoethanol),
previously incubated on a water bath
SABRAO J. Breed. Genet. 50 (2) 101-114
104
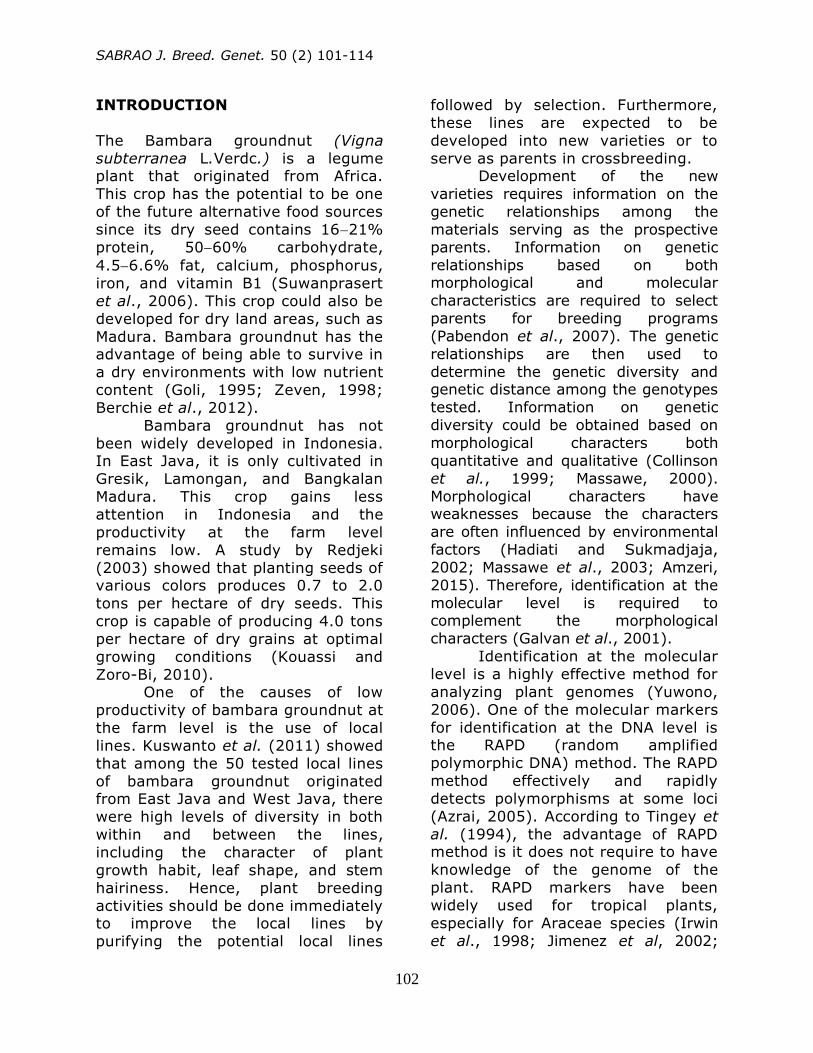
Table 1. Code, name and origin of bambara groundnut lines studied.
No. Code Name of Line Origin of Line
1 G1 GSG 1.1.1 Gresik, East Java, Indonesia
2 G2 GSG 2.4 Gresik, East Java, Indonesia
3 G3 GSG 3.1.2 Gresik, East Java, Indonesia
4 G4 BBL 2.1.1 Lamongan, East Java, Indonesia
5 G5 BBL 6.1.1 Lamongan, East Java, Indonesia
6 G6 CCC 2.1.1 Cianjur, West Java, Indonesia
7 G7 GSG 2.1.1 Gresik, East Java, Indonesia
8 G8 JLB 1 Madura, East Java, Indonesia
9 G9 CKB 1 Madura, East Java, Indonesia
10 G10 TKB 1 Madura, East Java, Indonesia
11 G11 PWBG 5.3.1 Gresik, East Java, Indonesia
12 G12 UB Cream UB (University of Brawijaya), East Java,
Indonesia
at 65˚C for 30 min, was added. The
crushed mixture was subsequently incubated at 65˚C for 60 min. The
mixture was stirred for 10 min to
maintain homogeneity.
After incubation, the mixture
was taken from the water bath and
left for 2 minutes. Subsequently, 500 l of chloroform-isoamyl alcohol
(CIAA) (24:1) were added to each
sample and subjected to a vortex for 5 min and to centrifugation for 15
min at 12,000 rpm. The supernatant
was taken carefully and sodium
acetate at a 1/10 of the supernatant
volume was added. Cold isopropanol
of 2/3 of the total (supernatant +
sodium acetate) volume was then added and mixed by shaking the
tube and left at 4˚C for 1 to 24
hours. Furthermore, the supernatant
was centrifuged at 12,000 rpm for 10
min. It was then removed and the
precipitated DNA was washed with 500 l of 70% ethanol and
centrifuged for 5 min at 12,000 rpm.
The supernatant was removed and
the precipitated DNA was dried. After drying, the precipitated DNA was
dissolved with 50 l of ddH2O
(distilled) solution and then stored in
a refrigerator at 4˚C. The quantity of the extracted DNA was tested using
Gene Quant and then measured for
absorbance at a wavelength of 260
nm.
PCR-RAPD analysis
DNA amplification was performed
using the Bio-Rad PCR system with a
total volume of 10 l for each PCR
tube. Each PCR reaction consisted of
5 l of Go Taq® Green (Promega)
PCR mix, 0.25 l of 100 M primer
(OPA-4, OPA-5, OPA-9, OPB-15,
OPC-2, OPD-3, OPD-13, OPD-15,
OPD-20, and OPC-1), 2.5 l of DNA
sample (template), and 2.25
nuclease-free water. The first heating
was carried out at 95°C for 3 min,
followed by 35 cycles of denaturation at 95°C for 30 s, annealing at 37°C
for 30 s, and elongation at 72°C for
1 min and 30 s, and then followed by
final elongation at 72°C for 5 min.
The PCR-derived DNA was
subsequently electrophoresed using 1.5% (w/v) agarose, previously
added with FloroSafe DNA Stain as a

Siti et al. (2018)
105
dye, in a TBE buffer (consisting of
0.45 M of Tris-HCl pH 8, 0.45 M of
Boric acid, and 20 mM of EDTA) at a
voltage of 100 volts for 45 min. The results were visualized under UV
light.
Data analysis
The genetic relationships were determined on the basis of
morphological character by using the
Pearson’s correlation formula and
characterization and assessment in a
n (morphological character) x t
(operational taxonomic unit) table. The operational taxonomic unit is the
characterized bambara groundnut
lines. Scoring consisted of the binary
scoring for the presence or absence
of a trait and the multi-state scoring
for the qualitative and quantitative
traits. Standardization of traits was carried out to process data into a
binary data. The similarity matrix
was then subjected to a cluster
analysis. A dendrogram was
constructed from the formed clusters
using the UPGMA (Unweighted Pair Group Method with Arithmetic Mean)
method. Then, cophenetic correlation
coefficient between the similarity
matrix and dendrogram was
calculated. The similarity coefficient
indicates the accuracy of clustering.
The entire analysis was performed using the NTSys version 2.1 software
(Rohlf, 2000).
The RAPD marker-based
genetic relationships were based on
whether or not DNA bands are
present. The DNA band profile was translated into a binary data which 0
indicates no DNA band and 1
indicates presence of DNA bands at
the same position of the individual
being compared. Cluster analysis and
dendrogram were made using the
unweighted pair group method with
arithmetic mean (UPGMA) method
with the numerical taxonomy and
multivariate system (NTSYS) version 2.1 software.
RESULTS AND DISCUSSION
Diversity analysis based on morphological characters
The results of clustering based on
morphological characters of bambara
groundnut lines do not always
provide clustering by region of origin, but by the similarity of morphological
characters among bambara
groundnut lines tested (Tables 2 and
3). Genetic sequencing and selection
lead to a greater genetic diversity
than plant-growing distances; thus,
despite the same region of origin of bambara groundnut genotypes,
different growing environments may
affect genetic diversity (Akmal,
2008). Furthermore, according to
Jose et al. (2005), genotypes from
the same region of origin do not always belong to the same cluster.
The results of this study are in line
with the study done by Yang et al.
(2006) showing that bambara
groundnut was not clustered on the
basis of its origin. In the assessment
of the closeness of genetic relationships, genotype clustering is
determined by the similarity of
morphological characters.

SABRAO J. Breed. Genet. 50 (2) 101-114
106
Table 2. Qualitative characters performance of Madurese bambara groundnut lines.
Character Genotypes
G1 G2 G3 G4 G5 G6 G7 G8 G9 G10 G11 G12
Hypocotyl
pigment
Yellowish
Green
Yellowish
Green Green Green Green
Yellowish
Green
Yellowish
Green
Yellowish
Green Green Green Green Red
Hypocotyl
groove present Present present present present absent Present present present absent present present
Color of
terminal
leaflet
Bright Green
Bright Green
Bright Green
Bright Green
Bright Green
Dark Green
Bright Green
Bright Green
Dark Green
Dark Green
Bright Green
Bright Green
Terminal
leaflet shape
Lanceolate Lanceolate Lanceolate Lanceolate Lanceolate Elliptical Lanceolate Lanceolate Elliptical Elliptical Lanceolate Lanceolate
Growth
habit Spreading Spreading
Semi-
Bunch
Semi-
Bunch Spreading
Semi-
Bunch
Semi-
Bunch
Semi-
Bunch Spreading Spreading Spreading
Semi-
Bunch
Flower
pigment present Present present present present present Present present present present present present
Stem hairiness
Smooth Smooth Smooth Smooth Smooth Smooth Smooth Smooth Smooth Smooth Smooth Smooth
Pod color Dark Dark Dark Dark Dark Dark Dark Dark Dark Dark Dark Bright
Pod
shape Pointed Pointed Pointless Pointed Pointed Pointed Pointed Pointed Pointed Pointed Pointed Pointed
Pod texture
Rough Rough Rough Rough Rough Rough Rough Rough Rough Rough Rough Smooth
Two seed pods
absent Present present present present absent Absent absent present present present absent
Seed
color Black Black Black Black Black Black Black Black Black Black Black Cream
Seed
shape Oval Oval Oval Oval Oval Oval Oval Oval Oval Oval Oval Oval
Siti et al. (2018)
107
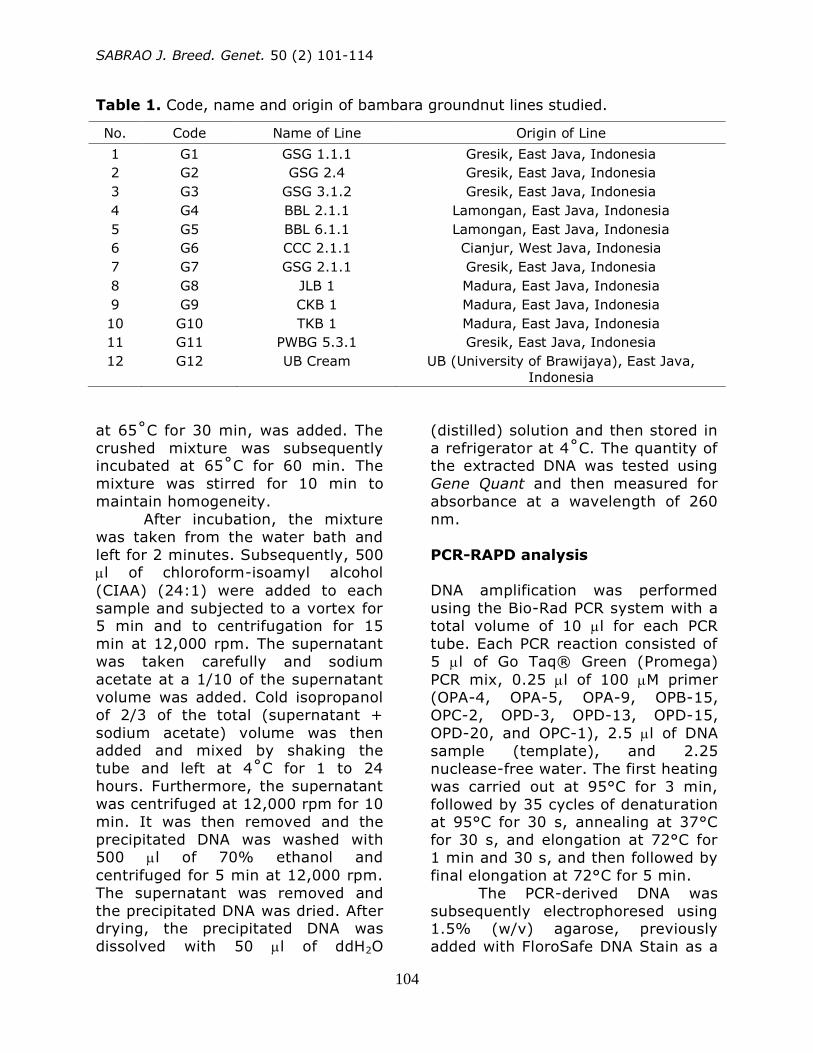
Table 3. Quantitative characters of Madurese bambara groundnut lines.
Character Genotype
G1 G2 G3 G4 G5 G6 G7 G8 G9 G10 G11 G12
SA 7.33 6.67 6.67 6.33 6.33 5.67 7.67 7.33 6.33 7.33 6.67 8.00
FL 10.00 8.33 10.00 8.67 8.00 9.00 10.00 10.00 10.33 9.33 9.33 9.67
FA 40.67 39.67 40.67 38.33 39.33 42.00 44.67 38.33 43.33 46.00 41.00 48.33
NHD 139.67 132.33 135.00 132.00 134.67 131.00 137.33 134.67 138.33 127.00 136.00 153.33
NL 87.67 93.33 93.67 98.33 119.67 86.33 87.33 91.00 104.33 97.33 150.67 141.00 NF 176.00 246.33 173.67 190.67 292.00 144.33 157.33 221.00 143.67 155.33 268.67 563.33
PH 28.00 28.67 24.33 30.67 26.00 28.67 25.33 30.67 25.00 25.33 27.33 31.67
PD 57.00 57.67 52.67 60.00 57.67 52.67 51.33 62.33 54.67 51.33 59.33 69.67
LT 0.14 0.14 0.17 0.11 0.11 0.10 0.10 0.18 0.10 0.19 0.12 0.15
TLW 2.59 2.37 2.43 2.59 2.30 3.20 2.19 2.69 3.11 3.07 2.43 3.03 TLL 8.56 8.66 7.87 8.67 7.42 7.53 7.57 8.64 6.94 6.76 7.27 8.86
IL 2.96 2.60 2.48 2.54 2.89 2.67 2.52 2.81 2.61 2.32 2.79 3.53
PL 18.23 17.94 16.39 18.60 17.70 19.13 17.54 19.66 17.39 17.04 16.76 25.07 NB 7.00 7.00 9.33 8.67 7.33 8.33 6.33 7.00 9.00 9.67 9.00 8.00
RL 14.17 15.27 12.77 13.70 13.00 10.73 12.17 14.40 14.50 12.50 12.60 14.00
FWtC 51.33 60.67 60.67 86.00 79.00 53.33 50.00 83.67 63.33 65.33 103.00 166.33
NSS 8.22 8.56 9.00 8.22 8.78 6.67 8.22 9.22 8.00 7.44 9.78 18.33 NP 42.67 67.33 71.67 51.67 71.33 46.33 53.67 49.33 86.00 68.67 83.33 29.67
FWtP 55.00 84.33 82.67 90.00 106.33 98.00 80.00 60.00 120.67 71.33 104.00 53.33
FWtPP 1.29 1.25 1.15 1.74 1.49 2.12 1.49 1.22 1.40 1.04 1.25 1.80 DWtP 24.27 41.27 38.80 38.47 45.73 39.87 35.33 31.10 54.43 33.50 47.03 23.13
DWtC 24.17 26.27 25.57 28.13 29.73 20.67 21.80 30.30 25.93 22.37 36.87 87.63
PL 16.75 18.07 18.76 19.39 18.56 20.69 17.83 18.32 18.22 16.54 17.74 21.19 PW 13.49 13.96 15.11 15.61 14.81 19.02 14.35 14.51 14.87 13.21 14.71 14.93
SW 4.24 10.22 8.28 8.52 9.52 10.42 8.03 6.06 11.59 6.45 9.64 6.29
NS 42.00 63.00 70.67 52.67 72.67 41.33 55.00 53.33 91.33 68.67 78.67 25.67
SWP 20.03 31.04 30.52 29.95 36.21 29.44 27.30 25.04 42.85 27.05 37.39 16.85 SWS 0.45 0.47 0.43 0.55 0.50 0.73 0.50 0.47 0.47 0.39 0.47 0.62
Notes: sprout sge (SA); first leaf (FL); flowering age (FA); number of harvest days (NHD); number of leaves (NL); number of flowers (NF); plant height (PH);
plant diameter (PD); leaf thickness (LT); terminal leaf width (TLW); terminal leaf length (TLL); internode length (IL); petiole length (PL); number of branches
(NB); root length (RL); fresh weight of crop residues (FWtC); number of stem segments (NSS); number of pods (NP); fresh weight of pods per plant (FWtP); fresh weight of pod per pod (FWtPP); dry weight of crop residues (DWtC); dry weight of pod per plant (DWtP); pod length (PL); pod width (PW); skin weight
(SW); number of seeds (NS); seed weight per plant (SWP); seed weight per seed (SWS).

SABRAO J. Breed. Genet. 50 (2) 101-114
108
According to de Zousa (2008), the
more morphological similarities
among the genotypes tested, the
closer the genetic relationships are. Clustering based on
morphological characters produced a
dendrogram with similarity
coefficients of 0.33 to 1.00 (Figure 1).
A high similarity coefficient indicates
that those lines had a close genetic relationship. At a similarity coefficient
of 0.52 there were two main clusters,
Cluster I and Cluster II. The
characters distinguishing Cluster I
from Cluster II were hypocotyl
pigment color, pod color, and seed color. The reference line of Cluster I
had red hypocotyl pigments, bright
pods, and cream seeds. The lines in
Group II had green and yellowish-
green hypocotyl pigments, dark pods,
and purplish black seeds. The color of
hypocotyl pigments, pod color, and seed color are the characters that can
be used to distinguish and compare
the clusters (cluster I) from potential
line under study (cluster II). Group II
formed two sub-clusters: Cluster A
and Cluster B. Cluster A and Cluster B diverged due to their differences in
leaf color and shape. Cluster A had
dark green leaves and elliptical
leaves, while Cluster B had bright
green leaves and lanceolate leaves.
The clustering of lines was not based
on the region from which the lines originated but on morphological
similarity of the lines studied. The
same results also reported by
Wicaksana et al. (2013) based on
PCA analysis on qualitative and
quantitative characters of lines of Bandung, Garut, Lamongan, Bogor,
Majalengka, Madura, Sumedang, and
Tasikmalaya. This may have resulted
from the easiness of tranporting the
plants to any producing centres.
Observation and measurement
of the 12 lines of bambara groundnut
showed three lines with a high wet
weight of pods per plant: G5, G9, and G11. All three lines can be used
as parents to develop varieties with
high yield. According to Halluer et al.
(2010), the parents selected for
breeding and cultivation development
programs, in addition to having high yield, should have a good combining
ability and a distant genetic
relationship in order to avoid
inbreeding depression. The results of
Baskorowati (2017) showed that
antogamy of Melalueca alternifolia resulted in inbreeding depression
indicated by low seed production, low
germination, and slow seedling
growth. G5 and G11 had a similarity
coefficient of 1.00, meaning that
both lines are a single line, despite
their different origin. There was no change in characters in the two lines
(G5 and G11), although they were
planted in different places.
Diversity analysis based on
molecular RAPD marker
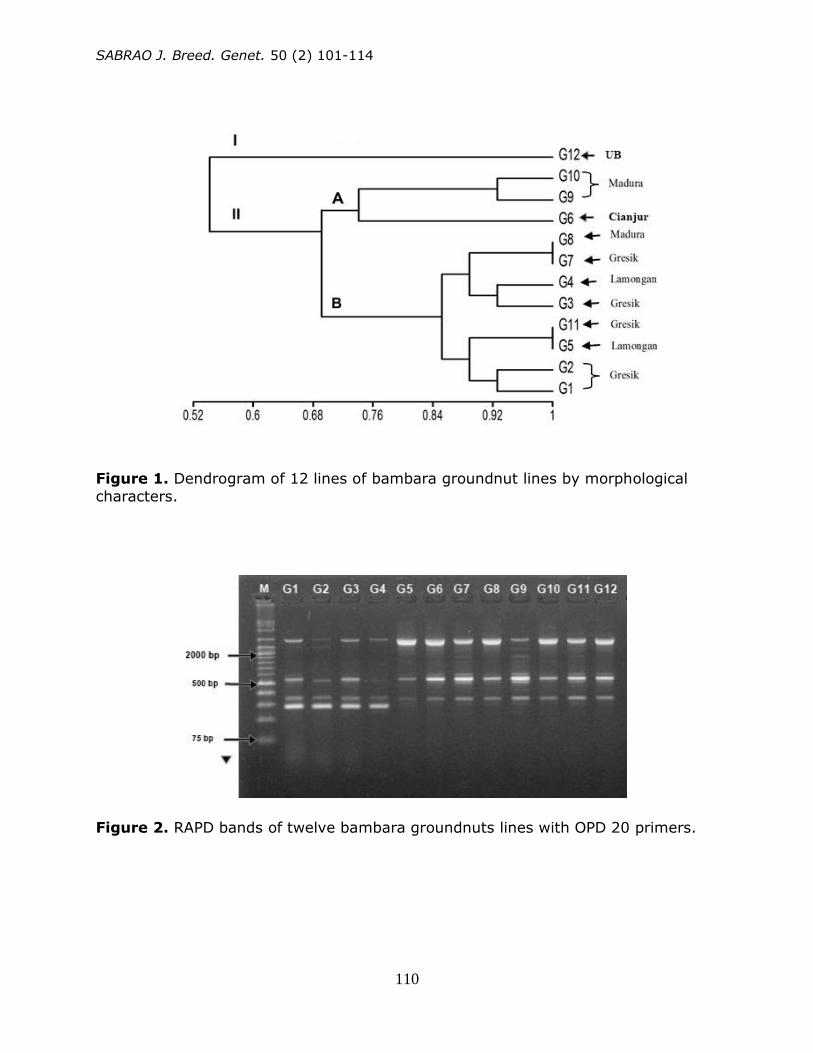
Amplification of the ten primers
generated 84 bands from the 12
bambara groundnut lines tested
(Figure 2). There were various
number of bands ranging from 5
bands (OPD 15) to 13 bands (OPD 13), while the percentage of
polymorphism ranged from
approximately 20% (OPB 15) to
100% (OPD 3, OPD 15, and OPC 1)
and the average percentage of
polymorphic band was 82.14% (Table 4). A study by Masawe et al.
(2003) showed that the tests of 12
bambara groundnut genotypes using
16 primers produced polymorphic
bands with an average percentage of
73.10%.

Siti et al. (2018)
109
Table 4. Number of polymorphic loci of ten RAPD primers applied on Madurese
bambara groundnut lines.
No Primer Base Sequence
(5’-3’)
Number of
Amplified
Band
Monomorphic Band
Polymorphic Band
Percentage of
Polymorphic
Band
1 OPA 4 AATCGGGCTG 7 2 5 71.43
2 OPA 5 AGGGGTCTTG 7 1 6 85.71
3 OPA 9 GGGTAACGCC 9 2 7 77.78
4 OPB 15 GGAGGGTGTT 5 4 1 20.00
5 OPC 2 GTGAGGCGTC 11 2 9 81.82
6 OPD 3 GTCGCCGTCA 12 0 12 100.00
7 OPD 13 GGGGTGACGA 13 1 12 92.31
8 OPD 15 CATCCGTGCT 5 0 5 100.00
9 OPD 20 ACCCGGTCAC 7 3 4 57.14
10 OPC 1 TTCGAGCCAG 8 0 8 100.00
Total 84 15 69 82.14
Table 5. Similarity matrix of Madurese bambara groundnut lines using RAPD markers.
Genotip G1 G2 G3 G4 G5 G6 G7 G8 G9 G10 G11 G12
G1 1.00
G2 0.91 1.00
G3 0.91 0.88 1.00
G4 0.88 0.94 0.89 1.00
G5 0.61 0.54 0.58 0.57 1.00
G6 0.57 0.50 0.58 0.49 0.78 1.00
G7 0.59 0.52 0.60 0.51 0.72 0.92 1.00
G8 0.57 0.50 0.56 0.51 0.80 0.86 0.84 1.00
G9 0.56 0.51 0.57 0.52 0.71 0.89 0.89 0.83 1.00
G10 0.59 0.52 0.60 0.53 0.82 0.90 0.86 0.94 0.85 1.00
G11 0.86 0.49 0.59 0.50 0.73 0.91 0.91 0.89 0.90 0.89 1.00
G12 0.56 0.49 0.57 0.50 0.77 0.95 0.89 0.87 0.90 0.91 0.90 1.00
SABRAO J. Breed. Genet. 50 (2) 101-114
110
Figure 1. Dendrogram of 12 lines of bambara groundnut lines by morphological
characters.
Figure 2. RAPD bands of twelve bambara groundnuts lines with OPD 20 primers.

Siti et al. (2018)
111
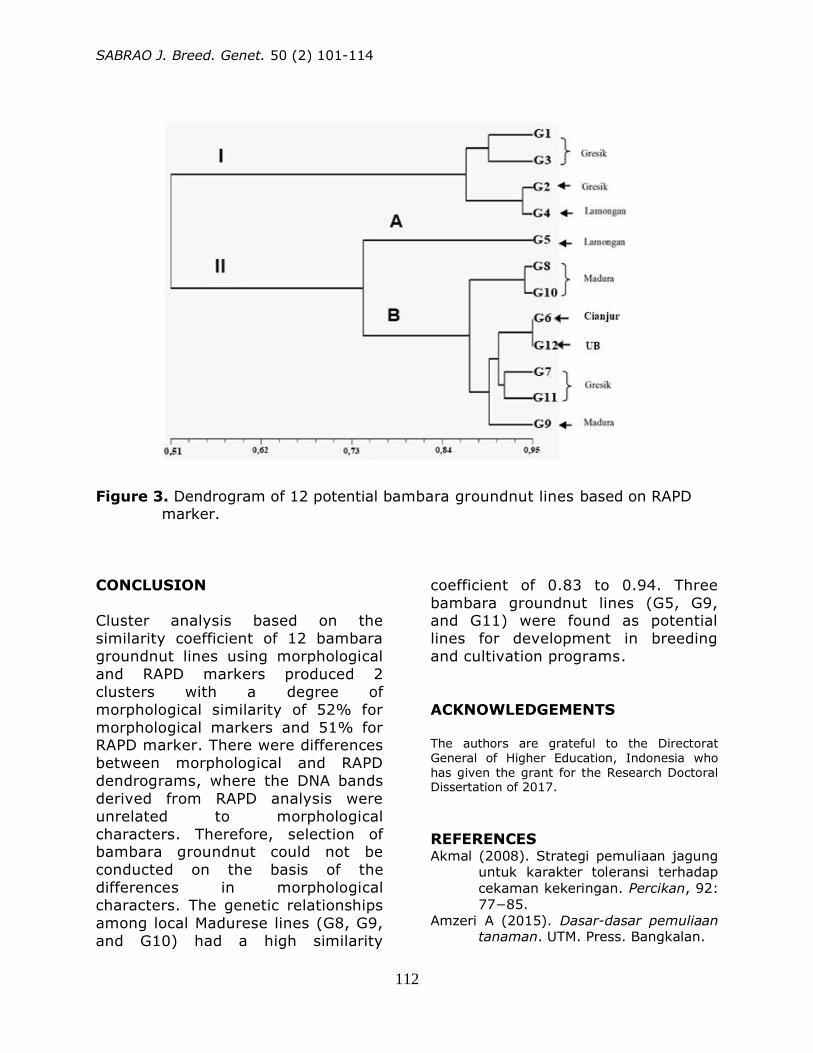
The RAPD marker of bambara
groundnut lines showed that G6 and
G12 had the closest genetic
relationship with a similarity coefficient of 0.95, followed by G2,
G4, G8, and G10 with a similarity
coefficient of 0.94 (Table 5). G2,
G11, and G12 had the most distant
genetic relationship with a similarity
coefficient of 0.49. The resulting cluster was different from that of
bambara groundnut lines regarding
morphological characters. The
amplified bands did not indicate
characteristics associated with
morphological characters. The difference in the number and base
sequence of the amplified DNA bands
on the primer is highly instrumental
in determining the level of genetic
diversity. Saraswati et al. (2017)
discovered that the number of
polymorphic DNA bands could describe the genome profiles of
bambara groundnut plants since they
could indicate the distribution of
primer attachment sites on the
genomes.
The similarity level of 0.51 formed two main clusters: Cluster I
and Cluster II. Cluster II formed two
sub-clusters: Cluster A consisting of
1 line (G5) and Cluster B consisting
of 7 lines. The RAPD marker was
capable of clustering lines originating
from Madura (G9 and G10) at a similarity coefficient of 0.85. The
clustering formed by the two lines
was in line with the morphological
character-based clustering.
The RAPD marker-based
dendrogram did not provide an obvious clustering of bambara
groundnut lines. This was due to the
highly polymorphic amplified bands
(84%), preventing it from obtaining
specific bands capable of obvious
clustering. The low similarity among
the band patterns of bambara
groundnut lines lead the RAPD data
to have a low justification for their
genetic relationship but it is appropriate to find variability among
the bambara groundnut lines to
determine the candidates for
superior parents.
A breeding program to obtain
the desired varieties through crossing requires the formation of
segregating populations. The
selected candidate parents should
have a large degree of diversity. The
dendrogram shows that the genetic
relationship among local Madurese lines (G8, G9, and G10) had a high
similarity coefficient of 0.83 to 0.94
(Figure 3). This makes breeding
programs by hybridization difficult to
produce the desired superior
varieties due to inability to generate
segregating population with high genetic variation.
The local Madurese bambara
lines can be used as parents when
they are crossed with other local
lines from different clusters, i.e. G1,
G2, G3, and G4. Bambara lines in Cluster I had a genetic distance from
local Madura lines ranging from 0.50
to 0.60. Crosses between local
Madurese lines and those lines in
Cluster A would result in a large
segregation, making it easier to
select the desired varieties in segregating populations.
SABRAO J. Breed. Genet. 50 (2) 101-114
112
Figure 3. Dendrogram of 12 potential bambara groundnut lines based on RAPD marker.
CONCLUSION
Cluster analysis based on the
similarity coefficient of 12 bambara
groundnut lines using morphological
and RAPD markers produced 2
clusters with a degree of
morphological similarity of 52% for
morphological markers and 51% for RAPD marker. There were differences
between morphological and RAPD
dendrograms, where the DNA bands
derived from RAPD analysis were
unrelated to morphological
characters. Therefore, selection of bambara groundnut could not be
conducted on the basis of the
differences in morphological
characters. The genetic relationships
among local Madurese lines (G8, G9,
and G10) had a high similarity
coefficient of 0.83 to 0.94. Three
bambara groundnut lines (G5, G9, and G11) were found as potential
lines for development in breeding
and cultivation programs.
ACKNOWLEDGEMENTS
The authors are grateful to the Directorat
General of Higher Education, Indonesia who
has given the grant for the Research Doctoral Dissertation of 2017.
REFERENCES Akmal (2008). Strategi pemuliaan jagung
untuk karakter toleransi terhadap
cekaman kekeringan. Percikan, 92:
77−85.
Amzeri A (2015). Dasar-dasar pemuliaan tanaman. UTM. Press. Bangkalan.

Siti et al. (2018)
113
Azrai M (2005). Pemanfaatan markah
molekuler dalam proses seleksi
pemuliaan tanaman. J. Agro Biogen, 1 (1): 26−37.
Baskorowati L (2017). Depresi silang
dalam biji dan semai Melaleuca
alternifolia. Jurnal Pemuliaan Tanaman Hutan. 11 (2) : 87-97.
Berchie JN, Opoku M, Adu-Dapaah H,
Agyemang H, Sarkodie-Addo J,
Asare E, Addo J, Akuffo H (2012). Evaluation of five bambara
groundnut (Vigna Subterranea
(L.)Verdc.) landraces to heat and
drought stress at Tono-Navrongo, upper east region of Ghana. Afr. J.
Agric. Res. 7(2): 250-256.
Collinson ST, Berchie J, Azzam-Ali SN
(1999). The effect of soil moisture
on light interception and conversion coefficient for three
landraces of bambara groundnut
(Vigna subterranea). J. Agr. Sci.
133 : 151-157. de Zousa SGH, Pipolo VC, Ruas CDV,
Carvalho VDP, Ruas PM, Gerage AC
(2008). Comparative analysis of
genetic diversity among the maize inbred line (Zea mays L.) obtained
by RAPD and SSR markers.
Brazilian Archives of Biology abd
Technol., 51 (1): 183−192.
Galvan MZ, Aulicino MB, Medina SG, Balatti PA (2001). Genetic diversity
among nortwestern argentinian
cultivars of common bean
(Phaseolus vulgaris L.) as revealed by RAPD markers. Genetic. Resour.
Crop. Evol., 48 (3): 251−260.
Goli AEF (1995). Bibliography Review.
Proceedings of the workshop on conservation and improvement of
bambara groundnut (Vigna
subterranea (L.) Verdc.) 14–16
November 1995. International Plant Genetic Resources Institute.
Harare, Zimbabwe. pp. 4-10.
Hadiati S, Sukmadjaja D (2002).
Keragaman pola pita beberapa
aksesi nenas berdasarkan analisis izozim. J. Bioteknol. Pert., 7 (2):
82-70.
Hallauer AR, MJ Carena, JB Miranda Filho
(2010). Quantitative genetics in
maize breeding. 3nd ed.500 p. Spring. New York. USA.
Irwin SV, P Kaufusi, Banks K, de la Pena
R, Cho JJ (1998). Molecular
characterization of taro (Colocasia esculenta) using RAPD markers.
Euphytica 99 (3):183-189.
Jiménez JF, Sánchez-Gómez P, Güemes J,
Werner O, Rosselló JA (2002). Genetic variability in a narrow
endemic snapdragon (Antirrhinum
subbaeticum, Scrophulariaceae)
using RAPD markers. Heredity 89 (5): 387-393.
Jose RJ, Rozzi FR, Sardi M, Abadias NM,
Hernandez M, Puciarelli (2005).
Functional-Cranical approach to the
influence of economic strategy on skull morphology. American J. of
Physical Anthropol. 128: 757−771.
Kouassi NJ, Zoro-Bi IA (2010). Effect of
sowing density and seedbed typed on yield and yield components in
Bambara groundnut (Vigna
subterranea [L.] Verdc.) in
woodland savannas of Côte d’Ivore. Expl. Agric. 46:99-110.
Kuswanto, Waluyo B, Anindita R, Canda S
(2011). Collection and evaluation
local lines of bambara groundnut
(Vigna subterranean) in Indonesia. Agricultural Faculty. Brawijaya
University.
Massawe FJ (2000). Phenotypic and
genetic diversity in Bambara groundnut landraces. PhD Thesis,
University of Nottingham, UK.
Massawe FJ, Roberts JA, Azam-Ali SN,
Davey MR (2003). Genetic diversity in bambara groundnut (Vigna
subterranea (L.) Verdc) landraces
assessed by random amplified
polymorphic DNA (RAPD). Genetic Resource and Crop Evolution 50 :
737-741.
Nowbuth P, Khitto G, Bahorun T,
Venkatasamy S (2005). Assessing
genetic diversity of some Anthurium andraeanum Hort. Cut-
flower cultivars using RAPD
SABRAO J. Breed. Genet. 50 (2) 101-114
114
markers. African Journal of
Biotechnology 4 (10): 1189-1194.
Pabendon MB, Azrai M, Kasim F, Wijaya MJ (2007). Prospek penggunaan
markah molekuler dalam program
pemuliaan jagung. pusat penelitian
dan pengembangan tanaman pangan. Balitsereal. Indonesia.
Poerba YS, Yuzammi (2008). Pendugaan
keragaman genetik
Amorphophallus titanum Becc. berdasarkan marka Random
Amplified DNA. Biodiversitas 9 (2):
103-107.
Prana TK, Hartati NS (2003). Identifikasi sidik jari DNA talas (Colocasia
esculenta L. Schott) Indonesia
dengan teknik (RAPD): Skrining
primer dan optimalisasi kondisi
PCR. Jurnal Natur Indonesia 5 (2): 107-112.
Redjeki ES (2003). Pengaruh seleksi galur
murni pada populasi campuran
terhadap hasil tanaman kacang bogor. Agrofish 3: 97-105.
Rohlf FJ (2000). NTSYSpc 21 numerical
taxonomy and multivariate analysis
system. Setauket, NY: Exeter Software.
Saraswati ID, Kuswanto, Damanhuri,
Sugiharto AN (2017). Analisis
kekerabatan 22 galur kacang bogor
(Vigna subterranea L., Verdcourt) menggunakan teknik RAPD
(Random Ampified Polymorphic
DNA). Jurnal Proteksi Tanaman
5(2) : 336-342. Suwanprasert J, Toojinda T, Srivines P,
Chanprame S (2006). Hybridization
technique for bambara groundnut.
Breeding Science 56:125-129. Tingey SV, Rafalski JA, Hanafey MK
(1994). Genetic analysis with RAPD
markers. In: Coruzzi C, And P
Puidormenech (eds.). Plant Molecular Biology. Belin : Springer-
Verlag.
Wicaksana N, Hindun, Waluyo B,
Rachmadi M, Kurniawan A,
Kurniawan H (2013). Karakterisasi morfo-agronomis kacang bambara
(Vigna Subterranea L. Verdc.) Asal
Jawa Barat. Proceeding of National
Seminar entitled Three in One.
Malang.
Yang S, Pang W, Ash G, Harpe J, Carling J, Wenzel P, Huttner E, Zong X,
Kilian A (2006). Low level of
genetic diversity in cultivated
pigeonpea compared to its wild relatives revealed by diversity
arrays technology. Theor. Appl.
Genet. 113: 585-595.
Yuwono T (2006). Polymerase chain reaction. Erlangga. Jakarta.
Zeven AC (1998). Landraces: A review of
definitions and classifications.
Euphytica 104 (2): 127-139.