genetic diversity and connectivity within mytilus spp. in … part of the intertidal and shallow...
TRANSCRIPT

Evolutionary Applications 2017; 10: 39–55 wileyonlinelibrary.com/journal/eva | 39© 2016 The Authors. Evolutionary Applications published by John Wiley & Sons Ltd
Received: 3 March 2016 | Accepted: 7 August 2016
DOI: 10.1111/eva.12415
This is an open access article under the terms of the Creative Commons Attribution License, which permits use, distribution and reproduction in any medium, provided the original work is properly cited.
AbstractClimate changes in the Arctic are predicted to alter distributions of marine species. However, such changes are difficult to quantify because information on present spe-cies distribution and the genetic variation within species is lacking or poorly examined. Blue mussels, Mytilus spp., are ecosystem engineers in the coastal zone globally. To improve knowledge of distribution and genetic structure of the Mytilus edulis complex in the Arctic, we analyzed 81 SNPs in 534 Mytilus spp. individuals sampled at 13 sites to provide baseline data for distribution and genetic variation of Mytilus mussels in the European Arctic. Mytilus edulis was the most abundant species found with a clear ge-netic split between populations in Greenland and the Eastern Atlantic. Surprisingly, analyses revealed the presence of Mytilus trossulus in high Arctic NW Greenland (77°N) and Mytilus galloprovincialis or their hybrids in SW Greenland, Svalbard, and the Pechora Sea. Furthermore, a high degree of hybridization and introgression between species was observed. Our study highlights the importance of distinguishing between congener species, which can display local adaptation and suggests that information on dispersal routes and barriers is essential for accurate predictions of regional suscepti-bility to range expansions or invasions of boreal species in the Arctic.
K E Y W O R D S
arctic fauna, bivalves, climate change, glacial refugium, hybrid zone, Mytilus edulis, population structure, SNPs
1Department of Bioscience, Arctic Research Centre, Aarhus University, Aarhus C, Denmark2Section for Marine Living Resources, National Institute of Aquatic Resources, Technical University of Denmark, Silkeborg, Denmark3Faculty of Biosciences, Fisheries and Economics, UiT The Arctic University of Norway, Tromsø, Norway4The University Centre in Svalbard, Longyearbyen, Norway5White Sea Biological Station, Zoological Institute of Russian Academy of Sciences, St. Petersburg, Russia6Invertebrate Zoology Department, St. Petersburg State University, St. Petersburg, Russia7Institute of Aquaculture, University of Stirling, Stirling, UK
CorrespondenceEinar Eg Nielsen, Section for Marine Living Resources, National Institute of Aquatic Resources, Technical University of Denmark, Silkeborg, Denmark.Email: [email protected]
O R I G I N A L A R T I C L E
Genetic diversity and connectivity within Mytilus spp. in the subarctic and Arctic
Sofie Smedegaard Mathiesen1,2 | Jakob Thyrring1 | Jakob Hemmer-Hansen2 | Jørgen Berge3,4 | Alexey Sukhotin5,6 | Peter Leopold3 | Michaël Bekaert7 | Mikael Kristian Sejr1,† | Einar Eg Nielsen2,†
1 | INTRODUCTION
Nowhere else on Earth is the impact of climate change expected to be more severe than in the Arctic. Temperatures in the Arctic are esti-mated to increase by 4–7°C over the next century, with wide- ranging effects on Arctic species (ACIA 2004; IPCC 2014). This have caused
shifts in species’ abundances and distributions over the last decades (IPCC 2014; Poloczanska et al., 2013), and future temperature in-creases are believed to move species distribution limits toward the poles (ACIA 2004). Such effects, however, are nearly impossible to monitor and understand without proper baseline studies of the ge-netic variation within and between species (Brodersen & Seehausen, 2014). Almost all species investigated, including Arctic, have revealed genetically discrete populations that inhabit a specific subset of the species geographical and environmental range. These populations †These authors jointly supervised this work.

40 | Mathiesen et al.
can exhibit different adaptations and tolerance limits to specific en-vironments (Limborg et al., 2012; Nielsen, Hemmer- Hansen, Larsen, & Bekkevold, 2009; Thyrring, Rysgaard, Blicher, & Sejr, 2015), which make it important to know their current distribution and the connec-tivity between populations and the processes governing the distri-bution of genetic variation. Through genetic analysis, it is possible to determine the level of genetic variability within both threatened and newly established populations, the origin of migrating individuals, di-rection of gene flow, and possible adaptive evolutionary changes as-sociated with climate change (Brodersen & Seehausen, 2014; Hansen, Olivieri, Waller, & Nielsen, 2012; Laikre, Schwartz, Waples, & Ryman, 2010). All key factors needed to make predictions for the likely impact of climate change.
Bivalves of the genus Mytilus are frequently used as environmental indicators, as they are semi- sessile, have a relatively long life span, and are widely distributed in coastal regions in both Northern Hemisphere and Southern Hemisphere (Goldberg, 1986; Gosling, 2003; Rainbow, 1995; Thyrring, Juhl, Holmstrup, Blicher, & Sejr, 2015). Mytilus spp. are commercially and ecologically important species and often a dom-inant part of the intertidal and shallow subtidal fauna. Therefore, numerous studies of their responses to various stressors (e.g., tem-perature, salinity, pollutants) have been performed (Gosling, 2003; Jones, Lima, & Wethey, 2010; Mubiana, Qadah, Meys, & Blust, 2005; Søndergaard, Asmund, Johansen, & Riget, 2011; Wanamaker et al., 2007). Furthermore, Mytilus spp. have already demonstrated adap-tations to different environments (Blicher, Sejr, & Høgslund, 2013; Thyrring, Rysgaard, et al., 2015) and a shift in their southern geograph-ical range caused by increasing temperatures (Jones et al., 2010), mak-ing them an excellent model for inferring how species distributions might change in response to climate change. Additionally, Mytilus spp. have been the subjects of genetic studies for decades as the different species are morphologically difficult to distinguish. Consequently, the population structure of individual Mytilus species has been difficult to establish. Mytilus edulis L. 1758, Mytilus trossulus Gould 1850 and Mytilus galloprovincialis Lmk. 1819, all belong to the M. edulis species complex and are known to coexist and hybridize with conflicting pat-terns on the fitness for hybrids. Some studies did not observe any depressed fitness (Doherty, Brophy, & Gosling, 2009; Koehn, 1991; Riginos & Cunningham, 2005; Toro, Thompson, & Innes, 2006), while others (Gardner & Thompson, 2001; Toro, Innes, & Thompson, 2004; Toro, Thompson, & Innes, 2002; Tremblay & Landry, 2016) found a difference in fitness between parental types and hybrids and back-crosses. These findings and numerous studies on introgression be-tween them (Fraïsse, Belkhir, Welch, & Bierne, 2016; Roux et al., 2014) have challenged the isolation species concept (White, 1978); however, they are generally considered to be different species, as they remain ecological distinct despite semipermeable barriers for gene flow and introgression (Bierne, Borsa, et al., 2003; Fraïsse, Roux, Welch, & Bierne, 2014; Saarman & Pogson, 2015). Mytilus trossulus is thought to have invaded the Arctic Ocean from the Pacific Ocean around 3.5 million years ago (mya) through the Bering Strait (Rawson & Hilbish, 1995, 1998; Vermeij, 1991). As the Bering Strait closed during glacial periods, allopatric speciation resulted in the evolution of
M. edulis in the Atlantic. Mytilus edulis has since spread to large parts of the Atlantic and due to apparent low gene flow (at least for some loci); M. edulis populations on each side of the Atlantic are geneti-cally distinct (Riginos & Henzler, 2008; Riginos, Hickerson, Henzler, & Cunningham, 2004). Speciation between M. edulis and M. galloprovin-cialis most likely occurred through allopatric isolation approximately 2.5 mya (Quesada, Gallagher, Skibinski, & Skibinski, 1998; Rawson & Hilbish, 1995, 1998) with secondary contact and introgression oc-curring around 0.7 mya (Roux et al., 2014). Between interglacial pe-riods 46,000 and 20,000 years ago, M. trossulus reinvaded the Arctic Ocean (Rawson & Harper, 2009). From here, it invaded both sides of the Atlantic founding M. trossulus/M. edulis hybrid zones along North American and European coasts (Riginos & Cunningham, 2005).
The geographical distribution and genetic population structure of Mytilus spp. have been intensively studied in boreal and temperate re-gions (Bierne, Borsa, et al., 2003; Hilbish, Carson, Plante, Weaver, & Gilg, 2002; Sarver & Foltz, 1993; Väinölä & Strelkov, 2011; Westerbom, Kilpi, & Mustonen, 2002); however, little is known of their distribution and genetic population structure in the Arctic. In the subarctic and Arctic, M. edulis is considered the most abundant Mytilus species, and it has been recorded in Arctic regions of Russia, along the Norwegian coast, in Iceland and Greenland (Hummel, Colucci, Bogaards, & Strelkov, 2001; Riginos & Henzler, 2008; Sukhotin, Strelkov, Maximovich, & Hummel, 2007; Väinölä & Strelkov, 2011). In Greenland, Mytilus spp. populations are found all along the west coast, and southern popu-lations from Tartoq and Narsarsuaq have been shown to be geneti-cally distinct from European M. edulis displaying higher resemblance to Canadian and North American M. edulis populations (Riginos & Henzler, 2008). Few genetic analyses have been performed on Mytilus spp. in Greenland, and most studies have assumed these mussels to be M. edulis without genetic verification despite observations of vari-ations in metabolic response to low temperatures between popula-tions from NW and SW Greenland (Thyrring, Rysgaard, et al., 2015). Moreover, in 2004, subtidal M. edulis were discovered at the mouth of Isfjorden in Svalbard after 1,000 years of absence (Berge, Johnsen, Nilsen, Gulliksen, & Slagstad, 2005). These mussels were hypothe-sized to have been transported from Norway by the West Spitsbergen Current in 2002, but their origin has never been confirmed through genetic analysis. Mytilus trossulus is less common in Arctic waters. Väinölä and Strelkov (2011) found that M. trossulus had a scattered dis-tribution in the White Sea and the Norwegian Sea, and Feder, Norton, and Geller (2003) found live M. trossulus in Arctic Alaska in the 1990s. Furthermore, Wenne, Bach, Zbawicka, Strand, and McDonald (2016) has recently reported a NW Greenlandic fjord at Maarmorilik (71°N) to be inhabited by M. edulis, M. trossulus, and their hybrids. Mytilus edulis and M. trossulus hybrid zones have also been found and studied on the European and N American Atlantic coasts. Riginos and Cunningham (2005) reviewed the literature on the subject to look at local adaptation and species segregation and found conflicting patterns of species seg-regation across the Atlantic. In the western Atlantic, M. trossulus was found on wave- exposed open coasts, whereas M. edulis appeared to dominate in sheltered areas of low salinity. However, European M. tros-sulus populations from the Baltic Sea appeared to be locally adapted

| 41Mathiesen et al.
to the prevailing low salinities. The latter is in line with the findings of Wenne et al. (2016), who found a higher prevalence of M. trossulus in the inner Maarmorilik fjord compared with the more saline outer fjord. Mytilus galloprovincialis normally inhabits warmer waters, but in recent years the species and M. galloprovincialis/M. edulis hybrids have been observed along the Norwegian coast (Brooks & Farmen, 2013; Riginos & Henzler, 2008). This could be related to human activities like ship traffic in rural areas enabling faster invasion of waters otherwise not directly accessible to them (Anderson, Bilodeau, Gilg, & Hilbish, 2002; Geller, Carlton, & Powers, 1994). Furthermore, it has been demon-strated that M. galloprovincialis is capable of tolerating low water tem-peratures (Inoue et al., 1997), highlighting the potential for this species to occur in the Arctic.
Most studies on Mytilus spp. have focused on a few allozymes, mtDNA markers, or microsatellites (Bierne, Daguin, Bonhomme, David, & Borsa, 2003; Brooks & Farmen, 2013; Feder et al., 2003; McDonald, Seed, & Koehn, 1991; Ouagajjou, Presa, Astorga, & Pérez, 2011; Presa, Perez, & Diz, 2002). However, in recent years the use of single nucleotide polymorphisms, SNPs, has become increasingly popular to answer questions about Mytilus spp. status, population structure, hybridization, and adaptive variation (Helyar et al., 2011; Saarman & Pogson, 2015; Zbawicka, Drywa, Smietanka, & Wenne, 2012; Zbawicka, Sanko, Strand, & Wenne, 2014).
Utilizing 81 nuclear SNPs, we examined the distribution of Mytilus spp. in subarctic and Arctic regions ranging from the eastern Baffin Bay to the Pechora Sea with a special emphasis on the spatiotem-poral population structure of M. edulis. We further aimed at identi-fying the source population or populations for the newly discovered M. edulis population in Svalbard and whether the observed differences in temperature response found in W Greenland Mytilus populations (Thyrring, Rysgaard, et al., 2015) could be caused by genetically based local adaptation.
2 | MATERIALS AND METHODS
2.1 | Study sites and sampling
Nineteen Mytilus spp. samples, consisting of 509 individuals in total, were collected from thirteen subarctic and Arctic sites (Table 1 and Fig. 1). Our primary focus was to assure broad geographical coverage and to sample regions where specific hypothesis regarding origin had been generated. The aim was to collect between 30 and 50 individuals from each site. However, as sampling Arctic regions is associated with high logistical costs, we had to rely on already available samples and numbers in some instances. Three samples were collected along the Norwegian NW coast at Tromsø (TRS and TRL) and Lofoten (LOF), and four samples were collected from the Svalbard archipelago (SV1, SV2, SV3, and SV4). Four samples were obtained from the Russian Arctic: two from the White Sea (WS1, WS2) and two from the southeast part of the Barents Sea: Pechora Sea to the east (PSE) and to the west (PSW) of Dolgiy Island. Further, one sample was collected in Iceland: south of Reykjavik (SRI), and six samples were collected in western Greenland: Nuuk (NUS and NUL), Kobbefjord (KOB), Upernavik (UPE),
and Qaanaaq (QAS and QAL). From Tromsø, Nuuk, and Qaanaaq, mussels of different size classes were collected as size can be used as a proxy for age class and hence indicate possible short- term genetic change over time; TRS, NUS, and QAS were smaller mussels in the size range 15–30 mm in length, while TRL, NUL, and QAL being mussels larger than 50 mm.
Samples were stored at −19°C (TRS, TRL, SRI, KOB, UPE, QAS, and QAL) or in 96% ethanol at 4°C (LOF, SV1, SV2, SV3, SV4, WS1, WS2, PSW, and PSE). Measurements of shell length, width, and height of frozen mussels were conducted at the laboratory facilities at DTU Aqua in Silkeborg, Denmark, whereas the measurements of ethanol preserved specimens were taken at the sampling locations.
Reference samples of M. trossulus and M. galloprovincialis were provided from the Sea of Okhotsk, Russia, and from around Galician Rías in NW Spain, respectively, to evaluate the species status of the sampled mussels and to identify potential hybrids.
2.2 | DNA extraction
A minimum of 30 mg (wet weight) of mantle tissue was dissected from each mussel, and DNA was extracted using the Omega EZNA Tissue DNA kit (Omega Bio- Tek, Norcross, GA, USA) according to the manufacturer’s instructions for tissue. DNA content in the extracts was verified on a NanoDrop spectrophotometer (Thermo Scientific, Waltham, MA, USA).
2.3 | SNP genotyping
SNP genotyping was conducted using the Fluidigm Biomark™ HD System. 96.96 Dynamic Array IFCs were read on a real- time PCR system after amplification and scored using Fluidigm SNP Genotyping Analysis software. The samples were genotyped for a panel of 96 SNPs: 19 from previous publications on Mytilus spp. genetic structure (Zbawicka et al., 2012, 2014) and 77 new SNPs originated from RAD sequencing of genomic M. edulis DNA (EBI Sequence Read Archive (SRA) study ERP006912) at the University of Stirling (Table S1).
2.4 | Summary statistics
Loci with more than 25% missing data across all samples were dis-carded. Genepop 4.2 (Raymond & Rousset, 1995; Rousset, 2008) was used to test each locus in each sample for departure from Hardy–Weinberg equilibrium (HWE) and linkage disequilibrium (LD) for each locus pair in each sample (10,000 dememorizations, 100 batches, and 5,000 iterations). Within samples, the program diveRsity (Keenan, McGinnity, Cross, Crozier, & Prodohl, 2013) was used to calculate allelic richness and estimate expected (He) and observed (Ho) het-erozygosities. This was done for both the full data set and for a re-duced data set consisting exclusively of inferred M. edulis individuals (see explanation in section on M. edulis population structure below). Overall and pairwise FST values for all samples were estimated in Genepop 4.2. This initial sorting and discarding of SNP loci resulted
42 | Mathiesen et al.
in 81 loci being retained for further analyses. As most SNP loci were developed from M. edulis, reliable scoring of M. trossulus individuals was not possible for three loci (174302_A, 67577_A, and 31051_A), and analyses concerning hybrid identification were performed for 78 SNP loci only.
2.5 | Identification of hybrids
Based on the generated pairwise FST estimates, the grouping of sam-ples was visualized in a multidimensional scaling plot applying the cmdscale function in R (R Core Team, 2015). Additionally, a princi-pal component analysis scatter plot was created in the R package Adegenet (Jombart, 2008; Jombart & Ahmed, 2011) to illustrate the genetic relationships among individuals across all samples. Structure v2.3.4, utilizing the Bayesian MCMC clustering approach (Pritchard, Stephens, & Donnelly, 2000) was used to visualize species integrity and identify possible hybridization among Mytilus spp. using a vari-able number of predefined clusters (K) for grouping individuals. This was also done to positively identify M. edulis individuals and sub-sequently create a reduced data set exclusively aimed at investigat-ing population structure within this species. Considering the close genetic resemblance of Mytilus spp. and the assumed low gene flow between geographically distant samples (Riginos & Henzler, 2008), simulations were run for a number of predefined K values. Based on
an initial analysis of K up to 18, we found the highest likelihoods for K = 3–5. Accordingly, we used this as the basis to identify the major groupings within the species complex. For all simulations, a burn- in of 10,000 iterations was used followed by 100,000 MCMC repetitions. To evaluate the power of designating individuals as pure or hybrids, we followed the procedure described in Nielsen, Hansen, Ruzzante, Meldrup, and Grønkjær (2003) using the program Hybridlab (Nielsen, Bach, & Kotlicki, 2006). Briefly, we simulated 1,000 individuals of each of the following classes: parentals, F1/F2, and backcrosses. This was done based on the allele frequencies of the reference samples of M. trossulus, M. galloprovincialis, and M. edulis samples identified by initial Structure runs to likely consist exclusively of M. edulis indi-viduals (NUS, KOB and WS2). Separate simulations were conducted for M. edulis samples from Greenland (NUS, KOB) and the Eastern Atlantic (WS2). The simulated and real individuals were included in a common Structure run (K = 4) and 95% confidence intervals for the inferred ancestry of the simulated individuals were recorded and com-pared to the real individuals.
2.6 | Population structure of Mytilus edulis
A reduced data set was used to assess the population structure in M. edulis. Based on the results from the analysis of simulated parentals and hybrids (see results section), we chose to only include individuals
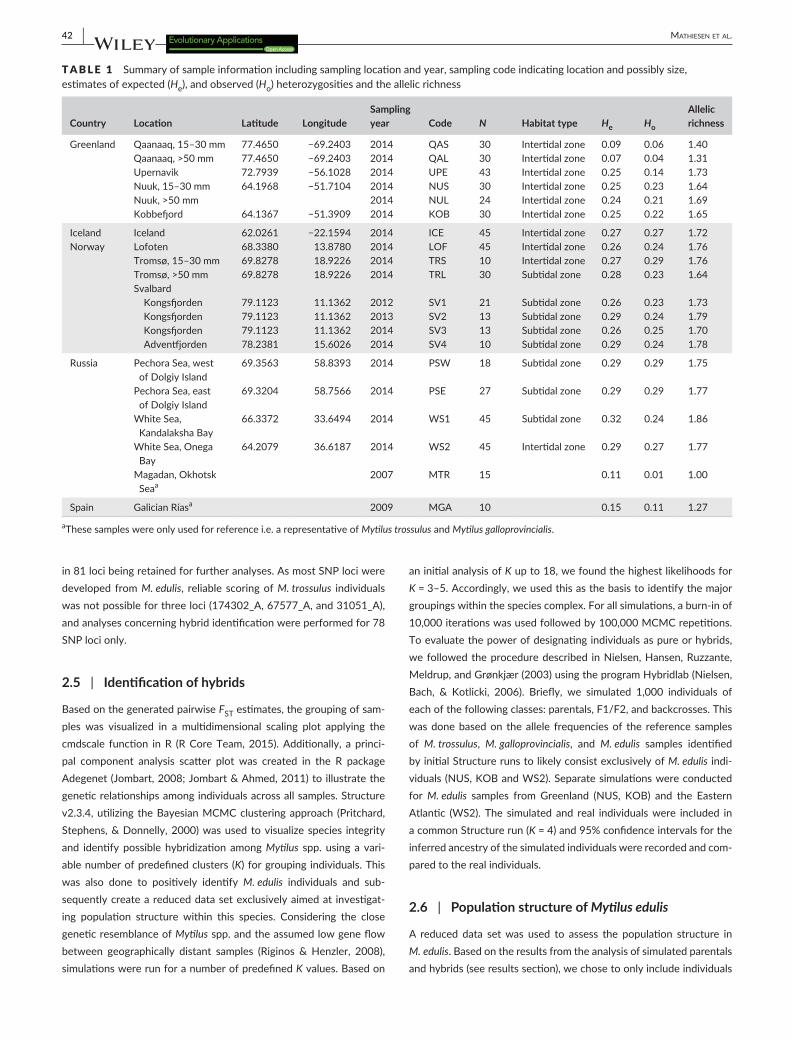
TABLE 1 Summary of sample information including sampling location and year, sampling code indicating location and possibly size, estimates of expected (He), and observed (Ho) heterozygosities and the allelic richness
Country Location Latitude LongitudeSampling year Code N Habitat type He Ho
Allelic richness
Greenland Qaanaaq, 15–30 mm 77.4650 −69.2403 2014 QAS 30 Intertidal zone 0.09 0.06 1.40Qaanaaq, >50 mm 77.4650 −69.2403 2014 QAL 30 Intertidal zone 0.07 0.04 1.31Upernavik 72.7939 −56.1028 2014 UPE 43 Intertidal zone 0.25 0.14 1.73Nuuk, 15–30 mm 64.1968 −51.7104 2014 NUS 30 Intertidal zone 0.25 0.23 1.64Nuuk, >50 mm 2014 NUL 24 Intertidal zone 0.24 0.21 1.69Kobbefjord 64.1367 −51.3909 2014 KOB 30 Intertidal zone 0.25 0.22 1.65
Iceland Iceland 62.0261 −22.1594 2014 ICE 45 Intertidal zone 0.27 0.27 1.72Norway Lofoten 68.3380 13.8780 2014 LOF 45 Intertidal zone 0.26 0.24 1.76
Tromsø, 15–30 mm 69.8278 18.9226 2014 TRS 10 Intertidal zone 0.27 0.29 1.76Tromsø, >50 mm 69.8278 18.9226 2014 TRL 30 Subtidal zone 0.28 0.23 1.64Svalbard
Kongsfjorden 79.1123 11.1362 2012 SV1 21 Subtidal zone 0.26 0.23 1.73Kongsfjorden 79.1123 11.1362 2013 SV2 13 Subtidal zone 0.29 0.24 1.79Kongsfjorden 79.1123 11.1362 2014 SV3 13 Subtidal zone 0.26 0.25 1.70Adventfjorden 78.2381 15.6026 2014 SV4 10 Subtidal zone 0.29 0.24 1.78
Russia Pechora Sea, west of Dolgiy Island
69.3563 58.8393 2014 PSW 18 Subtidal zone 0.29 0.29 1.75
Pechora Sea, east of Dolgiy Island
69.3204 58.7566 2014 PSE 27 Subtidal zone 0.29 0.29 1.77
White Sea, Kandalaksha Bay
66.3372 33.6494 2014 WS1 45 Subtidal zone 0.32 0.24 1.86
White Sea, Onega Bay
64.2079 36.6187 2014 WS2 45 Intertidal zone 0.29 0.27 1.77
Magadan, Okhotsk Seaa
2007 MTR 15 0.11 0.01 1.00
Spain Galician Ríasa 2009 MGA 10 0.15 0.11 1.27
aThese samples were only used for reference i.e. a representative of Mytilus trossulus and Mytilus galloprovincialis.

| 43Mathiesen et al.
with admixture proportions below 0.2, as estimated by Structure. This was done to avoid extensive influence of hybridization on estimates of population divergence, but at the same time allowing for statisti-cal uncertainty regarding whether individuals were pure M. edulis individuals or not. No significant differentiation was found between sampled mussels of different size classes from the same location (Tromsø, Nuuk, and Qaanaaq). Consequently, they were pooled prior to downstream analyses of population structure. Pairwise FST esti-mates were generated with Genepop 4.2, while Structure v2.3.4 was used to estimate the most likely number of genetic clusters. A burn- in period of 50,000 iterations was chosen followed by 100,000 MCMC repetitions for K values 2–4. A hierarchical AMOVA was conducted in Arlequin v.3.5.2.2 (Excoffier & Lischer, 2010) to infer the proportion of genetic variance distributed among the different M. edulis clusters and among samples within the clusters detected by Structure (see re-sults section). To visualize the genetically based grouping of M. edulis population samples, a multidimensional scaling plot was generated, while a principal component analysis, PCA, was used to illustrate the relationships among M. edulis individuals in general and specifically for the Norwegian, Svalbard, and Russian samples to infer the likely origin
of Svalbard mussels. The PCA scatter plots were generated in R, using the cmdscale function and the package Adegenet.
2.7 | Outlier analysis
To identify loci potentially under selection in the “Mytilus edulis” data set, the joint distribution of FST and heterozygosity under a hierarchi-cal island model of population structure was examined using Arlequin v.3.5.2.2 (Excoffier & Lischer, 2010) based on the method in Excoffier, Hofer, and Foll (2009). Accounting for the hierarchical population structure reduces the probability of false discoveries (Excoffier et al., 2009). Samples were grouped according to the genetic clustering anal-yses: (i) Greenlandic samples, (ii) Samples from Norway, the Svalbard archipelago, and Russian waters, and (iii) the Icelandic sample (see the section under Results subsection Population structure of M. edulis). The analytical settings for generating 95% and 99% confidence intervals were 20,000 simulations, 100 demes per group, and 10 groups. Loci outside the 95% quantile were considered possible subjects to se-lection, as these loci deviate more than could be expected under a model of neutral population structure. From this analysis, an exclusive
F IGURE 1 Map showing the different sampling locations and the proportion of three different Mytilus species and inferred hybrids at each location. For explanation of sample identification codes, see Table 1. Unidentified individuals denote apparent hybrids of all three Mytilus spp.
M. edulis
M. trossulus
M. galloprovincialis
M. edulis/M. trossulus
M. edulis/M. galloprovincialis
Unidentified
NUS
NUL
QAS QAL
UPE
KOB ICE LOF
TRS
TRL
WS1
WS2
PSW
PSE
SV4SV3SV1 SV2

44 | Mathiesen et al.
“outlier” data set and a “neutral” data set were created to test the im-portance of outlier loci for defining the inferred population structure of M. edulis; that is, the true connectivity among populations based on neutral processes (drift and migration) could be obscured by loci under divergent selection. For both data sets, overall and pairwise FST estimates were generated in Genepop 4.2, while Structure v2.3.4 with K = 2 (using settings as above) was used to investigate whether the population structure found in M. edulis based on all loci could be iden-tified from both the “outlier” and “neutral” data sets, or whether they displayed contrasting patterns.
3 | RESULTS
3.1 | Summary statistics
Three loci (159069_A, 171383_A, and 170478_A) deviated signifi-cantly from HWE in ten samples or more, and they were discarded from further analyses.
In total, 73,206 pairwise tests for LD between loci within samples were performed of which 3,194 tests were significant (4.36%). On av-erage, 154 of 3,485 tests were significant within samples (range 0–986 significant tests). Only three SNP pairs displayed significant LD in more than five samples: 137120_A x BM8E (significant in six samples), 100078_A x 40154_A (significant in eight samples), and 175018_A x 241544_A (significant in 12 samples). Subsequently, one locus from each of the coupled SNP pairs was discarded (BM8E, 241544_A and 40154_A) to eliminate effects of linkage on downstream analyses.
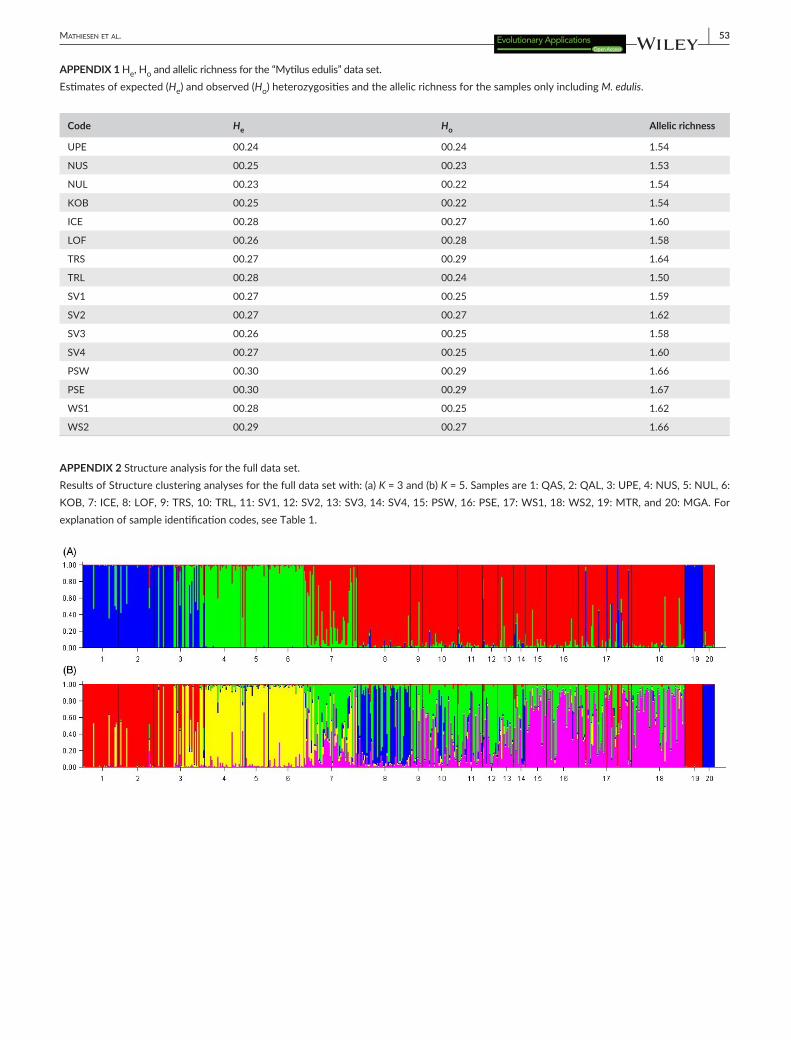
Allelic richness ranged from 1.00 to 1.86 (Table 1), with the lowest values in the Qaanaaq samples (QAS and QAL). The levels of He and Ho (Table 1) ranged from 0.14 to 0.32 in all samples except for QAS and QAL, which had particularly low values ranging from 0.04 to 0.09. In all samples, Ho was close to He except for the Upernavik sample (UPE), where He and Ho was 0.25 and 0.14, respectively, and one of the White Sea samples (WS1) with He and Ho of 0.32 and 0.24. In the reduced data set, with samples consisting only of inferred M. edulis, individuals provided estimates of allelic richness between 1.57 and 1.67 (Appendix 1) and He/Ho values ranging between 0.22 and 0.30.
The overall FST across samples was 0.273. The pairwise FST val-ues ranged between 0 and 0.860 (Table S2) with the highest pairwise FST value between the M. trossulus and M. galloprovincialis reference samples. Further, high values were found between M. galloprovincialis and the N Greenland samples from Qaanaaq; QAS and QAL (0.738 and 0.774) and between M. trossulus and all other samples except the three N Greenland samples (QAS, QAL, and UPE).
3.2 | Identification of hybrids
The multidimensional scaling plot (Fig. 2A) visualizes the genetic dif-ferentiation among all samples including the reference samples for M. trossulus (MTR) and M. galloprovincialis (MGA). The majority of sam-ples clustered together in a “M. edulis” cluster. However, the QAS and QAL samples clustered with the M. trossulus reference sample, while samples UPE, WS1, and Lofoten (LOF) were located between the
three main “species” clusters. UPE and WS1 appeared to be distrib-uted between the M. trossulus and M. edulis clusters, while LOF was situated between the “M. edulis” and “M. galloprovincialis” clusters. The clustering of QAS and QAL with MTR, and the inferred separa-tion of UPE, WS1, and LOF from the “M. edulis” cluster were further supported by the principal component analysis scatter plot of indi-vidual genotypes (Fig. 3A). Most individuals clustered together as a “M. edulis” cluster, except for individuals from the UPE and WS1 sam-ples, which appeared to contain individuals distributed between the “M. trossulus” and “M. edulis” clusters, suggesting that these individuals may be hybrids. The M. galloprovincialis reference sample clustered in the proximity of the “M. edulis” samples in the multidimensional scaling plot; however, a clear separation between the M. edulis and M. gallo-provincialis samples was still apparent (Fig. 2A).
The Structure clustering analysis for K = 4 (Fig. 4, for K = 3 and 5 see Appendix 2) showed that the clusters make biologically sense as they corresponded to M. trossulus, M. galloprovincialis, Greenlandic M. edulis, and other M. edulis. This configuration also allowed the identification of M. edulis/M. galloprovincialis or M. edulis/M. trossu-lus hybrids. This was supported by the Structure analysis including the simulated parentals and hybrids, which showed relatively nar-row 95% confidence intervals for the simulated M. edulis parentals regardless of their geographical origin (0.89–0.99 M. edulis ancestry for Greenland and 0.92–0.99 for the other M. edulis, see Appendix 3). Likewise, the simulated M. trossulus, M. galloprovincialis parentals sug-gested very high power for identifying M. edulis/M. galloprovincialis or M. edulis/M. trossulus hybrids. However, as only two relatively small samples of M. trossulus and M. galloprovincialis provided the foun-dation for the simulations, we conservatively chose an admixture level of 20% as the cutoff point between Mytilus spp. parentals and M. edulis/M. galloprovincialis or M. edulis/M. trossulus hybrids. This was done in order to allow for uncertainty caused by population structure and missing genotypes within the samples of real individuals. This ap-proach enabled the construction of an exclusive “Mytilus edulis” data set. When using K = 3 the analysis was unable to split the samples into the three a priori defined species groups (Appendix 2B).
The inferred proportion (using the 20% criterion) of the different Mytilus species and hybrids in each of the geographical samples (Fig. 1) show that M. edulis is the most common species within the sampled subarctic and Arctic populations, where pure M. edulis specimens constitute approximately 66% of all sampled individuals. Pure M. edu-lis were present in all samples except for QAS and QAL, which were mainly M. trossulus (87%–90%), with few individuals (3–4) showing evidence of M. edulis hybridization. Only two samples, UPE and WS1, contained both pure M. edulis and M. trossulus individuals. The UPE sample contained approximately 51% M. trossulus and 33% M. edulis and 14% M. edulis/M. trossulus hybrids, while the WS1 sample was comprised of 9% M. trossulus, 80% M. edulis, 9% M. edulis/M. trossu-lus hybrids, and 2% M. edulis/M. galloprovincialis hybrids. The distribu-tion of M. galloprovincialis individuals is mainly restricted to samples from the Norwegian coast and the Svalbard archipelago (34 and 4 individuals, respectively). A single apparent M. galloprovincialis indi-vidual was found in the sample of large mussels from Nuuk (NUL).

| 45Mathiesen et al.
The LOF sample contained the highest number of M. galloprovincialis observed—64% and further 11% M. edulis and 22% M. edulis/M. gal-loprovincialis hybrids. In cases where more than a few hybrids were found, the distribution of admixture estimates of real individuals was
compared to the simulated hybrids. In all cases, different classes of hy-brids (F1, F2, and backcrosses) were suggested. However, as explained above the comparison of real and simulated individuals should be in-terpreted with caution.
F IGURE 2 Multidimensional scaling plot of (A) all samples and (B) designated Mytilus edulis samples based on pairwise genetic distances among samples. For explanation of sample identification codes, see Table 1. Further codes: NUU comprise of NUS and NUL, TRO comprise of TRS and TRL, and SVA comprise of SV1, SV2, and SV3
−0.6 −0.4 −0.2 0.0 0.2 0.4 0.6
−0.6
−0.4
−0.2
0.0
0.2
0.4
0.6
Dimension 1
Dim
ensi
on 2
−0.05 0.00 0.05
−0.0
50.
000.
05
Dimension 1
Dim
ensi
on 2
(A) (B)
F IGURE 3 Principal component scatter plot of individual genotypes for (A) all samples (B) Mytilus edulis samples, and (C) Norwegian, Svalbard, and Russian samples. For explanation of sample identification codes, see Table 1. Further codes: NUU comprise of NUS and NUL, TRO comprise of TRS and TRL, and SVA comprise of SV1, SV2, and SV3
(A) (B) (C)
F IGURE 4 Results of Structure clustering analyses for the full data set for K = 4. Samples are 1: QAS, 2: QAL, 3: UPE, 4: NUS, 5: NUL, 6: KOB, 7: ICE, 8: LOF, 9: TRS, 10: TRL, 11: SV1, 12: SV2, 13: SV3, 14: SV4, 15: PSW, 16: PSE, 17: WS1, 18: WS2, 19: MTR, and 20: MGA. For explanation of sample identification codes, see Table 1

46 | Mathiesen et al.
3.3 | Population structure of Mytilus edulis
The overall FST for all samples identified as M. edulis was 0.048. Pairwise FST values ranged from 0 to 0.113 with the highest values between the Greenlandic samples and the Norwegian, Svalbard, and Russian samples (Table S3). The lowest FST values were found between geographically proximate samples such as the two White Sea samples (WS1 and WS2) and the two sampling sites in Svalbard (SVA and SV4). For sites with samples of different size classes, FST estimates ranged between 0.001 for the Nuuk samples (NUS and NUL) and 0.018 for the Tromsø samples (TRS and TRL) (Supplementary Table S3). The low FST for Nuuk samples indicates short- term temporal stability of ge-netic population structure. The higher FST estimate for Tromsø mus-sels was not significant, thus allowing the pooling of size classes for the downstream analyses.
The cluster analysis of the “Mytilus edulis” data set (K = 2–4) showed a clear clustering of samples, essentially separating the Greenlandic samples from the other samples (Fig. 5). The likelihood of
K = 2 was highest splitting the M. edulis samples into two groups; the Greenlandic samples versus the Norwegian, Svalbard, and Russian samples and identifying the Icelandic sample a mixture of eastern and western Atlantic gene pools (Fig. 5A). The plots for K = 3 and K = 4 added no additional biologically sensible information.
The hierarchical AMOVA for the three groups (Greenlandic, Icelandic, and Norwegian/Svalbard/Russian) provided an estimated variance of 5.78% among groups and 0.43% among samples within groups. The multidimensional scaling plot of population samples (Fig. 2B) and the principal component analysis scatter plot of individ-ual genotypes (Fig. 3B) further supported the population structure of M. edulis inferred by Structure with three groups: (i) Greenlandic sam-ples, (ii) Norwegian, Svalbard, and Russian samples, and (iii) the Icelandic sample found between the two main clusters inferred by axis 1.
The principal component analysis scatter plot including only Norwegian, Svalbard, and Russian samples (Fig. 3C) did not provide a clear separation of individuals as these individuals were scattered with no apparent pattern.
F IGURE 5 Results from clustering analyses of the “Mytilus edulis” data set with: (A) K = 2, (B) K = 3, and (C) K = 4. Samples are as follows: 1: UPE, 2: NUU comprising of NUS and NUL, 3: KOB, 4: ICE, 5: LOF, 6: TRO comprising of TRS and TRL, 7: SVA comprising of SV1, SV2, and SV3, 8: SV4, 9: PSW, 10: PSE, 11: WS1, and 12: WS2. For explanation of sample identification codes, see Table 1

| 47Mathiesen et al.
3.4 | Outlier analysis
The outlier tests identified six loci as FST outliers, with six loci signifi-cant at the 5% level and three at the 1% level. All of these outliers are high FST outliers (Fig. 6) indicating diversifying selection (Beaumont & Nichols, 1996), although a few of them could represent the upper tail of the neutral FST distribution. Also, a strong genetic cline as observed here is known to sometimes overestimate the number of loci under diversifying selection (Strand, Williams, Oleksiak, & Sotka, 2012). Furthermore, introgression between Mytilus spp. has been found to cause high FST outliers (Gosset and Bierne 2012). Pairwise FST values ranged from 0 to 0.059 for the “neutral” data set and from 0 to 0.474 for the “outlier” data set (Tables S4 and S5). The Structure analyses for both the “neutral” and “outlier” data set also supported the initial population structure separating Greenlandic samples from the Norwegian, Svalbard, and Russian samples and with the Icelandic sample of admixed origin (Appendices 4 and 5).
4 | DISCUSSION
4.1 | Distribution of Mytilus spp. in the Arctic
Baseline information of species distribution and their genetic com-position is imperative in order to quantify the impacts of climate change on species distribution ranges, biodiversity, and the effects of hybridization between species and populations (Gardner, Zbawicka, Westfall, & Wenne, 2016). Molecular genetic knowledge is a key
measure to identify the distribution of invasive congener species (Geller, Darling, & Carlton, 2010), which may cause cascading eco-system effects. Despite congener species appearing morphologically similar, interspecific variation in ecology and physiology may impact population fitness (Fly & Hilbish, 2013; Fraïsse et al., 2016; Somero, 2005). In the Arctic, baselines studies on genetic variation and spe-cies abundance are largely absent but urgently needed (Bluhm et al., 2011; Wassmann, Duarte, Agusti, & Sejr, 2011). Pioneer work should therefore focus on keystone model species (such as Mytilus), because of their disproportionally large effect on their environment.
Mytilus spp. were found pan- Arctic (although only one individual of M. galloprovincialis was identified in Greenland). Generally, M. edulis was the most common species making up approximately 66% of all sampled individuals. The biogeographic structures of the three Mytilus spp. reflect the major current systems of the region. Pure populations were mainly found in regions (such as W Greenland and the Pechora Sea) with a lower influence of Pacific and Atlantic water, than other sampling sites. Northwards currents from boreal waters facilitate lar-vae dispersal from southern populations (Berge et al., 2005; Renaud, Sejr, Bluhm, Sirenko, & Ellingsen, 2015). For instance, the northward flowing current regimes (such as the Norwegian Current) allows non- Arctic species to extend their range into the Arctic from the Atlantic or Pacific Ocean (Bluhm et al., 2011; Fetzer & Arntz, 2008; Sirenko & Gagaev, 2007). Ocean currents also explain why Mytilus spp. re-main absent in NE Greenland despite the environmental resemblance of NW Greenland with regard to temperatures and ice conditions (Sejr, Blicher, & Rysgaard, 2009). In general, the NE Greenland shelf
F IGURE 6 FST outlier analyses in Arlequin v3.5.1.3 utilizing the hierarchical island model. Black solid dots denote loci, and gray dashed and dotted lines indicate 95% and 99% confidence intervals, respectively. Loci outside the 95% and 99% confidence intervals are suggested to be under selection
–0.02
0.08
0.18
0.28
0.38
0.48
–0.02 0.08 0.18 0.28 0.38 0.48 0.58
FST
Heterozygosity
50454_A
BM2G 175018_A
144504_A
BM21B
BM62A

48 | Mathiesen et al.
is considered biogeographically different from the rest of Greenland (Piepenburg et al., 2011). The absence of Mytilus mussels in NE Greenland is likely a result of dispersal barriers due to the lack of an downstream source population, as the East Greenland Current flows from north to south, exemplifying how outflow shelves may respond slowly to climatic changes (Renaud et al., 2015). This is further sup-ported by the presence of Mytilus mussels in SE Greenland, at Tasiilaq (Ammassalik, 65°N) (Ockelmann, 1958), which is influenced by a branch of the Irminger Current from the Atlantic Ocean.
The present study highlights the need for further genetic studies in the region as a M. trossulus population was found in the most northern sampled region of NW Greenland (77°N) with M. edulis populations residing in SW Greenland (64°N). This discovery was unexpected, as a seemingly established M. trossulus population has not been found in the high Arctic prior to this study. Several possible mechanisms could explain the presence of M. trossulus in Qaanaaq and Upernavik. First, these populations could have survived in a refugium near NW Greenland during the last glacial period. Glacial refugia are known from North Atlantic temperate regions and evidence suggests that M. edulis may have survived north of the ice margin (Maggs et al., 2008; Riginos & Henzler, 2008). Second, there could be a contempo-rary spread of M. trossulus from the Pacific Ocean. Jones et al. (2003) found that waters around NW Greenland contained high levels of phosphate indicating Pacific water being transported into this area. Also, there are a few reports of live M. trossulus in Arctic Alaska and Canada (Feder et al., 2003), so the spread of planktonic larvae from the Canadian Arctic could be possible. A third scenario could be that M. trossulus spread to Arctic Greenland from the East coast of Canada. However, as the West Greenland Current moves along the coast from south to north, and Mytilus mussels are expected to disperse with rather than against currents, this scenario seems unlikely (McQuaid & Phillips, 2000). Finally, Mytilus spp. are known to disperse by human activities and can survive long distances and fluctuating temperatures (Lee & Chown, 2007). Qaanaaq is situated less than 150 km from the US Thule Air Base, which receives supplies by US ships; this is provid-ing an alternative dispersal route of M. trossulus from the north Pacific.
The invasive M. galloprovincialis appeared widespread from Greenland to the Pechora Sea. In Norway, M. galloprovincialis appears common along the coastline (Brooks & Farmen, 2013), and the discov-ery of M. galloprovincialis in Svalbard suggests colonization by ocean currents as hypothesized by Berge et al. (2005) or ship traffic from the Norwegian mainland (Ware et al., 2014).
4.2 | Mytilus hybrid zones in the Arctic
Most sampling locations displayed varying degrees of hybridization and introgression between different Mytilus spp. and only four loca-tions contained apparently pure populations (Fig. 1). Introgression can affect a population’s fitness and vulnerability to climate change. In the study region, hybrid zones were found in Norway, Svalbard, and Greenland, with the highest abundance of the invasive M. gal-loprovincialis found along the Norwegian coast, especially in Lofoten (68°N) further supporting the findings by Brooks and Farmen (2013)
and Riginos and Henzler (2008). Additionally, a surprisingly high amount of M. galloprovincialis was found at Svalbard. We also found evidence of limited introgression of M. galloprovincialis in the Russian and Icelandic samples, and the ecological consequences of invasive mussels in these regions need to be studied further. In the White Sea, M. trossulus individuals were only recorded in one of two loca-tions. This small- scale regional variation in species composition was also observed by Väinölä and Strelkov (2011), who also found M. tros-sulus and M. edulis/M. trossulus hybrids but to a much lesser extent than M. edulis. It is believed that the expansion of M. trossulus in the White Sea is most likely facilitated by ships (Väinölä & Strelkov, 2011). This explains the fact that populations dominated by M. trossulus are confined to sites with harbors and seaports, while M. edulis inhabit all the coastline of the White Sea, where the substrates are appropri-ate. In the present study, the sample WS1 that contained M. trossulus and their hybrids were collected directly in the area of the White Sea Biological Station Kartesh, which has a regular ship connection with Chupa, a small town in Kandalaksha Bay. Recently, M. trossulus was found in the Chupa harbor (Katolikova, Khaitov, Vänölä, Gantsevich, & Strelkov, 2016), where ship traffic from the Barents Sea has been relatively intensive. In contrast, the WS2 site with pure M. edulis in the sample is located on an uninhabited island Kondostrov in the Onega Bay, which is far from the towns with intensive ship traffic.
4.3 | Population structure of Mytilus edulis
The genetic structure of the M. edulis populations in this study re-vealed a significant split between M. edulis samples from each side of the Atlantic, with Icelandic M. edulis appearing as an admixture of the two gene pools. This divergence of W and E Atlantic populations is in line with the findings of Riginos and Henzler (2008) and Waltari and Hickerson (2013), who suggested that M. edulis survived in a W Atlantic glacial refugium. Furthermore, Riginos et al. (2004) found low gene flow across the Atlantic, providing an explanation for the continuing divergence of M. edulis populations from W and E Atlantic coasts. These studies primarily looked at mitochondrial DNA, but their results are strongly supported by the SNP analysis presented here. This, however, contrasts to the meta- population analysis of poly-chaete and echinoderm populations in the Arctic showing high gene flow between populations (Hardy et al., 2011). This difference in gene flow patterns between different species with long planktonic larval stage further highlights the necessity of understanding the population structure within species to best conserve biodiversity in the Arctic.
In general, FST values between samples from Norway, Svalbard, and Russia and the Icelandic sample are lower than between the Icelandic sample and Greenlandic samples. Śmietanka, Burzyński, Hummel, and Wenne (2014) suggested a single glacial Atlantic refu-gium founding European M. edulis. However, our studied sample from Iceland suggests the population to consist of individuals of mixed ancestry. Further analyses of their origin/history could be elucidated by conducting additional analysis of samples from both sides of the Atlantic. Considering that the major North Atlantic Current reaches Iceland from the east, it is perhaps more likely that Iceland would be

| 49Mathiesen et al.
recruiting spat from East Atlantic populations. This is also inferred by Riginos and Henzler (2009), who found postcolonization gene flow from northern Europe to Iceland.
The outlier tests identified six loci as FST outliers at the 5% signifi-cance levels. All of these outliers are high FST outliers (Fig. 6) indicating diversifying selection (Beaumont & Nichols, 1996). However, a strong genetic cline as observed here is known to sometimes overestimate the number of loci under diversifying selection (Strand et al., 2012). Furthermore, introgression between Mytilus spp. have been found to cause high FST outliers (Gosset & Bierne, 2012), and this result should be interpreted with some caution. Still, we find that the pattern of population structure is the same for the “neutral” and the “outlier” data sets (Appendices 4 and 5), suggesting that patterns of neutral population structure is correlated with adaptive evolution in response to divergent local environmental conditions. Temperature influences the large- scale geographical distribution of species (Sunday, Bates, & Dulvy, 2011); however, on a local scale other factors including pre-dation, the presence of sea ice, suitable habitats, water current, and salinity can influence the distribution of intertidal species (Høgslund, Sejr, Wiktor, Blicher, & Wegeberg, 2014; Kroeker et al., 2016; Paine, 1974), and these conditions are very different between W Greenland and the other sampling sites (Rayner et al., 2003). Still, the high di-vergence between samples from the Eastern Atlantic and Greenland cannot be explained alone by loci subject to selection. FST values for the “neutral” data set are still high (Table S4) suggesting a high degree of isolation between groups. This isolation in turn may have facilitated local adaptation at this rather large geographical scale. For more spe-cific insights on the environmental factors responsible for local ad-aptation, the geographical scale, and its genomewide significance, a more elaborate sampling design is warranted including more regional samples and a higher degree of genomic coverage.
4.4 | Implications for conservation of marine species in the face of climate change
The effects of global warming increase the spread and associated threat of nonindigenous species across the globe (Gardner et al., 2016; Hellmann, Byers, Bierwagen, & Dukes, 2008; Saarman & Pogson, 2015). A study by Wisz et al. (2015) predicted that continued warming of the Arctic could open the Bering Strait and thus facilitate a Pacific–Arctic exchange of nonindigenous species, which could have adverse impact on Arctic biodiversity. Moreover, human activities are short- cutting natural dispersal barriers for nonindigenous species (Carlton & Geller, 1993), posing a global risk of spreading these to novel regions. In this regard, especially ship traffic facilitates disper-sal (e.g. in ballast water and hull fouling; Chan, MacIsaac, & Bailey, 2015; Geller et al., 1994; Ware et al., 2014). Such intrusions of non-indigenous species into the Arctic have already occurred (e.g. Pacific king crabs Paralithodes camtschaticus and bluefin tuna Thunnus thyn-nus; CAFF 2013; MacKenzie, Payne, Boje, Hoyer, & Siegstad, 2014; Oug, Cochrane, Sundet, Norling, & Nilsson, 2011), and Saarman and Pogson (2015) found that the nonindigenous M. galloprovincialis pose an ecological threat to M. trossulus along the Californian coast as it
had displaced and continues to displace the native M. trossulus. The surprisingly broad distribution of M. galloprovincialis in the Arctic therefore highlights the benefit of using genetic tools and stresses the need for developing measures to detect and identify nonindigenous species and pathways of introduction, to understand and reduce the threat of invasive species in the Arctic.
Prior to the current investigation, multiple studies have assumed Mytilus mussels in the Arctic to be exclusively M. edulis (Berge et al., 2005; Hansen, Hanken, Nielsen, Nielsen, & Thomsen, 2011; Jensen, 1905; Strand & Asmund, 2003). The identification of three Mytilus spp. across the Arctic has implications for ecological and ecotoxicological research in the region. Mytilus mussels are extensively used in biolog-ical monitoring programs (Wenne et al., 2016). However, interspecific differences in physiology and responses to environmental pollutants have been reported (Brooks, Farmen, Heier, Blanco- Rayon, & Izagirre, 2015; Fly & Hilbish, 2013), and thus, the lack of genetic knowledge could seriously affect the conclusions of ongoing biological monitor-ing. We therefore emphasize the importance of applying genetic tools to document species status, when conducting ecological, ecotoxico-logical, and physiological studies.
Moreover, assuming that the distribution and genetic connectivity between regions observed in this study is to be a first approximation representative for benthic invertebrates in general, several important observations were made related to quantifying changes in species distribution in a warmer Arctic. A number of congener species exists, which display different responses to changes in temperature. The ge-netic connectivity and inferred gene flow are closely linked to major ocean currents, which means that predicting range changes purely based on future climate predictions without considering dispersal po-tential or barriers can be misleading. In fact, changes in ocean currents and thereby in supply of potential colonizers may be a more import-ant driver of change than warming per se. This has previously been demonstrated by the species changes observed during the large north-ward expansion of Atlantic water in the Barents Sea and along the W Greenland coast in the 1930s (Drinkwater, 2006). Genetically isolated areas like outflow shelves without upstream source populations (such as, NE Greenland) appear to be especially vulnerable to human vec-tors (such as shipping) as the absence of several species here likely reflects lacking postglacial invasion rather than adverse climatic condi-tions. Finally, NW Greenland M. trossulus populations with an affinity to the Pacific suggest that exchange of species from the Pacific across the Arctic and into the Atlantic is taking place. However, all of these factors should be further validated through urgently needed studies documenting current distribution and genetic composition of marine species in the Arctic.
ACKNOWLEDGEMENTS
We wish to thank Dr. Risto Väinölä and Prof. Paulino Martínez Portela for providing mussel tissue for reference samples. Dorte Meldrup is acknowledged for laboratory support. Sampling in Nuuk was conducted as part of the Greenland Ecosystem Monitoring (GEM) program, and we also appreciate Snorri Gunnarson and Dr. Dorte
50 | Mathiesen et al.
Krause- Jensen for collecting mussels. The project was funded by the 15th of June Foundation, the Program of Russian Academy of Sciences “Fundamental Research to the Development of Arctic”, the Framcentre flagship Fjord and Coast project “Life at the Edge”, and a Norwegian Research Council project (project nr 225044). This work is a contribution to the Arctic Science Partnership (ASP), asp- net.org.
DATA ARCHIVING STATEMENT
Data available from the Dryad Digital Repository: http://dx.doi.org/10.5061/dryad.438h3.
CONFLICT OF INTEREST
The authors declare no conflict of interest.
REFERENCES
ACIA. (2004). Impacts of a warming arctic: Arctic climate impact assessment. ACIA Overview report (140 pp.). Cambridge: Cambridge University Press.
Anderson, A. S., Bilodeau, A. L., Gilg, M. R., & Hilbish, T. J. (2002). Routes of introduction of the Mediterranean mussel (Mytilus galloprovincialis) to Puget Sound and Hood Canal. Journal of Shellfish Research, 21, 75–79.
Beaumont, M. A., & Nichols, R. A. (1996). Evaluating loci for use in the ge-netic analysis of population structure. Proceedings of the Royal Society of London B: Biological Sciences, 263, 1619–1626.
Berge, J., Johnsen, G., Nilsen, F., Gulliksen, B., & Slagstad, D. (2005). Ocean temperature oscillations enable reappearance of blue mussels Mytilus edulis in Svalbard after a 1000 year absence. Marine Ecology Progress Series, 303, 167–175.
Bierne, N., Borsa, P., Daguin, C., Jollivet, D., Viard, F., Bonhomme, F., & David, P. (2003). Introgression patterns in the mosaic hybrid zone between Mytilus edulis and M. galloprovincialis. Molecular Ecology, 12, 447–461.
Bierne, N., Daguin, C., Bonhomme, F., David, P., & Borsa, P. (2003). Direct selection on allozymes is not required to explain heterogeneity among marker loci across a Mytilus hybrid zone. Molecular Ecology, 12, 2505–2510.
Blicher, M. E., Sejr, M. K., & Høgslund, S. (2013). Population structure of Mytilus edulis in the intertidal zone in a sub- Arctic fjord, SW Greenland. Marine Ecology Progress Series, 487, 89–100.
Bluhm, B. A., Gebruk, A. V., Gradinger, R., Hopcroft, R. R., Huettmann, F., Kosobokova, K. N., … Weslawski, J. M. (2011). Arctic marine biodi-versity: An update of species richness and examples of biodiversity change. Oceanography, 24, 232–248.
Brodersen, J., & Seehausen, O. (2014). Why evolutionary biologists should get seriously involved in ecological monitoring and applied biodiversity assessment programs. Evolutionary Applications, 7, 968–983.
Brooks, S. J., & Farmen, E. (2013). The distribution of the mussel Mytilus species along the Norwegian coast. Journal of Shellfish Research, 32, 265–270.
Brooks, S. J., Farmen, E., Heier, L. S., Blanco-Rayon, E., & Izagirre, U. (2015). Differences in copper bioaccumulation and biological responses in three Mytilus species. Aquatic Toxicology, 160, 1–12.
CAFF. 2013. Arctic biodiversity assessment—Status and trends in Arctic biodi-versity (678 pp.). Akureyri, Iceland: Author.
Carlton, J. T., & Geller, J. B. (1993). Ecological roulette—The global transport of nonindigenous marine organisms. Science, 261, 78–82.
Chan, F. T., MacIsaac, H. J., & Bailey, S. A. (2015). Relative importance of ves-sel hull fouling and ballast water as transport vectors of nonindigenous
species to the Canadian Arctic. Canadian Journal of Fisheries and Aquatic Sciences, 72, 1230–1242.
Doherty, S. D., Brophy, D., & Gosling, E. (2009). Synchronous reproduc-tion may facilitate introgression in a hybrid mussel (Mytilus) population. Journal of Experimental Marine Biology and Ecology, 378, 1–7.
Drinkwater, K. F. (2006). The regime shift of the 1920s and 1930s in the North Atlantic. Progress in Oceanography, 68, 134–151.
Excoffier, L., Hofer, T., & Foll, M. (2009). Detecting loci under selection in a hierarchically structured population. Heredity, 103, 285–298.
Excoffier, L., & Lischer, H. E. L. (2010). Arlequin suite ver 3.5: A new series of programs to perform population genetics analyses under Linux and Windows. Molecular Ecology Resources, 10, 564–567.
Feder, H. M., Norton, D. W., & Geller, J. B. (2003). A review of apparent 20th century changes in the presence of mussels (Mytilus trossulus) and macroalgae in Arctic Alaska, and of historical and paleontological ev-idence used to relate mollusc distributions to climate change. Arctic, 56, 391–407.
Fetzer, I., & Arntz, W. E. (2008). Reproductive strategies of benthic inver-tebrates in the Kara Sea (Russian Arctic): Adaptation of reproduction modes to cold water. Marine Ecology Progress Series, 356, 189–202.
Fly, E. K., & Hilbish, T. J. (2013). Physiological energetics and biogeographic range limits of three congeneric mussel species. Oecologia, 172, 35–46.
Fraïsse, C., Belkhir, K., Welch, J. J., & Bierne, N. (2016). Local interspe-cies introgression is the main cause of extreme levels of intraspecific differentiation in mussels. Molecular Ecology, 25, 269–286.
Fraïsse, C., Roux, C., Welch, J. J., & Bierne, N. (2014). Gene- flow in a mosaic hybrid zone: Is local introgression adaptive? Genetics, 197, 939–951.
Gardner, J. P. A., & Thompson, R. J. (2001). The effects of coastal and es-tuarine conditions on the physiology and survivorship of the mussels Mytilus edulis, M. trossulus and their hybrids. Journal of Experimental Marine Biology and Ecology, 265, 119–140.
Gardner, J. P. A., Zbawicka, M., Westfall, K. M., & Wenne, R. (2016). Invasive blue mussels threaten regional scale genetic diversity in mainland and remote offshore locations: The need for baseline data and en-hanced protection in the Southern Ocean. Global Change Biology, 22, 3182–3195.
Geller, J. B., Carlton, J. T., & Powers, D. A. (1994). PCR based detection of mtDNA haplotypes of native and invading mussels on the northeast-ern Pacific coast—Latitudinal pattern of invasion. Marine Biology, 119, 243–249.
Geller, J. B., Darling, J. A., & Carlton, J. T. (2010). Genetic perspectives on marine biological invasions. Annual Review of Marine Science, 2, 367–393.
Goldberg, E. D. (1986). The mussel watch concept. Environmental Monitoring and Assessment, 7, 91–103.
Gosling, E. (2003). Bivalve molluscs: Biology, ecology and culture (456 pp.). Bodmin, Cornwall, UK: Fishing News Books.
Gosset, C. C., & Bierne, N. (2012). Differential introgression from a sister species explains high FST outlier loci within a mussel species. Journal of Evolutionary Biology, 26, 14–26.
Hansen, J., Hanken, N. M., Nielsen, J. K., Nielsen, J. K., & Thomsen, E. (2011). Late Pleistocene and Holocene distribution of Mytilus edulis in the Barents Sea region and its palaeoclimatic implications. Journal of Biogeography, 38, 1197–1212.
Hansen, M. M., Olivieri, I., Waller, D. M., Nielsen, E. E., & T. G. W. Group. (2012). Monitoring adaptive genetic responses to environmental change. Molecular Ecology, 21, 1311–1329.
Hardy, S. M., Carr, C. M., Hardman, M., Steinke, D., Corstorphine, E., & Mah, C. (2011). Biodiversity and phylogeography of Arctic marine fauna: Insights from molecular tools. Marine Biodiversity, 41, 195–210.
Hellmann, J. J., Byers, J. E., Bierwagen, B. G., & Dukes, J. S. (2008). Five potential consequences of climate change for invasive species. Conservation Biology, 22, 534–543.
Helyar, S. J., Hemmer-Hansen, J., Bekkevold, D., Taylor, M. I., Ogden, R., Limborg, M. T., … Nielsen, E. E. (2011). Application of SNPs for

| 51Mathiesen et al.
population genetics of nonmodel organisms: New opportunities and challenges. Molecular Ecology Resources, 11, 123–136.
Hilbish, T. J., Carson, E. W., Plante, J. R., Weaver, L. A., & Gilg, M. R. (2002). Distribution of Mytilus edulis, M. galloprovincialis, and their hybrids in open- coast populations of mussels in southwestern England. Marine Biology, 140, 137–142.
Høgslund, S., Sejr, M. K., Wiktor Jr, J., Blicher, M. E., & Wegeberg, S. (2014). Intertidal community composition along rocky shores in South- west Greenland: A quantitative approach. Polar Biology, 37, 1549–1561.
Hummel, H., Colucci, P., Bogaards, R. H., & Strelkov, P. (2001). Genetic traits in the bivalve Mytilus from Europe, with an emphasis on Arctic popula-tions. Polar Biology, 24, 44–52.
Inoue, K., Odo, S., Noda, T., Nakao, S., Takeyama, S., Yamaha, E., … Harayama, S. (1997). A possible hybrid zone in the Mytilus edulis complex in Japan revealed by PCR markers. Marine Biology, 128, 91–95.
IPCC. (2014). Summary for policymakers. In C. B. Field, V. R. Barros, D. J. Dokken, K. J. Mach, M. D. Mastrandrea, T. E. Bilir, M. Chatterjee, K. L. Ebi, Y. O. Estrada, R. C. Genova, B. Girma, E. S. Kissel, A. N. Levy, S. MacCracken, P. R. Mastrandrea, & L. L. White (Eds.), Climate change 2014: Impacts, adaptation, and vulnerability. Part A: Global and sectoral aspects. Contribution of working group II to the fith assessment report of the intergovernmental panel on climate change (pp. 1–32). Cambridge, UK and New York, NY: Cambridge University Press.
Jensen, A. S. (1905). On the mollusca of East Greenland. In Meddelelser om Grønland. Copenhagen, Denmark: Kommissionen for videnskabelige undersøgelser i Grønland.
Jombart, T. (2008). adegenet: A R package for the multivariate analysis of genetic markers. Bioinformatics, 24, 1403–1405.
Jombart, T., & Ahmed, I. (2011). adegenet 1.3- 1: New tools for the analysis of genome- wide SNP data. Bioinformatics, 27, 3070–3071.
Jones, S. J., Lima, F. P., & Wethey, D. S. (2010). Rising environmental tem-peratures and biogeography: Poleward range contraction of the blue mussel, Mytilus edulis L., in the western Atlantic. Journal of Biogeography, 37, 2243–2259.
Jones, E. P., Swift, J. H., Anderson, L. G., Lipizer, M., Civitarese, G., Falkner, K. K., … McLaughlin, F. (2003). Tracing Pacific water in the North Atlantic Ocean. Journal of Geophysical Research- Oceans, 108, 3116.
Katolikova, M., Khaitov, V., Vänölä, R., Gantsevich, M., & Strelkov, P. (2016). Genetic, ecological and morphological distinctness of the blue mussels Mytilus trossulus Gould and M. edulis L. in the White Sea. PLoS One, 11, e0152963.
Keenan, K., McGinnity, P., Cross, T. F., Crozier, W. W., & Prodohl, P. A. (2013). diveRsity: An R package for the estimation and exploration of population genetics parameters and their associated errors. Methods in Ecology and Evolution, 4, 782–788.
Koehn, R. K. (1991). The genetics and taxonomy of species in the genus Mytilus. Aquaculture, 94, 125–145.
Kroeker, K. J., Sanford, E., Rose, J. M., Blanchette, C. A., Chan, F., Chavez, F. P., … Washburn, L. (2016). Interacting environmental mosaics drive geographic variation in mussel performance and predation vulnerabil-ity. Ecology Letters, 19, 771–779.
Laikre, L., Schwartz, M. K., Waples, R. S., & Ryman, N. (2010). Compromising genetic diversity in the wild: Unmonitored large- scale release of plants and animals. Trends in Ecology & Evolution, 25, 520–529.
Lee, J. E., & Chown, S. L. (2007). Mytilus on the move: Transport of an in-vasive bivalve to the Antarctic. Marine Ecology Progress Series, 339, 307–310.
Limborg, M. T., Helyar, S. J., de Bruyn, M., Taylor, M. I., Nielsen, E. E., Ogden, R., … FPT Consortium. (2012). Environmental selection on transcriptome- derived SNPs in a high gene flow marine fish, the Atlantic herring (Clupea harengus). Molecular Ecology, 21, 3686–3703.
MacKenzie, B. R., Payne, M. R., Boje, J., Hoyer, J. L., & Siegstad, H. (2014). A cascade of warming impacts brings bluefin tuna to Greenland waters. Global Change Biology, 20, 2484–2491.
Maggs, C. A., Castilho, R., Foltz, D., Henzler, C., Jolly, M. T., Kelly, J., … Wares, J. (2008). Evaluating signatures of glacial refugia for North Atlantic benthic marine taxa. Ecology, 89, 108–122.
McDonald, J. H., Seed, R., & Koehn, R. K. (1991). Allozymes and mor-phometric characters of three species of Mytilus in the Northern and Southern Hemispheres. Marine Biology, 111, 323–333.
McQuaid, C. D., & Phillips, T. E. (2000). Limited wind- driven dispersal of intertidal mussel larvae: In situ evidence from the plankton and the spread of the invasive species Mytilus galloprovincialis in South Africa. Marine Ecology Progress Series, 201, 211–220.
Mubiana, V. K., Qadah, D., Meys, J., & Blust, R. (2005). Temporal and spatial trends in heavy metal concentrations in the marine mussel Mytilus edu-lis from the Western Scheldt estuary (The Netherlands). Hydrobiologia, 540, 169–180.
Nielsen, E. E., Bach, L. A., & Kotlicki, P. (2006). Hybridlab (version 1.0): A program for generating simulated hybrids from population samples. Molecular Ecology Notes, 6, 971–973.
Nielsen, E. E., Hansen, M. M., Ruzzante, D. E., Meldrup, D., & Grønkjær, P. (2003). Evidence of a hybrid- zone in Atlantic cod (Gadus morhua) in the Baltic and the Danish Belt Sea revealed by individual admixture analy-sis. Molecular Ecology, 12, 1497–1508.
Nielsen, E. E., Hemmer-Hansen, J., Larsen, P. F., & Bekkevold, D. (2009). Population genomics of marine fishes: Identifying adaptive variation in space and time. Molecular Ecology, 18, 3128–3150.
Ockelmann, W. K. (1958). The zoology of East Greenland: Marine lamelli-branchiata. In Meddelelser om Grønland. Copenhagen, Denmark: Kommissionen for videnskabelige undersøgelser i Grønland.
Ouagajjou, Y., Presa, P., Astorga, M., & Pérez, M. (2011). Microsatellites of Mytilus chilensis: A genomic print of its taxonomic status within Mytilus sp. Journal of Shellfish Research, 30, 325–330.
Oug, E., Cochrane, S. K. J., Sundet, J. H., Norling, K., & Nilsson, H. C. (2011). Effects of the invasive red king crab (Paralithodes camtschati-cus) on soft- bottom fauna in Varangerfjorden, northern Norway. Marine Biodiversity, 41, 467–479.
Paine, R. T. (1974). Intertidal community structure—Experimental studies on relationship between a dominant competitor and its principal pred-ator. Oecologia, 15, 93–120.
Piepenburg, D., Archambault, P., Ambrose Jr, W., Blanchard, A., Bluhm, B., Carroll, M., … Włodarska-Kowalczuk, M. (2011). Towards a pan- Arctic inventory of the species diversity of the macro- and megabenthic fauna of the Arctic shelf seas. Marine Biodiversity, 41, 51–70.
Poloczanska, E. S., Brown, C. J., Sydeman, W. J., Kiessling, W., Schoeman, D. S., Moore, P. J., … Richardson, A. J. (2013). Global imprint of climate change on marine life. Nature Climate Change, 3, 919–925.
Presa, P., Perez, M., & Diz, A. P. (2002). Polymorphic microsatellite markers for blue mussels (Mytilus spp.). Conservation Genetics, 3, 441–443.
Pritchard, J. K., Stephens, M., & Donnelly, P. (2000). Inference of population structure using multilocus genotype data. Genetics, 155, 945–959.
Quesada, H., Gallagher, C., Skibinski, D. A. G., & Skibinski, D. O. F. (1998). Patterns of polymorphism and gene flow of gender- associated mito-chondrial DNA lineages in European mussel populations. Molecular Ecology, 7, 1041–1051.
R Core Team. (2015). R: A language and environment for statistical computing. Vienna, Austria: R Foundation for Statistical Computing.
Rainbow, P. S. (1995). Biomonitoring of heavy metal availability in the ma-rine environment. Marine Pollution Bulletin, 31, 183–192.
Rawson, P. D., & Harper, F. M. (2009). Colonization of the northwest Atlantic by the blue mussel, Mytilus trossulus postdates the last glacial maximum. Marine Biology, 156, 1857–1868.
Rawson, P. D., & Hilbish, T. J. (1995). Evolutionary relationships among the male and female mitochondrial- DNA lineages in the Mytilus edulis spe-cies complex. Molecular Biology and Evolution, 12, 893–901.
Rawson, P. D., & Hilbish, T. J. (1998). Asymmetric introgression of mito-chondrial DNA among European populations of blue mussels (Mytilus spp.). Evolution, 52, 100–108.

52 | Mathiesen et al.
Raymond, M., & Rousset, F. (1995). Genepop (Version- 1.2)—population genetics software for exact tests and ecumenicism. Journal of Heredity, 86, 248–249.
Rayner, N. A., Parker, D. E., Horton, E. B., Folland, C. K., Alexander, L. V., Rowell, D. P., … Kaplan, A. (2003). Global analyses of sea surface tem-perature, sea ice, and night marine air temperature since the late nine-teenth century. Journal of Geophysical Research- Atmospheres, 108, 4407.
Renaud, P. E., Sejr, M. K., Bluhm, B. A., Sirenko, B., & Ellingsen, I. H. (2015). The future of Arctic benthos: Expansion, invasion, and biodiversity. Progress in Oceanography, 139, 244–257.
Riginos, C., & Cunningham, C. W. (2005). Local adaptation and species seg-regation in two mussel (Mytilus edulis x Mytilus trossulus) hybrid zones. Molecular Ecology, 14, 381–400.
Riginos, C., & Henzler, C. M. (2008). Patterns of mtDNA diversity in North Atlantic populations of the mussel Mytilus edulis. Marine Biology, 155, 399–412.
Riginos, C., & Henzler, C. M. (2009). Patterns of mtDNA diversity in North Atlantic populations of the mussel Mytilus edulis (vol 155, pg 399, 2008). Marine Biology, 156, 2649.
Riginos, C., Hickerson, M. J., Henzler, C. M., & Cunningham, C. W. (2004). Differential patterns of male and female mtDNA exchange across the Atlantic Ocean in the blue mussel, Mytilus edulis. Evolution, 58, 2438–2451.
Rousset, F. (2008). GENEPOP’007: A complete re- implementation of the GENEPOP software for Windows and Linux. Molecular Ecology Resources, 8, 103–106.
Roux, C., Fraïsse, C., Castric, V., Vekemans, X., Pogson, G. H., & Bierne, N. (2014). Can we continue to neglect genomic variation in introgression rates when inferring the history of speciation? A case study in a Mytilus hybrid zone. Journal of Evolutionary Biology, 27, 1662–1675.
Saarman, N. P., & Pogson, G. H. (2015). Introgression between invasive and native blue mussels (genus Mytilus) in the central California hybrid zone. Molecular Ecology, 24, 4723–4738.
Sarver, S. K., & Foltz, D. W. (1993). Genetic population structure of a species’ complex of blue mussels (Mytilus spp.). Marine Biology, 117, 105–112.
Sejr, M. K., Blicher, M. E., & Rysgaard, S. (2009). Sea ice cover affects inter- annual and geographic variation in growth of the Arctic cockle Clinocardium ciliatum (Bivalvia) in Greenland. Marine Ecology Progress Series, 389, 149–158.
Sirenko, B. I., & Gagaev, S. Y. (2007). Unusual abundance of macrobenthos and biological invasions in the Chukchi Sea. Russian Journal of Marine Biology, 33, 355–364.
Śmietanka, B., Burzyński, A., Hummel, H., & Wenne, R. (2014). Glacial his-tory of the European marine mussels Mytilus, inferred from distribution of mitochondrial DNA lineages. Heredity, 113, 250–258.
Somero, G. (2005). Linking biogeography to physiology: Evolutionary and acclimatory adjustments of thermal limits. Frontiers in Zoology, 2, 1.
Søndergaard, J., Asmund, G., Johansen, P., & Riget, F. (2011). Long- term response of an arctic fiord system to lead- zinc mining and subma-rine disposal of mine waste (Maarmorilik, West Greenland). Marine Environmental Research, 71, 331–341.
Strand, J., & Asmund, G. (2003). Tributyltin accumulation and effects in ma-rine molluscs from West Greenland. Environmental Pollution, 123, 31–37.
Strand, A. E., Williams, L. M., Oleksiak, M. F., & Sotka, E. E. (2012). Can di-versifying selection be distinguished from history in geographic clines? A population genomic study of killifish (Fundulus heteroclitus). PLoS One, 7, e45138.
Sukhotin, A. A., Strelkov, P. P., Maximovich, N. V., & Hummel, H. (2007). Growth and longevity of Mytilus edulis (L.) from northeast Europe. Marine Biology Research, 3, 155–167.
Sunday, J. M., Bates, A. E., & Dulvy, N. K. (2011). Global analysis of thermal tolerance and latitude in ectotherms. Proceedings of the Royal Society of London B: Biological Sciences, 278, 1823–1830.
Thyrring, J., Juhl, B. K., Holmstrup, M., Blicher, M. E., & Sejr, M. (2015). Does acute lead (Pb) contamination influence membrane fatty acid
composition and freeze tolerance in intertidal blue mussels in arctic Greenland? Ecotoxicology, 24, 2036–2042.
Thyrring, J., Rysgaard, S., Blicher, M. E., & Sejr, M. K. (2015). Metabolic cold adaptation and aerobic performance of blue mussels (Mytilus edulis) along a temperature gradient into the high arctic region. Marine Biology, 162, 235–243.
Toro, J., Innes, D. J., & Thompson, R. J. (2004). Genetic variation among life- history stages of mussels in a Mytilus edulis, M.trossulus hybrid zone. Marine Biology, 145, 713–725.
Toro, J. E., Thompson, R. J., & Innes, D. J. (2002). Reproductive isolation and reproductive output in two sympatric mussel species (Mytilus edulis, M. trossulus) and their hybrids from Newfoundland. Marine Biology, 141, 897–909.
Toro, J. E., Thompson, R. J., & Innes, D. J. (2006). Fertilization success and early survival in pure and hybrid larvae of Mytilus edulis (Linnaeus, 1758) and M. trossulus (Gould, 1850) from laboratory crosses. Aquaculture Research, 37, 1703–1708.
Tremblay, R., & Landry, T. (2016). The implication of metabolic performance of Mytilus edulis, Mytilus trossulus and hybrids for mussel aquaculture in eastern canadian waters. Journal of Marine Biology and Aquaculture, 2, 1–7.
Väinölä, R., & Strelkov, P. (2011). Mytilus trossulus in Northern Europe. Marine Biology, 158, 817–833.
Vermeij, G. J. (1991). Anatomy of an invasion: The trans- Arctic interchange. Paleobiology, 17, 281–307.
Waltari, E., & Hickerson, M. J. (2013). Late Pleistocene species distribu-tion modelling of North Atlantic intertidal invertebrates. Journal of Biogeography, 40, 249–260.
Wanamaker, A. D., Kreutz, K. J., Borns, H. W., Introne, D. S., Feindel, S., Funder, S., … Barber, B. J. (2007). Experimental determination of sa-linity, temperature, growth, and metabolic effects on shell isotope chemistry of Mytilus edulis collected from Maine and Greenland. Paleoceanography, 22, PA2217.
Ware, C., Berge, J., Sundet, J. H., Kirkpatrick, J. B., Coutts, A. D. M., Jelmert, A., … Alsos, I. G. (2014). Climate change, non- indigenous species and shipping: Assessing the risk of species introduction to a high- Arctic ar-chipelago. Diversity and Distributions, 20, 10–19.
Wassmann, P., Duarte, C. M., Agusti, S., & Sejr, M. K. (2011). Footprints of climate change in the Arctic marine ecosystem. Global Change Biology, 17, 1235–1249.
Wenne, R., Bach, L., Zbawicka, M., Strand, J., & McDonald, J. H. (2016). A first report on coexistence and hybridization of Mytilus trossulus and M. edulis mussels in Greenland. Polar Biology, 39, 343–355.
Westerbom, M., Kilpi, M., & Mustonen, O. (2002). Blue mussels, Mytilus edulis at the edge of the range: Population structure, growth and bio-mass along a salinity gradient in the north- eastern Baltic Sea. Marine Biology, 140, 991–999.
White, M. J. D. (1978). Modes of speciation. San Francisco, CA: W. H. Freeman.
Wisz, M. S., Broennimann, O., Grønkjær, P., Moller, P. R., Olsen, S. M., Swingedouw, D., … Pellissier, L. (2015). Arctic warming will promote Atlantic- Pacific fish interchange. Nature Climate Change, 5, 261–265.
Zbawicka, M., Drywa, A., Smietanka, B., & Wenne, R. (2012). Identification and validation of novel SNP markers in European populations of marine Mytilus mussels. Marine Biology, 159, 1347–1362.
Zbawicka, M., Sanko, T., Strand, J., & Wenne, R. (2014). New SNP markers reveal largely concordant clinal variation across the hybrid zone be-tween Mytilus spp. in the Baltic Sea. Aquatic Biology, 21, 25–36.
SUPPORTING INFORMATION
Additional Supporting Information may be found online in the supporting information tab for this article.
| 53Mathiesen et al.
APPENDIX 2 Structure analysis for the full data set.Results of Structure clustering analyses for the full data set with: (a) K = 3 and (b) K = 5. Samples are 1: QAS, 2: QAL, 3: UPE, 4: NUS, 5: NUL, 6: KOB, 7: ICE, 8: LOF, 9: TRS, 10: TRL, 11: SV1, 12: SV2, 13: SV3, 14: SV4, 15: PSW, 16: PSE, 17: WS1, 18: WS2, 19: MTR, and 20: MGA. For explanation of sample identification codes, see Table 1.
APPENDIX 1 He, Ho and allelic richness for the “Mytilus edulis” data set.Estimates of expected (He) and observed (Ho) heterozygosities and the allelic richness for the samples only including M. edulis.
Code He Ho Allelic richness
UPE 00.24 00.24 1.54
NUS 00.25 00.23 1.53
NUL 00.23 00.22 1.54
KOB 00.25 00.22 1.54
ICE 00.28 00.27 1.60
LOF 00.26 00.28 1.58
TRS 00.27 00.29 1.64
TRL 00.28 00.24 1.50
SV1 00.27 00.25 1.59
SV2 00.27 00.27 1.62
SV3 00.26 00.25 1.58
SV4 00.27 00.25 1.60
PSW 00.30 00.29 1.66
PSE 00.30 00.29 1.67
WS1 00.28 00.25 1.62
WS2 00.29 00.27 1.66

54 | Mathiesen et al.
APPENDIX 4 Structure analysis for the “Mytilus edulis” “neutral” data set.Results from clustering analysis (K = 2) for the “Mytilus edulis” data set only including SNPs not documented as outliers. Samples are 1: UPE, 2: NUU comprising of NUS and NUL, 3: KOB, 4: ICE, 5: LOF, 6: TRO comprising of TRS and TRL), 7: SVA comprising of SV1, SV2 and SV3, 8: SV4, 9: PSW, 10: PSE, 11: WS1, and 12: WS2. For explanation of sample identification codes, see Table 1.
APPENDIX 3 Confidence intervals95% confidence intervals for the inferred ancestry for simulated parentals and hybrids analyzed with Structure (K = 4). Ancestry estimates for the two inferred Mytilus edulis clusters (Greenland and Eastern Atlantic) are pooled. See text for explanation.
Simulated individuals Mytilus edulis Mytilus trossulus Mytilus galloprovincialis
Greenland
M. edulis 0.89–0.99 0.00–0.02 0.01–0.10
M. trossulus 0.00–0.01 0.99–1.00 0.00–0.01
M. edulis/ M. trossulus F1
0.34–0.54 0.44–0.56 0.01–0.10
M. edulis/ M. trossulus F2
0.36–0.59 0.39–0.60 0.01–0.09
M. edulis/M. trossulus backcross M. edulis 0.60–0.82 0.15–0.34 0.01–0.10
M. edulis/M. trossulus backcross M. trossulus 0.14–0.31 0.67–0.82 0.01–0.07
Eastern Atlantic
M. edulis 0.92–0.99 0.00–0.02 0.01–0.07
M. trossulus 0.00–0.01 0.99–1.00 0.00–0.01
M. galloprovincialis 0.01–0.02 0.00–0.01 0.97–0.99
M. edulis/M. trossulus F1 0.43–0.55 0.43–0.54 0.01–0.06
M. edulis/M. trossulus F2 0.38–0.60 0.37–0.59 0–01–0.09
M. edulis/M. trossulus backcross M. edulis 0.70–0.76 0.20–0.25 0.04–0.05
M. edulis/M. trossulus backcross M. trossulus 0.17–0.33 0.65–0.80 0.01–0.08
M. edulis/M. galloprovincialis F1 0.37–0.68 0.00–0.02 0.31–0.62
M. edulis/M. galloprovincialis F2 0.32–0.73 0.00–0.03 0.26–0.67
M. edulis/M. galloprovincialis backcross M. edulis 0.61–0.96 0.00–0.02 0.03–0.39
M. edulis/M. galloprovincialis backcross M. galloprovincialis
0.14–0.39 0.00–0.02 0.60–0.86

| 55Mathiesen et al.
APPENDIX 5 Structure analysis for the “Mytilus edulis” “outlier” data set.Results from clustering analysis (K = 2) for the “Mytilus edulis” data set only including the six outlier SNPs Samples are 1: UPE, 2: NUU comprising of NUS and NUL, 3: KOB, 4: ICE, 5: LOF, 6: TRO comprising of TRS and TRL), 7: SVA comprising of SV1, SV2, and SV3, 8: SV4, 9: PSW, 10: PSE, 11: WS1, and 12: WS2. For explanation of sample identification codes, see Table 1.