genetic dissection of a genomic region with pleiotropic ... · architecture1 (tga1) liberates the...
TRANSCRIPT
INVESTIGATION
Genetic Dissection of a Genomic Region withPleiotropic Effects on Domestication Traits in
Maize Reveals Multiple Linked QTLZachary H. Lemmon1 and John F. Doebley
Laboratory of Genetics, University of Wisconsin, Madison, Wisconsin 53706
ABSTRACT The domesticated crop maize and its wild progenitor, teosinte, have been used in numerous experiments to investigate thenature of divergent morphologies. This study examines a poorly understood region on the fifth chromosome of maize associated witha number of traits under selection during domestication, using a quantitative trait locus (QTL) mapping population specific to the fifthchromosome. In contrast with other major domestication loci in maize where large-effect, highly pleiotropic, single genes areresponsible for phenotypic effects, our study found the region on chromosome five fractionates into multiple-QTL regions, none withsingularly large effects. The smallest 1.5-LOD support interval for a QTL contained 54 genes, one of which was a MADS MIKCC
transcription factor, a family of proteins implicated in many developmental programs. We also used simulated trait data sets toinvestigate the power of our mapping population to identify QTL for which there is a single underlying causal gene. This analysisshowed that while QTL for traits controlled by single genes can be accurately mapped, our population design can detect no more than�4.5 QTL per trait even when there are 100 causal genes. Thus when a trait is controlled by $5 genes in the simulated data, thenumber of detected QTL can represent a simplification of the underlying causative factors. Our results show how a QTL region witheffects on several domestication traits may be due to multiple linked QTL of small effect as opposed to a single gene with large andpleiotropic effects.
IN evolutionary biology, quantitative trait locus (QTL) map-ping has been used with great success to define the genetic
architecture controlling morphological differences betweenspecies. These QTL mapping experiments have identifiedmany QTL with large effects in animal (White et al. 2012;Alem et al. 2013; Miller et al. 2014) and plant systems(Paterson et al. 1991; Xiong et al. 1999; Wills and Burke2007; Shannon 2012). Often these experiments identifyQTL clusters in a small number of genomic regions, suggestingan underlying genetic architecture of single pleiotropic genesor several closely linked genes (Cai and Morishima 2002; Penget al. 2003; Doebley 2004; Gyenis et al. 2007; Miller et al.2014). QTL effects have been successfully mapped to single
large-effect pleiotropic genes in many species (Frary et al.2000; Wang et al. 2005; Konishi et al. 2006; Li et al. 2006;Simons et al. 2006; Cong et al. 2008; Studer et al. 2011).However, these large-effect genes explain only a portion ofthe divergence between species, leaving a considerable amountof phenotypic differences unexplained.
Domesticated crop plants and maize in particular providea well-suited system in which to study the evolution of newmorphologies for a number of reasons. First, maize (Zeamays spp. mays) and its wild progenitor teosinte (Z. maysspp. parviglumis) differ for a suite of traits commonly seen indomesticated crop pairs. Collectively, these differences areknown as domestication syndrome and include reduced lat-eral branching, loss of natural seed dispersal, and gigantismof vegetative and reproductive tissues (Pickersgill 2007;Allaby et al. 2008). Second, intense artificial selection fordesirable agronomic traits leaves a signature of selection(reduced nucleotide diversity), allowing for identificationof putative targets of artificial selection in selective sweeps(Wright et al. 2005). Third, maize domestication took placein the last 10,000 years and surviving wild progenitor pop-ulations serve as reasonable surrogates for the ancestor
Copyright © 2014 by the Genetics Society of Americadoi: 10.1534/genetics.114.165845Manuscript received May 5, 2014; accepted for publication June 16, 2014; publishedEarly Online June 20, 2014.Supporting information is available online at http://www.genetics.org/lookup/suppl/doi:10.1534/genetics.114.165845/-/DC1.Phenotype and genotype data from this article have been deposited with the DryadDigital Repository: http://dx.doi.org/10.5061/dryad.7sq67.1Corresponding author: 1 Bungtown Road, Delbruck Building, Cold Spring HarborLaboratory, Cold Spring Harbor, NY 11724. E-mail: [email protected]
Genetics, Vol. 198, 345–353 September 2014 345

(Doebley et al. 2006). In addition, maize and teosinte areinterfertile, allowing for the use of genetic techniques andcrosses to dissect the genetic architecture underlying diver-gent traits (Doebley and Stec 1991; Briggs et al. 2007).Finally, researchers studying maize have the advantage ofa powerful tool in the reference maize genome sequence,providing the ability to anchor genetic markers to physicalpositions, annotate candidate genes, and characterize im-portant genomic features (Schnable et al. 2009).
Previous work in maize and its wild progenitor suggeststhe genes responsible for phenotypic change are scatteredthroughout the genome, but with several concentrations ofgenes (QTL) controlling large portions of the phenotypicdifferences (Doebley 2004; Shannon 2012). To date, threelarge-effect pleiotropic genes have been mapped to thesegenomic regions of large phenotypic importance. The shortarm of chromosome one is home to grassy tillers1 (gt1), whichinfluences tillering (Whipple et al. 2011) and is largely respon-sible for the concentration of seed into a single large ear (Willset al. 2013). The gene teosinte branched1 (tb1) is found on thelong arm of chromosome one and has a large pleiotropicimpact on plant and inflorescence branching (Doebley et al.1997; Studer et al. 2011). Finally, the gene teosinte glumearchitecture1 (tga1) liberates the kernel from its stony fruitcase in teosinte (Wang et al. 2005).
While early studies identified tb1 as the gene responsiblefor much of the phenotypic effect on the long arm of chro-mosome one (Clark et al. 2006), a more recent study hasidentified at least two additional loci upstream of tb1 withsignificant effects on phenotype (Studer and Doebley 2011).These loci influence the expression of tb1-like phenotypes inboth additive and epistatic ways. The nearest of these lociwas only 5 cM away from tb1 itself and also had an effectspecific to ear traits, leaving plant architecture traits such astillering unaffected. This suggests secondary factors to major-effect genes can be closely linked and can also mediate tissue-specific effects. Similarly, the work identifying gt1 also foundevidence of a secondary factor located downstream of theidentified causative region that slightly increases prolificacy(the number of ears) in plants carrying the teosinte allele(Wills et al. 2013).
One of the six genomic regions of large pleiotropic effectidentified in maize is on chromosome five where the geneticarchitecture underlying phenotypic effects is largely unknown(Doebley 2004). Previous work has found a number of do-mestication QTL on chromosome five for culm diameter, ker-nel row number, ear diameter, disarticulation, and pedicellatespikelet length (Doebley and Stec 1991; Doebley 2004; Briggset al. 2007). A more recent experiment confirms QTL for thesetraits on chromosome five, some of which (kernel row number,ear diameter, and disarticulation) had particularly large effectand LOD score (Shannon 2012). While these previous mappingexperiments found significant QTL for domestication traits onchromosome five, they could not determine whether this regioncontained a major QTL with pleiotropic effects on several traitsor multiple linked QTL.
In this article, we undertook a QTL mapping study tobetter characterize the effect of chromosome five on domes-tication traits. This experiment utilized a population of nearlyisogenic recombinant inbred lines (NIRILs) that allowed forconcentration of informative crossover events in the region ofinterest (chromosome five) and replicated block experimentsto improve trait estimates. Both of these characteristics in-crease the mapping power specifically on chromosome five incomparison with a standard F2 mapping population. Our studydetected QTL at multiple locations on the fifth chromosome,none of which have singularly large effect. This suggests thatunlike other regions of the maize genome with single large-effect genes (Wang et al. 2005; Studer et al. 2011; Wills et al.2013), chromosome five houses several linked factors influ-encing phenotype. We also performed a simulation study togauge the power and precision of our mapping population.This analysis indicates that for some traits the genetic archi-tecture could be more complex than observed with empiricaldata.
Materials and Methods
Plant material, genotypes, and phenotypes
We conducted a QTL mapping experiment to investigate thegenetic architecture of domestication traits on maize chro-mosome five, using a collection of NIRILs in the summers of2009 and 2010. The experimental population was built byintrogressing the majority of the short arm and part of thelong arm of chromosome five from a teosinte (Iltis andCochrane collection 81) into the maize inbred W22 by sixgenerations of backcrossing. RFLP markers (SupportingInformation, Table S1) were used during this process tofollow the desired genomic segment and eliminate teosintesegments at other known domestication QTL identified ina previous study (Doebley and Stec 1993). The extensivebackcrossing in tandem with tracking and eliminating teo-sinte segments from specific regions of the genome allowedthe experiment to be focused on the segregating teosinteintrogression on chromosome five. Five BC6 individuals het-erozygous for the target segment on chromosome five wereselfed to produce five BC6S1 families. The families were thenselfed for five additional generations to give an experimen-tal BC6S6 population of 259 highly homozygous NIRILs,which carried a collection of teosinte fifth-chromosome intro-gressions in an isogenic W22 background.
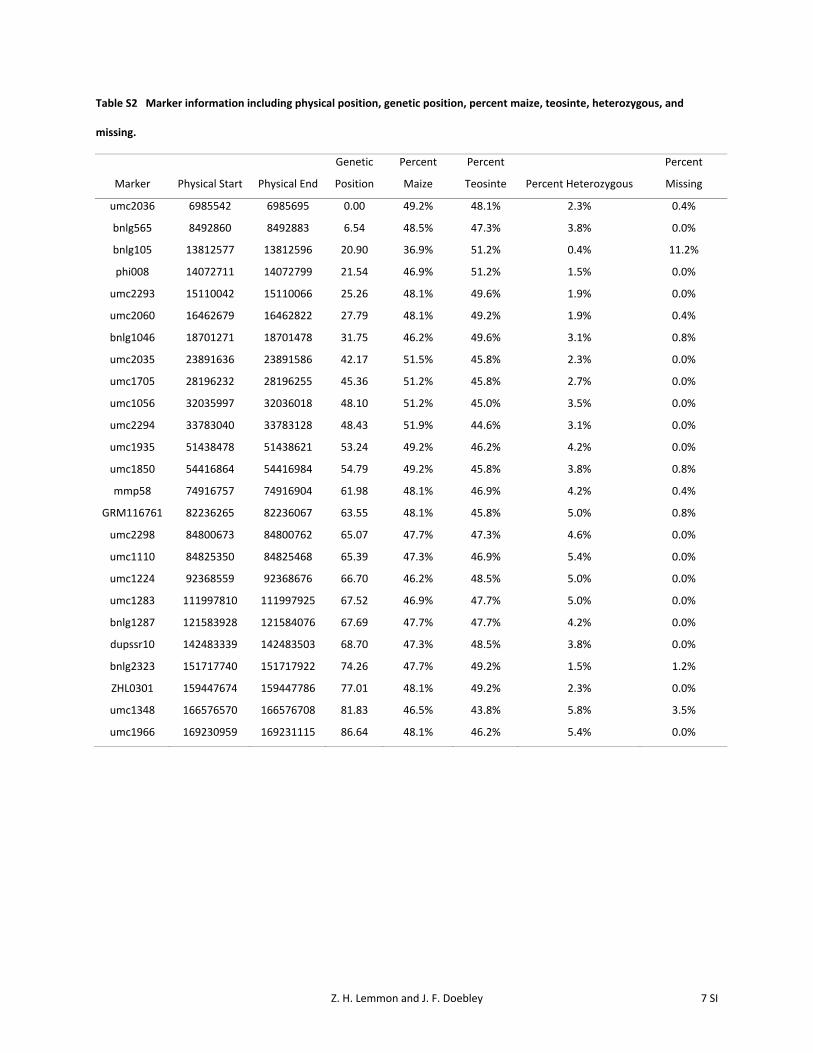
Genomic DNAwas extracted with a standard CTAB protocolfrom tissue collected from an average of 15 individuals fromeach NIRIL in the summer of 2009. A collection of 25 insertion/deletion and microsatellite markers (Table S2) was genotypedacross the fifth-chromosome introgression, using standard PCRand gel electrophoresis methods. In total, there were 443 ob-served recombination breakpoints among the NIRILs or �1.7events per line. The range of recombination breakpoints wentfrom 0 to 6 with the majority of lines (51.7%) having either0 or a single recombination event. The numbers of lines with
346 Z. H. Lemmon and J. F. Doebley

numbers of breakpoints in parentheses are as follows: 56(0 breakpoints), 78 (1 breakpoint), 49 (2 breakpoints), 48(3 breakpoints), 19 (4 breakpoints), 7 (5 breakpoints), and2 (6 breakpoints).
Phenotype data were collected for the experimental NIRILsin three replicated blocks, two in the summer of 2009and one in 2010, grown at the West Madison AgriculturalResearch Station in Madison, Wisconsin. Blocks consisted ofthe 259 NIRILs planted in randomized plots of 10 or 12plants each in 2009 and 2010, respectively. Five plants fromeach plot were assessed for 13 phenotypes (Table 1) repre-senting a number of plant and inflorescence phenotypic dif-ferences between teosinte and maize. Plant traits includedplant height, days to pollen shed, the amount of tillering,length of the primary lateral branch, prolificacy, and culmdiameter. Inflorescence traits measured in the female inflo-rescence (ear) were kernels per rank, kernel row number,ear diameter, ear length, and percentage of staminate spike-lets. Several traits from the male inflorescence or tassel werealso measured and include the pedicellate spikelet lengthand tassel branch number. Genotype and phenotype dataare available from the Dryad Digital Repository: http://dx.doi.org/10.5061/dryad.7sq67.
Mixed models and heritability
We estimated the NIRIL phenotype for all traits by fittinga linear mixed model. Fixed effects consisted of NIRIL,NIRIL family, and position within block, while block andyear were used as random effects. The following model wasfitted with the MIXED procedure in SAS (Littell et al. 1996)as an initial scope:
Yijklmno ¼ mþ aið fjÞ þ fj þ bk þ clðbkÞ þ dmðbkÞþ clðbkÞ : dmðbkÞ þ tn þ eijklmn þ gijklmno:
In this model, Yijklmno is the individual trait value, m is theoverall mean, fj is the family effect, aiðfjÞ is line nested infamily, bk is random block effect, clðbkÞ and dmðbkÞare hori-zontal and vertical positions in the field nested in block,
respectively, tn is the year, eijklmn is the experimental error(between plots), and finally gijklmno is within-plot samplingerror. Each model term was tested for significance on a trait-by-trait basis with t-tests for fixed effects and likelihood-ratio tests with 1 d.f. for random effects. Likelihood-ratioand t-tests with P-values .0.05 were deemed not significantand the corresponding terms were removed from the model.While the initial scope of the model included a randomblock and year effect, none of the random effects were foundto be significant. Following definition of appropriate modelsfor the studied traits (Table 2), least-squares means for eachtrait were calculated and used for QTL mapping.
Broad-sense heritabilities on a plot means basis (H2)were calculated for each of the traits. The variance compo-nents needed for this calculation were found using a linearmixed model with plot means as the dependent variable andplot and line as random independent variables. Variancecomponents for the line or genotypic component (s2
g), theplot (s2
p), and the residual variance due to environment (s2e)
were extracted and the following equation was used to cal-culate H2:
H2 ¼ s2g
s2g þ s2
e:
The plot variance (s2p) was calculated in the model as
a known source of variation in phenotype. Since this plotvariance is known, it does not contribute to unaccounted forenvironmental variation as seen by the residual variance(s2
e) and was not used to calculate heritability.
QTL mapping
We mapped QTL using a model-based approach in R/qtl(Broman et al. 2003; Broman and Sen 2009) with pheno-type, represented by least-squares means and 25 geneticmarkers for the NIRILs. The introgression on the fifth chro-mosome started as a heterozygous segment in the BC6 gen-eration and segregates as an S6 population. Consequently,we analyzed the population as a BC0S6 in R/qtl. Genotypes
Table 1 NIRIL phenotyped traits, descriptions, approximate distribution, between-year Pearson correlation coefficients,and Pearson P-values
Trait Description Distribution Pearson coefficient Pearson P-value
CULM Diameter of culm Normal 0.688 ,0.0001DTP Days to pollen shed Normal 0.668 ,0.0001EARD Ear diameter Bimodal 0.907 ,0.0001EARL Ear length Normal 0.409 ,0.0001KPR Kernels per rank Bimodal 0.698 ,0.0001KRN Kernel row no. Bimodal 0.718 ,0.0001LBLH Primary lateral branch length Normal 0.519 ,0.0001PLHT Plant height Normal 0.652 ,0.0001PROL Prolificacy, ears on lateral branch Exponential 0.422 ,0.0001SPLH Spikelet length Normal NA NASTAM % staminate spikelets Exponential 0.321 ,0.0001TBN Tassel branch no. Normal 0.691 ,0.0001TILL Tillering index Exponential 0.346 ,0.0001
NA, not applicable.
Maize Chromosome Five Houses Linked QTL 347

were first used to produce a genetic map for the teosintesegment introgression, using the Kosambi mapping func-tion (Kosambi 1944), with a 0.0001 genotyping error rateas implemented in R/qtl. Genetic marker order was initiallyfound by BLAST to the AGPv2 genome and confirmed usingthe ripple function in R/qtl with a 5-marker window. Sig-nificant LOD score thresholds were determined for eachtrait with a 5% cutoff based on 10,000 permutations ofthe data.
QTL models for each phenotype were determined byscanning for potential QTL, using the Haley–Knott regres-sion method and testing for QTL significance one by one.Definition of QTL models was accomplished by first scan-ning for QTL with the R/qtl function scanone to find aninitial QTL position with a LOD score greater than the 5%cutoff calculated by permutations. Next, we scanned for ad-ditional QTL, using the addqtl function. If this secondaryQTL scan detected a QTL that exceeded the 5% LOD scorecutoff defined by permutations, it was added to the modeland QTL positions were refined using the R/qtl functionrefineqtl. QTL were added to the model using this cycle of(1) scanning for additional QTL, (2) adding significant QTLto the model, and (3) refining QTL positions until no moresignificant QTL could be added. Once all significant QTLwere added, pairwise interactions between QTL were testedusing the addint function of R/qtl. Significant pairwise inter-actions (F-test, P , 0.05) were added to the model one byone until no more significant interactions were detected.After the model was finalized, each QTL in the final QTLmodel was tested for significance with drop-one ANOVAanalysis.
Simulation experiment
To explore the theoretical maximum number of detectableQTL possible in this study, we used a custom R script (FileS1) to map QTL in simulated trait data sets where causativegenes were randomly chosen from the genes in the teosinteintrogressed region. Simulated traits were made for 1–15causative genes, then 20–50 genes by 5’s, and then 75 and100 causative genes for a total of 24 different causative geneset sizes. The 25 genotyped markers in our 259 NIRILs were
used to assign genotype probabilities to the 2576 total genesin the introgressed segment of chromosome five based onthe genotype of flanking markers. These genotype probabil-ities were assigned based on physical proximity to the twoflanking markers, assuming physical distance was propor-tional to genetic distance so that a gene closely linked toa given marker had a high probability of sharing that markergenotype. When consecutive markers had identical geno-types, this method resulted in all genes between themmatching the flanking genotypes.
Phenotypic trait values are based on both the underlyinggenetic contributions of genes and random environmentalnoise, which together define the heritability of a trait. Thegenetic values in the simulated data were set as follows.For each simulated data set, the randomly chosen caus-ative genes were assigned a genotype based on the pre-viously derived genotype probabilities and two effect types:equal and random gamma distributed (a = 1.36 and b = 1)(Orr 1998). The effect types for each gene were givena positive, zero, or negative value, depending on whetherthe assigned genotype was homozygous maize, hetero-zygous, or homozygous teosinte, respectively. Thus, eachsimulated causative gene had two numeric values (one forequal and one for gamma-distributed effects) represent-ing the magnitude and direction of effect on the trait. Thetotal genetic contribution to NIRIL phenotype was thenfound by simply summing the gene values (equal andgamma effects kept separate) for all simulated causativegenes.
Environmental noise was added to the summed NIRILgenetic phenotype values by taking random draws froma normal distribution with variance equal to the additionalvariance needed to reach the desired level of heritability.Two levels of heritability were simulated (67% and 90%) tomimic the heritabilities of two actual traits, the moderatelyheritable culm diameter and highly heritable ear diameter.Heritability of the simulated traits was required to be within2.5% of the desired heritability; otherwise the normaldistribution was resampled. This process resulted in eachset of simulated causative genes having four states for theNIRILs: equal effect 67% H2, equal effect 90% H2, gammaeffect 67% H2, and gamma effect 90% H2.
We simulated 24 causative gene set sizes with twoeffect types and two heritabilities for a total of 96 distinctsimulated states. Each of these states was replicated 1000times, resulting in 96,000 simulated sets of phenotypesfor the 259 NIRILs. These phenotype values were thenused with actual NIRIL genotypes to map QTL in theR/qtl software, using the same method as described inthe previous section. Pairwise QTL interactions were nottested for in the simulated data sets because interactionswere not part of the simulated conditions. Mapping ofQTL for thousands of simulated traits could not beaccomplished manually and consequently was done witha custom R script (File S1) that automated the additionof QTL and saved summary information, including QTL
Table 2 Final models selected for the 13 NIRIL phenotypes
Trait Model
CULM Line(family) + family + x(plot) + y(plot)DTP Line(family) + family + x(plot) + y(plot) + x:y(plot)EARD Line(family) + family + x(plot) + y(plot) + x:y(plot)EARL Line(family) + family + x(plot) + y(plot) + x:y(plot)KPR Line(family) + family + x(plot) + y(plot) + x:y(plot)KRN Line(family) + family + x(plot)LBLH Line(family) + family + x(plot) + y(plot) + x:y(plot)PLHT Line(family) + family + x(plot) + y(plot)PROL Line(family) + family + x(plot)SPLH Line(family) + family + xSTAM Line(family) + family + x(plot) + y(plot) + x:y(plot)TBN Line(family) + family + x(plot) + y(plot) + x:y(plot)TILL Line(family) + family + y(plot)
348 Z. H. Lemmon and J. F. Doebley

estimated effect, QTL position, LOD scores, and numberof QTL.
Results
QTL mapping
Previous work has shown chromosome five to be home toseveral high-LOD score and large-effect size QTL for anumber of inflorescence and plant architecture domestica-tion traits (Doebley 2004; Shannon 2012). We undertooka high-resolution mapping experiment with a population ofNIRILs with fifth-chromosome teosinte introgressions ina primarily W22 maize inbred background. In the summersof 2009 and 2010, the 259 NIRILs were grown in random-ized plots arranged in three replicated blocks. Phenotypedata for 13 traits were collected for five plants per plot.Spikelet length was collected only for a single block in thesummer of 2010. We analyzed trait measurements from allthree growth environments together in a single linear mixedmodel with block and year as random effects and position,NIRIL, and family as fixed explanatory variables. Least-squares means were estimated from the mixed models andlater used for QTL mapping.
Least-squares mean histogram plots show several distribu-tion types, including normal, bimodal, and exponential (FigureS1). NIRILs genotyped as 100% maize (29 lines) and 100%teosinte (27 lines) were used to determine whether traits be-haved as expected, with the full teosinte introgression lineshaving more teosinte-like phenotypes. Several traits believedto not be primary targets of selection during domesticationsuch as days to pollen shed and plant height appear to havelittle or no overall difference between NIRILs containing themaize and teosinte introgression, while traits that were theprimary focus of selection during domestication including ker-nel row number (KRN) and ear diameter (EARD) have a sub-stantial phenotypic difference between homozygous maize andteosinte NIRILs. For all domestication traits, we observed a dif-ference (sometimes quite small) between the least-squaresmeans for maize and teosinte NIRILs, consistent with theexpected effect of domestication. Particularly large differencesare seen for EARD and KRN traits, where the maize genotypeis 17.3% and 14.8% larger than the teosinte genotype, respec-tively. Also of interest is the diameter of culm (CULM) trait,where the maize genotype was 6.5% larger than teosinte.
There was a balanced representation of maize and teosintegenotypes with a high degree of homozygosity in the QTLmapping population. Overall genotypes of the NIRILs were48.3% maize, 48.2% teosinte, and 3.5% heterozygous. TheNIRIL population included lines with teosinte introgressionsacross 162.24 Mbp, from position 6,985,619 to 169,231,037on the maize reference genome (AGPv2). This introgressionincludes 74.47% of the �218-Mbp fifth chromosome. Of the4503 fifth-chromosome genes in the Filtered Gene Set (ver-sion 5b), 411 genes on the tip of the small arm and 1516genes on the long arm were not included in the teosinte
introgressions used in this study. The genetic map generatedin R/qtl was calculated to be 86.64 cM, giving an averagemegabase pair to centimorgan ratio of 1.873 Mbp/cM.
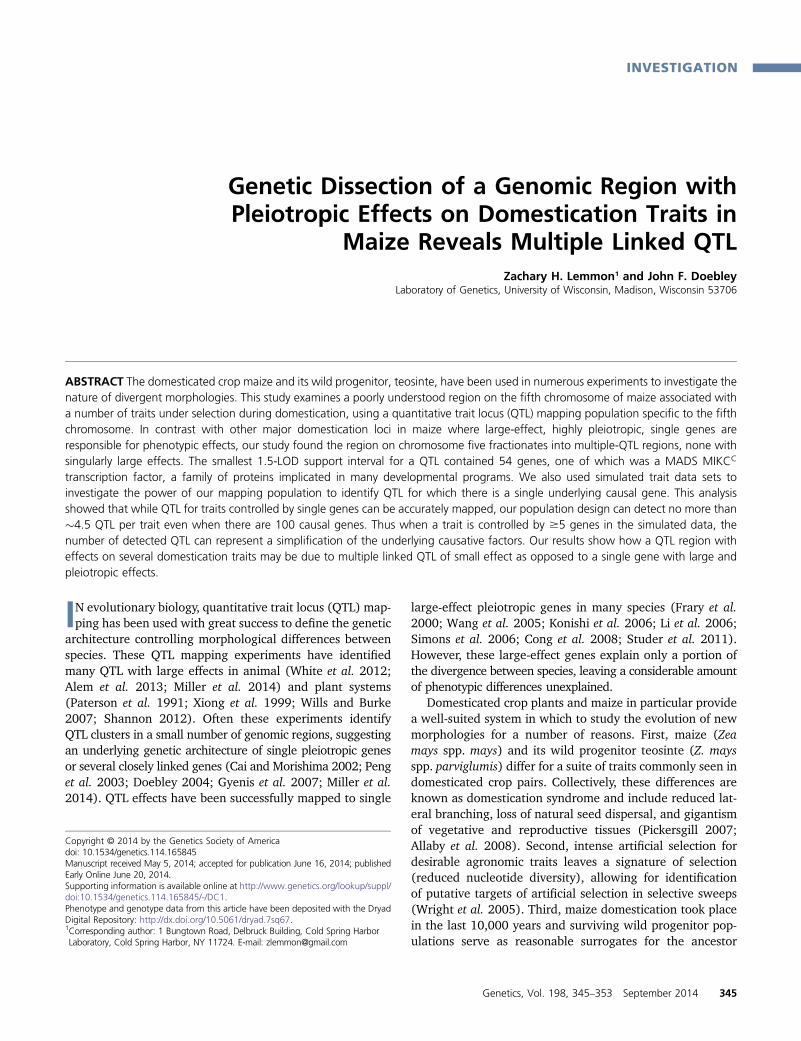
We analyzed 13 traits and identified 24 QTL (Figure 1,Table 3) with a broad range of LOD scores ranging from2.70 [kernels per rank (KPR)] to 47.22 (KRN). A singleepistatic interaction was detected between the two kernelrow number QTL, suggesting epistasis is minimal. QTL 1.5-LOD support intervals ranged from 2.3 cM (KRN) to 50.6 cM(KPR) with an average value of �12.5 cM. Heritability ona plot mean basis (Table 3) for each trait varied with anaverage H2 of 63% and range of 23% [prolificacy, ears onlateral branch (PROL)] to 90% (EARD). Five QTL clusters,defined as contiguous regions with five or more QTL 1.5-LOD support intervals, were found in the mapping region onchromosome five near 2, 51, 61, 70, and 84 cM (Figure 1).There is no clear single concentration of QTL, suggestingthis genomic region lacks a single gene of large, pleiotropiceffect and that multiple linked factors spread across the fifthchromosome are responsible for the previously identifiedinfluence of chromosome five on domestication traits.
Simulation experiment
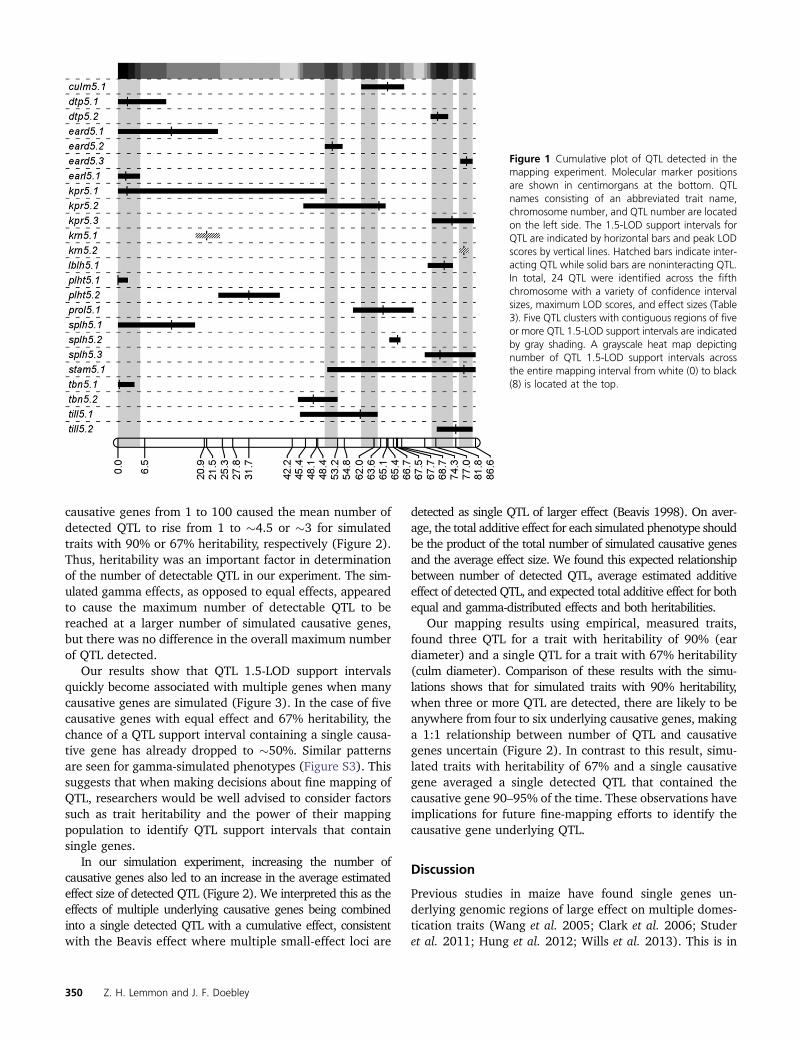
We performed a simulation experiment to determine thepower and precision of our mapping population. Usingcausative genes projected onto actual NIRIL genotypes,a total of 96 distinct simulated states in terms of numberof genes (between 1 and 100), heritability (67% and 90%),and effect type (equal and gamma) were replicated 1000times for a grand total of 96,000 simulated NIRIL trait datasets. Histograms of simulated traits with 90% heritabilitywere clearly bimodal when one causative gene was simu-lated and progressively moved toward a normal distributionas more and more causative genes were simulated. In compar-ison, simulated traits with 67% heritability lack a clear bimodaldistribution even when only a single causative gene wassimulated and are approximately normal when 100 genes aresimulated (Figure S2).
Since calculating significant LOD score thresholds viapermutations for all 96,000 simulated trait data sets wouldhave taken weeks of computation time, we first calculated LODscore cutoffs in the first 50 replicates of the 96 states. Theaverage cutoff was lower for 90% heritability than for 67%heritability with no clear difference in threshold caused by theeffect type of causative genes. Simulated phenotypes with fewcausative genes had a lower threshold on average with thiseffect more pronounced for the gamma-distributed effect type.The range of LOD score thresholds determined was quitenarrow (2.37–2.59 for gamma-distributed and 2.38–2.60 forequal effects). Consequently, we chose the maximum of the 5%cutoffs found in the first 50 replicates of each of the 96 statesas a conservative cutoff for mapping all simulated traits.
After simulated phenotypes were generated and signifi-cance thresholds were set, QTL were mapped using the96,000 simulated data sets with actual genotypes for theNIRILs in this study. Increasing the number of simulated
Maize Chromosome Five Houses Linked QTL 349
causative genes from 1 to 100 caused the mean number ofdetected QTL to rise from 1 to �4.5 or �3 for simulatedtraits with 90% or 67% heritability, respectively (Figure 2).Thus, heritability was an important factor in determinationof the number of detectable QTL in our experiment. The sim-ulated gamma effects, as opposed to equal effects, appearedto cause the maximum number of detectable QTL to bereached at a larger number of simulated causative genes,but there was no difference in the overall maximum numberof QTL detected.
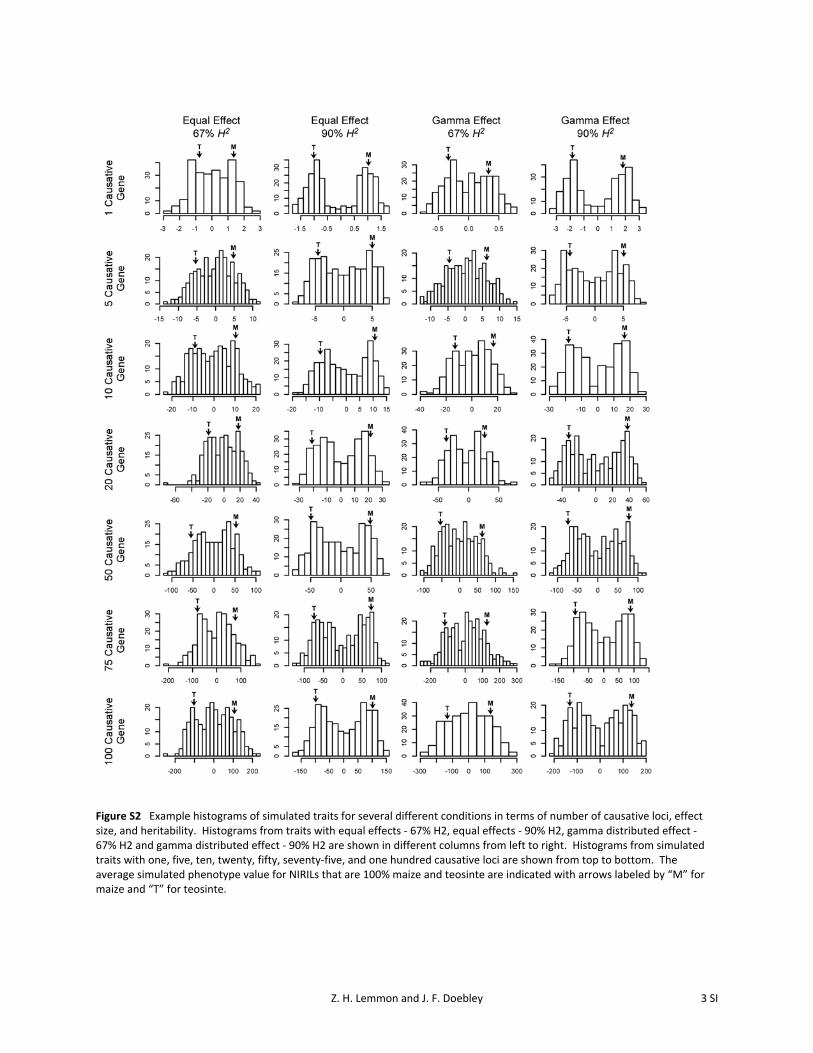
Our results show that QTL 1.5-LOD support intervalsquickly become associated with multiple genes when manycausative genes are simulated (Figure 3). In the case of fivecausative genes with equal effect and 67% heritability, thechance of a QTL support interval containing a single causa-tive gene has already dropped to �50%. Similar patternsare seen for gamma-simulated phenotypes (Figure S3). Thissuggests that when making decisions about fine mapping ofQTL, researchers would be well advised to consider factorssuch as trait heritability and the power of their mappingpopulation to identify QTL support intervals that containsingle genes.
In our simulation experiment, increasing the number ofcausative genes also led to an increase in the average estimatedeffect size of detected QTL (Figure 2). We interpreted this as theeffects of multiple underlying causative genes being combinedinto a single detected QTL with a cumulative effect, consistentwith the Beavis effect where multiple small-effect loci are
detected as single QTL of larger effect (Beavis 1998). On aver-age, the total additive effect for each simulated phenotype shouldbe the product of the total number of simulated causative genesand the average effect size. We found this expected relationshipbetween number of detected QTL, average estimated additiveeffect of detected QTL, and expected total additive effect for bothequal and gamma-distributed effects and both heritabilities.
Our mapping results using empirical, measured traits,found three QTL for a trait with heritability of 90% (eardiameter) and a single QTL for a trait with 67% heritability(culm diameter). Comparison of these results with the simu-lations shows that for simulated traits with 90% heritability,when three or more QTL are detected, there are likely to beanywhere from four to six underlying causative genes, makinga 1:1 relationship between number of QTL and causativegenes uncertain (Figure 2). In contrast to this result, simu-lated traits with heritability of 67% and a single causativegene averaged a single detected QTL that contained thecausative gene 90–95% of the time. These observations haveimplications for future fine-mapping efforts to identify thecausative gene underlying QTL.
Discussion
Previous studies in maize have found single genes un-derlying genomic regions of large effect on multiple domes-tication traits (Wang et al. 2005; Clark et al. 2006; Studeret al. 2011; Hung et al. 2012; Wills et al. 2013). This is in
Figure 1 Cumulative plot of QTL detected in themapping experiment. Molecular marker positionsare shown in centimorgans at the bottom. QTLnames consisting of an abbreviated trait name,chromosome number, and QTL number are locatedon the left side. The 1.5-LOD support intervals forQTL are indicated by horizontal bars and peak LODscores by vertical lines. Hatched bars indicate inter-acting QTL while solid bars are noninteracting QTL.In total, 24 QTL were identified across the fifthchromosome with a variety of confidence intervalsizes, maximum LOD scores, and effect sizes (Table3). Five QTL clusters with contiguous regions of fiveor more QTL 1.5-LOD support intervals are indicatedby gray shading. A grayscale heat map depictingnumber of QTL 1.5-LOD support intervals acrossthe entire mapping interval from white (0) to black(8) is located at the top.
350 Z. H. Lemmon and J. F. Doebley

stark contrast to our work on chromosome five, where thepreviously observed large effect of chromosome five on sev-eral domestication traits in maize (Doebley 2004; Shannon2012) is caused by multiple regions spread across the chro-mosome. This suggests the nature of genetic factors controllingdomestication traits on chromosome five of maize is differentfrom that of other large domestication loci in maize. Whetherthe situation of chromosome five in maize is unique in maizeor crop plants is yet to be seen, but several loci identified inthis study suggest that in addition to effectively acting onhighly pleiotropic, large-effect single genes, the domesticationprocess also has the capacity to work on several linked genesof variable effect to produce a chromosomal region of largeQTL effect.
Although our results show that several regions on chro-mosome five contain QTL affecting different traits, thischromosomal region was initially defined as several tightlyclustered QTL in F2 crosses between teosinte and a small-eared primitive Mexican landrace (Doebley and Stec 1993).In contrast, our NIRIL population was developed from a crossof teosinte by a modern agronomic maize inbred and isexpected to harbor domestication QTL as well as improve-
ment QTL selected on during the past 9000 years sincemaize was domesticated. Thus, while results from this anal-ysis suggest chromosome five houses a complex made ofmultiple linked factors, we cannot discount the possibilitythat a simpler genetic architecture would have been ob-served had we used a primitive maize landrace rather thanthe W22 maize inbred line.
One potential use of QTL mapping results is interrogationof the genes within QTL for likely candidates. The markerdensity in our experiment leads to most QTL 1.5-LODsupport intervals containing hundreds of annotated genes.However, two QTL had a narrow confidence interval forwhich a relatively small number of genes fall within the 1.5-LOD support interval. These two QTL were krn5.2 andeard5.3, which colocalize to the same �2.3-cM region.When expanded to the nearest genetic markers, these QTLsupport intervals fell between umc1348 and um1966, whichspan a 4.81-cM region (2.654 Mbp) with 54 genes from themaize Filtered Gene Set (AGPv2). One interesting candidatethat falls in this range is AC212823.4_FG003, which enco-des a MADS box transcription factor previously cataloged asMADS-transcription factor 65 (mads65) in the GRASSIUStranscription factor database (Yilmaz et al. 2009). Initiallyidentified in plants as important floral organ identity regu-lators (Schwarz-Sommer et al. 1990; Yanofsky et al. 1990),the MADS-box family of transcription factors has since beenshown to be involved in a wide variety of developmentalprograms in various organs and stages of plant development(Smaczniak et al. 2012). This particular MADS-box gene hashigh sequence similarity to the rice gene OsMADS57, a typeII MIKCC MADS gene. The large subclass of MIKCC MADSgenes is quite diverse with members involved in floral spec-ification, phase transition, and root development amongother developmental functions (Smaczniak et al. 2012). Thisgene was also found to be selected during crop improvementby a recent study (Hufford et al. 2012) and has fairly highexpression in many tissues as described in the maize geneexpression atlas (Sekhon et al. 2011). All of these factorsmake AC212823.4_FG003 an attractive candidate in futurestudies to fine map the causative gene for kernel row num-ber and ear diameter on chromosome five.
The limits of a QTL experiment in terms of power andresolution are important factors to consider when under-taking an experiment in any mapping population. To informour QTL results with empirically measured traits, we exploredthe computational limits of the experimental mappingpopulation, using simulated-trait data sets. In this exper-iment, we never detected more than eight QTL for any ofthe simulated conditions with heritability being the mostimportant characteristic in determining number of detectedQTL. As expected, when the number of underlying causa-tive genes increased to a high level, we saw the effect ofmultiple causative genes being rolled into single detectedQTL, consistent with the Beavis effect (Beavis 1998). Ifthese polygenic QTL, which can have quite high LOD scoreand effect size, were chosen for fine mapping, we would be
Table 3 Detected QTL for the T5S mapping population with LODscore, position, and heritability
QTL LOD 1.5-LOD SI Peak location % variation % H2
culm5.1 13.5 58.9–69.3 65.3 21.30 66.50dtp5.1 16.36 0.0–11.7 2.3 20.10 —
dtp5.2 18.76 75.7–80.0 77.4 23.60 —
dtp_model 28.93 — — 40.10 67.30eard5.1 3 0.0–24.2 12.9 1.70 —
eard5.2 17.99 50.1–54.4 51.9 11.70 —
eard5.3 33.76 82.9–85.9 84.4 25.60 —
eard_model 65.62 — — 69.00 90.00earl5.1 12.38 0.0–5.4 1.9 19.70 49.10kpr5.1 2.7 0.0–50.6 2.2 3.00 —
kpr5.2 6.8 44.9–64.8 63.2 7.90 —
kpr5.3 4.11 76.0–86.2 80.9 4.60 —
kpr_model 27.41 — — 38.50 72.70krn5.1 6.22 18.8–24.7 21.5 4.80 —
krn5.2 47.22 82.6–84.9 83.8 53.40 —
krn5.1:2 3.32 — — 2.50 —
krn_model 50.56 — — 59.20 73.70lblh5.1 24.61 75.0–81.1 79 35.30 53.50plht5.1 7.64 0.0–2.4 0 11.30 —
plht5.2 2.89 24.3–39.2 31.7 4.10 —
plht_model 14.06 — — 22.00 63.10prol5.1 8.38 56.9–71.6 64.2 13.80 22.90splh5.1 9.14 0.0–18.7 13 10.20 —
splh5.2 7.16 65.7–68.4 67.7 7.90 —
splh5.3 2.78 74.3–86.6 78 2.90 —
splh_model 30.6 — — 41.80 88.30stam5.1 6.5 50.7–86.6 83.8 10.90 25.90tbn5.1 8.28 0.0–4.0 0.3 13.10 —
tbn5.2 4.6 43.6–53.2 47.3 7.10 —
tbn_model 10.46 — — 16.90 69.90till5.1 7.21 44.1–62.9 58.7 9.80 —
till5.2 3.22 77.2–85.9 81.8 4.20 —
till_model 18.61 — — 28.10 34.30
SI, support interval.
Maize Chromosome Five Houses Linked QTL 351

unlikely to find a single underlying causative polymorphism.Consequently, when considering QTL for fine-mapping pur-poses, researchers would be well advised to choose QTLfrom mapping populations with sufficient power to defineQTL containing single causative genes. It is important torealize that the simulation results reflect the specific markers,genotypes, and mapping population used in this study.While some results are likely generally applicable to otherQTL experiments, simulations using mapping population-specific parameters will provide the best insight into poten-tial genetic architectures and information on populationpower and precision.
QTL mapping has been used to great effect to characterizethe genomic regions controlling traits selected on duringdomestication in maize. These studies have shown that whilegenetic factors controlling domestication traits are spreadthroughout the genome, there are concentrated genomicregions where QTL for several domestication traits are in closeproximity to each other (Doebley 2004; Shannon 2012). In thisstudy, we use a QTL mapping population of NIRILs with teo-sinte introgressions specific to chromosome five to closely ex-amine previously mapped QTL for a number of domesticationtraits. We confirmed QTL for these traits exist on chromosome
five; however, in our population these QTL further fractionateinto multiple QTL. This is in contrast to other genomic regionsof large effect in maize where single pleiotropic genes wereidentified as the causative factor underlying genomic regionsof large effect (Wang et al. 2005; Studer et al. 2011; Hung et al.2012; Wills et al. 2013). The presence of multiple QTL inseveral locations on chromosome five suggests the existenceof a linked complex of multiple genes controlling variousaspects of domestication traits. This apparent complexityof the chromosome five locus is consistent with results fromour simulation experiment, where we show that traits withmultiple mapped QTL likely have a more complicated un-derlying genetic architecture than is indicated by the initialQTL mapping results.
Acknowledgments
We thank Bret Payseur for helpful discussion and suggestions onthe simulation work. This work was supported by the NationalScience Foundation, grants IOS1025869, IOS0820619, andIOS1238014.
Literature Cited
Alem, S., R. Streiff, B. Courtois, S. Zenboudji, D. Limousin et al.,2013 Genetic architecture of sensory exploitation: QTL map-ping of female and male receiver traits in an acoustic moth. J.Evol. Biol. 26: 2581–2596.
Allaby, R. G., D. Q. Fuller, and T. A. Brown, 2008 The geneticexpectations of a protracted model for the origins of domesti-cated crops. Proc. Natl. Acad. Sci. USA 105: 13982–13986.
Figure 3 The proportion of detected QTL with zero, one, or more thanone simulated causative genes in the 1.5-LOD support interval. Highnumbers of causative genes lead to detected QTL that contain multiplecausative genes. There is a reasonable percentage of detected QTL in thesimulations that contain a single causative gene when few (less than four)causative genes are simulated, but as the number of simulated causativegenes increases we quickly lose the power to distinguish between closelylinked causative genes and they become lumped into single detectedQTL. Equal-effect simulations shown here are very similar to those seenfor the gamma-distributed effects (Figure S3).Figure 2 The number of detected QTL and mean detected QTL effect size
vs. number of simulated causative loci. Black lines indicate 95% confidenceintervals. (A) Simulations consistently detect one QTL when a single caus-ative gene is simulated, but when as few as three or four causative genesare simulated, we lose the ability to distinguish between genes. With highnumbers of simulated causative genes, total QTL detected reach a ceiling of�4.5 QTL for simulated traits with 90% heritability and �3.0 for traits with67% heritability. (B) The effects of unresolved genes are merged into thefew large-effect QTL that are detected, consistent with the Beavis effect.This is seen in the negative correlation between mean estimated effect andnumber of causative genes.
352 Z. H. Lemmon and J. F. Doebley

Beavis, W. D., 1998 QTL analyses: power, precision, and accuracy,pp. 145–162 in Molecular Dissection of Complex Traits, edited byA. H. Paterson. CRC Press, New York.
Briggs, W. H., M. D. McMullen, J. F. Doebley, and B. S. Gaut,2007 Linkage mapping of domestication loci in a large maizeteosinte backcross resource. Genetics 177: 1915–1928.
Broman, K. W., and S. Sen, 2009 A Guide to QTL Mapping withR/qtl. Springer-Verlag, New York.
Broman, K. W., H. Wu, S. Sen, and G. Churchill, 2003 R/qtl: QTLmapping in experimental crosses. Bioinformatics 19: 889–890.
Cai, W., and H. Morishima, 2002 QTL clusters reflect characterassociations in wild and cultivated rice. Theor. Appl. Genet. 104:1217–1228.
Clark, R. M., T. Nussbaum-Wagler, P. Quijada, and J. Doebley,2006 A distant upstream enhancer at the maize domesticationgene tb1 has pleiotropic effects on plant and inflorescent archi-tecture. Nat. Genet. 38: 594–597.
Cong, B., L. S. Barrero, and S. D. Tanksley, 2008 Regulatory changein YABBY-like transcription factor led to evolution of extreme fruitsize during tomato domestication. Nat. Genet. 40: 800–804.
Doebley, J. F., 2004 The genetics of maize evolution. Annu. Rev.Genet. 38: 37–59.
Doebley, J. F., and A. Stec, 1991 Genetic analysis of the morphologicaldifferences between maize and teosinte. Genetics 129: 285–295.
Doebley, J. F., and A. Stec, 1993 Inheritance of the morphologicaldifferences between maize and teosinte: comparison of resultsfor two F2 populations. Genetics 134: 559–570.
Doebley, J. F., A. Stec, and L. Hubbard, 1997 The evolution ofapical dominance in maize. Nature 386: 485–488.
Doebley, J. F., B. S. Gaut, and B. D. Smith, 2006 The moleculargenetics of crop domestication. Cell 127: 1309–1321.
Frary, A., T. C. Nesbitt, S. Grandillo, E. Knaap, B. Cong et al.,2000 fw2.2: a quantitative trait locus key to the evolution oftomato fruit size. Science 289: 85–88.
Gyenis, L., S. J. Yun, K. P. Smith, B. J. Steffenson, E. Bossolini et al.,2007 Genetic architecture of quantitative trait loci associatedwith morphological and agronomic trait differences in a wild bycultivated barley cross. Genome 50: 714–723.
Hufford, M. B., X. Xu, J. van Heerwaarden, T. Pyhäjärvi, J.-M. Chiaet al., 2012 Comparative population genomics of maize do-mestication and improvement. Nat. Genet. 44: 808–811.
Hung, H.-Y., L. M. Shannon, F. Tian, P. J. Bradbury, C. Chen et al.,2012 ZmCCT and the genetic basis of day-length adaptationunderlying the postdomestication spread of maize. Proc. Natl.Acad. Sci. USA 109: E1913–E1921.
Konishi, S., T. Izawa, S. Y. Lin, K. Ebana, Y. Fukuta et al., 2006 AnSNP caused loss of seed shattering during rice domestication.Science 312: 1392–1396.
Kosambi, D. D., 1944 The estimation of map distances from re-combination values. Ann. Eugen. 12: 172–175.
Li, C., A. Zhou, and T. Sang, 2006 Rice domestication by reducingshattering. Science 311: 1936–1939.
Littell, R., G. Milliken, W. Stroup, and R. Wolfinger, 1996 SASSystem for Mixed Models. SAS Institute, Cary, NC.
Miller, C. T., A. M. Glazer, B. R. Summers, B. K. Blackman, A. R.Norman et al., 2014 Modular skeletal evolution in sticklebacksis controlled by additive and clustered quantitative trait loci.Genetics 197: 405–420.
Orr, H. A., 1998 The population genetics of adaptation: the distribu-tion of factors fixed during adaptive evolution. Evolution 52: 935.
Paterson, A. H., S. Damon, J. D. Hewitt, D. Zamir, H. D. Rabinowitchet al., 1991 Mendelian factors underlying quantitative traits in
tomato: comparison across species, generations, and environ-ments. Genetics 127: 181–197.
Peng, J., Y. Ronin, T. Fahima, M. S. Röder, Y. Li et al., 2003 Do-mestication quantitative trait loci in Triticum dicoccoides, the pro-genitor of wheat. Proc. Natl. Acad. Sci. USA 100: 2489–2494.
Pickersgill, B., 2007 Domestication of plants in the Americas: in-sights from Mendelian and molecular genetics. Ann. Bot. 100:925–940.
Schnable, P. S., D. Ware, R. S. Fulton, J. C. Stein, F. Wei et al.,2009 The B73 maize genome: complexity, diversity, and dy-namics. Science 326: 1112–1115.
Schwarz-Sommer, Z., P. Huijser, W. Nacken, H. Saedler, and H.Sommer, 1990 Genetic control of flower development by ho-meotic genes in Antirrhinum majus. Science 250: 931–936.
Sekhon, R. S., H. Lin, K. L. Childs, C. N. Hansey, C. Robin Buellet al., 2011 Genome-wide atlas of transcription through maizedevelopment. Plant J. 66: 553–563.
Shannon, L. M., 2012 The genetic architecture of maize domesti-cation and range expansion. Ph.D. Dissertation, University ofWisconsin, Madison, WI.
Simons, K. J., J. P. Fellers, H. N. Trick, Z. Zhang, Y.-S. Tai et al.,2006 Molecular characterization of the major wheat domesti-cation gene Q. Genetics 172: 547–555.
Smaczniak, C., R. G. H. Immink, G. C. Angenent, and K. Kaufmann,2012 Developmental and evolutionary diversity of plant MADS-domain factors: insights from recent studies. Development 139:3081–3098.
Studer, A. J., and J. F. Doebley, 2011 Do large effect QTL frac-tionate? A case study at the maize domestication QTL teosintebranched1. Genetics 188: 673–681.
Studer, A. J., Q. Zhao, J. Ross-Ibarra, and J. F. Doebley,2011 Identification of a functional transposon insertion inthe maize domestication gene tb1. Nat. Genet. 43: 1160–1163.
Wang, H., T. Nussbaum-Wagler, B. Li, Q. Zhao, Y. Vigouroux et al.,2005 Theorigin of thenakedgrains ofmaize.Nature 436: 714–719.
Whipple, C. J., T. H. Kebrom, A. L. Weber, F. Yang, D. Hall et al.,2011 Grassy Tillers1 promotes apical dominance in maize andresponds to shade signals in the grasses. Proc. Natl. Acad. Sci.USA 108: E506–E512.
White, M. A., M. Stubbings, B. L. Dumont, and B. A. Payseur,2012 Genetics and evolution of hybrid male sterility in housemice. Genetics 191: 917–934.
Wills, D. M., and J. M. Burke, 2007 Quantitative trait locus analysisof the early domestication of sunflower. Genetics 176: 2589–2599.
Wills, D. M., C. J. Whipple, S. Takuno, L. E. Kursel, L. M. Shannonet al., 2013 From many, one: genetic control of prolificacyduring maize domestication. PLoS Genet. 9: e1003604.
Wright, S. I., I. V. Bi, S. G. Schroeder, M. Yamasaki, J. F. Doebleyet al., 2005 The effects of artificial selection on the maizegenome. Science 308: 1310–1314.
Xiong, L. Z., K. D. Liu, X. K. Dai, C. G. Xu, and Q. Zhang,1999 Identification of genetic factors controlling domestication-related traits of rice using an F2 population of a cross betweenOryza sativa and O. rufipogon. Theor. Appl. Genet. 98: 243–251.
Yanofsky, M. F., H. Ma, J. L. Bowman, G. N. Drews, K. A. Feldmannet al., 1990 The protein encoded by the Arabidopsis homeoticgene agamous resembles transcription factors. Nature 346: 35–39.
Yilmaz, A., M. Y. Nishiyama, B. G. Fuentes, G. M. Souza, D. Janieset al., 2009 GRASSIUS: a platform for comparative regulatorygenomics across the grasses. Plant Physiol. 149: 171–180.
Communicating editor: J. A. Birchler
Maize Chromosome Five Houses Linked QTL 353

GENETICSSupporting Information
http://www.genetics.org/lookup/suppl/doi:10.1534/genetics.114.165845/-/DC1
Genetic Dissection of a Genomic Region withPleiotropic Effects on Domestication Traits in
Maize Reveals Multiple Linked QTLZachary H. Lemmon and John F. Doebley
Copyright © 2014 by the Genetics Society of AmericaDOI: 10.1534/genetics.114.165845

2 SI Z. H. Lemmon and J. F. Doebley
Figure S1 Histograms of the least squared means for phenotyped traits from the QTL mapping population. Several of these distributions are approximately normal, but other traits take on an exponential distribution. The average least squared mean for NIRILs with 100% maize and teosinte genotypes is indicated with an arrow and “M” for maize and “T” for teosinte.
Z. H. Lemmon and J. F. Doebley 3 SI
Figure S2 Example histograms of simulated traits for several different conditions in terms of number of causative loci, effect size, and heritability. Histograms from traits with equal effects ‐ 67% H2, equal effects ‐ 90% H2, gamma distributed effect ‐ 67% H2 and gamma distributed effect ‐ 90% H2 are shown in different columns from left to right. Histograms from simulated traits with one, five, ten, twenty, fifty, seventy‐five, and one hundred causative loci are shown from top to bottom. The average simulated phenotype value for NIRILs that are 100% maize and teosinte are indicated with arrows labeled by “M” for maize and “T” for teosinte.
4 SI Z. H. Lemmon and J. F. Doebley
Figure S3 Proportion of detected QTL with zero, one, or multiple causative genes in the 1.5 LOD support interval. As seen in the equal effect simulations, a high number of gamma distributed causative genes leads to detected QTL with multiple causative factors. There is a relatively high percentage of detected QTL in the simulations containing a single causative gene when few (less than 4) causative genes are simulated, but as the number of simulated causative genes increases we quickly lose the power to distinguish between closely linked causative genes and they become lumped into single detected QTL.

Z. H. Lemmon and J. F. Doebley 5 SI
File S1
Simulation R script and required secondary files (genotypes and gene names/positions)
Available for download as a zip archive at http://www.genetics.org/lookup/suppl/doi:10.1534/genetics.114.165845/‐/DC1

6 SI Z. H. Lemmon and J. F. Doebley
Table S1 RFLP Markers used during backcrossing of QTL mapping population.
Marker Chromosome Marker Chromosome Marker Chromosome
bnl5.62 1 umc121 3 bnl7.71 5
umc157 1 php20042 3 npi412 5
umc37b 1 umc42b 3 umc54 5
npi255 1 umc161 3 umc127b 5
BZ2 1 umc18 3 umc104a 5
bnl8.10 1 TE1 3 bnl6.29 6
npi615 1 bnl5.37 3 umc65 6
umc107 1 bnl8.01 3 umc21 6
npi225 1 umc60 3 umc46 6
bnl8.45 2 bnl12.97 3 umc132 6
umc53 2 php10080 3 umc62 6
npi320 2 npi425 3 npi114 8
npi421 2 umc2a 3 bnl9.11 8
umc6 2 php20725 4 umc117 8
umc34 2 umc19 4 umc7 8
umc134 2 umc127a 4 npi253 9
umc131 2 bnl10.17b 4 umc113 9
umc2b 2 umc15 4 umc81 9
umc5a 2 bnl8.23 4 umc95 9
php20005 2 bnl8.33 5 bnl3.04 10
umc122 2 bnl6.25 5 umc130 10
umc49a 2 umc90 5 umc49b 10
umc36 2 umc27 5 umc117b 10
umc32 3 umc166 5 bnl7.49 10
Z. H. Lemmon and J. F. Doebley 7 SI
Table S2 Marker information including physical position, genetic position, percent maize, teosinte, heterozygous, and
missing.
Marker Physical Start Physical End
Genetic
Position
Percent
Maize
Percent
Teosinte Percent Heterozygous
Percent
Missing
umc2036 6985542 6985695 0.00 49.2% 48.1% 2.3% 0.4%
bnlg565 8492860 8492883 6.54 48.5% 47.3% 3.8% 0.0%
bnlg105 13812577 13812596 20.90 36.9% 51.2% 0.4% 11.2%
phi008 14072711 14072799 21.54 46.9% 51.2% 1.5% 0.0%
umc2293 15110042 15110066 25.26 48.1% 49.6% 1.9% 0.0%
umc2060 16462679 16462822 27.79 48.1% 49.2% 1.9% 0.4%
bnlg1046 18701271 18701478 31.75 46.2% 49.6% 3.1% 0.8%
umc2035 23891636 23891586 42.17 51.5% 45.8% 2.3% 0.0%
umc1705 28196232 28196255 45.36 51.2% 45.8% 2.7% 0.0%
umc1056 32035997 32036018 48.10 51.2% 45.0% 3.5% 0.0%
umc2294 33783040 33783128 48.43 51.9% 44.6% 3.1% 0.0%
umc1935 51438478 51438621 53.24 49.2% 46.2% 4.2% 0.0%
umc1850 54416864 54416984 54.79 49.2% 45.8% 3.8% 0.8%
mmp58 74916757 74916904 61.98 48.1% 46.9% 4.2% 0.4%
GRM116761 82236265 82236067 63.55 48.1% 45.8% 5.0% 0.8%
umc2298 84800673 84800762 65.07 47.7% 47.3% 4.6% 0.0%
umc1110 84825350 84825468 65.39 47.3% 46.9% 5.4% 0.0%
umc1224 92368559 92368676 66.70 46.2% 48.5% 5.0% 0.0%
umc1283 111997810 111997925 67.52 46.9% 47.7% 5.0% 0.0%
bnlg1287 121583928 121584076 67.69 47.7% 47.7% 4.2% 0.0%
dupssr10 142483339 142483503 68.70 47.3% 48.5% 3.8% 0.0%
bnlg2323 151717740 151717922 74.26 47.7% 49.2% 1.5% 1.2%
ZHL0301 159447674 159447786 77.01 48.1% 49.2% 2.3% 0.0%
umc1348 166576570 166576708 81.83 46.5% 43.8% 5.8% 3.5%
umc1966 169230959 169231115 86.64 48.1% 46.2% 5.4% 0.0%