genetic analysis of round white sh prosopium … · cette publication hautement spécialisée,...
TRANSCRIPT

Genetic analysis of round whitefish (Prosopium cylindraceum) stock structure in Lake Ontario
Ministry of Natural Resources and Forestry
Technical Report TR-11
Science and Research

Genetic analysis of round whitefish (Prosopium cylindraceum) stock structure in Lake Ontario
2016
Science and Research Technical Report TR–11
Science and Research Branch • Ministry of Natural Resources and Forestry
Jacquelyn Wood1, Jim A. Hoyle2, Chris Wilson1*
1Aquatic Research and Monitoring Section 2Lake Ontario Management Unit *corresponding author
© 2016, Queen’s Printer for OntarioPrinted in Ontario, Canada
Copies of this publication are available from:[email protected]
Cette publication hautement spécialisée, Genetic analysis of round whitefish (Prosopium cylindraceum) stock structure in Lake Ontario n’est disponible qu’en anglais conformément au Règlement 671/92, selon lequel il n’est pas obligatoire de la traduire en vertu de la Loi sur les services en français. Pour obtenir des renseignements en français, veuillez communiquer avec le ministère des Richesses naturelles et des Forêts au [email protected]
Some of the information in this document may not be compatible with assistive technologies. If you need any of the information in an alternate format, please contact [email protected]
Cover photo: Netting near Peter Rock on the north shore of Lake Ontario between Cobourg and Port Hope Credit: Sonya Kranzl, MNRF
Cite this report as: Wood, J., J.A. Hoyle, C. Wilson. 2016. Genetic analysis of round whitefish (Prosopium cylindraceum) stock structure in Lake Ontario. Ministry of Natural Resources and Forestry, Science and Research Branch, Peterborough, Ontario. Science and Research Technical Report TR–11 10 p.

i
Science and Research Technical Report TR–11
Abstract
The genetic stock structure of round whitefish (Prosopium cylindraceum) in Lake Ontario was assessed to test for the potential presence of cryptic stocks in Ontario waters. Historical and contemporary samples collected from round whitefish from three locations in Lake Ontario (Darlington, Pickering, and Peter Rock) during fall spawning were analyzed using microsatellite DNA loci. Individual-based analyses of multilocus genotypes failed to identify significant genetic differences or discrete genetic populations among round whitefish from the different sampling locations.
Keywords: stock structure, population genetics, round whitefish, Prosopium cylindraceum, Lake Ontario
Résumé
Analyse génétique de la structure du stock du ménomini rond (Prosopium cylindraceum) dans le lac Ontario
La structure du stock génétique du ménomini rond (Prosopium cylindraceum) présent dans le lac Ontario a été évaluée pour déterminer la présence possible de stocks cryptiques dans les eaux de l’Ontario. Les échantillons historiques et contemporains prélevés dans des populations de ménominis ronds à trois endroits différents du lac Ontario (Darlington, Pickering et rocher Peter) pendant la fraie automnale ont été analysés au moyen de loci d’ADN microsatellites. Les analyses individuelles de génotypes multilocus n’ont pas permis de détecter de différences génétiques significatives ni de populations génétiques distinctes parmi les ménominis ronds provenant des différents lieux d’échantillonnage.
Mots-clés : structure du stock, génétique des populations, ménomini rond, Prosopium cylindraceum, lac Ontario
Acknowledgements
Funding for the project was provided by the Canada-Ontario Agreement on Great Lakes Water Quality and Ecosystem Health (Canada-Ontario Agreement). Samples for this study were provided by field crews from the Ministry of Natural Resources and Forestry (MNRF) Lake Ontario Management Unit (LOMU) as well as Ontario Power Generation and EcoMetrix Incorporated (Mississauga, ON), and genetic data were collected by Caleigh Smith and Kristyne Wozney (MNRF — Aquatic Research and Monitoring Section). Professor Chris Somers (University of Regina) generously provided insights and access to unpublished data as background for this project. Andy Todd and Jake LaRose (LOMU) and Jason Borwick (MNRF — Fisheries Section) provided constructive feedback that improved previous versions of the manuscript.


iii
Science and Research Technical Report TR–11
Contents
Abstract . . . . . . . . . . . . . . . . . . . . . . . . . . . . . . . . . . . . . . . . . . . . .i
Résumé . . . . . . . . . . . . . . . . . . . . . . . . . . . . . . . . . . . . . . . . . . . . .i
Acknowledgements . . . . . . . . . . . . . . . . . . . . . . . . . . . . . . . . . . . . . . . .i
Introduction . . . . . . . . . . . . . . . . . . . . . . . . . . . . . . . . . . . . . . . . . . . 1
Methods . . . . . . . . . . . . . . . . . . . . . . . . . . . . . . . . . . . . . . . . . . . . 1
Field sampling . . . . . . . . . . . . . . . . . . . . . . . . . . . . . . . . . . . . . 1
Genotyping . . . . . . . . . . . . . . . . . . . . . . . . . . . . . . . . . . . . . . . 2
Population genetic differentiation . . . . . . . . . . . . . . . . . . . . . . . . . . . . 3
Results . . . . . . . . . . . . . . . . . . . . . . . . . . . . . . . . . . . . . . . . . . . . . 4
Discussion . . . . . . . . . . . . . . . . . . . . . . . . . . . . . . . . . . . . . . . . . . . 8
Conclusion . . . . . . . . . . . . . . . . . . . . . . . . . . . . . . . . . . . . . . . . . . . 8
Literature Cited . . . . . . . . . . . . . . . . . . . . . . . . . . . . . . . . . . . . . . . . . 9


Science and Research Technical Report TR–11
1
Introduction
The round whitefish (Prosopium cylindraceum) is a member of the native Great Lakes coldwater, benthic-oriented fish fauna, as well as occurring in scattered inland lakes from New Brunswick through Ontario, and northwestern Canada and Alaska (Scott and Crossman 1998). Unlike other coregonids in the Great Lakes, round whitefish do not support significant recreational or commercial fisheries. As a result, comparatively less is known about their biology (Hubbs and Lagler 1949, Scott and Crossman 1998).
In Lake Ontario, the distribution of round whitefish appears to be largely restricted to the north central and northwestern waters west of Prince Edward County (Griffiths 1992, Hoyle 2015). In a long term study of fish species composition, distribution and abundance trends in northeastern Lake Ontario, Hoyle (2015) reported that round whitefish occurred only in the western-most geographic areas sampled. Spawning occurs in early December at approximately 5 – 10 m water depth, as water temperatures fall below 3° C (Haymes and Kolenosky 1984). Eggs overwinter in these shallow, nearshore waters and hatch in early spring. During summer, round whitefish were most commonly captured at depths of 20 – 25 m and a mean water temperature of 10.7° C (Hoyle 2015). Abundance of round whitefish in Lake Ontario declined after the mid-1990s, potentially due to dreissenid mussel-induced ecosystem change (Hoyle 2015).
Studies targeting round whitefish in Lake Ontario have mainly occurred in the context of shoreline development within the species’ spawning distributional range. Haymes and Kolenosky (1984) described the distribution and biological characteristics of spawning round whitefish (body size, growth, and age distribution) as part of a program to assess potential impact of construction and operation of nuclear generating stations (NGS) in the vicinity of round whitefish spawning areas. Other work has focused on the potential impact of heated water discharge from NGSs on round whitefish egg survival and timing of hatch (Griffiths 1979, 1980; Patrick et al. 2013). In the present study, we add to existing knowledge by examining the genetic structure and diversity within and among spawning aggregations of round whitefish at several locations in Lake Ontario. The conservation of genetic diversity within and structure among populations of species is a primary concern in conservation biology and a central mandate of government agencies in Canada (Biodiversity Convention Office 1995; COSEWIC 2014).
We used microsatellite loci to investigate the genetic structure and diversity of round whitefish in Lake Ontario using contemporary and archived samples spanning 35 years collected from individuals originating from three spawning aggregations located along 70 km of Lake Ontario’s north shore. We tested the null hypothesis that round whitefish in Lake Ontario comprise a single panmictic population, and the alternative hypothesis that each of the three spawning locations represented a reproductively discrete, genetically distinct population. This work will inform management issues related to mitigating future development impacts on the Lake Ontario north shore aquatic ecosystem.
Methods
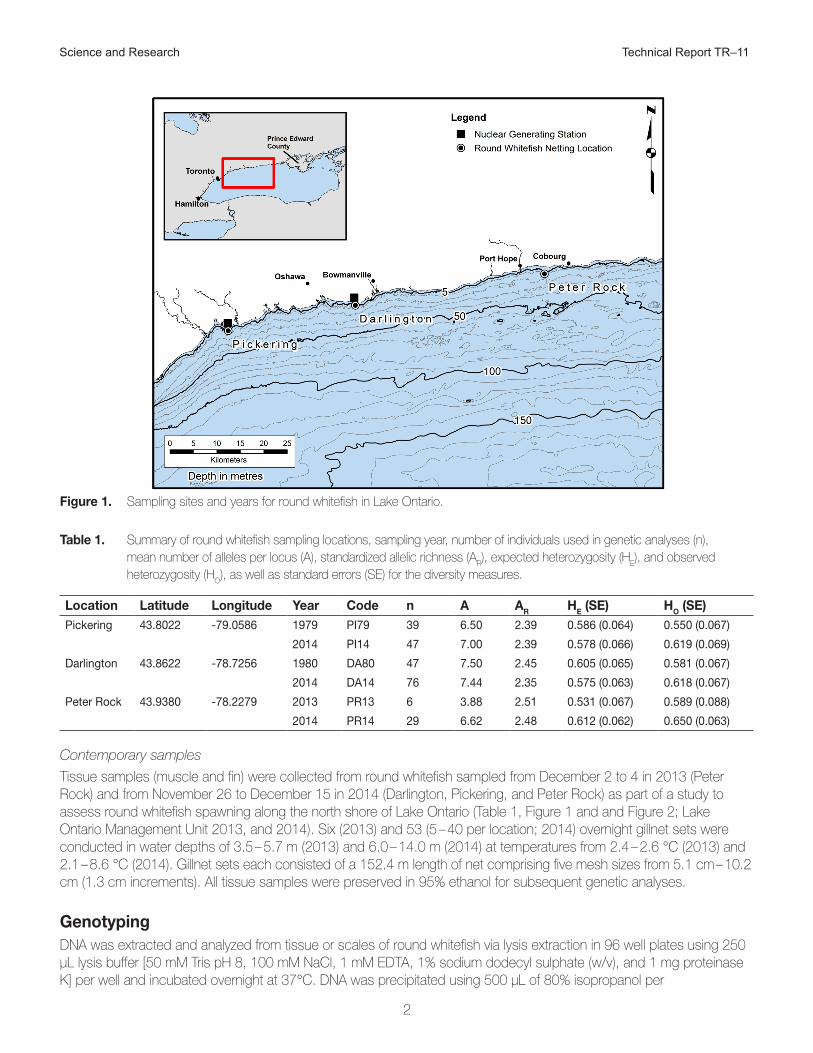
Field samplingSamples used to explore possible genetic stock structure of round whitefish were collected from three different spawning areas (Pickering, Darlington, and Peter Rock) across a 70 km stretch of Lake Ontario’s north shore (Figure 1) and spanned a 35-year time period. The area across which samples were collected comprises most of the known spawning range of round whitefish in Lake Ontario.
Archived samples
Scales were collected from individual round whitefish sampled by gillnets from November 21 to December 13 in 1979 (Pickering) and 1980 (Darlington) as part of a study characterizing the distribution and spawning habits of round whitefish in Lake Ontario (Table 1 and Figure 1; detailed in Haymes and Kolenosky 1984). A total of 7 – 15 gillnet sets were conducted at four and six locations in Pickering and Darlington, respectively, at water depths ranging from 3.0 – 10.0 m. Gillnets 15.2 or 45.7 m in length were used, consisting of a graded series of eight mesh sizes from 3.8 – 12.7 cm (1.3 cm increments). Gillnets were typically set for a 24 hour period except on some dates during poor weather where nets remained in the water up to 144 hours; the number of fish collected in the longer sets did not differ from the 24 hour sets (Haymes and Kolenosky 1984).
Science and Research Technical Report TR–11
2
Figure 1. Sampling sites and years for round whitefish in Lake Ontario.
Table 1. Summary of round whitefish sampling locations, sampling year, number of individuals used in genetic analyses (n), mean number of alleles per locus (A), standardized allelic richness (A
R), expected heterozygosity (H
E), and observed
heterozygosity (HO), as well as standard errors (SE) for the diversity measures.
Location Latitude Longitude Year Code n A AR HE (SE) HO (SE)Pickering 43.8022 -79.0586 1979 PI79 39 6.50 2.39 0.586 (0.064) 0.550 (0.067)
2014 PI14 47 7.00 2.39 0.578 (0.066) 0.619 (0.069)
Darlington 43.8622 -78.7256 1980 DA80 47 7.50 2.45 0.605 (0.065) 0.581 (0.067)
2014 DA14 76 7.44 2.35 0.575 (0.063) 0.618 (0.067)
Peter Rock 43.9380 -78.2279 2013 PR13 6 3.88 2.51 0.531 (0.067) 0.589 (0.088)
2014 PR14 29 6.62 2.48 0.612 (0.062) 0.650 (0.063)
Contemporary samples
Tissue samples (muscle and fin) were collected from round whitefish sampled from December 2 to 4 in 2013 (Peter Rock) and from November 26 to December 15 in 2014 (Darlington, Pickering, and Peter Rock) as part of a study to assess round whitefish spawning along the north shore of Lake Ontario (Table 1, Figure 1 and and Figure 2; Lake Ontario Management Unit 2013, and 2014). Six (2013) and 53 (5 – 40 per location; 2014) overnight gillnet sets were conducted in water depths of 3.5 – 5.7 m (2013) and 6.0 – 14.0 m (2014) at temperatures from 2.4 – 2.6 °C (2013) and 2.1 – 8.6 °C (2014). Gillnet sets each consisted of a 152.4 m length of net comprising five mesh sizes from 5.1 cm – 10.2 cm (1.3 cm increments). All tissue samples were preserved in 95% ethanol for subsequent genetic analyses.
GenotypingDNA was extracted and analyzed from tissue or scales of round whitefish via lysis extraction in 96 well plates using 250 µL lysis buffer [50 mM Tris pH 8, 100 mM NaCl, 1 mM EDTA, 1% sodium dodecyl sulphate (w/v), and 1 mg proteinase K] per well and incubated overnight at 37°C. DNA was precipitated using 500 µL of 80% isopropanol per

Science and Research Technical Report TR–11
3
Figure 2. Sampling for round whitefish in 2013 using variable-mesh gillnets (3.8 – 12.7 cm in 1.3 cm increments).
well and centrifuged at 2000 gravities for 30 min. Once the supernatant was removed, the remaining pellets were rinsed with 1 mL of 70% ethanol, followed by re-centrifugation. DNA pellets were air dried at room temperature for 20 min and dissolved in 150 µL TE (10 mM Tris pH 8, 1 mM EDTA). Extracted DNA quality and quantity was assessed using electrophoresis in 1.5% agarose gels stained with SybrGreen (Cedar Land Laboratories, Burlington, ON) alongside a molecular mass ladder (Bioshop, Burlington, ON).
Samples were amplified and genotyped at 19 microsatellite loci which were previously identified for round whitefish (Angers et al. 1995; Winkler and Weiss 2008; O’Bryhim et al. 2013; McCracken et al. 2014). Each 15 μL multiplex PCR reaction contained 1×PCR Buffer (Promega, Madison, WI), 0.5 mM MgCl
2 (Promega, Madison, WI), 0.2 mM
dNTP (Bioshop, Burlington, ON), 0.2 mg·ml-1 BSA (Bioshop, Burlington, ON), 0.025U Taq DNA polymerase (Qiagen, Mississauga, ON), 12 ng of DNA template, and the following primer concentrations (forward and reverse): Multiplex 1- Prwi26 [0.2μL], Prwi21[0.2μL], and Prwi6 [0.2μL]; Multiplex 2- Prwi30 [0.15μL], Prwi15-1[0.10μL], Prwi15-2[0.10μL], Pcy20[0.25μL], and Prwi28[0.2μL]; Multiplex 3- Pcy37[0.30μL], Pcy8[0.20μL], Prwi24[0.20μL], and Prwi47[0.25μL]; Multiplex 4- Pcy68[0.10μL], Clatet1[0.20μL], Prwi25-1[0.30μL], and Prwi25-2[0.10μL]; Multiplex 5- Pcy9[0.20μL], Sfo18[0.20μL], and Prwi27[0.10μL]. Amplifications were performed using a T100 Thermal Cycler (BioRad) with an initial 5 min denaturing step at 94°C, followed by 36 cycles of denaturation at 94°C for 1 min, annealing at 50°C for 1 min, and extension at 72°C for 1 min followed by a final extension of 60°C for 30 min. Amplified products were run on an AB 3730 automated sequencer with a ROX-350 size standard (Applied Biosystems, Foster City, CA) and allele sizes scored using GeneMapper version 4.1 (Applied Biosystems, Foster City, CA).
Population genetic differentiationAll loci were tested for deviations from Hardy-Weinberg equilibrium (HWE) and linkage disequilibrium (LD) using exact tests implemented in GENEPOP (v.4.2; Rousset 2008) followed by sequential Bonferroni correction for multiple comparisons (Rice 1989). Individual loci were also tested for potential null alleles, dropout of large alleles, and scoring errors associated with allelic stuttering using MICROCHECKER (v. 2.2.3; Van Oosterhout et al. 2004). The number of alleles per locus (A) and expected (H
E) and observed (H
O) heterozygosity for each locus within each time period and
sampling location were computed using GenAlEx (v.6.502; Peakall and Smouse 2006); HP-RARE 1.0 (Kalinowski 2005) was used to calculate standardized allelic richness (A
R) using rarefaction.

Science and Research Technical Report TR–11
4
Potential round whitefish population genetic structure was investigated using two independent individual-based methods: the Bayesian clustering program STRUCTURE (v.2.3.4; Pritchard et al. 2000; Hubisz et al. 2009) as well as the non-model based discriminant analysis of principal components (DAPC; Jombart et al. 2010) implemented in the R software package adegenet (Jombart 2008). Both methods enable the analysis of spatially continuous genetic data without predefined genetic clusters (Pritchard et al. 2000; Jombart et al. 2010), however DAPC makes fewer assumptions about the data and may provide better resolution than STRUCTURE for identifying complex spatial and hierarchical population structure (Jombart et al. 2010). Since differing clustering approaches can yield different results, both methods were adopted in this analysis (Waples and Gaggiotti 2006; Frantz et al. 2009).
STRUCTURE was initially implemented using the admixture model with correlated allele frequencies; no a priori information on sampling locations was included in order to avoid potential bias in quantifying the most likely number of genetic clusters (K; Pritchard et al. 2000). Models were run specifying K = 1 – 6 with a burn-in period of 100,000 followed by 150,000 iterations with ten replicates per K. Runs were also conducted using other combinations of model parameters (e.g. no admixture with correlated allele frequencies) to determine whether this affected the outcome. We estimated the most likely number of clusters as the value of K which maximized the log-likelihood of the data and plotted the mean and variance in likelihood per K across the ten replicates using STRUCTURE HARVESTER (Earl and vonHoldt 2012). Plots of individual membership coefficients were generated using DISTRUCT (v.1.1; Rosenberg 2004).
Estimating the number of genetic clusters using DAPC is a two-step process. First, the genetic data is transformed using Principal Component Analysis (PCA) to create a reduced number of uncorrelated variables (principal components; PC) that summarize total variability in the data. In the second step, PCs are used as input in a discriminant analysis (DA), which aims to maximize between-group variability when assigning genotypes to different clusters. DAPC was carried out using successive K-means clustering and Bayesian Information Criterion (BIC) implemented via the function find.clusters for K = 1 – 6; optimal K was the value for which the BIC value was lowest, after which the BIC either increased or decreased only slightly (Jombart et al. 2010). The function dapc was then executed to illustrate the relationship between the inferred groups. Because the number of PCs retained for DA analysis is user-defined and this decision can substantially impact the results, we used cross-validation carried out using the function xvalDapc to determine the optimum number of PCs to retain for DA.
Results
A total of 268 individual round whitefish were sampled across the three locations and two different time periods (Figure 3). Of these fish, 244 were included in genetic analyses after excluding samples that were missing data at six or more loci (Table 1). In addition, three microsatellite loci (Pcy20, Prwi47, and Sfo18) were eliminated from the analysis due to lack of polymorphism for assessing potential population differentiation.
Two of the 16 loci (Pcy8 and Prwi25-2) exhibited signs of heterozygote deficiency after Bonferroni correction (critical p-value = 0.00052). MICROCHECKER suggested the HWE deviations were due to null alleles; as there was no consistency in the locus or population that deviated from expectations, however, locus- and population-specific factors were likely not the cause of the deviations. LD was not significant after Bonferroni correction in any pair-wise comparison of loci across the six spatiotemporal locations (critical p-value = 0.000083).
Round whitefish in Lake Ontario exhibit substantial genetic diversity (summarized in Table 1). Across the sampling locations and time periods, allelic richness ranged from 3 (Prwi15-1, Pcy37) to 22 (Prwi24) with a mean of 9.6 alleles per locus (data not shown). The mean number of alleles per locus was substantially lower at Peter Rock in 2013 relative to the other locations and time periods (Table 1), but appeared to be due to the small number of individuals sampled at that time period, as estimates of standardized allelic richness ranged from 2.39 (Pickering, 1979 and 2014) to 2.51 (Peter Rock, 2013) when standardized to a similar sample size (N = 6 individuals, or 12 allele copies). For all spatiotemporal locations, observed heterozygosity values (H
O) were similar to expected values (H
E) ranging from 0.550 – 0.650 and
0.531 – 0.612, respectively. In general, HO was greater in the contemporary samples than the archived samples for all
sampling locations, but as the standard errors overlapped in each case these differences are likely not significant.
Individual-based analysis using STRUCTURE failed to detect either temporal or spatial genetic structure in the Lake Ontario round whitefish dataset. Results showed that the highest likelihood was achieved under the null hypothesis

Science and Research Technical Report TR–11
5
Figure 3. Round whitefish captured during gillnet survey.
of a single panmictic population (K = 1; Figure 4a). For models using K > 1, individuals consistently showed equal membership probabilities to each group (e.g., Figure 4b). STRUCTURE runs using different model parameters yielded similar results (data not shown).
Compared with STRUCTURE, results of the DAPC analysis exhibited a weak but non-significant signal for round whitefish population substructure. In successive K-means clustering, BIC values decreased sharply from K = 2- 4 (Figure. 3a). The first 60 PCs, which together represented 93% of the total genetic variation in the dataset, were retained for use in DA as determined by the cross-validation procedure (Jombart et al. 2010). Examination of the DAPC scatterplot using the six sampling locations and time periods as pre-defined clusters suggested the potential existence of temporal genetic structure (groups representing samples collected in 1979 and 1980 departed from the 2013 and 2014 samples along the first PC axis [eigenvalue = 43.05]; Figure 3b) and to a lesser extent spatial genetic structure between the archived samples (Darlington and Pickering were separated along the second axis [eigenvalue = 31.85]). However, when no a priori information was used there was little consistent assignment of individuals from the six sampling locations and time periods to different clusters using the K = 2 – 4 groupings identified by the PCA step. Although genotypes from the 1979 Pickering and 1980 Darlington sampling efforts showed some degree of separation, the confidence ellipses for both groups were not distinct (Figure 5). No significant genetic structure was detectable among the recent (2013 and 2014) samples from Darlington, Pickering, and Peter Rock. When a smaller number of PCA axes were retained for the discriminant analysis, no differences among sites or time periods were apparent (data not shown).

Science and Research Technical Report TR–11
6
Figure 4. STRUCTURE results for individual-based analysis of temporal and spatial population genetic structure of Lake Ontario round whitefish showing (a) the mean log-likelihood and standard deviation (SD) of inferred numbers of genetic groups (K) for K = 1 – 6, and (b) the proportion of each individual’s genome assigned to different potential groups (shown as different colours) when K =3 and K = 6, assuming admixture and using no a priori information to define putative groups. Individuals are grouped by sampling locations and years, using the abbreviations in Table 1. The equal membership probabilities to multiple hypothesized groups in (b) reflects the lack of detectable genetic substructure among sites.

Science and Research Technical Report TR–11
7
K = 2 ‐ 4
(a)
(b)
PCA Ax
is II
Figure 5. DAPC results showing (a) changes in mean Bayesian information criterion (BIC) values in successive K-means clustering (indicating the optimal K) and (b) scatterplot of the first two principal components using the six original spatiotemporal locations as prior clusters. Populations are labeled inside their 95% confidence ellipses; symbols represent genotypes from individual fish. The inset indicates the proportion of variance in the data accounted for in the retained principal components.

Science and Research Technical Report TR–11
8
Discussion
There was little evidence for temporal and spatial genetic substructure of round whitefish spawning in different locations in Lake Ontario using individual-based genetic analysis. Bayesian clustering analysis revealed that for K > 1, individuals consistently showed equal membership probabilities to all groups. Similarly, the overlap of genetic clusters in the DAPC analysis using information on sampling location and time period to pre-define clusters indicated a low degree of genetic differentiation. Although there was a signal that archived samples differed from contemporary samples, when DAPC was performed using no a priori information there was no consistent assignment of individuals from the six groups to different clusters. The difference detected in archived versus recent samples may have been due to sample degradation and allelic dropout in older samples (Nielsen et al. 1999). The apparent changes in genetic characteristics between the historical and contemporary samples at both the Darlington and Pickering sites may therefore reflect historical stock structure that has since been lost, but could also be due to allelic dropout from sample degradation. Even if spatial genetic structure was historically present, no significant substructure was detected among contemporary samples from the three spawning locations. Taken together, the results of this study support the null hypothesis that round whitefish comprise a single panmictic population across its Lake Ontario distribution.
If weak genetic substructure of round whitefish is actually present, it could simply be that currently available methods are not powerful enough to detect it. Indeed, STRUCTURE and other individual-based analyses are known to be limited in their capacity to detect weak population differentiation (Waples and Gaggiotti 2006; Pritchard et al. 2007). The absence of significant genetic differentiation also does not necessarily preclude the existence of ecologically and demographically distinct subpopulations (Palsbøll et al. 2007; Bernard et al. 2009), as genetic homogenization can occur with relatively small amounts of gene flow even though local spawning aggregates are largely independent (Brown and Casselman 1992; Martien and Taylor 2003; Waples and Gaggiotti 2006). If cryptic ecological and/or genetic structure is present but currently undetectable, the best resolution of potential population differentiation might be achieved by combining neutral genetic analysis with details regarding life history and demography, as well as an investigation of genetic variation underlying adaptive traits under selection (Bernatchez 1995; Palsbøll et al. 2007).
Conclusion
Individual-based genetic analysis supported the presence of a single panmictic population of round whitefish in Lake Ontario. However, caution is warranted in regards to basing conclusions or management strategies on the results of neutral genetic analyses only; these should ideally be considered in tandem with details regarding adaptive genetic variation, life history, and demography (Bernatchez 1995; Palsbøll et al. 2007; Bernard et al. 2009). Future research efforts regarding Lake Ontario round whitefish could include identifying and quantifying the amount of spawning habitat throughout the Lake Ontario distributional range and quantifying the relative importance of each spawning site to lake-wide round whitefish productivity.

Science and Research Technical Report TR–11
9
Literature Cited
Angers. B., L. Bernatchez, A. Angers and L. Desgroseillers. 1995. Specific microsatellite loci for brook charr reveal strong population subdivision on a microgeographic scale. Journal of Fish Biology 47(Suppl. A): 177–185.
Bernard, A.M., M.M. Ferguson, D.L.G. Noakes, B.J. Morrison and C.C. Wilson. 2009. How different in different? Defining management and conservation units for a problematic exploited species. Canadian Journal of Fisheries and Aquatic Sciences 66(9): 1617–1630.
Bernatchez, L. 1995. A role for molecular systematics in defining evolutionarily significant units in fishes. Pages 114–132 in J.L. Nielson, ed. Evolution and aquatic ecosystems: defining unique units in population conservation. American Fisheries Society Symposium 17. American Fisheries Society, Bethesda, Maryland.
Biodiversity Convention Office. 1995. Canadian biodiversity strategy: Canada’s response to the convention on biological diversity. Supply and Services Canada, Biodiversity Convention Office, Hull, Quebec.
Brown, D.M., and J.M. Casselman. 1992. Research project: Development of criteria for discriminating among lake whitefish stocks in eastern Lake Ontario. Lake Ontario Fisheries Unit 1991 Annual Report. Ontario Ministry of Natural Resources, Picton, Ontario, Section 21: 1–9.
Committee on the Status of Endangered Wildlife in Canada. 2014. Guidelines for recognizing designatable units. Available at http://www.cosewic.gc.ca/eng/sct2/sct2_5_e.cfm (accessed on January 21, 2016).
Earl, D.A. and B.M. vonHoldt. 2012. STRUCTURE HARVESTER: a website and program for visualizing STRUCTURE output and implementing the Evanno method. Conservation Genetics Resources 4(2): 359–361.
Frantz, A.C., S. Cellina, A. Krier, L. Schley and T. Burke. 2009. Using spatial Bayesian methods to determine the genetic structure of a continuously distributed population: clusters or isolation by distance? Journal of Applied Ecology 46(2): 493–505.
Griffiths, J.S. 1979. Potential effects of unstable thermal discharges on incubation of lake Whitefish eggs. Ontario Hydro Research Division, Report No. 79–521–K.
Griffiths, J.S. 1980. Potential effects of unstable thermal discharges on incubation of round whitefish eggs. Ontario Hydro Research Division. Report No. 80–140-K.
Griffiths, J.S. 1992. Growth of Lake Ontario round whitefish in the vicinity of Darlington NGS 1974-1987. Ontario Hydro Research Division, Report No. 92–220-K.
Haymes, G.T. and D. P. Kolenosky. 1984. Distribution and characteristics of spawning round whitefish in Lake Ontario, 1976–1981. Ontario Fisheries Technical Report Series No. 14: ii–9.
Hoyle, J.A. 2015. Fish species composition, distribution and abundance trends in the open coastal waters of northeastern Lake Ontario, 1992–2012. Aquatic Ecosystem Health & Management 18:89–100.
Hubisz, M.J., D. Falush, M. Stephens and J.K. Pritchard. 2009. Inferring weak population structure with the assistance of sample group information. Molecular Ecology Resources 9(5): 1322–1332.
Hubbs, C.L. and K. F. Lagler. 1949. Fishes of Isle Royale, Lake Superior, Michigan. University of Michigan.
Jombart, T. 2008. adegenet: a R package for the multivariate analysis of genetic markers. Bioinformatics 24(11): 1403-1405.
Jombart, T., S. Devillard and F. Balloux. 2010. Discriminant analysis of principal components: a new method for the analysis of genetically structured populations. BMC Genetics 11(1): 94.
Kalinowski, S.T. 2005. HP‐RARE 1.0: a computer program for performing rarefaction on measures of allelic richness. Molecular Ecology Notes 5(1): 187-189.
Martien, K.K. and B.L. Taylor. 2003. Limitations to hypothesis testing in defining management units for continuously distributed species. Journal of Cetacean Research and Management 5(3): 213–218.
McCracken, G.R., K.L. Wilson, H.T. Brewis, M.C. McBride, I. Paterson, R. Perry, D.L. Keefe and D.E. Ruzzante. 2014. Development of 26 novel microsatellite makers for the round whitefish (Prosopium cylindraceum) and successful

Science and Research Technical Report TR–005
10
polymorphic cross-specific amplification of seven previously developed salmonid markers. Conservation Genetics Resources 6(4): 1023-1026.
Nielsen, E.E., M.M. Hansen and V. Loeschcke. 1999. Analysis of applications DNA from old scale samples: technical aspects, and perspectives for conservation. Hereditas 130(3): 265–276.
O’Bryhim, J., C. Somers, S.L. Lance, M. Yau, D.R. Boreham, K.L. Jones and E.B Taylor. 2013. Development and characterization of twenty-two novel microsatellite markers for the mountain whitefish, Prosopium williamsoni and cross-amplification in the round whitefish, P. cylindraceum, using paired-end Illumina shotgun sequencing. Conservation Genetics Resources 5(1): 89 –91.
Palsbøll, P. J., M. Berube and F.W. Allendorf. 2007. Identification of management units using population genetic data. Trends in Ecology and Evolution 22(1): 11–16.
Patrick, P., J. Parks, E. Mason, J. Powell, N. Garisto and A. Janes. 2013. Effects of fixed and fluctuating temperatures on mortality and hatch of round whitefish and lake whitefish eggs. CANDU Owners Group (COG) Report No. COG –13–3025.
Peakall, R. and P.E. Smouse. 2006. GENALEX 6: genetic analysis in Excel. Population genetic software for teaching and research. Molecular Ecology Notes 6(1): 288–295.
Pritchard, J.K., M. Stephens and P. Donnelly. 2000. Inference of population structure using multilocus genotype data. Genetics 155(2): 945–959.
Pritchard, J.K, X. Wen and D. Falush. 2007. STRUCTURE, version 2.2. Department of Human Genetics. University of Chicago, Chicago, Illinois.
Rice, W.R. 1989. Analyzing tables of statistical tests. Evolution 43(1): 223–225.
Rosenberg, N.A. 2004. DISTRUCT: a program for the graphical display of population structure. Molecular Ecology Notes 4(1): 137–138.
Rousset, F. 2008. GENEPOP’007: a complete re‐implementation of the GENEPOP software for Windows and Linux. Molecular Ecology Resources 8(1): 103–106.
Scott, W.B. and E.J. Crossman. 1998. Freshwater fishes of Canada. Galt House Publications Ltd, Oakville, Ontario.
Van Oosterhout, C., W.F. Hutchinson, D.P. Wills and P. Shipley. 2004. MICRO‐CHECKER: software for identifying and correcting genotyping errors in microsatellite data. Molecular Ecology Notes 4(3): 535–538.
Waples, R.S. and O. Gaggiotti. 2006. INVITED REVIEW: What is a population? An empirical evaluation of some genetic methods for identifying the number of gene pools and their degree of connectivity. Molecular Ecology 15(6): 1419–1439.
Winkler, K. and S. Weiss. 2008. Eighteen new tetranucleotide microsatellite DNA markers for Coregonus lavaretus cloned from an alpine lake population. Molecular Ecology Resources 8(5): 1055–1058.

17 10 16ISBN 978-1-4606-8719-2 (pdf)