genetic analysis of egyptian vulture (neophron ...lifeneophron.eu/files/docs/1463989297_682.pdf ·...
TRANSCRIPT

Genetic analysis of eGyptian vulture (NeophroN percNopterus) in the Balkans and turkey
life+ project “the return of the neophron”
life10 nat/BG/000152

ii www.LifeNeophron.eu
Prepared by: Estación Biológica de Doñana, CSICAmérico Vespucio s/n, 41092 Sevilla, Spain
Authors:María Méndez, José A. DonázarDepartment of Conservation Biology, Estación Biológica de Doñana, CSIC
José A. GodoyDepartment of Integrative Ecology, Estación Biológica de Doñana, CSIC
Date:September 2015
THE REPORTWas prepared in the frames of action A1 of the LIFE+ project “The Return of the Neophron” (LIFE10 NAT/BG/000152, www.LifeNeophron.eu), further referred as “the LIFE project”, funded by the European Union and co-funded by the “A. G. Leventis Foundation”.Genetic samples were collected by the LIFE+ project partners BSPB / BirdLife Bulgaria, HOS / BirdLife Greece, WWF Greece and collaborators from Turkey, while analyses and current report were produced by Donana Biological Station at CSIC Spain.

iii www.LifeNeophron.eu
COnTEnTs
ExTENDED SUMMARY ..................................................................................................................................... 1INTRODUCTION ................................................................................................................................................ 3MATERIAL AND METHODS................................................................................................................................ 4RESULTS ............................................................................................................................................................ 6DISCUSSION ................................................................................................................................................. 11ACKNOWLEDGEMENTS .................................................................................................................................. 13REFERENCES ................................................................................................................................................... 13SUPPLEMENTARY MATERIAL .......................................................................................................................... 17

1 www.LifeNeophron.eu
ExTEnDED sUMMARY
Reduced populations are subject to stochastic environmental, demographic and genetic factors that can ul-timately accelerate population extinction. Moreover, small population sizes and reduced gene flow lead to increased genetic drift, resulting in the loss of genetic diversity and an increase in inbreeding, which in turn reduces the adaptive potential of populations and the fitness of individuals. Within this scenario, genetic analyses are increasingly used to infer patterns of gene flow and population diversity and structure, and have become an essential tool in the management and conservation of threatened species. In this sense, it is es-sential to analyse contemporary and past genetic patterns to better calibrate the impact of genetic factors on population viability and to design efficient conservation measures.The Egyptian vulture (Neophron percnopterus) provides a paradigmatic example of an endangered species that is going through a demographic decline. The species is considered as “Globally Endangered” with a total world population below 30,000 individuals. Formerly distributed throughout temperate and arid biomes of Palearctic, its populations dropped dramatically during the 20th century in India, the circum- Mediter-ranean, and the Middle East (>50% over the last three generations), and there are ongoing declines through much of the rest of its African range. In the early 20th century, the Egyptian vulture has been widespread and common in the Balkans, while in the last 30 years, the range of the species decreased and fragmented considerably with population declines estimated over 80% and an annual decline rate of 4-8%. Close to the Balkan population is Turkey’s population, which is estimated at 1,500- 3,000 pairs and considered the second largest breeding pool of the species in Europe, after Spain. The recovery of the Egyptian vulture population in the Balkans necessarily involves the assessment of its genetics status in order to design appropriate con-servation strategies, which could potentially involve the exchange of birds between neighbouring breeding areas. More specifically, knowing the Turkish population’s genetic status and its level of differentiation from the Balkan population is essential to evaluate its potential use as a source for the genetic reinforcement of the Balkan population.A genetic study of the Balkan and Turkish populations was conducted in the frame of LIFE+ project “The Return of the Neophron”. Blood samples and growing feathers were collected from 32 contemporary speci-mens captured between 2010 and 2013 in Bulgaria and Greece, and 10 more samples were collected from birds in Turkey to explore the possible genetic differentiation with this population since it is geographically close and still holds large numbers of vultures. To explore changes in genetic diversity through time, 18 ad-ditional museum samples from Greece, Bulgaria and European Turkey dated as far back as 1853 and distrib-uted throughout the 19th and 20th centuries.Based on mitochondrial and nuclear data from historical and contemporary samples, obtained results sug-gest that recent fragmentation and decline has caused allele frequency fluctuations and an incipient loss of genetic diversity. Historical populations did not show any genetic structure indicating a panmictic scenario. In contrast, the current Balkan’s population is showing signs of genetic loss and differentiation between geo-graphic areas, with the northern being the least diverse and more differentiated compared to the historical one. The southern area does not show any sign of differentiation probably due to the small sample size. Com-paring these populations with others reported in previous studies of Egyptian vultures, it becomes evident that the Balkan historical population was more diverse than any of the current Iberian populations. Even more, the northern and southern areas show less nuclear diversity than any of these populations. All of this evidence reflects a rapid process of genetic diversity loss as a consequence of the severe and rapid reduction of population size in recent decades.The lack of relationship between genetic and geographic distances suggests the absence of current gene flow, and the relationship between genetic distances and time indicates allele frequency fluctuations in the area. Here, we provide yet another instance of the contraction and fragmentation of a formerly large historic population yielding similar results. Unfortunately, the process has likely not ended. Given the long generation time of this species (13 years), we would expect higher values of differentiation in a few more generations if the population decline and fragmentation persist. In this line, considering the small size of the Balkan popula-
1 www.LifeNeophron.eu

2 www.LifeNeophron.eu
tion, if the decline persists it will be almost extinct in <5 generations, therefore the lack of genetic variability will be less of an issue than the lack of birds. The Turkish population could be a possible source for reinforce-ment within ongoing conservation programs as it is less differentiated from the historical Balkan’s than the contemporary Balkans population. However, we would expect an increase in this differentiation with time if there are no management actions that reverse this process. The low genetic diversity, the increase in struc-ture and some evidence of bottlenecks in the different Balkans areas, especially in the northern one, indicate that translocations would be a short-term management solution.In conclusion, this study supports that Balkan’s population is differentiating from the historical one more quickly than Turkey’s population. Given this, it would be feasible to reinforce the Balkan population with birds from Turkey. Of course, this type of active management cannot be approached without addressing the main causes of population decline, and taking into account potential negative effects associated with the movement of animals between isolated breeding nuclei, such as the risk of disease transmission, behavioural disruption, lower fitness in novel habitats in the presence of local adaptations, and negative demographic effects on the donor populations. Under this scenario, and not only due to genetic constraints but also de-mographic factors, the maintenance of the last Balkan populations of this scavenger seem to be extremely precarious and extinction may be unavoidable within a few decades, as has been predicted for other Medi-terranean populations challenged with similar conservation problems. Therefore, urgent conservation meas-ures should be taken to stop the main limiting factors associ¬ated with non-natural mortality as well as to revert the negative effects of genetic drift. Management programs should include the reinforcement of the populations and long-term genetic monitoring in order to avoid inbreeding depression, to maximize the ge-netic diversity and thereby, to increase the long-term population viability.

3 www.LifeNeophron.eu
InTRODUCTIOn
The exponential growth of human populations over the last centuries and the increased consumption of re-sources have triggered an unprecedented global biodiversity crisis. Since 1500 AD, more than 300 vertebrate species have disappeared and a fifth of all vertebrate species are currently considered as “endangered” (Hoff-man et al 2010, Dirzo et al 2014, Pimm et al 2014). This “anthropocene” defaunation is identified as the sixth extinction wave and it is leading to an irreversible loss in ecological functions and ecosystem services (Dirzo et al 2014). The process of decline of vertebrate populations often shares underlying factors inherent to low population size and increasing isolation. Reduced populations are subject to stochastic environmental, de-mographic and genetic factors that can ultimately accelerate population extinction. Moreover, small popu-lation sizes and reduced gene flow lead to increased genetic drift, resulting in the loss of genetic diversity and an increase in inbreeding (Frankham et al 2002, Méndez et al 2011), which in turn reduces the adaptive potential of populations and the fitness of individuals (Allendorf & Luikart, 2007). Within this scenario, genetic analyses are increasingly used to infer patterns of gene flow and population di-versity and structure, and have become an essential tool in the management and conservation of threatened species. These studies commonly analyse current genetic patterns only, but a comparison to pre-bottleneck conditions can help to distinguish alternative scenarios with contrasting consequences for population viabil-ity. If pre-bottleneck and current diversity are similar, population viability might be affected by the reduction in population size, but not by inbreeding depression. In this sense, it is essential to analyse contemporary and past genetic patterns to better calibrate the impact of genetic factors on population viability and to design ef-ficient conservation measures. Nevertheless, studies that monitor the genetic status from the pre-bottleneck to the post-bottleneck stages are very scarce (Hellborg et al 2002; Spong & Hellborg 2002, Groombridge et al 2009, Packer et al 1991, Martínez-Cruz et al 2007).The Egyptian vulture (Neophron percnopterus) provides a paradigmatic example of an endangered species that is going through a demographic decline. The species has been closely linked to traditional agro-grazing economies for centuries (Gangoso et al 2013). Formerly distributed throughout temperate and arid biomes of Europe, Africa and Asia, its populations dropped dramatically during the 20th century in India, the circum-Mediterranean, and the Middle East (>50% over the last three generations), and there are ongoing declines through much of the rest of its African range. The species is currently considered as “Globally Endangered” with a total world population below 30000 individuals (BirdLife International 2014). The main drivers of this population decline (poisoning, accidents involving wind farms and power lines) all act to increase mortality rates of adult and immature birds in breeding and wintering areas, as well as during migration (Thiollay 2006, Hernández & Margalida 2009, Virani et al 2011, Angelov et al 2013, Wacher et al 2013, Ogada et al 2015, Sanz-Aguilar et al 2015). In addition, food shortages associated with changes in land use, pastoral systems, and veterinary and sanitary practices, mortality associated with suboptimal navigation during the first migra-tion and direct persecution have also gained a prominent role in recent times (Kurtev et al 2008, Oppel et al 2015, xirouchakis in prep.). In the early 20th century, the Egyptian vulture was widespread and common in the Balkans (Patev 1950, Grubač 1989, Handrinos & Akriotis 1997). The first indications of decline in this region were reported in the 1960s (Nisbet & Smout 1957, Arabadzhiev 1962) and in the 1980s it became extinct in Croatia (Sušić 1993), Montenegro (Ljucović 1995), Bosnia and Herzegovina (Marinković et al 2007), and Serbia (Grubač 1999). In the last 30 years, the range of the species has decreased considerably and become fragmented in three core areas (with > 10 active territories in Bulgaria, Greece, FYR of Macedonia and Albania) and several relict clusters and single isolated pairs, with population declines estimated over 80% and an annual decline rate of 4-8% (Velevski et al 2015). Close to the Balkan population is Turkey’s population, which is estimated at 1,500-3,000 pairs (BirdLife 2013) and considered the second largest breeding pool of the species in Europe, after Spain. Although the species is considered vulnerable and decreasing in this country (Şen 2013), the absence of monitoring programmes and population studies makes it impossible to estimate population trends. The recovery of the Egyptian vulture population in the Balkans necessarily involves the assessment of its

4 www.LifeNeophron.eu
genetics status in order to design appropriate conservation strategies, which could potentially involve the exchange of birds between neighbouring breeding areas. More specifically, knowing the Turkish population’s genetic status and its level of differentiation from the Balkan population is essential to evaluate its potential use as a source for the genetic reinforcement of the Balkan population. These general objectives are thus specifically included in the LIFE Project “The Return of Neophron” (LIFE10 NAT/BG/000152) (http://lifene-ophron.eu/en/news-view/hot-news/237.html). Here, we assess the genetic diversity and structure of the Balkan and Turkish populations in comparison with historical patterns to determine whether current patterns are the result of recent decline and fragmentation, and we evaluate genetic signals of past demographic changes.
MATERIAL AnD METHODs
Study area and sample collectionThe study area includes Bulgaria, Greece and Turkey (Fig. 1). Blood samples and growing feathers were ob-tained from 32 contemporary specimens captured between 2010 and 2013 in Bulgaria and Greece, distrib-uted in 3 main areas: Northern (Varna, Ruse and their surroundings N=7), Central (Rhodope and Dadia N= 23) and Southern Balkans (Meteora N= 2). Additionally, we obtained 10 samples from birds captured in eastern and central Turkey to explore the possible genetic differentiation with this population since it is geographi-cally close and still holds large numbers of vultures. To explore changes in genetic diversity through time, we also obtained 18 additional museum samples from Greece (n=8), Bulgaria (n=7) and European Turkey (n=3) dated as far back as 1853 and distributed throughout the 19th and 20th centuries (See Supplementary mate-rial: S-1). We collected the umbilical clot from feathers (Hovart et al 2005) and a piece of the foot pad when possible. Samples were preserved in 98% ethanol and stored at 4°C until analysis. DNA was extracted using standard phenol-chloroform methods (Sambrook et al 1989). Samples were collected with the official per-missions of the Bulgarian Ministry of Environment and Waters, Greek Ministry of Environment, Energy and Climate Change and Turkish Ministry of Forestry and Water Affairs’ General Directorate of Nature Conserva-tion and National Park.
Figure 1. Sampling areas. Current (2010-2013) Egyptian vulture population is shown in dark grey and sam-pling areas in circles and ellipses. The distribution during the second half of the xxth century is shown in light grey (based on Velevski et al, 2015). Historically the species occupied the entire Balkans and Turkey. Stars represent localities of museum samples (1853-1979).

5 www.LifeNeophron.eu
Nuclear dataEach individual was genotyped for 12 microsatellite loci selected due to their small product size, four of which were heterospecific (Bv6, 13, 14, 20; Gautschi et al 2000) and 8 species-specific (Np51, 163, 166, 229, 249, 257, 259, 296; Agudo et al 2008). In order to prevent genotyping errors associated with a low quantity and quality of DNA typical of museum samples, such as allelic dropout or false alleles, each sample was inde-pendently genotyped five times (Taberlet et al 1996). Consensus genotypes were then obtained; a heterozy-gote was noted when each allele was seen at least twice, and a homozygote when it was observed at least three times and no other allele was observed. Fluorescently-labelled products were amplified in separate standard PCRs for each marker using end-labelled forward primers and analysed on an ABI 3130xl Genetic Analyzer (Applied Biosystems). Each PCR contained 1x PCR buffer, 2 mM MgCl2, 0.25 dNTPs, 0.4µl of each primer, 0.4U of Taq Polymerase, 0.01 (contemporary) and 0.08 (museum samples) mg/mL BSA and 50 ng of template (4 µl of the template from museum samples) in a total volume of 20µl. This PCR was run with a cycle of 2’ at 94ºC, 40 cycles of 30” at 92º, 30” at the cor-responding annealing temperature and 30” at 72ºC, and a final extension of 5’ at 72ºC. Alleles were scored using GeneMapper v4 (Applied Biosystems).
Genetic nuclear diversity and structureObserved (Ho) and expected (He) genetic diversity, mean number of alleles per locus (Na), allelic richness (Ar: the average number of alleles per locus rarefied to the smallest sample size), Hardy-Weinberg equilibrium, population inbreeding coefficient (Fis), and population differentiation (Fst) were estimated using Genetix (Belkir et al 1996-2004). Significance was determined at 95% confidence intervals based on 10000 permuta-tions. We performed an Isolation by Distance (IBD) analysis to investigate how the spatial distribution of samples can influence population differentiation patterns. We tested for IBD by performing a Mantel test between individual genetic distance and geographic distance with 9999 permutations to calculate significance using GeneAlEx (Peakall & Smouse 2001). We first performed the IBD with museum samples and later with con-temporary samples. We inferred the number of distinct genetic clusters (k) irrespective of the geographic origin of the samples using the Bayesian clustering analysis implemented in STRUCTURE 2.3.3 (Pritchard et al 2000). Simulations were run with a burn-in period of 50000 followed by an additional 500000 steps. We ran from 1 to 5 genetic clusters (k = 1-5) and 20 replicates for each k under an admixture model with correlated gene frequencies. We performed simulations with historical and contemporary samples, separately and all together. The prob-ability of k populations was calculated based on Δk, as described in Evanno et al (2005) and implemented in STRUCTURE HARVESTER (Earl & vonHoldt 2011), and a visual inspection of the plot of the lnP(D) as a function of k. We performed these analyses with the pooled sample set, separately on museum and contemporary individuals, and finally with location information as a prior (Northern, Central and Southern).
Genetic nuclear diversity through timeTo assess changes in genetic diversity through time we calculated individuals’ observed homozygosity us-ing cernicalin v.1.30 (Aparicio et al 2006). We used generalized linear models to assess the relationships between the individual’s homozygosity and its date and location (Balkans or Turkey) in R 2.11.1 software (R-Development Core Team 2011). Models were built with a normal distribution of errors and the identity link function. There was no evidence of overdispersion, and residuals fitted to a normal distribution, indicating that distributions and error structures were appropriate. In order to assess not only the loss of genetic diver-sity but also the change in allelic frequencies and therefore the action of genetic drift within populations, we assessed the correlation of the linearized genotypic distance, as implemented in GeneAlEx (Peakall & Smouse 2012), and the temporal distances in years between each pair of individuals with the Mantel test. We used 10000 permutations to assess significance.

6 www.LifeNeophron.eu
Bottleneck testWe tested whether the recent demographic decline of the Egyptian vulture populations left a detectable signal on contemporary genetic patterns using the software BOTTLENECK v.1.2.02 (Piry et al 1999), which tests whether there is a significant excess of heterozygosity in the sample with respect to that expected for the observed number of alleles under mutation-drift equilibrium (Cornuet & Luikart 1996). Since the power and reliability of the test is largely dependent on the mutation model and the mutation model of microsatel-lite markers is poorly known, we used three different mutation models to simulate data: the infinite allele model (IAM), the step-wise mutation model (SSM) and the two-phase mutation model (TPM). For the TPM, we used the parameterization recommended by Piry et al 1999 (5% multistep mutation events, distributed under a geometric function of variance =12), and a more relaxed model with 30% multistep mutations with variance 36. A one-tailed Wilcoxon signed-ranked test was performed to determine if the dataset exhibited a significant number of loci with heterozygosity excess, as expected in bottlenecked populations. This method has been shown to be capable of detecting recent population contractions (>4Ne generations ago).
Mitochondrial dataGenetic mitochondrial diversity and structureTo characterize the mitochondrial variation, we used partial sequences of the control region, which have already been shown to neatly discriminate between subspecies (Donázar et al 2002). Due to the low quality and small size of DNA obtained from museum samples, we redesigned a new pair of primers (Npe_CR2F: CTCTCTGCATGGYTCAGGAVTAG, Npe_CR2R: CAAGGAGTGCTAGGGGTGTA) for the amplification of a smaller (280 bp) but still informative fragment of Domain 1 spanning from R’4 to D-box, based on Roques et al (2004). We calculated for each geographic partition and period and for the global sample the number of haplotypes (h), haplotypic diversity (Hd), number of variable sites (S), nucleotide diversity (Pi) and the mean number of pairwise nucleotide differences (k) using DNAsp v.4.10 (Rozas & Rozas 1999). To explore the historical demog-raphy, we used Fu’s Fs and Tajima’s D statistic, and also analysed the mismatch distributions and computed the raggedness index of this distribution to assess past demographic trends using Arlequin 3.0 (Excoffier et al 2005). We also calculated genetic differentiation as pairwise Fst for haplotype frequency values between populations with 10000 permutations for p-values. We constructed a distance-based phylogenetic tree using the K2P substitution model as it has the smallest AIC determined by jModelTest (Darriba et al 2012) and the neighbour-joining algorithm, as implemented in MEGA 6 (Tamura et al 2013). We evaluated the statistical support for the internal branches using 10000 bootstrap replicates.
REsULTs
Genetic nuclear diversity and structureAll populations were in Hardy-Weinberg equilibrium and had genetic diversity values ranging from He = 0.586 in the historical population to 0.479 in the southern one (probably due to the small sample size), with the overall diversity for the contemporary Balkan’s population being 0.557. Similarly, the highest allelic richness adjusted for the minimum sample size was found in the historical population and the smallest one in the northern (AR= 2.365 and 2.208, respectively), with the overall allelic richness of the contemporary Balkan’s population being 2.278 (Table 1). Only the historical population showed values of Fis significantly different from zero, probably due to the historical structure in this area. We did not find a significant relationship between genetic and geographic distance in the contemporary Bal-kan’s population, regardless of whether the nearest population (Turkey) was included. We did not detect this relationship in historical samples either (Fig 2).

7 www.LifeNeophron.eu
Table 1. Attributes of historic and contemporary Greece, Bulgaria and Turkey populations. N= sample size, He= Expected heterozygosity, Ho= Observed heterozygosity, NA= Number of alleles, AR= Allelic richness weighted for the smallest sample size, h= number of haplotypes, S= number of polymorphic sites, Hd= hap-lotype diversity, Pi= nucleotide diversity, k= average number of nucleotide differences.
Nuc
leardata
Mito
chon
driald
ata
N
He
Ho
NA
AR
Fis
N
hS
Hd
Pi
k
HIST
ORICA
L
18
0.58
60.47
74.75
02.36
50.23
220
13
13
0.94
20.01
33.61
1
CONTE
MPO
RARY
Northern
70.50
60.52
73.08
32.20
80.04
37
59
0.90
50.01
43.90
5
Ce
ntral
23
0.54
10.58
34.41
72.24
8-0.054
22
17
20
0.97
40.01
74.63
6
So
uthe
rn
20.47
90.70
82.33
32.33
3-0.172
2
25
1.00
00.01
85.00
AllB
alka
n’s
32
0.55
70.57
94.58
32.27
8-0.024
31
21
20
0.96
80.01
64.44
3
Turkey
10
0.55
00.56
73.75
02.29
60.02
49
910
1.00
00.01
33.50
0

8 www.LifeNeophron.eu
Population differentiation measures (Fst) showed significant differentiation between historic and contempo-rary populations (Table 2; Above diagonal), except in the case of the southern Balkan population. Indeed, the historical Balkan population was more differentiated from the contemporary Balkan population (Fst = 0.050) than from the contemporary Turkish population (Fst = 0.030), but was still differentiated from the latter. This may indicate that genetic drift could have been affecting the Balkans in historical times or that there was a geographical pattern in this area. We also found significant differentiation values between the Northern and the Southern partition of the Balkan’s population.
Figire 2. Isolation by distance patterns in historic (A), contemporary Balkan’s population (B) and contem-porary with Turkish population (C). All plots show geographic distance (km) on the x-axis and the genetic distance on the y-axis.

9 www.LifeNeophron.eu
HISTORICAL CONTEMPORARY
Northern Central Southern Total TurkeyHISTORICAL - 0.055* 0.049* 0.071 0.050* 0.030*
CONTEMPORARY Northern 0.074* - 0.026 0.092* 0.001 0.036
Central 0.031* 0.012 - 0.054 -0.015 0.039*
Southern -0.007 0.068 0.019 - 0.033 0.020
All 0.034* -0.024 -0.033 -0.008 - 0.030*
TURKEY -0.003 0.015 0.004 0.000 0.003 -
Table 2. Genetic differentiation between pairs of populations, below the diagonal: mitochondrial Fst for hap-lotype frequencies; above the diagonal: pairwise differentiation Fst values for microsatellite markers. Aster-isk indicates significant values after 10000 permutations.
STRUCTURE analyses showed that all samples clustered in only one group, either when analysing all samples together or when independently analysing historical or contemporary samples. In addition, the most likely number of clusters was 1 even when setting locality or period as a prior. We could not assess changes in individual homozygosity among localities or periods with generalized linear models, probably due to the small sample size degree of freedom in each model. Nevertheless, we found evidence for changes in allelic frequencies when relating genetic and temporal distance (Fig. 3). This analysis showed that those individuals that were more distant in time, were also more distant genetically. This analy-ses and Fst values indicated changes in allelic frequencies through time between and within populations, an expected consequence of drift in declining populations.Bottleneck tests did not detect evidence of heterozygote excess, either when TPM or SMM mutation models were assumed. Heterozygote excess, indicative of recent declines, was only detected under an infinitive al-lele model in the northern of the Balkans partition (p<0.05).
Figure 3. Relationship between individual observed heterozygosity and time in Balkans and Anatolia.

10 www.LifeNeophron.eu
Genetic mitochondrial diversity and structure. We found a total of 36 haplotypes (21 for the current population and 13 for the historic one) defined by 22 variable sites (Table 1, Supplementary material: S-2), all of them being nucleotide substitutions (G+C = 0.536). Haplotype and nucleotide diversity were similar in historical and contemporary populations and both were lower than the one found in the Turkish population (Table 1). Most of the haplotypes were present at a low frequency and were unique for each area or population (Fig. 4, Supplementary material: S-3). We found that historical populations shared only 3 out of 13 haplotypes with the contemporary population. Although the same proportion was shared with the Turkish population, these haplotypes were not the same. Moreo-ver, the contemporary population shared only two out of nine possible haplotypes with Turkey.
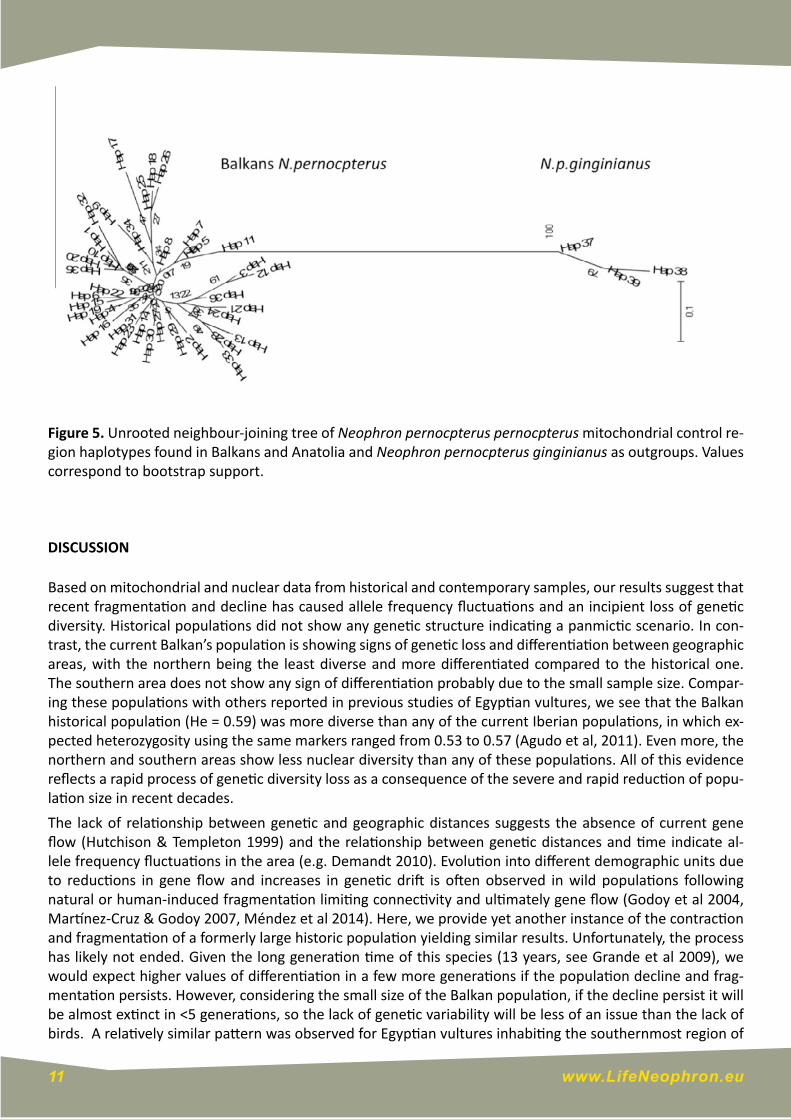
Figure 4. Frequencies of haplotypes in each area. Blue portions indicates exclusive haplotype for each area, other colours represent shared haplotypes. Size of partitions indicates the frequencies of the haplotype.We found a significant differentiation between the historic and the contemporary Balkan’s population (Fst=0.034; p = 0.027). This differentiation was lost when including the Turkish population (Table 2; Below diagonal). We did not find any significant mitochondrial differentiation between geographic sites in the Bal-kans.We present the Neighbour-Joining tree with bootstrap supports over 50%, and the Neophron percnopterus ginginianus haplotypes as outgroups (Fig. 5). The mitochondrial tree highlights a reciprocal and well-support-ed monophyletic grouping of N.p.p and N.p.g. We found evidence for population expansion due to an excess number of alleles as indicated by a negative and significant Fu’s in the Historic, Contemporary and Turkey populations (Supplementary material: S-4). We did not find any evidence with Tajima’s D.
11 www.LifeNeophron.eu
Figure 5. Unrooted neighbour-joining tree of Neophron pernocpterus pernocpterus mitochondrial control re-gion haplotypes found in Balkans and Anatolia and Neophron pernocpterus ginginianus as outgroups. Values correspond to bootstrap support.
DIsCUssIOn
Based on mitochondrial and nuclear data from historical and contemporary samples, our results suggest that recent fragmentation and decline has caused allele frequency fluctuations and an incipient loss of genetic diversity. Historical populations did not show any genetic structure indicating a panmictic scenario. In con-trast, the current Balkan’s population is showing signs of genetic loss and differentiation between geographic areas, with the northern being the least diverse and more differentiated compared to the historical one. The southern area does not show any sign of differentiation probably due to the small sample size. Compar-ing these populations with others reported in previous studies of Egyptian vultures, we see that the Balkan historical population (He = 0.59) was more diverse than any of the current Iberian populations, in which ex-pected heterozygosity using the same markers ranged from 0.53 to 0.57 (Agudo et al, 2011). Even more, the northern and southern areas show less nuclear diversity than any of these populations. All of this evidence reflects a rapid process of genetic diversity loss as a consequence of the severe and rapid reduction of popu-lation size in recent decades. The lack of relationship between genetic and geographic distances suggests the absence of current gene flow (Hutchison & Templeton 1999) and the relationship between genetic distances and time indicate al-lele frequency fluctuations in the area (e.g. Demandt 2010). Evolution into different demographic units due to reductions in gene flow and increases in genetic drift is often observed in wild populations following natural or human-induced fragmentation limiting connectivity and ultimately gene flow (Godoy et al 2004, Martínez-Cruz & Godoy 2007, Méndez et al 2014). Here, we provide yet another instance of the contraction and fragmentation of a formerly large historic population yielding similar results. Unfortunately, the process has likely not ended. Given the long generation time of this species (13 years, see Grande et al 2009), we would expect higher values of differentiation in a few more generations if the population decline and frag-mentation persists. However, considering the small size of the Balkan population, if the decline persist it will be almost extinct in <5 generations, so the lack of genetic variability will be less of an issue than the lack of birds. A relatively similar pattern was observed for Egyptian vultures inhabiting the southernmost region of

12 www.LifeNeophron.eu
the Iberian Peninsula, which also suffered isolation of neighbouring breeding areas and a strong population decline (Agudo et al 2011). It seems unlikely that this situation will be reversed by natural dispersal: Balkan and Turkish populations mix during migration and in the Sahelian wintering areas (see Meyburg et al 2004; Oppel et al 2015, VCF 2014), but the probability of individuals moving between distant breeding nuclei could be very low, based on evidence from other populations. In fact, Egyptian vultures are highly philopatric with natal dispersal distances less than 50 km (Grande et al 2009), although some individuals may disperse up to 550 km (Elorriaga et al 2009, Lieury et al. 2015). The Turkish population could be a possible source for reinforcement within ongoing conservation programs as it is less differentiated from the historical Balkan’s than the contemporary Balkans population. However, we would expect an increase in this differentiation with time if there are no management actions that re-verse this process. The low genetic diversity, the increase in structure and some evidence of bottlenecks in the different Balkans areas, especially in the northern one, indicates that translocations would be a short-term management solution. The question that arises here is whether the Balkans population is the one dif-ferentiating from the historic and the rest of the Egyptian vulture populations or, on the contrary, it is the Turkish population that is differentiating. To answer this question, it is essential to include more samples of other closer populations, such as those in the Middle East or other populations in Europe. Nevertheless, the limited available information on Anatolia suggests that this area is well-connected and that the population that remains there is still dense. Moreover, there is no sign of a disconnection from other areas. On the con-trary, it has been shown that the Balkans population is largely reduced and disconnected from other areas, in most cases due to the extinction of the closest local populations in Italy, Montenegro and Croatia. This study supports that Balkan’s population is differentiating from the historical one more quickly than Turkey’s population. Given this, it would be feasible to reinforce the Balkan population with birds from Turkey. Of course, this type of active management cannot be approached without addressing the main causes of popu-lation decline, and taking into account potential negative effects associated with the movement of animals between isolated breeding nuclei, such as the risk of disease transmission, behavioural disruption, lower fit-ness in novel habitats in the presence of local adaptations, and negative demographic effects on the donor populations (Pérez et al 2012). The characterization of the vanishing Balkan population of Egyptian vultures demonstrates the importance of understanding structure at a fine spatial scale following rapid fragmentation and general decline in the entire surviving breeding nucleus. Historically, there was a unique panmictic population in the Balkans and Anatolia, and today the Balkans populations are isolated and extremely small. Bottlenecks increase rates of inbreeding, loss of genetic variation and fixation of deleterious mutations, thereby reducing adaptive po-tential and increasing the probability of extinction (Frankham et al 2002). In addition, as we explain above, the natural connection between the Balkan and the Turkish populations is becoming increasingly unlikely with only few pairs left in between (Velevski et al 2015). Under this scenario, and not only due to genetic constraints but also demographic factors, the maintenance of the last Balkan populations of this scavenger seem to be extremely precarious and extinction may be unavoidable within a few decades, as has been pre-dicted for other Mediterranean populations challenged with similar conservation problems (Sanz-Aguilar et al 2015). Therefore, urgent conservation measures should be taken to stop the main limiting factors associ-ated with non-natural mortality (Velevski et al 2015) as well as to revert the negative effects of genetic drift. Management programs should include the reinforcement of the populations and long-term genetic monitor-ing in order to avoid inbreeding depression, to maximize the genetic diversity and thereby, to increase the long-term population viability (Gautschi et al 2003).

13 www.LifeNeophron.eu
ACKnOWLEDGEMEnTs
This study was supported by the LIFE+ project “The Return of the Neophron” (LIFE10 NAT/BG/000152, www.LifeNeophron.eu) funded by the European Union and co-funded by the A. G. Leventis Foundation, and the CGL2012-40013-C02-01-02 Spanish Government and EU FEDER funds. Two micro-projects supported by the Severo Ochoa Excellence Award from the Ministerio de Economia y Competitividad (SEV-2012-0262) also contributed. We thank V. Dobrev, V. Arkumarev, D. Dobrev, I. Angelov, T. Angelova, E. Kret, T. Skartsi, V. Sara-via, T. Bounas, D. Vavylis, L. Sidiropoulos, A. Evangelidis, S. Mumun, V. Angelova, Y. Klimentova-Nikolova, I. Klimentova, S. Dyulgerova, P. Babakas, A. Venetakis, S. Isfendiyaroğlu, E. Yilmaz, V. Sideris, G. Chondros, E. R. Buechley, Ç. H. Şekercioğlu, G. Ceccolini, Z. Boev and S. C. Nikolov, for sample collection, and L. Soriano and A. Piríz for their valuable help in the laboratory. S. Oppel and E. Ball provided constructive comments on an earlier draft of this report. Logistical support was provided by Laboratorio de Ecología Molecular, Estación Biológica de Doñana, CSIC (LEM-EBD).
REFEREnCEs
1. Agudo R, Roques S, Galarza JA, Rico, C, Hiraldo, F , Donázar, JA. 2008. 2. Isolation and characterization of 18 microsatellite loci in the Egyptian vulture (Neophron percnopterus).
Conservation Genetics 9: 1345 - 13483. Agudo R, Rico C, Hiraldo F, Donázar, J.A. 2011. Evidence of connectivity between continental and differen-
tiated insular populations in a highly mobile species: implications in conservation. Diversity and Distribu-tions 17: 1 - 12
4. Allendorf FW, Luikart G. 2007. Conservation and the Genetics of Populations. Malden, MA: Blackwell5. Angelov I, Hashim I, Oppel S. 2013. Persistent electrocution mortality of Egyptian Vultures Neophron
percnopterus over 28 years in East Africa. Bird Conservаtion International 23: 1 - 66. Aparicio JM, Ortego J, Cordero PJ. 2006. What should we weigh to estimate heterozygosity, alleles or loci?
Molecular Ecology 15: 4659 - 46657. Arabadzhiev I. 1962. The Birds of Prey in Bulgaria. Sofia: Science and art. (in Bulgarian)8. Arshad M, Pedall I, González J., Wink M. 2009. Genetic variation of four gyps species (Gyps bengalensis,
G. africanus, G. indicus and G. fulvus) based on microsatellite analysis. Journal of Raptor Research 43: 227 - 236
9. Belkhir K, Borsa P, Chikhi L, Raufaste N, Bonhomme F. 1996-2004. GENETIx 4.05, logiciel sous Windows TM pour la génétique des populations. Laboratoire Génome, Populations, Interactions, CNRS UMR 5000, Université de Montpellier II, Montpellier (France)
10. Cornuet JM, Luikart G. 1996. Description and power analysis for two tests for detecting recent population bottlenecks from allele frequency data. Genetics 144: 2001 - 2014
11. Darriba D, Taboada GL, Doallo R, Posada D. 2012. jModelTest 2: more models, new heuristics and parallel computing. Nature Methods 9: 772
12. Demandt MH. 2010. Temporal changes in genetic diversity of isolated populations of perch and roach. Conservation Genetics 11: 249 - 255
13. Dirzo R, Young HS, Galetti M et al. 2014. Defaunation in the Anthropocene. Science 25: 401 - 40614. Donázar JA, Negro JJ, Palacios CJ, et al. 2002. Description of a new subspecies of the Egyptian Vulture
(Accipitridae: Neophron percnopterus) from the Canary Islands. Journal of Raptor Research 36: 17 - 2315. Earl DA, vonHoldt BM. 2012. STRUCTURE HARVESTER: a website and program for visualizing STRUCTURE
14 www.LifeNeophron.eu
output and implementing the Evanno method. Conservation Genetics Resources 4: 359 - 361 16. Elorriaga J, Zuberogoitia I, Castillo I, Azkona A, Hidalgo S, Astorkia L, Ruiz-Moneo F, Iraeta A. 2009. First
documented case of long-distance dispersal in the Egyptian Vulture (Neophron percnopterus). Journal of Raptor Research 43: 142 - 145
17. Evanno G, Regnaut S, Goudet J. 2005. Detecting the number of clusters of individuals using the software STRUCTURE: a simulation study. Molecular Ecology 14: 2611 - 2620
18. Excoffier L, Laval G, Schneider S. 2005. Arlequin ver. 3.0: An integrated software package for population genetics data analysis. Evolutionary Bioinformatics Online 1: 47 - 50
19. Frankham R, Ballou J, Briscoe D. 2002. Introduction to conservation genetics. Cambridge University Press, New York
20. Gangoso L, Agudo R, de la Riva M, et al. 2013. Reinventing mutualism between humans and wild fauna: insights from vultures as ecosystem services providers. Conservation Letters 6: 172 - 179
21. Gautschi B, Tenzer I, Muller JP, Schmid B. 2000. Isolation and characterization of microsatellite loci in the bearded vulture (Gypaetus barbatus) and cross-amplification in three Old World vulture species. Molecu-lar Ecology 9: 2193 - 2195
22. Gautschi B, Jacob G, Negro JJ et al. 2003. Analysis of relatedness and determination of the source of founders in the captive Bearded vulture, Gypaetus barbatus, population. Conservation Genetics 4: 479 - 490
23. Godoy JA, Negro JJ, Hiraldo F, Donázar JA. 2004. Phylogeography, genetic structure, and diversity in the endangered bearded vulture (Gypaetus barbatus, L.) as revealed by mitochondrial DNA. Molecular Ecol-ogy 13: 371 - 390
24. Gouar P, Rigal M, Boisselier-Dubayle C, Sarrazin F, Arthur C, Choisy JP, Hatzofe O, Henriquet S, Lécuyer P, Tessier C, Susic GS. 2008 Genetic variation in a network of natural and reintroduced populations of Grif-fon vulture (Gyps fulvus) in Europe. Conservation Genetics 9: 349 - 359
25. Grande JM, Serrano D, Tavecchia G, Carrete M, Ceballos O, Díaz-Delgado R, Tella JL, Donázar JA. 2009. Survival in a long-lived territorial migrant: effects of life-history traits and ecological conditions in winter-ing and breeding areas. Oikos 118: 580 - 590
26. Groombridge JJ, Dawson DA, Burke T, Prys-Jones R, Brooke ML, Shah N. 2009. Evaluating the demographic history of the Seychelles kestrel (Falco araea): genetic evidence for recovery from a population bottleneck following minimal conservation management. Biological Conservation 142: 2250 - 2257
27. Grubač BR. 1989. The Egyptian Vulture Neophron percnopterus in Macedonia. In: Meyburg, B. U. and Chancellor, R. D. (Eds.) Raptors in the modern world. Berlin, London and Paris: WWGBP: 331 - 333
28. Grubač BR. 1999. The Egyptian Vulture Neophron percnopterus (Linnaeus, 1758) in Serbia. Protection of Nature 51: 123 - 131
29. Handrinos G, Akriotis T. 1997. The birds of Greece. London: Christopher Helm.30. Hellborg L, Walker CW, Rueness EK, Stacy JE, Kojola I, Valdmann H, Vila C, Zimmermann B, Jakobsen KS, El-
legren H. 2002. Differentiation and levels of genetic variation in northern European lynx (Lynx lynx) popu-lations as revealed by microsatellite and mitochondrial DNA analysis. Conservation Genetics 3: 97 - 111
31. Hernández M, Margalida A. 2009. Poisonrelated mortality effects in the endangered Egyptian vulture (Neophron percnopterus) population in Spain. European Journal Wildlife Research 55: 415 - 423
32. Hoffman M, Hilton-Taylor C, Angulo A et al. 2010. The Impact of Conservation on the Status of the World’s Vertebrates. Science 10: 1503 - 1509
33. Hovarth H, Martínez-Cruz B, Negro JJ, et al. 2005 An overlooked DNA source for non-invasive genetic analysis in birds. Journal of Avian Biology 36: 84 - 88
34. Hutchison DW, Templeton AR. 1999. Correlation of pairwise genetic and geographic distance measures:

15 www.LifeNeophron.eu
Inferring the relative influences of gene flow and drift on the distribution of genetic variability. Evolution 53: 1898 - 1914
35. Kurtev M, Iankov P, Angelov I. 2008. National action plan for conservation of the Egyptian Vulture (Ne-ophron percnopterus) in Bulgaria. Sofia: Bulgarian Society for Protection of Birds.
36. Lieury N, Gallardo M., Ponchon C, Besnard A, Millon A. 2015. Relative contribution of local demography and immigration in the recovery of a geographically-isolated population of the endangered Egyptian vul-ture. Biological Conservation 191: 349 - 356
37. Ljucović V. 1995 For the birds of the canyon of river Cijevna and the mountain Kaženik in the eastern Montenegro. Ciconia 5: 67 - 68
38. Martínez-Cruz B, Godoy JA, Negro JJ. 2007. Population fragmentation leads to spatial and temporal ge-netic structure in the endangered Spanish imperial eagle. Molecular Ecology 16: 477 - 486
39. Martínez-Cruz B, Godoy JA. 2007. Genetic evidence for a recent divergence and subsequent gene flow between Spanish and Eastern imperial eagles. BMC Evolutionary Biology 7: 170
40. Marinković S, Orlandić L, Micković B, Karadžić B. 2007. Census of vultures in Herzegovina. Vulture News 56: 14 - 28
41. Méndez M, Tella JL, Godoy JA. 2011. Restricted gene flow and genetic drift in recently fragmented popu-lations of an endangered steppe bird. Biological Conservation 144: 2615 - 2622
42. Méndez M, Vögeli M, Tella JL, Godoy JA. 2014. Joint effects of population size and isolation on genetic erosion in fragmented populations: finding fragmentation thresholds for management. Ecological Appli-cations 7: 506 - 518
43. Meyburg B-U, Gallardo M, Meyburg C, Dimitrova E. 2004. Migrations and sojourn in Africa of Egyptian Vultures (Neophron percnopterus) tracked by satellite. Journal of Ornithology 145: 273 - 280
44. Nisbet ICT, Smout TC. 1957. Autumn observations on the Bosphorus and Dardanelles. Ibis 99: 483 - 49945. Ogada D, Shaw P, Beyers RL, Buij R, Murn C, Thiollay JM, Beale CM, Holdo RM, Pomeroy D, Baker N, Krüger
SC, Botha A, Virani MZ, Monadjem A, & Sinclair ARE. 2015. Another Continental Vulture Crisis: Africa’s Vultures Collapsing toward Extinction. Conservation Letters, in press.
46. Oppel S, Dobrev V, Arkumarev V, Saravia V, Bounas A, Kret E, Velevski M, Stoychev S, Nikolov SC. 2015. High juvenile mortality during migration in a declining population of a long-distance migratory raptor. Ibis 157: 545 - 557.
47. Packer C, Pusey AE, Rowley H, Gilbert DA, Martenson J, O’Brien SJ. 1991. Case study of a population bot-tleneck: lions of the Ngorongoro crater (Tanzania). Conservation Biology 5: 219 - 230
48. Patev P. 1950. The birds of Bulgaria. Sofia: Bulgarian Academy of Sciences.49. Peakall R, Smouse PE. 2012. GenAlEx 6.5: genetic analysis in Excel. Population genetic software for teach-
ing and research-an update. Bioinformatics 28: 2537 - 253950. Peakall R, Smouse PE. 2006. GENALEx 6: genetic analysis in Excel. Population genetic software for teach-
ing and research. Molecular Ecology Notes 6: 288 - 29551. Pérez I, Anadón JD, Díaz M, Nicola GG, Tella JL, Giménez A. 2012. What is wrong with current transloca-
tions? A review and decision-making proposal. Frontiers in Ecology and Environment 10: 494 - 50152. Pimm SL, Jenkins CN, Abell R, Brooks TM, Gittleman JL, Joppa L, Raven PH, Roberts CM, Sexton JO. 2014.
The biodiversity of species and their rates of extinction, distribution, and protection. Science 344: 618753. Piry S, Luikart G, Cornuet JM. 1999. Bottleneck: A computer program for detecting recent reductions in
the effective population size using allele frequency data. The Journal of Heredity 4: 9054. Pritchard JK, Stephens M, Donnelly P. 2000. Inference of Population Structure Using Multilocus Genotype
Data. Genetics 155: 945 - 959
16 www.LifeNeophron.eu
55. R Development Core Team. 2011. R: A language and environment for statistical computing. R Foundation for Statistical Computing, Vienna, Austria
56. Roques S, Godoy JA, Negro JJ, et al. 2004. Organization and variation of the mitochondrial control region in two vulture species, Gypaetus barbatus and Neophron percnopterus. Journal of Heredity 95: 332 - 337
57. Rozas J, Rozas R. 1999. DNAsp version3: an integrated program for molecular population genetics and molecular evolution analysis. Bioinformatics 15: 174 - 175
58. Sambrook J, Fritsch EF, Maniatis T. 1989. Molecular cloning: a laboratory manual. 2nd ed. Cold Spring Harbor Laboratory Press, New York
59. Sanz-Aguilar A, Sánchez-Zapata JA, Carrete M, Benítez JA, Ávila E, Arenas R, Donázar JA. 2015. Action on multiple fronts, illegal poisoning and wind farm planning, is required to reverse the decline of the Egyp-tian vulture in Southern Spain. Biological Conservation 187: 10 - 18
60. Şen B. 2013. Vultures in Turkey. In: Andevski, J. (Ed.) Vulture Conservation in the Balkan Peninsula and Adjacent Regions. Skopje: Vulture Conservation Foundation. Pp.34
61. Spong G, Hellborg L. 2002. A near-extinction event in lynx: do microsatellite data tell the tale? Conserva-tion Ecology 6: 15
62. Sušić G. 1993. Re-introducing extinct bird species to areas in Croatia - utopia or reality? Soc. Ecol. Zagreb 2: 91 - 97
63. Taberlet P, Griffin S, Goossens B, et al. 1996. Reliable genotyping of samples with very low DNA quantities using PCR. Nucleic Acids Res 24: 3189 - 3194
64. Tamura K, Stecher G, Peterson D, Filipski A, Kumar S. 2013. MEGA6: Molecular Evolutionary Genetics Analysis Version 6.0. Molecular Biology and Evolution: 2725 - 2729
65. Thiollay J. 2006. The decline of raptors in West Africa: long-term assessment and the role of protected areas. Ibis 148: 240 - 254
66. VCF (Vulture Conservation Foundation). 2014. Two more Egyptian vultures tagged in Eastern Turkey in a VCF supported project. Available at http://www.4vultures.org/2014/06/15/two-more-egyptian-vultures-tagged-in-eastern-turkey-in-a-vcf-supported-project/ [Accessed 03 March 2015]
67. Velevski M, Nikolov SC, Hallmann B, Dobrev V, Sidiropoulos L, Saravia V, Tsiakiris R, Arkumarev V, Galanaki A, Kominos T, Stara K, Kret E, Grubač B, Lisičanec E, Kastritis T, Vavylis D, Topi M, Hoxha B, Oppel S. 2015. Population decline and range contraction of the Egyptian Vulture Neophron percnopterus on the Balkan Peninsula. Bird Conservation International, in press.
68. Velevski M, Grubač B, Tomović L. 2014. Population viability analysis of the Egyptian Vulture Neophron percnopterus in Macedonia and implications for its conservation. Acta Zoologica Bulgarica, 66: 43 - 58
69. Virani MZ, Kendall C, Njoroge P, Thomsett S. 2011. Major declines in the abundance of vultures and other scavenging raptors in and around the Masai Mara ecosystem, Kenya. Biological Conservation 144: 746 – 752
70. xirouchakis S (ed.). In prep. National Species Action Plan for the Egyptian Vulture in Greece.71. Wacher T, Newby J, Houdou I, Harouna A, Rabeil T. 2013. Vulture observations in the Sahelian zones of
Chad and Niger. Bull ABC 20: 286 - 199

17 www.LifeNeophron.eu
sUPPLEMEnTARY MATERIAL
Table S-1. Relationships of the samples used in this study.
Id_Laboratory Sample Type Field_Code Year Site Supplier
87 Feather in alcohol BG1 20.7.2010 2010 Bulgaria BSPB / BirdLife Bulgaria
89 Feather in alcohol BG2 29.7.2012 2012 Bulgaria BSPB / BirdLife Bulgaria
90 Feather in alcohol BG3 29.7.2012 2012 Bulgaria BSPB / BirdLife Bulgaria
91 Feather in alcohol BG4 27.7.2012 2012 Bulgaria BSPB / BirdLife Bulgaria
92 Feather in alcohol BG5 29.7.2012 2012 Bulgaria BSPB / BirdLife Bulgaria
94 Feather in alcohol BG6 27.7.2012 2012 Bulgaria BSPB / BirdLife Bulgaria
95 Feather in alcohol BG7 28.7.2012 2012 Bulgaria BSPB / BirdLife Bulgaria
96 Feather in alcohol BG8 26.7.2012 2012 Bulgaria BSPB / BirdLife Bulgaria
97 Feather in alcohol BG9 2.8.2010 2010 Bulgaria BSPB / BirdLife Bulgaria
99 Feather in alcohol BG10 12.7.2010 2010 Bulgaria BSPB / BirdLife Bulgaria
103 Feather in alcohol BG11 2.8.2010 2010 Bulgaria BSPB / BirdLife Bulgaria
106 Feather in alcohol BG12 26.7.2012 2012 Bulgaria BSPB / BirdLife Bulgaria
107 Feather in alcohol BG13 27.7.2012 2012 Bulgaria BSPB / BirdLife Bulgaria
108 Feather in alcohol BG14 27.7.2010 2010 Bulgaria BSPB / BirdLife Bulgaria
110 Feather in alcohol BG15 2.8.2012 2012 Bulgaria BSPB / BirdLife Bulgaria
114 Feather in alcohol BG16 26.7.2012 2012 Bulgaria BSPB / BirdLife Bulgaria
117 Feather in alcohol BG17 29.7.2012 2012 Bulgaria BSPB / BirdLife Bulgaria
118 Feather in alcohol BG18 14.7.2010 2010 Bulgaria BSPB / BirdLife Bulgaria
119 Feather in alcohol BG19 27.7.2012 2012 Bulgaria BSPB / BirdLife Bulgaria
120 Feather in alcohol BG20 6.8.2010 2010 Bulgaria BSPB / BirdLife Bulgaria
121 Feather in alcohol BG21 1.8.2012 2012 Bulgaria BSPB / BirdLife Bulgaria
122 Feather in alcohol BG22 15.7.2010 2010 Bulgaria BSPB / BirdLife Bulgaria
123 Feather in alcohol BG23 5.8.2010 2010 Bulgaria BSPB / BirdLife Bulgaria
126 Feather in alcohol BG24 16.7.2010 2010 Bulgaria BSPB / BirdLife Bulgaria
146 Umbilical clot NMNH3 1903 Bulgaria National museum of Natural History Sofia
149 Umbilical clot NMNH1 1895 Bulgaria National museum of Natural History Sofia
152 Umbilical clot NMNH5 1898 Bulgaria National museum of Natural History Sofia
155 Umbilical clot NHM-Kotel2 1925 Bulgaria Natural History Museum of Kotel
156 Umbilical clot NMNH6 <1910 Bulgaria National museum of Natural History Sofia
167 Umbilical clot NMNH4 1904 Bulgaria National museum of Natural History Sofia
1 Blood in ethanol GR1 2012 Greece WWF Greece
5 Blood in ethanol GR2 2012 Greece WWF Greece
7 Feather in alcohol GR3 2012 Greece WWF Greece
8 Feather in alcohol GR4 2012 Greece WWF Greece
9 Feather in alcohol GR5 2012 Greece WWF Greece
12 Feather in alcohol GR6 2013 Greece HOS / BirdLife Greece
128 Feather in alcohol GR7 2013 Greece HOS / BirdLife Greece
129 Blood in ethanol GR8 2013 Greece WWF Greece
138 Umbilical clot 528 1877 Greece Athens Zoological Museum
140 Umbilical clot 344 1853 Greece Athens Zoological Museum
144 Umbilical clot 332 1859 Greece Athens Zoological Museum
166 Umbilical clot NMNH8 1899 Greece National museum of Natural History Sofia
927 Umbilical clot GR9 1990 Greece Natural History Museum of Vitsa
928 Footpad tissue GR10 1965 Greece Natural History Museum of the University of Thessaloniki

18 www.LifeNeophron.eu
Table S-2. Differences in the 36 haplotypes sequences (406bp) found in Greece, Bulgaria and Turkey. H = hap-lotype, N = Haplotype frequence. Column headers indicate nucleotide positions.
H NVariableSites
23 24 26 34 40 46 47 48 50 51 55 59 60 75 80 84 99 119 138 144 160 2611 3 A G T C T G A T G T G C G G A A C T A A C C2 2 . A . T . A . . . C . . . . . . T . . . T T3 6 . . . . . . . . . . . . . . . . . . . . T T4 1 . A . T . . . . . . . T . . . . . . . . T T5 1 . . . . . A . . . . . . . . . . T . . . T T6 1 . . . T . . G . . . . . . . . . . . . . T T7 1 . . . . . A . . . . . . . . . . . . . . T T8 1 . . . T C A . . . C . . . . . . . . . . . .9 1 . . . . . A . . . C . . . . . . . . . . T T10 2 . . . . . . . . . . . . . . . . . . . . T T11 2 . . . . . A . . . . . . . . . . . . . G . .12 6 . . . . C A . . . C . . . . . . . . . . T T13 2 . . . . . . . . . . . . . . . . . . . . T T14 2 . . C . . A . C . C . . . . . . T . G . T T15 3 . . . . . . . . A . . . . . . . . . . . T T16 2 . . . T . A . . . . . . . . . G . C . . T T17 1 . . . . . . . . . C . . . . . . T . . . . .18 1 . . . . C A . . . . . . . . . . . . . . . .19 1 . . . . . . . . . . . . . . . . . . . . T T20 1 . . . . C A . . . C . . . . . . . . . . T T21 1 . . . . . . . . . . . . . . . . . . . . T .22 1 . . . . . . . . A . . . . . . . . . . . T .23 1 . . . T . . . . . . . . . A . . . . . . T T24 1 T . . T . . . . . . . . . . . . . . . G T T25 1 . . . . . . . . . C . . . . . . T . . . T T26 2 . . . T . . . . . . . . . A . G . C . . T T27 4 . A . T . . . . . . . T . . . . . . . . T T28 4 . . . . . A . . . . . . . . . . . . . . T T29 1 . . . . . . . . . . . T . . . . . . . . T T30 1 . . . . . . . . . . . . . . . . . . . . T T31 1 T . . T . . . . . . . . . . . . . . . . T .32 1 . . . T . . . . . C A . A . . G . . . . T T33 1 . . . . C A . . . C . . . . . . . . . . T .34 1 . . . . . . . . . . . . . . G . . . . . . T35 1 . . . . . A . . . . . . . . . . . . . . T .36 1 . A . T . . . . . . . T . . . . . . . . . .
Id_Laboratory Sample Type Field_Code Year Site Supplier
927 Umbilical clot GR9 1990 Greece Natural History Museum of Vitsa
928 Footpad tissue GR10 1965 Greece Natural History Museum of the University of Thessaloniki
929 Feather NHMC 80.4.45.8 1929 Greece Natural History Museum of Crete
150 Umbilical clot NMNH7 1893 Turkey National museum of Natural History Sofia
164 Umbilical clot NMNH2 1893 Turkey National museum of Natural History Sofia
165 Umbilical clot NMNH9 1894 Turkey National museum of Natural History Sofia
1532 DNA Np1532 2014 Turkey Local collaborators
1533 DNA Np1533 2014 Turkey Local collaborators
1534 DNA Np1534 2014 Turkey Local collaborators
1535 DNA Np1535 2014 Turkey Local collaborators
1536 DNA Np1536 2014 Turkey Local collaborators
1553 DNA Aroj 2014 Turkey Koç University
1554 DNA Egypt 2014 Turkey Koç University
1555 DNA ná 2014 Turkey Koç University
1556 DNA Rgdv 2014 Turkey Koç University

19 www.LifeNeophron.eu
Table S-3. Frequencies of the 36 haplotypes found in historic and contemporary populations. N = number of sequences, h = number of haplotypes.
N
h1
23
45
67
89
1011
12
13
14
15
16
17
18
19
20
21
22
23
24
25
26
27
28
29
30
31
32
33
34
35
36
Historic
20
13
3
22
11
11
11
11
41
Contem
poraryNorth
75
1
22
11
Ce
ntre22
17
11
23
21
11
11
11
11
12
1
South
22
1
1
Turkey
9
9
11
1
1
11
11
1
20 www.LifeNeophron.eu
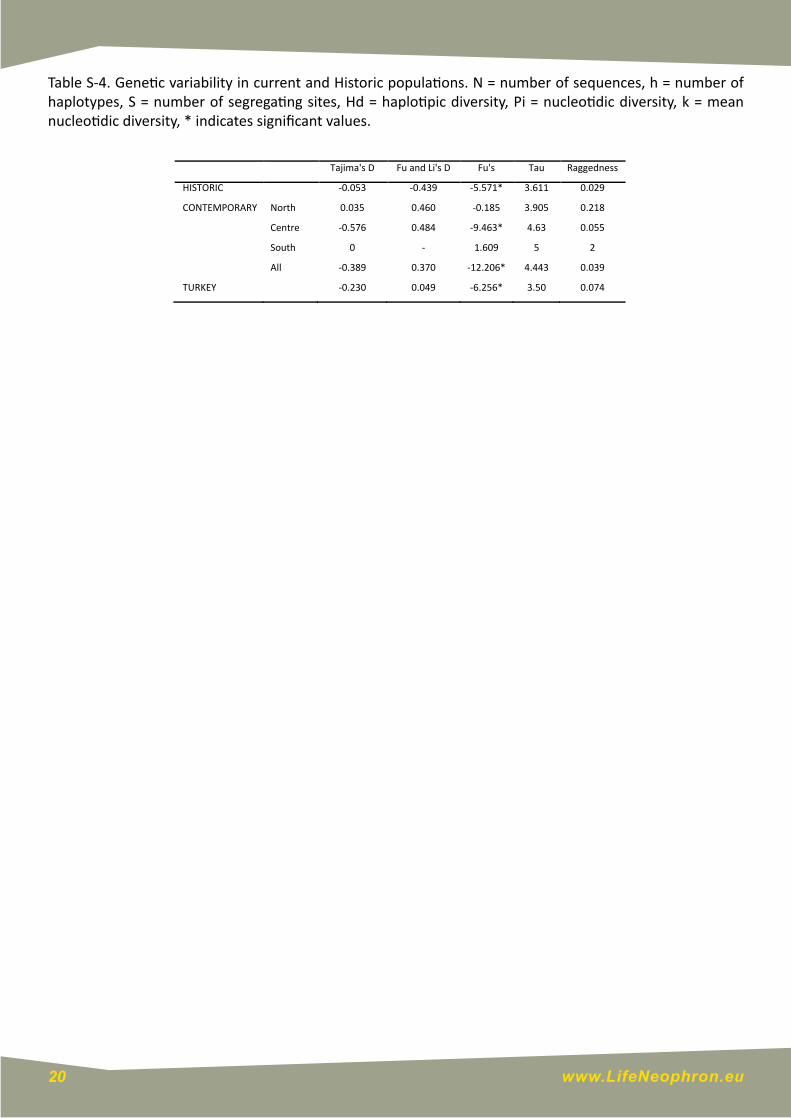
Table S-4. Genetic variability in current and Historic populations. N = number of sequences, h = number of haplotypes, S = number of segregating sites, Hd = haplotipic diversity, Pi = nucleotidic diversity, k = mean nucleotidic diversity, * indicates significant values.
Tajima'sD FuandLi'sD Fu's Tau Raggedness
HISTORIC -0.053 -0.439 -5.571* 3.611 0.029
CONTEMPORARY North 0.035 0.460 -0.185 3.905 0.218
Centre -0.576 0.484 -9.463* 4.63 0.055
South 0 - 1.609 5 2
All -0.389 0.370 -12.206* 4.443 0.039
TURKEY -0.230 0.049 -6.256* 3.50 0.074