genesis of trondhjemite by low-pressure fraction anatexis
TRANSCRIPT
Eastern Kentucky University Eastern Kentucky University
Encompass Encompass
EKU Faculty and Staff Scholarship Faculty and Staff Scholarship Collection
2021
Genesis of Trondhjemite by Low-pressure Fraction Anatexis of Genesis of Trondhjemite by Low-pressure Fraction Anatexis of
Hornblende-gabbro at Alvand Plutonic Complex (Hamedan, NW Hornblende-gabbro at Alvand Plutonic Complex (Hamedan, NW
Iran): Insights from Geochemical Modelling. Iran): Insights from Geochemical Modelling.
Federico Lucci Universita Roma Tre
Adel Saki Shahid Chamran University of Ahvaz, Iran
Mirmohammad Miri Shahid Chamran University of Ahvaz, Iran
Ahmad Rabiee Universita Roma Tre
John C. White Eastern Kentucky University, [email protected]
Follow this and additional works at: https://encompass.eku.edu/fs_research
Part of the Geochemistry Commons, Geology Commons, and the Tectonics and Structure Commons
Recommended Citation Recommended Citation Lucci, F., Saki, A., Miri, M., Rabiee, A., White, J.C., 2021, Genesis of Trondhjemite by Low-pressure Fraction Anatexis of Hornblende-gabbro at Alvand Plutonic Complex (Hamedan, NW Iran): Insights from Geochemical Modelling. Arabian Journal of Geosciences, v. 14, article 1788, 20 p. (doi: 10.1007/s12517-021-08104-0)
This Article is brought to you for free and open access by the Faculty and Staff Scholarship Collection at Encompass. It has been accepted for inclusion in EKU Faculty and Staff Scholarship by an authorized administrator of Encompass. For more information, please contact [email protected].

3RD CAJG 2020
Genesis of trondhjemite by low-pressure low-melt fraction anatexisof hornblende-gabbro at Alvand Plutonic Complex (Hamedan, NWIran): insights from geochemical modelling
Federico Lucci1 & Adel Saki2 & Mirmohammad Miri2 & Ahmad Rabiee1& John Charles White3
Received: 12 May 2021 /Accepted: 22 July 2021# The Author(s) 2021
AbstractAmphibole-dominated dehydration melting of gabbro is the primary process responsible for the genesis of adakites, low-Ktonalites, modern trondhjemites, and plagiogranites as well as Archean tonalite-trondhjemite-granodiorite suites that represent theearliest examples of continental crust. Previous literature has mostly focused on the role of Al-rich amphibole during anatexis of amafic source and many of these studies have investigated this process through experimental melting runs. However, due toexperimental boundary conditions, little is known about partial melting of amphibole-bearingmafic rock at temperatures < 800°Cfor upper crustal conditions (pressure < 500 MPa). Classic and forward thermobarometric modelling suggests that in situtrondhjemite leucosomes, hosted by Cheshmeh-Ghasaban mafic metatexites (Alvand Plutonic Complex, Hamedan, NW Iran),represent a rare natural case study of a low-temperature incipient amphibole-dominated anatectic event of a mafic source with aprimary assemblage (Pl+Hbl+Cpx+Bt+Opx) typical of a hornblende-bearing gabbroic rock.
Keywords Anatexis . Trondhjemite . Partial meltingmodelling . Thermobarometry . Sanandaj-Sirjan Zone . Iran
Introduction
Crustal anatexis characterized by melt segregation and extrac-tion is considered one of the key processes for the genesis oflarge volumes of felsic magmas and therefore also for conti-nental crustal growth and differentiation (e.g., Clemens 1990;Vielzeuf and Vidal 1990; Johannes and Holtz 1996; Clemensand Watkins 2001; Kriegsman 2001; Ratajeski et al. 2005;Sisson et al. 2005; Gao et al. 2016; Rossetti et al. 2020; Sakiet al. 2021). Furthermore, crustal anatectic events mainly
occur through amphibole-, biotite-, and muscovite-dehydration melting reactions (e.g., Clemens 1990; Gaoet al. 2016 and references therein) capable of producing meltswith particular chemical characteristics (e.g., Clemens 1990;Clemens and Stevens 2012; Johannes and Holtz 1996; PatiñoDouce 1999; Castro 2013). Over the past few years, meltingexperiments have been performed at pressures (P) up to 3.2GPa and temperatures (T) up to 1100°C (see Gao et al. 2016,and references therein) to help understand closed-systemfelsic magma generation from partial melting of protolithsvarious compositions (e.g., Beard and Lofgren 1991; Castroet al. 1999; Sisson et al. 2005; Laurie and Stevens 2012;Skjerlie and Patiño Douce 1995, 2002; Watkins et al. 2007;Conrad et al. 1988; Skjerlie and Johnston 1996; Vielzeuf andMontel 1994; Montel and Vielzeuf 1997;Castro et al. 1999;García-Arias et al. 2012). A review of the existing chemistrydata of experimental melts frommafic tometapelitic protolithswas recently published by Gao et al. (2016). Among all thesestudies, there was great emphasis on experimental and naturalevidence for amphibole-dominated dehydration melting ofmafic magmatic and metamorphic sources such as basalts,andesites, gabbros, greenstones, amphibolites, and eclogites(e.g., Barker and Arth 1976; Barker 1979; Beard andLofgren 1991; Sisson et al. 2005; Ratajeski et al. 2005; Saki
Responsible Editor: Domenico M. Doronzo
This paper was selected from the 3rd Conference of the Arabian Journalof Geosciences (CAJG), Tunisia 2020
* Federico [email protected]
1 Dipartimento di Scienze, Sez. Scienze Geologiche, Università DegliStudi Roma Tre, Rome, Italy
2 Department of geology, Faculty of Earth sciences, Shahid ChamranUniversity of Ahvaz, Ahvaz, Iran
3 Department of Geosciences, Eastern Kentucky University,Richmond, KY 40475, USA
Arabian Journal of Geosciences (2021) 14:1788 https://doi.org/10.1007/s12517-021-08104-0

et al. 2021), because this is one of the processes that maycontrol the genesis of dacites (e.g., Beard and Lofgren1991), adakites (e.g., Rossetti et al. 2014), modern low-Ktonalites and trondhjemites (e.g., Barker and Arth 1976;Beard and Lofgren 1991; Sisson et al. 2005; Ratajeski et al.2001, 2005; García-Casco et al. 2008; Saki et al. 2021),plagiogranites (e.g., Koepke et al. 2005), and, most signifi-cantly, the Archean tonalite-trondhjemite-granodiorite (TTG)suites believed to provide the first evidence of Earth’s conti-nental crust (e.g., Barker and Arth 1976; Moyen and Stevens2006).
With the goal of contributing to the understanding of thegenesis of trondhjemite leucosomes through partial melting ofhornblende-bearing mafic rocks, this paper is focused on therole of the dominant protolith-forming minerals during incip-ient crustal anatectic events. In particular, this work isintended as a companion paper of Saki et al. (2021) and usespart of its geochemical dataset from the Cheshmeh-Ghasaban(CG) mafic migmatite suite (Hamedan, NW Iran) where theconnection between a gabbro protolith and in situtrondhjemite leucosomes has been demonstrated (Saki et al.2020, 2021). Results are discussed in the context of theexisting literature. This study, exploring the CG maficmetatexites, provides new evidence on how the very earlystage of partial melting of a hornblende-bearing mafic rockis developed in upper crust environment.
Geological setting
The Alvand plutonic complex is located within the Sanandaj-Sirjan Zone (hereafter SaSZ) of Iran (Fig. 1a), a distinctive≈1000km long and ≈150 km wide NW-SE trending crustalterrane (Stöcklin 1968), tectonically delimited by theUrumieh-Dokhtar Magmatic Belt (UDMB) and by theZagros suture zone, at its northeastern and southwestern ends,respectively. The SaSZ is characterized by a Cadomian (≈500-600 Ma) basement (e.g., Stöcklin and Nabavi 1973; Ghasemiand Talbot 2006; Hassanzadeh et al. 2008; Malek-Mahmoudiet al. 2017; Azizi and Stern 2019; Moghadam et al. 2020,2021) consisting of greenschist to amphibolite metamorphicrocks intruded by Jurassic-Cretaceous magmas (Mohajjelet al. 2003; Ghasemi and Talbot 2006; Hassanzadeh andWernicke 2016; Azizi et al. 2018a, b; Saki et al. 2020). Ithas been interpreted as the southwestern portion of theIranian microcontinent (Hassanzadeh et al. 2008; Hosseiniet al. 2015; Azizi et al. 2016, 2018a). Since the work ofEftekharnejad (1981), the SaSZ has been commonly dividedin northern and southern sectors; however, recently, Azizi andStern (2019) proposed a subdivision in three subzones fromnorth to south: Northern-SaSZ (N-SaSZ), Central SaSZ (C-SaSZ), and Southern SaSZ (S-SaSZ). In particular, the C-SaSZ is bounded with the structural zones of Baneh-
Mianeh-Ardabil in the north (Rabiee et al. 2020) and the con-tinuation of Daruneh-Naeen fault in the south (Fig. 1a).
The C-SaSZ, where the Alvand plutonic complex and thestudy area are located, is characterized by (i) Cadomian base-ment dominated by metagranites and amphibolites (Badr et al.2018; Azizi and Stern 2019); (ii) the Jurassic metamorphiccomplex (Mohajjel and Fergusson 2000; Mohajjel et al.2003; Agard et al. 2005; Hassanzadeh and Wernicke 2016;Azizi and Stern 2019) with protoliths interpreted as mafic tofelsic volcanic rocks interbedded with carbonates andsiliciclastic materials deposited over a thin Cadomian crustin a marine basin setting (e.g., Mohajjel et al. 2003;Baharifar et al. 2004; Hassanzadeh and Wernicke 2016;Azizi et al. 2018a, b); and (iii) the Jurassic to EarlyCretaceous gabbro to granite intrusive complexes (Saki et al.2021 and references therein). The latter magmatic activityheated the pre-existing rocks and generated Buchan-type ther-mo-metamorphic contact aureoles characterized by Al2SiO5-bearing hornfels up to migmatization (e.g., Baharifar et al.2004; Agard et al. 2005; Sepahi et al. 2009, 2018, 2019,2020; Shahbazi et al. 2010, 2014; Mahmoudi et al. 2011;Hassanzadeh and Wernicke 2016; Saki et al. 2020).
The Jurassic Alvand plutonic complex (Fig. 1a, b) in theHamedan area, with an exposed area of > 400 km2, is one ofthe largest batholiths intruded into the C-SaSZ (e.g., Alianiet al. 2012). It consists of a composite mafic to felsic plutoniccomplex with a main body made up of porphyritic granularbiotite-bearing granite (e.g., Sepahi 2008; Sepahi et al. 2018,2020; Shahbazi et al. 2010; Aliani et al. 2012; SheikhiGheshlaghi et al. 2020). Diffused leucogranitic, aplitic, andpegmatitic dikes and dikes-swarms intrude both the wholeAlvand complex and its contact aureole (e.g., Aliani et al.2012; Sepahi 2008; Sepahi et al. 2018, 2020; Shahbazi et al.2010; Sheikhi Gheshlaghi et al. 2020). Mafic intrusive rocksare mostly represented by pegmatoid and microcrystallinegabbros and diorites that outcrop as stocks and dikes (e.g.,Shahbazi et al. 2010; Aliani et al. 2012; Saki et al. 2020,2021) and are mainly found in the northern part of theAlvand complex, at the Cheshmeh-Ghasaban (CG) locality(Fig. 1b). Minor occurrences of these mafic rocks are alsoobserved in the eastern sector of the Alvand complex, in theSimin-Khaku locality (Eghlimi 1998; A.A. Sepahi, personalcommunication). Existing literature on the CG gabbros(Eshraghi and Mahmoudi Gharai 2003; Sepahi et al. 2009;Shahbazi et al. 2010; Yang et al. 2018; Saki et al. 2020) per-mits their discrimination between (i) hornblende-free olivine-gabbros (hereafter Ol-gabbro) with pyroxenite lenses and (ii)hornblende-bearing gabbros (hereafter Hbl-gabbro) and dio-rites. A primary contact between these two gabbroic lithotypesis locally observed (e.g., Saki et al. 2021); however, a detailedfield study is still missing. The Alvand complex has beendated by zircon U–Pb method (Shahbazi et al. 2010;Mahmoudi et al. 2011; Chiu et al. 2013; Sepahi et al. 2018,
1788 Page 2 of 20 Arab J Geosci (2021) 14:1788
2020; Zhang et al. 2018a, b; Yang et al. 2018) which reveals aprolonged Jurassic magmatic history from ≈167 to 150 Ma.These geochronology studies suggest that CG gabbrosemplaced at ≈161–167 Ma (Shahbazi et al. 2010; Yang et al.2018). Furthermore, Sepahi et al. (2013) used classicthermobarometry modelling to estimate emplacement temper-atures of 1200–1300 °C and 900–1100 °C for Ol-gabbros andHbl-gabbros, respectively, at crustal conditions of ≈ 5–6 ± 2.5kbar for both.
The intrusive Alvand plutonic complex generated a well-developed thermo-metamorphic aureole made up ofcordierite-andalusite-sillimanite-bearing hornfels andcordierite-bearing migmatites (e.g., Sepahi et al. 2019; Sakiet al. 2020) in the local low-grade regional metamorphic base-ment (known in literature as “Hamedan Phyllite,” e.g.,Mohajjel et al. 2003). Peak conditions for the thermal aureolewere estimated at ~750 °C and 4 kbar (Sepahi 2008, Sepahiet al. 2013; Sepahi et al. 2009, 2013, 2020; Saki et al. 2012,2020; Baharifar et al. 2004; Shahbazi et al. 2014; SheikhiGheshlaghi et al. 2020). The metapelitic migmatites show aU–Pb zircon age of ~170 Ma (Sepahi et al. 2019), and aremostly found in the eastern (Simin-Khaku locality) and
southern (Tuyserkan locality) sectors of the inner aureole(e.g., Saki et al. 2021). These migmatites are characterizedby the diffuse occurrence of S-type leucosomes and pegma-tites (e.g., Sepahi et al. 2019; Sheikhi Gheshlaghi et al. 2020;Saki et al. 2012, 2020, 2021).
The presence of mafic metatexite migmatites, characterizedby the presence of both in situ and in source trondhjemiteleucosomes within the CG Hbl-gabbro protolith, was reportedand investigated by Saki et al. (2020, 2021). Saki et al. (2020)studied these mafic migmatites by integrating (i) field obser-vations, (ii) microfabric and textures, and (iii) mineral andbulk rock chemistry and investigated the migmatizationevent through qualitative analysis of partial melting reactionsand classic and forward thermobarometry. Saki et al. (2021)followed this with a quantitative investigation of the gabbro-trondhjemite connection utilizing (i) major-element mass bal-ance modelling, (ii) trace and REE elements equilibrium batchmelting (EBM) modelling, (iii) pseudosection analysis ap-plied to the Hbl-gabbro protolith, and (iv) a preliminary com-parison between trondhjemite leucosomes and the chemistryof experimental melts from literature. They concluded that anorigin for in situ trondhjemite leucosomes are compatible with
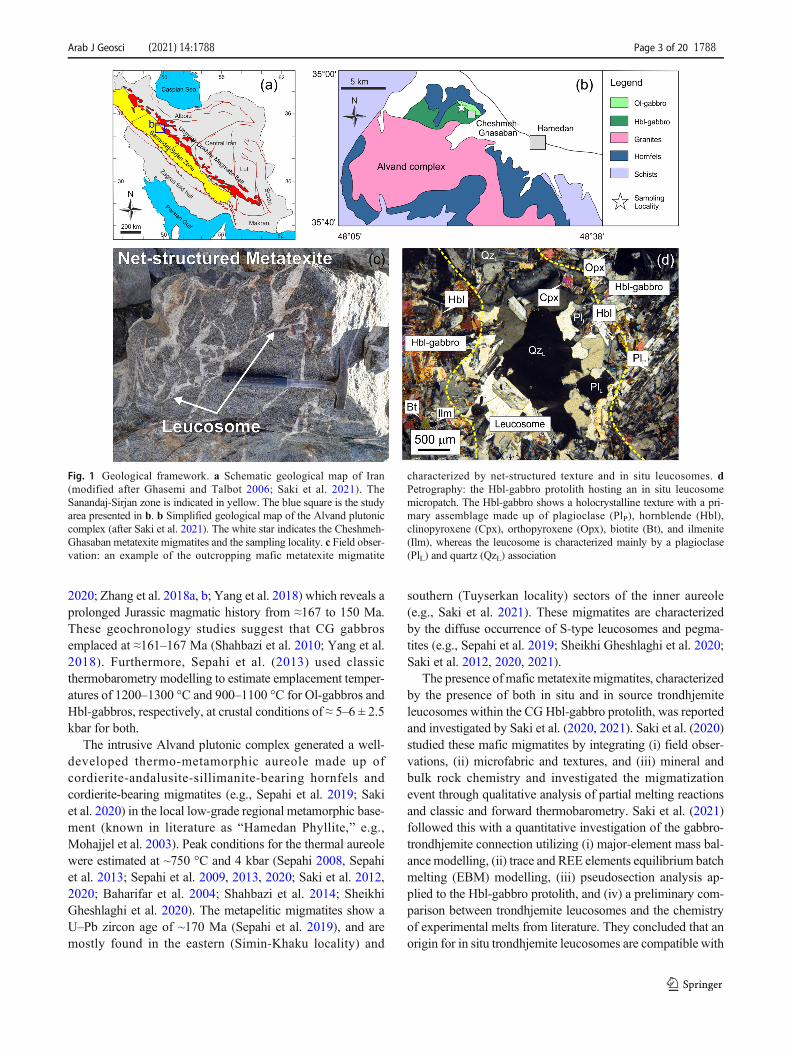
Fig. 1 Geological framework. a Schematic geological map of Iran(modified after Ghasemi and Talbot 2006; Saki et al. 2021). TheSanandaj-Sirjan zone is indicated in yellow. The blue square is the studyarea presented in b. b Simplified geological map of the Alvand plutoniccomplex (after Saki et al. 2021). The white star indicates the Cheshmeh-Ghasaban metatexite migmatites and the sampling locality. c Field obser-vation: an example of the outcropping mafic metatexite migmatite
characterized by net-structured texture and in situ leucosomes. dPetrography: the Hbl-gabbro protolith hosting an in situ leucosomemicropatch. The Hbl-gabbro shows a holocrystalline texture with a pri-mary assemblage made up of plagioclase (PlP), hornblende (Hbl),clinopyroxene (Cpx), orthopyroxene (Opx), biotite (Bt), and ilmenite(Ilm), whereas the leucosome is characterized mainly by a plagioclase(PlL) and quartz (QzL) association
Arab J Geosci (2021) 14:1788 Page 3 of 20 1788
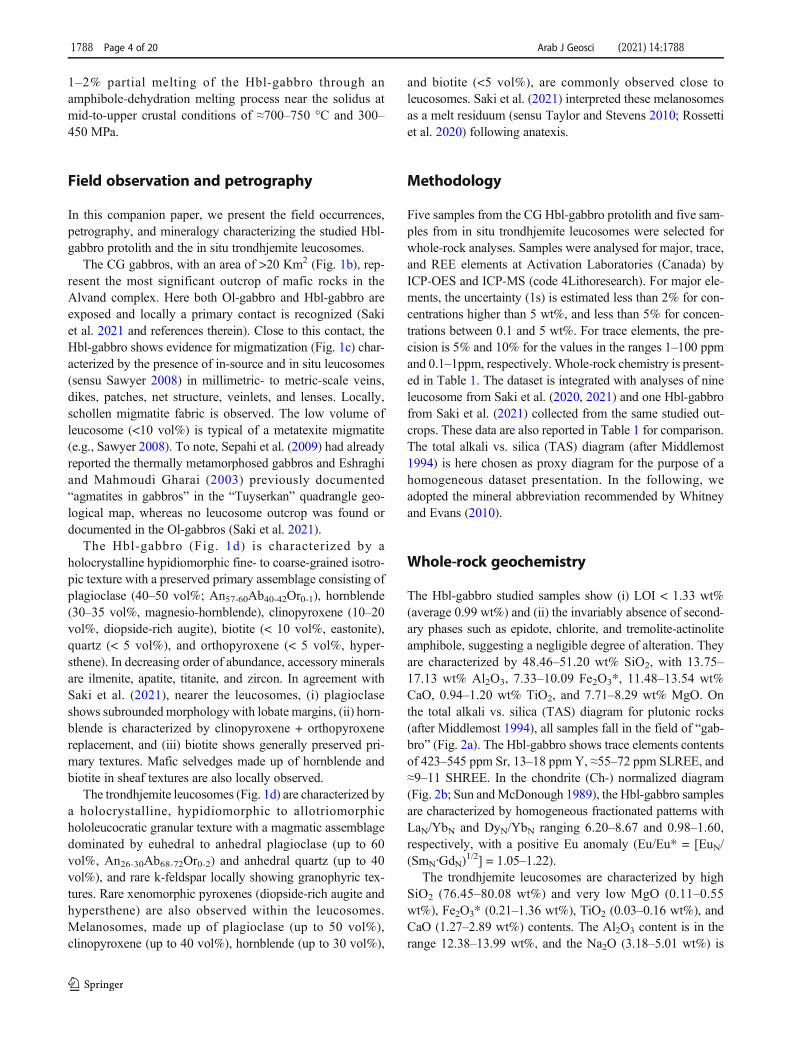
1–2% partial melting of the Hbl-gabbro through anamphibole-dehydration melting process near the solidus atmid-to-upper crustal conditions of ≈700–750 °C and 300–450 MPa.
Field observation and petrography
In this companion paper, we present the field occurrences,petrography, and mineralogy characterizing the studied Hbl-gabbro protolith and the in situ trondhjemite leucosomes.
The CG gabbros, with an area of >20 Km2 (Fig. 1b), rep-resent the most significant outcrop of mafic rocks in theAlvand complex. Here both Ol-gabbro and Hbl-gabbro areexposed and locally a primary contact is recognized (Sakiet al. 2021 and references therein). Close to this contact, theHbl-gabbro shows evidence for migmatization (Fig. 1c) char-acterized by the presence of in-source and in situ leucosomes(sensu Sawyer 2008) in millimetric- to metric-scale veins,dikes, patches, net structure, veinlets, and lenses. Locally,schollen migmatite fabric is observed. The low volume ofleucosome (<10 vol%) is typical of a metatexite migmatite(e.g., Sawyer 2008). To note, Sepahi et al. (2009) had alreadyreported the thermally metamorphosed gabbros and Eshraghiand Mahmoudi Gharai (2003) previously documented“agmatites in gabbros” in the “Tuyserkan” quadrangle geo-logical map, whereas no leucosome outcrop was found ordocumented in the Ol-gabbros (Saki et al. 2021).
The Hbl-gabbro (Fig. 1d) is characterized by aholocrystalline hypidiomorphic fine- to coarse-grained isotro-pic texture with a preserved primary assemblage consisting ofplagioclase (40–50 vol%; An57-60Ab40-42Or0-1), hornblende(30–35 vol%, magnesio-hornblende), clinopyroxene (10–20vol%, diopside-rich augite), biotite (< 10 vol%, eastonite),quartz (< 5 vol%), and orthopyroxene (< 5 vol%, hyper-sthene). In decreasing order of abundance, accessory mineralsare ilmenite, apatite, titanite, and zircon. In agreement withSaki et al. (2021), nearer the leucosomes, (i) plagioclaseshows subroundedmorphology with lobate margins, (ii) horn-blende is characterized by clinopyroxene + orthopyroxenereplacement, and (iii) biotite shows generally preserved pri-mary textures. Mafic selvedges made up of hornblende andbiotite in sheaf textures are also locally observed.
The trondhjemite leucosomes (Fig. 1d) are characterized bya holocrystalline, hypidiomorphic to allotriomorphichololeucocratic granular texture with a magmatic assemblagedominated by euhedral to anhedral plagioclase (up to 60vol%, An26-30Ab68-72Or0-2) and anhedral quartz (up to 40vol%), and rare k-feldspar locally showing granophyric tex-tures. Rare xenomorphic pyroxenes (diopside-rich augite andhypersthene) are also observed within the leucosomes.Melanosomes, made up of plagioclase (up to 50 vol%),clinopyroxene (up to 40 vol%), hornblende (up to 30 vol%),
and biotite (<5 vol%), are commonly observed close toleucosomes. Saki et al. (2021) interpreted these melanosomesas a melt residuum (sensu Taylor and Stevens 2010; Rossettiet al. 2020) following anatexis.
Methodology
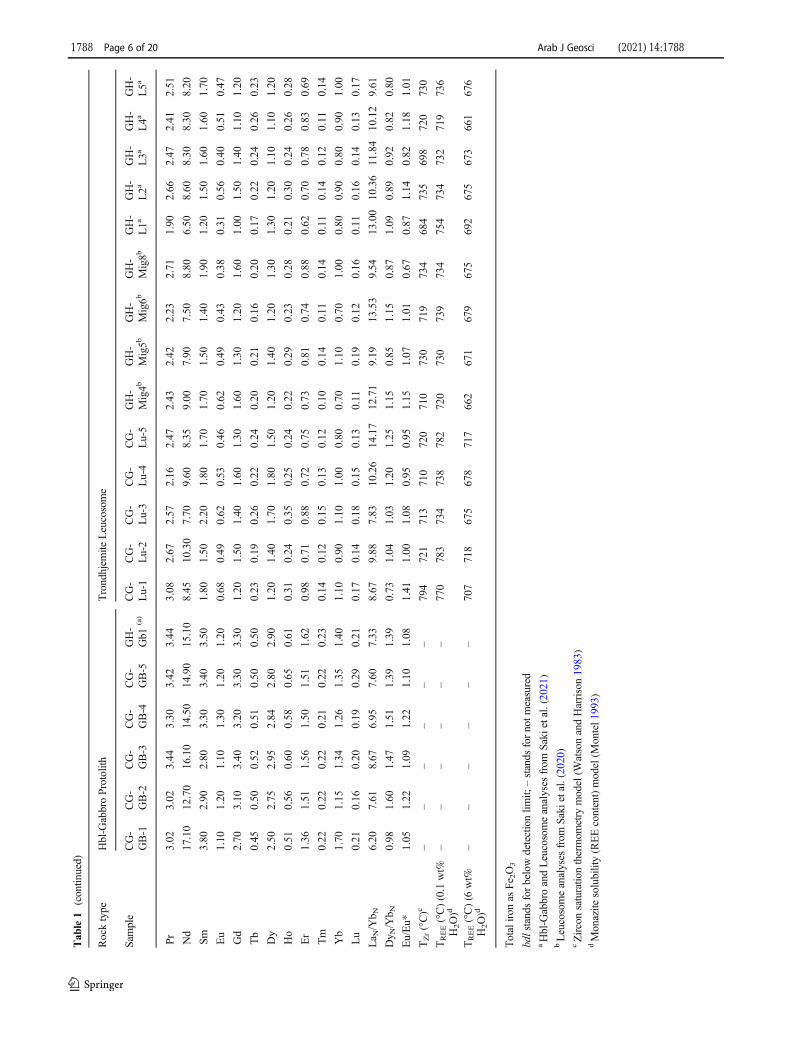
Five samples from the CG Hbl-gabbro protolith and five sam-ples from in situ trondhjemite leucosomes were selected forwhole-rock analyses. Samples were analysed for major, trace,and REE elements at Activation Laboratories (Canada) byICP-OES and ICP-MS (code 4Lithoresearch). For major ele-ments, the uncertainty (1s) is estimated less than 2% for con-centrations higher than 5 wt%, and less than 5% for concen-trations between 0.1 and 5 wt%. For trace elements, the pre-cision is 5% and 10% for the values in the ranges 1–100 ppmand 0.1–1ppm, respectively.Whole-rock chemistry is present-ed in Table 1. The dataset is integrated with analyses of nineleucosome from Saki et al. (2020, 2021) and one Hbl-gabbrofrom Saki et al. (2021) collected from the same studied out-crops. These data are also reported in Table 1 for comparison.The total alkali vs. silica (TAS) diagram (after Middlemost1994) is here chosen as proxy diagram for the purpose of ahomogeneous dataset presentation. In the following, weadopted the mineral abbreviation recommended by Whitneyand Evans (2010).
Whole-rock geochemistry
The Hbl-gabbro studied samples show (i) LOI < 1.33 wt%(average 0.99 wt%) and (ii) the invariably absence of second-ary phases such as epidote, chlorite, and tremolite-actinoliteamphibole, suggesting a negligible degree of alteration. Theyare characterized by 48.46–51.20 wt% SiO2, with 13.75–17.13 wt% Al2O3, 7.33–10.09 Fe2O3*, 11.48–13.54 wt%CaO, 0.94–1.20 wt% TiO2, and 7.71–8.29 wt% MgO. Onthe total alkali vs. silica (TAS) diagram for plutonic rocks(after Middlemost 1994), all samples fall in the field of “gab-bro” (Fig. 2a). The Hbl-gabbro shows trace elements contentsof 423–545 ppm Sr, 13–18 ppm Y, ≈55–72 ppm SLREE, and≈9–11 SHREE. In the chondrite (Ch-) normalized diagram(Fig. 2b; Sun andMcDonough 1989), the Hbl-gabbro samplesare characterized by homogeneous fractionated patterns withLaN/YbN and DyN/YbN ranging 6.20–8.67 and 0.98–1.60,respectively, with a positive Eu anomaly (Eu/Eu* = [EuN/(SmN∙GdN)1/2] = 1.05–1.22).
The trondhjemite leucosomes are characterized by highSiO2 (76.45–80.08 wt%) and very low MgO (0.11–0.55wt%), Fe2O3* (0.21–1.36 wt%), TiO2 (0.03–0.16 wt%), andCaO (1.27–2.89 wt%) contents. The Al2O3 content is in therange 12.38–13.99 wt%, and the Na2O (3.18–5.01 wt%) is
1788 Page 4 of 20 Arab J Geosci (2021) 14:1788
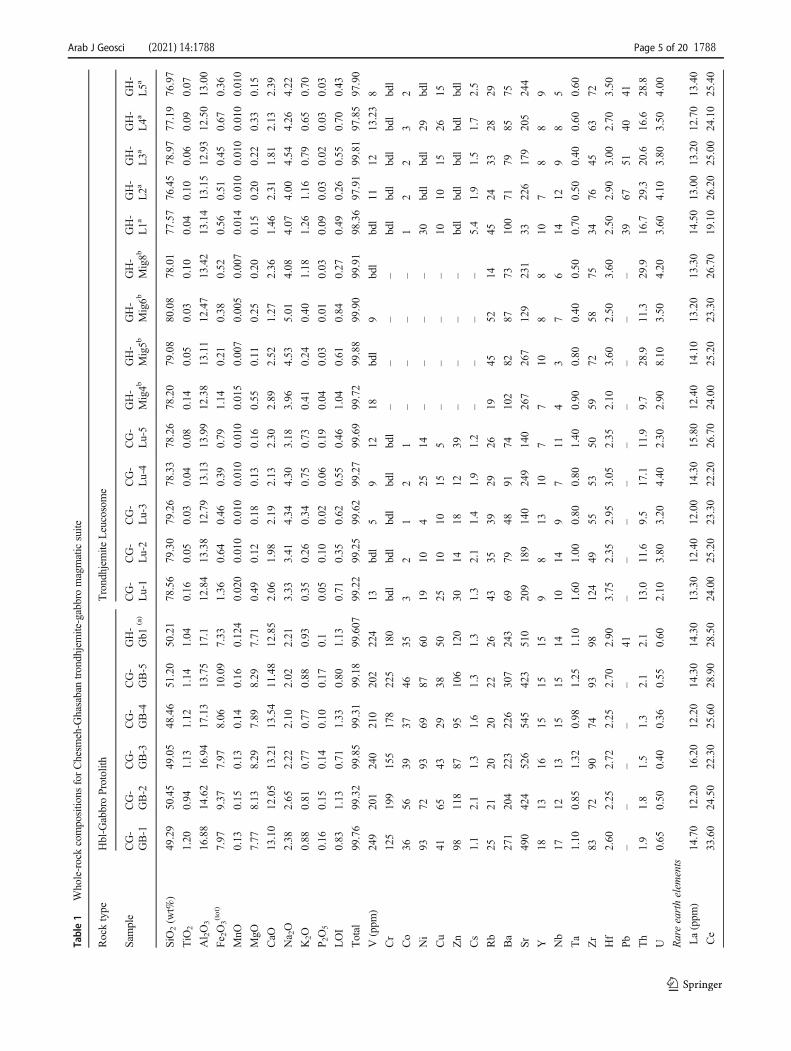
Table1
Whole-rockcompositio
nsforChesm
eh-G
hasabantrondhjemite-gabbromagmaticsuite
Rocktype
Hbl-G
abbroProtolith
Trondhjem
iteLeucosome
Sam
ple
CG-
GB-1
CG-
GB-2
CG-
GB-3
CG-
GB-4
CG-
GB-5
GH-
Gb1
(a)
CG-
Lu-1
CG-
Lu-2
CG-
Lu-3
CG-
Lu-4
CG-
Lu-5
GH-
Mig4b
GH-
Mig5b
GH-
Mig6b
GH-
Mig8b
GH-
L1a
GH-
L2a
GH-
L3a
GH-
L4a
GH-
L5a
SiO
2(w
t%)
49.29
50.45
49.05
48.46
51.20
50.21
78.56
79.30
79.26
78.33
78.26
78.20
79.08
80.08
78.01
77.57
76.45
78.97
77.19
76.97
TiO
21.20
0.94
1.13
1.12
1.14
1.04
0.16
0.05
0.03
0.04
0.08
0.14
0.05
0.03
0.10
0.04
0.10
0.06
0.09
0.07
Al 2O3
16.88
14.62
16.94
17.13
13.75
17.1
12.84
13.38
12.79
13.13
13.99
12.38
13.11
12.47
13.42
13.14
13.15
12.93
12.50
13.00
Fe 2O3(tot)
7.97
9.37
7.97
8.06
10.09
7.33
1.36
0.64
0.46
0.39
0.79
1.14
0.21
0.38
0.52
0.56
0.51
0.45
0.67
0.36
MnO
0.13
0.15
0.13
0.14
0.16
0.124
0.020
0.010
0.010
0.010
0.010
0.015
0.007
0.005
0.007
0.014
0.010
0.010
0.010
0.010
MgO
7.77
8.13
8.29
7.89
8.29
7.71
0.49
0.12
0.18
0.13
0.16
0.55
0.11
0.25
0.20
0.15
0.20
0.22
0.33
0.15
CaO
13.10
12.05
13.21
13.54
11.48
12.85
2.06
1.98
2.19
2.13
2.30
2.89
2.52
1.27
2.36
1.46
2.31
1.81
2.13
2.39
Na 2O
2.38
2.65
2.22
2.10
2.02
2.21
3.33
3.41
4.34
4.30
3.18
3.96
4.53
5.01
4.08
4.07
4.00
4.54
4.26
4.22
K2O
0.88
0.81
0.77
0.77
0.88
0.93
0.35
0.26
0.34
0.75
0.73
0.41
0.24
0.40
1.18
1.26
1.16
0.79
0.65
0.70
P2O5
0.16
0.15
0.14
0.10
0.17
0.1
0.05
0.10
0.02
0.06
0.19
0.04
0.03
0.01
0.03
0.09
0.03
0.02
0.03
0.03
LOI
0.83
1.13
0.71
1.33
0.80
1.13
0.71
0.35
0.62
0.55
0.46
1.04
0.61
0.84
0.27
0.49
0.26
0.55
0.70
0.43
Total
99.76
99.32
99.85
99.31
99.18
99.607
99.22
99.25
99.62
99.27
99.69
99.72
99.88
99.90
99.91
98.36
97.91
99.81
97.85
97.90
V(ppm
)249
201
240
210
202
224
13bdl
59
1218
bdl
9bdl
bdl
1112
13.23
8
Cr
125
199
155
178
225
180
bdl
bdl
bdl
bdl
bdl
––
––
bdl
bdl
bdl
bdl
bdl
Co
3656
3937
4635
32
12
1–
––
–1
22
32
Ni
9372
9369
8760
1910
425
14–
––
–30
bdl
bdl
29bdl
Cu
4165
4329
3850
2510
1015
5–
––
–10
1015
2615
Zn
98118
8795
106
120
3014
1812
39–
––
–bdl
bdl
bdl
bdl
bdl
Cs
1.1
2.1
1.3
1.6
1.3
1.3
1.3
2.1
1.4
1.9
1.2
––
––
5.4
1.9
1.5
1.7
2.5
Rb
2521
2020
2226
4335
3929
2619
4552
1445
2433
2829
Ba
271
204
223
226
307
243
6979
4891
74102
8287
73100
7179
8575
Sr490
424
526
545
423
510
209
189
140
249
140
267
267
129
231
33226
179
205
244
Y18
1316
1515
159
813
107
710
88
107
88
9
Nb
1712
1315
1514
1014
97
114
37
614
129
85
Ta
1.10
0.85
1.32
0.98
1.25
1.10
1.60
1.00
0.80
0.80
1.40
0.90
0.80
0.40
0.50
0.70
0.50
0.40
0.60
0.60
Zr
8372
9074
9398
124
4955
5350
5972
5875
3476
4563
72
Hf
2.60
2.25
2.72
2.25
2.70
2.90
3.75
2.35
2.95
3.05
2.35
2.10
3.60
2.50
3.60
2.50
2.90
3.00
2.70
3.50
Pb
––
––
–41
––
––
––
––
–39
6751
4041
Th
1.9
1.8
1.5
1.3
2.1
2.1
13.0
11.6
9.5
17.1
11.9
9.7
28.9
11.3
29.9
16.7
29.3
20.6
16.6
28.8
U0.65
0.50
0.40
0.36
0.55
0.60
2.10
3.80
3.20
4.40
2.30
2.90
8.10
3.50
4.20
3.60
4.10
3.80
3.50
4.00
Rareearthelem
ents
La(ppm
)14.70
12.20
16.20
12.20
14.30
14.30
13.30
12.40
12.00
14.30
15.80
12.40
14.10
13.20
13.30
14.50
13.00
13.20
12.70
13.40
Ce
33.60
24.50
22.30
25.60
28.90
28.50
24.00
25.20
23.30
22.20
26.70
24.00
25.20
23.30
26.70
19.10
26.20
25.00
24.10
25.40
Arab J Geosci (2021) 14:1788 Page 5 of 20 1788
Tab
le1
(contin
ued)
Rocktype
Hbl-G
abbroProtolith
Trondhjem
iteLeucosome
Sam
ple
CG-
GB-1
CG-
GB-2
CG-
GB-3
CG-
GB-4
CG-
GB-5
GH-
Gb1
(a)
CG-
Lu-1
CG-
Lu-2
CG-
Lu-3
CG-
Lu-4
CG-
Lu-5
GH-
Mig4b
GH-
Mig5b
GH-
Mig6b
GH-
Mig8b
GH-
L1a
GH-
L2a
GH-
L3a
GH-
L4a
GH-
L5a
Pr3.02
3.02
3.44
3.30
3.42
3.44
3.08
2.67
2.57
2.16
2.47
2.43
2.42
2.23
2.71
1.90
2.66
2.47
2.41
2.51
Nd
17.10
12.70
16.10
14.50
14.90
15.10
8.45
10.30
7.70
9.60
8.35
9.00
7.90
7.50
8.80
6.50
8.60
8.30
8.30
8.20
Sm3.80
2.90
2.80
3.30
3.40
3.50
1.80
1.50
2.20
1.80
1.70
1.70
1.50
1.40
1.90
1.20
1.50
1.60
1.60
1.70
Eu
1.10
1.20
1.10
1.30
1.20
1.20
0.68
0.49
0.62
0.53
0.46
0.62
0.49
0.43
0.38
0.31
0.56
0.40
0.51
0.47
Gd
2.70
3.10
3.40
3.20
3.30
3.30
1.20
1.50
1.40
1.60
1.30
1.60
1.30
1.20
1.60
1.00
1.50
1.40
1.10
1.20
Tb
0.45
0.50
0.52
0.51
0.50
0.50
0.23
0.19
0.26
0.22
0.24
0.20
0.21
0.16
0.20
0.17
0.22
0.24
0.26
0.23
Dy
2.50
2.75
2.95
2.84
2.80
2.90
1.20
1.40
1.70
1.80
1.50
1.20
1.40
1.20
1.30
1.30
1.20
1.10
1.10
1.20
Ho
0.51
0.56
0.60
0.58
0.65
0.61
0.31
0.24
0.35
0.25
0.24
0.22
0.29
0.23
0.28
0.21
0.30
0.24
0.26
0.28
Er
1.36
1.51
1.56
1.50
1.51
1.62
0.98
0.71
0.88
0.72
0.75
0.73
0.81
0.74
0.88
0.62
0.70
0.78
0.83
0.69
Tm
0.22
0.22
0.22
0.21
0.22
0.23
0.14
0.12
0.15
0.13
0.12
0.10
0.14
0.11
0.14
0.11
0.14
0.12
0.11
0.14
Yb
1.70
1.15
1.34
1.26
1.35
1.40
1.10
0.90
1.10
1.00
0.80
0.70
1.10
0.70
1.00
0.80
0.90
0.80
0.90
1.00
Lu
0.21
0.16
0.20
0.19
0.29
0.21
0.17
0.14
0.18
0.15
0.13
0.11
0.19
0.12
0.16
0.11
0.16
0.14
0.13
0.17
La N/Yb N
6.20
7.61
8.67
6.95
7.60
7.33
8.67
9.88
7.83
10.26
14.17
12.71
9.19
13.53
9.54
13.00
10.36
11.84
10.12
9.61
Dy N
/Yb N
0.98
1.60
1.47
1.51
1.39
1.39
0.73
1.04
1.03
1.20
1.25
1.15
0.85
1.15
0.87
1.09
0.89
0.92
0.82
0.80
Eu/Eu*
1.05
1.22
1.09
1.22
1.10
1.08
1.41
1.00
1.08
0.95
0.95
1.15
1.07
1.01
0.67
0.87
1.14
0.82
1.18
1.01
TZr(°C)c
––
––
––
794
721
713
710
720
710
730
719
734
684
735
698
720
730
TREE(°C)(0.1wt%
H2O)d
––
––
––
770
783
734
738
782
720
730
739
734
754
734
732
719
736
TREE(°C)(6
wt%
H2O)d
––
––
––
707
718
675
678
717
662
671
679
675
692
675
673
661
676
Totaliron
asFe 2O3
bdlstandsforbelowdetectionlim
it;–stands
fornotm
easured
aHbl-G
abbroandLeucosomeanalyses
from
Saki
etal.(2021)
bLeucosomeanalyses
from
Sakietal.(2020)
cZirconsaturatio
nthermom
etry
model(W
atsonandHarrison1983)
dMonazite
solubility(REEcontent)model(M
ontel1
993)
1788 Page 6 of 20 Arab J Geosci (2021) 14:1788

always higher than the K2O (0.24–1.26 wt%) content. In theTAS diagram (Fig. 2a), these leucosomes plot in the “Granite”field. They have 33–267 ppm Sr, 7–13 ppm Y, 34–124ppm Zr, ≈43–55 ppm SLREE, and ≈4–6 ppm SHREE.In the Ch-normalized diagram (Fig. 2b), leucosome sam-ples are enriched in LREE with LaN/YbN values in therange 7.83–14.17 and show depleted concave upward pro-files with HREE flat patterns (DyN/YbN ranging 0.73–1.25). The Eu anomaly is variable (Eu/Eu* 0.67–1.41;mean value 1.02), which indicates a variable role for pla-gioclase during their genesis (e.g., Hu et al. 2016). Thehigh-SiO2 low-Al2O3 trondhjemite character (Barker andArth 1976; Le Maitre et al. 2002) previously identified bySaki et al. (2021) can be confirmed based on (i) modalmineralogy (QAP diagram of Streckeisen 1976 in LeMaitre et al. 2002; not shown), (ii) Na2O–CaO–K2O con-tents (Fig. 2c), (iii) the Ab-An-Or normative diagram(Fig. 2d; Barker 1979), and (iv) the Al2O3 (< 15 wt%)content. Furthermore, on the Ab–An–Or diagram (Fig.
2d), all the studied samples fall in the field of typicaltrondhjemites (Nilsen et al. 2003).
For the purpose of partial melting modelling using majorelements, trace elements (Sr, Y), and REE (Dy, Yb), we cal-culated the compositions for average Hbl-gabbro protolith(Av-Gb; green star in diagrams of Figs. 2 and 3) andtrondhjemite leucosome (Av-Lc; yellow star in diagrams ofFigs. 2, 3, and 7). They are presented in Table 2.
Workflow
Starting from the same mineral assemblage (Pl+Hbl+Cpx)used in Saki et al. (2021) and using the current calculatedprotolith and leucosome average compositions, we test theequilibrium batch melting (EBM) model by integrating biotiteand orthopyroxene (analyses of Saki et al. 2021) to (i) refinethe KD coefficients characterizing this partial melting event,(ii) to constrain the role of all the main protolith-forming
Fig. 2 Whole-rock geochemistry. a Total alkali versus silica (TAS) dia-gram for plutonic rocks (after Middlemost 1994; Le Maitre et al. 2002).All the major elements data have been recalculated to 100 wt% on anhy-drous basis with FeO* as total FeO. b Chondrite-normalized rare earthelements (REEs) diagram (Sun and McDonough 1989). c CaO–Na2O–K2O diagram for Cheshmeh-Ghasaban leucosomes. The fields of exper-imental melts produced at low pressure (P< 500MPa) through amphibole
(green field), biotite (blue field), and amphibole+biotite (dark red) dehy-dration melting are also indicated. d Normative An-Ab-Or diagram forthe studied leucosomes. Literature data for “Hbl-Gabbro” and“Trondhjemite” are from Saki et al. (2021). Field of trondhjemites fromTrondheim Region (Norway; cyan field, Nilsen et al. 2003) is alsoreported
Arab J Geosci (2021) 14:1788 Page 7 of 20 1788
1788 Page 8 of 20 Arab J Geosci (2021) 14:1788

mineral phases, and (iii) to better constrain through a forwardmodelling the P-T conditions of the Hbl-gabbro anatexis.
The major-element mass balance model of Bryan et al.(1969) was used in Saki et al. (2021) to test the hypothesisof EBM (White et al. 2009; Lucci et al. 2016) for the genesisof trondhjemite leucosomes from the partial melting of theHbl-gabbro. In EBM modelling, it is assumed that ResidualAssemblage (Minerals) = Protolith Source − Leucosome. Ifthe composition of the protolith is assigned to matrix b, and allelemental equations are solved for b, then b= Leucosome+Minerals. When the chemistry of leucosome and mineralsare known and expressed in matrix A, it is possible to deter-mine their proportion (in matrix c) by least square approxima-tion method. The similarity between the residual matrix b’(with b’ = c X A) and the matrix b (the protolith) is quantifiedthrough the sum of the square of the residuals (Σr2) as thefollowing:
∑r2 ¼ ∑n
i−1b
0i−bi
� �2ð1Þ
Models are considered acceptable when Σr2 < 1.0. Theproportion of the leucosome is expressed with the variable Fin matrix c.
Considering (i) the in situ character of the leucosomes andtheir equilibrium with the residuum until the end of theanatexis, (ii) the paucity/absence of gabbro remnants withinthe leucosomes, and (iii) the results obtained by Saki et al.(2021), it is then assumed the studied partial melting event iscompatible with an equilibrium batch melting process (Shaw1970; Zou 1998; Ersoy 2013), where the proportions of theinvolved mineral phases were those of the magmatic assem-blage of the protolith. Following Saki et al. (2021), we use theShaw (1970) equation chosen for equilibrium batch melting:
CL ¼ C0
D0 þ F 1−D0ð Þ ð2Þ
where C0 is the elemental concentration in the protolith,D0
is the bulk mineral/melt partition coefficient, F is the fractionof produced melt, and CL is the corresponding calculated ele-mental concentration in the batch melt. The selected elementsare Sr (LILE), Y (HFSE), and Dy and Yb (HREE). The ele-ment bulk partition coefficients (DSr, DY, DYb, and DDy) werecalculated following the scheme proposed in Section 8.1.4 ofSaki et al. (2021) and starting from the existing literature (seeSection 8.1.5 in Saki et al. 2021 and references therein).
Discussion
Major element mass balance model
The results of major-element mass balance model applied tothe average protolith and leucosome compositions are present-ed in Table 3, where mathematically reliable solutions for thegenesis of leucosomes (Σr2 0.02–0.49; models A to D) arereported.
The model A (Σr2 0.49) shows that the high-SiO2 (≈78wt%) leucosome may be generated by ≈1% of partial meltingof the gabbroic source with a residuum made up ofPl38Hbl49Cpx11. When Bt is included (model B, Σr2 0.43),the major-element mass balance modelling shows a residuumof Pl37Hbl46Cpx12Bt2 and highlights in the matrix c the neg-ligible role of the trioctahedral phyllosilicate with respect tothe Ca–Al minerals. When the Opx is added to the matrix A(models C and D), the mass balance modelling produces un-realistic results with invariably negative values in matrix c(highlighted in red) for the Opx. These negative values arehere interpreted as an excess or a non-involvement of thisphase in the Mineral = Protolith − Leucosome equation.
These results confirm the very low degree of partial meltingcalculated by Saki et al. (2021) and highlight an anatexis eventdominated by Tschermak-bearing (Hbl+Cpx) and anorthite-
Table 2 Averagecompositions for EBMmodelling
Rock type Av-Gb Av-Lc
SiO2 (wt%) 49.78 78.30
TiO2 1.10 0.07
Al2O3 16.07 13.02
Fe2O3(tot) 8.47 0.60
MnO 0.14 0.01
MgO 8.01 0.23
CaO 12.71 2.13
Na2O 2.26 4.09
K2O 0.84 0.66
P2O5 0.14 0.05
LOI 0.99 0.56
Total 99.50 99.16
Sr (ppm) 486.33 193.43
Y 15.33 8.71
Dy 2.79 1.33
Yb 1.37 0.91
Total iron as Fe2O3
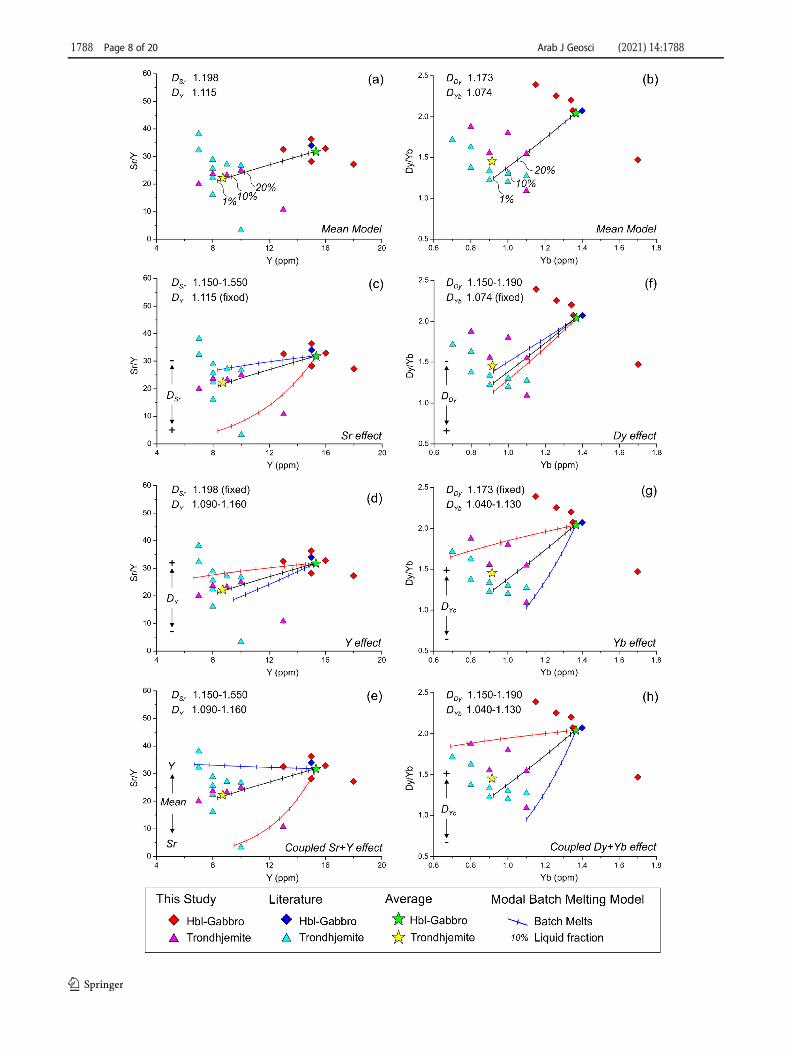
�Fig. 3 (a) Y vs Sr/Y and (b) Yb vs Dy/Yb diagrams illustrating thegenesis of the trondhjemite leucosomes via equilibrium batch melting(EBM) modelling and starting from the Av-Gb bulk average gabbroicprotolith compositions. The effect of the primary Pl+Hbl+Cpx assem-blage on the EBM process is also presented for Sr-Y (c–e) and Dy-Yb(f–h) systems. Bulk rock/melt partition coefficients used for EBMmodelsare reported in diagrams. The calculated EBM curves represent, for everymodel, the Shaw (1970) modal batch melting solution. Batch melts standsfor leucosomes. The percentages indicate the amount (wt%) of meltgenerated
R
Arab J Geosci (2021) 14:1788 Page 9 of 20 1788

Table 3 Major elements mass balance modelling
b Liquid and mineral phases (matrix A) b′ b-b′ c
Model A
Av-Gb Av-Lc Pl-#7 Hbl-#4 Cpx-#2
SiO2 49.78 78.30 53.74 47.19 51.01 49.77 0.00 Av-Lc 0.011 = F
TiO2 1.10 0.07 0.02 1.47 1.11 0.85 0.25 Pl-#7 0.379 38.8%
Al2O3 16.07 13.02 30.41 7.92 5.06 16.09 -0.02 Hbl-#4 0.491 50.3%
FeOTot 7.62 0.54 0.03 14.11 6.02 7.58 0.03 Cpx-#2 0.106 10.9%
MnO 0.14 0.01 0.01 0.21 0.15 0.12 0.02
MgO 8.01 0.23 0.00 13.27 15.34 8.15 −0.13CaO 12.71 2.13 12.06 11.76 21.30 12.63 0.08 Sum 0.99
Na2O 2.26 4.09 4.58 1.16 0.46 2.40 −0.13K2O 0.84 0.66 0.07 0.37 0.00 0.22 0.62
Sum 97.80 0.49 = Σr2
Model B
Av-Gb Av-Lc Pl-#7 Hbl-#4 Cpx-#2 Bt-#1
SiO2 49.78 78.30 53.74 47.19 51.01 37.07 49.77 0.01 Av-Lc 0.014 = F
TiO2 1.10 0.07 0.02 1.47 1.11 1.26 0.84 0.25 Pl-#7 0.374 38.4%
Al2O3 16.07 13.02 30.41 7.92 5.06 17.81 16.13 −0.06 Hbl-#4 0.462 47.4%
FeOTot 7.62 0.54 0.03 14.11 6.02 13.20 7.50 0.12 Cpx-#2 0.121 12.4%
MnO 0.14 0.01 0.01 0.21 0.15 0.04 0.12 0.02 Bt-#1 0.018 1.9%
MgO 8.01 0.23 0.00 13.27 15.34 17.75 8.30 −0.29CaO 12.71 2.13 12.06 11.76 21.30 0.04 12.54 0.16 Sum 0.99
Na2O 2.26 4.09 4.58 1.16 0.46 0.40 2.37 −0.10K2O 0.84 0.66 0.07 0.37 0.00 8.78 0.36 0.48
Sum 97.94 0.43 = Σr2
Model C
Av-Gb Av-Lc Pl-#7 Hbl-#4 Cpx-#2 Opx-#3
SiO2 49.78 78.30 53.74 47.19 51.01 55.37 49.78 0.00 Av-Lc 0.026 = F
TiO2 1.10 0.07 0.02 1.47 1.11 0.02 0.96 0.14 Pl-#7 0.351 36.3%
Al2O3 16.07 13.02 30.41 7.92 5.06 0.36 16.02 0.05 Hbl-#4 0.588 60.9%
FeOTot 7.62 0.54 0.03 14.11 6.02 22.18 7.69 −0.07 Cpx-#2 0.075 7.8%
MnO 0.14 0.01 0.01 0.21 0.15 0.66 0.11 0.03 Opx-#3 −0.049 −5.1%MgO 8.01 0.23 0.00 13.27 15.34 21.13 7.93 0.08
CaO 12.71 2.13 12.06 11.76 21.30 0.94 12.75 −0.05 Sum 0.99
Na2O 2.26 4.09 4.58 1.16 0.46 0.04 2.43 −0.16K2O 0.84 0.66 0.07 0.37 0.00 0.00 0.26 0.58
Sum 97.92 0.40 = Σr2
Model D
Av-Gb Av-Lc Pl-#7 Hbl-#4 Cpx-#2 Bt-#1 Opx-#3
SiO2 49.78 78.30 53.74 47.19 51.01 37.07 55.37 49.77 0.00 Av-Lc 0.065 = F
TiO2 1.10 0.07 0.02 1.47 1.11 1.26 0.02 1.14 −0.04 Pl-#7 0.283 30.1%
Al2O3 16.07 13.02 30.41 7.92 5.06 17.81 0.36 16.06 0.01 Hbl-#4 0.668 71.1%
FeOTot 7.62 0.54 0.03 14.11 6.02 13.20 22.18 7.60 0.01 Cpx-#2 0.067 7.1%
MnO 0.14 0.01 0.01 0.21 0.15 0.04 0.66 0.07 0.07 Bt-#1 0.058 6.2%
MgO 8.01 0.23 0.00 13.27 15.34 17.75 21.13 8.04 −0.03 Opx-#3 −0.137 −14.6%CaO 12.71 2.13 12.06 11.76 21.30 0.04 0.94 12.70 0.01 Sum 1.00
Na2O 2.26 4.09 4.58 1.16 0.46 0.40 0.04 2.38 −0.12K2O 0.84 0.66 0.07 0.37 0.00 8.78 0.00 0.82 0.02
Sum 98.59 0.02 = Σr2
1788 Page 10 of 20 Arab J Geosci (2021) 14:1788

bearing (Pl) phases. Furthermore, the higher number of rocksamples considered in the model permits to refine the amountof each phase involved in the batch melting event, confirminga scenario (Fig. 2c) of amphibole-dominated dehydrationmelting (e.g., Beard and Lofgren 1991) to generate the studiedin situ trondhjemites.
Trace and REE element EBM models
Based on the previously presented major-element mass bal-ance modelling, and consistency with the work of Saki et al.(2021), we applied EBM modelling (Eq. 2) to Y vs. Sr/Y andYb vs. Dy/Yb compositional systems. Considering thereacting assemblage Pl38Hbl49Cpx11, we calculated themineral/melt and the bulk mineral/melt partition coefficients.Results are presented in Table 4. The average trondhjemite(Av-Lc with ≈193 ppm Sr, ≈9 ppm Y, ≈1.3 ppm Dy, and≈0.9 ppm Yb) corresponds to ≈1–5% of batch melting (Fig.3(a, b)) of the average Hbl-gabbro protolith (Av-Gb with Sr≈486, Y ≈15, Dy ≈2.8, and Yb ≈1.4). However, the studiedtrondhjemite samples show a wide distribution with respect tothe average composition in plots of Y vs. Sr/Y (Fig. 3(a)) andYb vs. Dy/Yb (Fig. 3(b)). We therefore decided to explore therole of each mineral phase involved through the effect of theirmineral/melt partition coefficients. From calculated partitioncoefficients in Table 4, it is possible to observe how Sr ismainly controlled by the plagioclase. An increase of theanorthite-plagioclase effect (PlDSr up to 1.21) is capable todescribe leucosomes with low Sr/Y ratio (Fig. 2c), whereashigher involvement of Tschermak-bearing inosilicates (Hbl+CpxDY up to 1.068, with HblDY:
CpxDY=3:1) controlling Y iscapable to better approximate melts with higher Sr/Y ratio(Fig. 2d) with respect to the average composition. However,only when the two effects are coupled is it possible to fullydescribe the leucosomes in the Sr-Y system.
A less significant role for plagioclase is instead observedwhen approaching the Dy-Yb system (Table 4), where theselected HREE elements are mostly controlled by the Ca–Alinosilicates. In particular, Dy is nearly to be totally controlledby Hbl, whereas a HblDYb:
CpxDYb=3:1 relationship exists forYb, comparable to that previously observed for Y. While
calculated variations of the bulk DDy are not capable to de-scribe the leucosome chemistry (Fig. 2f), opposite a minimumvariability of the Hbl+CpxDYb (0.908–0.998) is effective in de-scribing near all the leucosomes (Fig. 2g). Again, only whenthe minor effect of DDy is coupled with DYb is the wholedataset of trondhjemites described. Clinopyroxene and horn-blende show similar effects in controlling the selected traceand REE elements during the partial melting event; however,the relation CpxD << HblD is observed, suggesting that only Pl+Hbl played a main role during this incipient anatexis.
Classic and forward modelling thermobarometry: thepath to anatexis
To assess the pressure-temperature (P-T) conditions of genesisof CG trondhjemite leucosomes, we integrate here (i) classicthermobarometry as derived from the Zircon-saturation ther-mometry (TZr, Watson and Harrison 1983) and the Monazite-solubility model (TREE, Montel 1993) and (ii) forward model-ling thermobarometry through the pseudosections method.Results are then discussed also considering the previous re-sults obtained by Saki et al. (2020, 2021).
The zircon-saturation model provides information on satu-ration condition of zircon within an hydrous felsic Al-saturated magma (Watson and Harrison 1983) and thereforeprovides a minimum estimate for magma temperature prior tothe extensive crystallization and cooling (e.g., Miller et al.2003; Lucci et al. 2018). The trondhjemite leucosomes showvalues of Zr in the range 34–124 ppm, corresponding to TZr =684–694 ± 25 °C (Table 1) and to a weighted mean value of723 ± 13 °C (±1s standard deviation of the weighted mean,MSWD = 0.98, n=14). The monazite-solubility model(Montel 1993) is based on the effect of LREE content in Ca-poor felsic melt and operated assuming the whole-rock com-position as representative of a frozen liquid. The solubilityLREE temperatures were calculated for variable water content(0.1–6.0 wt% H2O); results are reported in Table 1. These twomodels show convergence (TREE = TZr ± 20°C) at (i) 733 ± 19°C (MSWD 0.58, n=7) for anhydrous conditions (H2O 0.1wt%) in samples GH-L2, GH-L4, GH-L5, GH-Mig4, GH-Mig5, GH-Mig8, and CG-Lu1 and (ii) 710 ± 19 °C (MSWD0.22, n=7) for hydrous conditions (1–6 wt% H2O) in samplesGH-L1, GH-L3, GH-Mig6, CG-Lu2, CG-Lu3, CG-Lu4, andCG-Lu5. When these two clusters are merged, the obtainedweighted mean TREE (722 ± 13 °C, MSWD = 0.60, n=14)overlaps that from zircon-saturation model. In agreement withthe existing literature on SiO2-rich felsic melts (e.g., Milleret al. 2003; Rossetti et al. 2013; Lucci et al. 2018), the con-vergence of these two models could represent the temperatureat the onset of crystallization, also resembling the temperatureof the anatectic source (e.g., Rossetti et al. 2013).
To refine the thermobaric conditions leading to the Hbl-gabbro anatexis and trondhjemite melt production in
Table 4 Calculatedpartition coefficientsused in the EBMmodelling
Calculated mineral/melt partitioncoefficients
Pl Hbl Cpx Bulk
DSr 0.858 0.272 0.068 1.198
DY 0.092 0.769 0.254 1.115
DDy 0.033 1.043 0.097 1.173
DYb 0.132 0.725 0.218 1.074
Arab J Geosci (2021) 14:1788 Page 11 of 20 1788

Cheshmeh-Ghasaban area, we used the average protolith Av-Gb composition for forward modelling thermobarometryusing the software Perple_X 6.9.0 (Connolly 2005;downloaded June 21, 2020, http://www.perplex.ethz.ch).The model system NCKFMASHT (Na2O–CaO–K2O–FeO*–MgO–Al2O3–SiO2–H2O–TiO2) was chosen assumingthe total iron as FeO due to the presence of ilmenite in thepreserved primary mineral assemblage and lack of anysecondary Fe3+-bearing phases. Three forward models weredeveloped: the main one and two testbeds to verify itsreliability on identifying the melt-in conditions. Concerningthe main model (hereafter “model A”), the solid-solutionmodels selected are “Augite(G)” for clinopyroxene (Greenet al. 2016), “Opx(W)” for orthopyroxene (White et al.2014), “Amph (DPW)” for Ca-hornblende (Dale et al. 2005), “Bio (TCC)” for biotite (Tajcmanova et al. 2009), “feldspar”
for feldspar (Fuhrman and Lindsley 1988), and “melt(G)” formelt (Green et al. 2016). The analyzed loss on ignition (LOI)was assumed as H2O content, coherently with the existingliterature on partial melting modelling (e.g., Rossetti et al.2020; Saki et al. 2021). The ilmenite (Ilm) end-member is alsoused in the calculation. The first testbed (hereafter “modelT1”) was developed using the same solid-solution models ofmodel A but considering water-present conditions (H2O inexcess). The second testbed (hereafter “model T2”) was de-veloped using LOI as H2O content but a different set of solid-solution models: “melt(G)” for melt (Green et al. 2016),“Augite(G)” for clinopyroxene (Green et al. 2016),cAmph(G) for Ca-hornblende (Green et al. 2016), Pl(I1,HP)and Fsp(C1) for ternary feldspar (Holland and Powell 2003),Bi(W) for biotite (White et al. 2014), Opx (W) fororthopyroxene (White et al. 2014), and Ilm (WPH) for
Fig. 4 Forward modellingthermobarometry: model A. aRepresentative P-T pseudosectioncalculated for the Av-Gb averageHbl-gabbro protolith in the sys-tem NCKFMASHT (Na2O–CaO–K2O–FeO*–MgO–Al2O3–SiO2–H2O–TiO2) with LOI asH2O wt% using the Perple_Xsoftware. b Isopleths derivedfrom the calculatedpseudosections and indicating thecalculated amount of generatedmelt (wt%). c Temperature-pressure-melt (wt%) representa-tion of the progressive amount ofmelt generated through the partialmelting of the average Av-GbHbl-gabbro protolith
1788 Page 12 of 20 Arab J Geosci (2021) 14:1788

ilmenite (White et al. 2014). Further details are in the solution.dat file enclosed in the Perple_X package, whereas the refer-ence database is the hp62ver.dat file, an update version of theHolland and Powell (2011) thermodynamic dataset. Thesingle-phase volume isopleths (melt, Pl, Hbl, Cpx, Opx, Bt)and the mineral composition isopleths (i.e., an in plagioclase)were drawn by PyWerami (version 2.0.1, downloaded fromthe website http://petrol.natur.cuni.cz/~ondro/pywerami:home). The melt and mineral phases involved wereexpressed in weight % (wt%) and were in accordance withthe results from the EBM models. Starting from the work ofSaki et al. (2021), the pseudosections were constructed from700 to 800 °C and between 250 and 450 MPa. The results offorward modelling thermobarometry are shown in Figs. 4, 5,6, and 7. The representative and simplified model Apseudosection calculated for the bulk chemistry of the Av-Gb average protolith is presented in Fig. 4 a, where the meltappearance (red dashed curve) is constrained at ≈725–730 °C.The melt and mineral phase isopleths (wt%) as derived fromthe pseudosections calculation are used to investigate the evo-lution of the partial melting evolution and are presented inFigs. 4 a and b and 5. In particular, the melt isopleths (wt%)are here used as a proxy of the anatexis. A three-dimensional
temperature-pressure-melt abundances (T-P-melt) diagram(Fig. 4c) is also proposed to better visualize the melt appear-ance (melt-in curve) in the system and its progressive produc-tion at higher temperatures. Replicate testbeds models T1 andT2 for water-saturated conditions (Fig. 5a, b) and differentsolid-solution models (Fig. 5c, d), respectively, show meltgeneration at ≈720–730°C comparable to the main model A(Fig. 4). However, with respect to main model A, the twotestbed models fail in accurately reproducing the CGmetatexite. The model T1 with H2O in excess (Fig. 5a) ischaracterized by a very high melt-production rate (Fig. 5b)in contrast with the observed low volume of in situleucosomes. Opposite, the model T2 based on a different setof solution models (Fig. 5b) shows a reasonable low melt-production rate (Fig. 5d) but fails in correctly reproducingthe primary assemblage of the Hbl-gabbro as shown by thelack of primary orthopyroxene in the pre-melting protolith.Consequently, the main model A represents the best forwardmodelling thermobarometry approximation of the anatexis ofthe CG Hbl-gabbro to generate the in situ trondhjemiteleucosomes.
How did the protolith-forming Pl+Hbl+Cpx+Bt+Opx pri-mary assemblage participate to the partial melting event? The
Fig. 5 Forward modellingthermobarometry: testbedsmodels T1 and T2. a Model T1:representative P-T pseudosectioncalculated for the Av-Gb averageHbl-gabbro protolith in the sys-tem NCKFMASHT (Na2O–CaO–K2O–FeO*–MgO–Al2O3–SiO2–H2O–TiO2) with water-excess conditions and solid-solution models equal to “modelA” using the Perple_X software.b Model T1: isopleths derivedfrom the calculatedpseudosections and indicating thecalculated amount of generatedmelt (wt%). c Model T2: repre-sentative P-T pseudosection cal-culated for the Av-Gb averageHbl-gabbro protolith in the sys-tem NCKFMASHT (Na2O–CaO–K2O–FeO*–MgO–Al2O3–SiO2–H2O–TiO2) with LOI asH2O wt% and a different set ofsolid-solution models (see text forfurther details) using the Perple_X software. dModel T2: isoplethsderived from the calculatedpseudosections and indicating thecalculated amount of generatedmelt (wt%)
Arab J Geosci (2021) 14:1788 Page 13 of 20 1788
possible solution to this point is explored hereafter using min-eral volume and mineral composition isopleths as calculatedfor the main model A (Fig. 5).
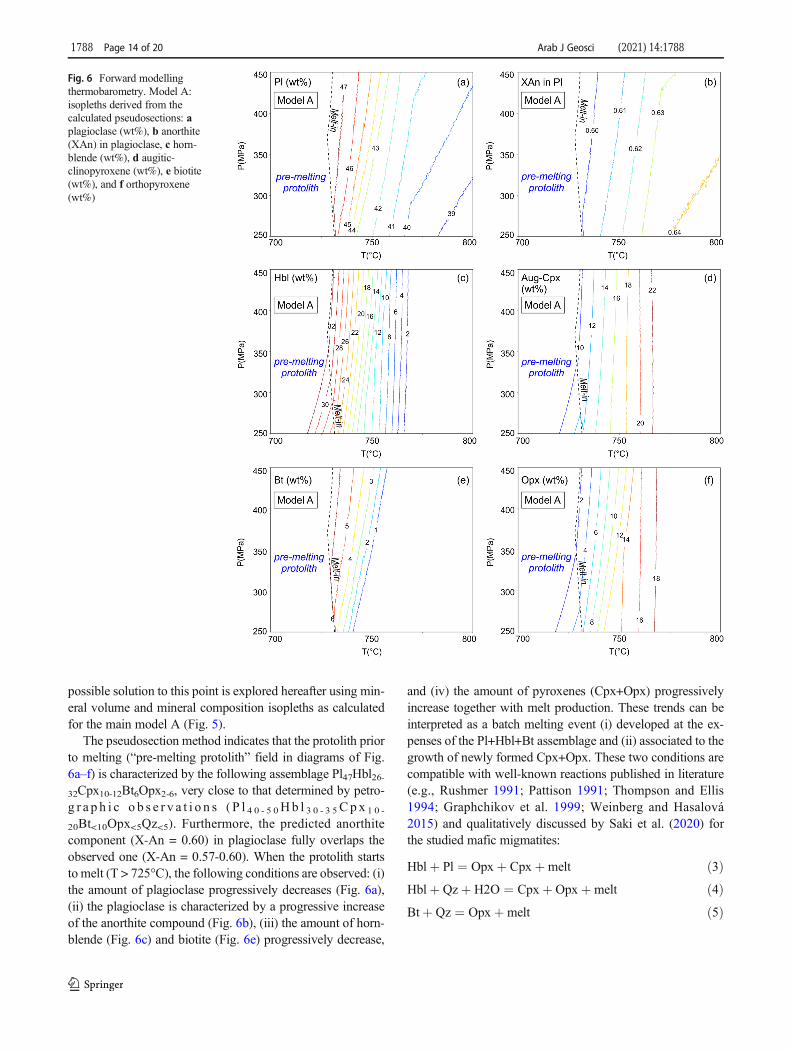
The pseudosection method indicates that the protolith priorto melting (“pre-melting protolith” field in diagrams of Fig.6a–f) is characterized by the following assemblage Pl47Hbl26-32Cpx10-12Bt6Opx2-6, very close to that determined by petro-g r a p h i c o b s e r v a t i o n s ( P l 4 0 - 5 0Hb l 3 0 - 3 5 C p x 1 0 -
20Bt<10Opx<5Qz<5). Furthermore, the predicted anorthitecomponent (X-An = 0.60) in plagioclase fully overlaps theobserved one (X-An = 0.57-0.60). When the protolith startsto melt (T > 725°C), the following conditions are observed: (i)the amount of plagioclase progressively decreases (Fig. 6a),(ii) the plagioclase is characterized by a progressive increaseof the anorthite compound (Fig. 6b), (iii) the amount of horn-blende (Fig. 6c) and biotite (Fig. 6e) progressively decrease,
and (iv) the amount of pyroxenes (Cpx+Opx) progressivelyincrease together with melt production. These trends can beinterpreted as a batch melting event (i) developed at the ex-penses of the Pl+Hbl+Bt assemblage and (ii) associated to thegrowth of newly formed Cpx+Opx. These two conditions arecompatible with well-known reactions published in literature(e.g., Rushmer 1991; Pattison 1991; Thompson and Ellis1994; Graphchikov et al. 1999; Weinberg and Hasalová2015) and qualitatively discussed by Saki et al. (2020) forthe studied mafic migmatites:
Hblþ Pl ¼ Opxþ Cpxþmelt ð3ÞHblþ Qzþ H2O ¼ Cpxþ Opxþmelt ð4ÞBtþ Qz ¼ Opxþmelt ð5Þ
Fig. 6 Forward modellingthermobarometry. Model A:isopleths derived from thecalculated pseudosections: aplagioclase (wt%), b anorthite(XAn) in plagioclase, c horn-blende (wt%), d augitic-clinopyroxene (wt%), e biotite(wt%), and f orthopyroxene(wt%)
1788 Page 14 of 20 Arab J Geosci (2021) 14:1788

The refined major-trace-REE EBM modelling and thestudy of partition coefficients proposed in this work indicatethat in situ trondhjemite leucosome corresponds to a very lowdegree (≈1–2%) of partial melting of the Hbl-protolith mainlycontrolled by Ca–Al-bearing phases such as hornblende andplagioclase, whereas the improved thermometry estimatesbased on the zircon-saturation and monazite-solubility modelsindicated that the melting event was developed at ≈720–730°C. Saki et al. (2021), through classic barometry modellingapplied to hornblende in the mesosome, propose a pressureestimates of 360 ± 60MPa for the partial melting. Integratingthese results with those obtained from the forward modellingthermobarometry model A (Fig. 7), it is possible to derive thefollowing conclusions: (i) the anatexis responsible for thetrondhjemite leucosome production is an incipient partialmelting event developed close to the solidus at a relativelylow temperature (< 750°C), (ii) the appearance of new gener-ation of pyroxenes (Cpx+Opx) is accompanying the melt pro-duction since the very early stage, and (iii) the trioctahedralmica is not involved in the melting reactions for a very lowdegree (<2%) of partial melting and therefore reaction of Eq.(5) can be discarded. Concerning the latter point, whentrondhjemite leucosome chemistry are plotted in a Na2O–CaO–K2O diagram (Fig. 2c), they fall close to the Na2O–CaO axis, within the field of experimental melts derived from
low pressure (P<500MPa) amphibole-dominated dehydrationprocesses in amphibole-bearing mafic rocks, whereas a biotiteparticipation would have led to melts with higher K2O con-tents (e.g., Gao et al. 2016 and references therein). The non-involvement of biotite in the dehydration melting process isalso supported by its preserved texture when approaching thein situ leucosomes. This is also in line with the existing liter-ature (e.g., Patiño Douce and Beard 1995; Singh and Johannes1996) where it has been demonstrated for P<500 MPa that (i)biotite can persist to higher temperatures than hornblende and(ii) a biotite-plagioclase assemblage starts to melt at 750–770°C, a temperature slightly higher than that obtained forCG trondhjemite leucosomes.
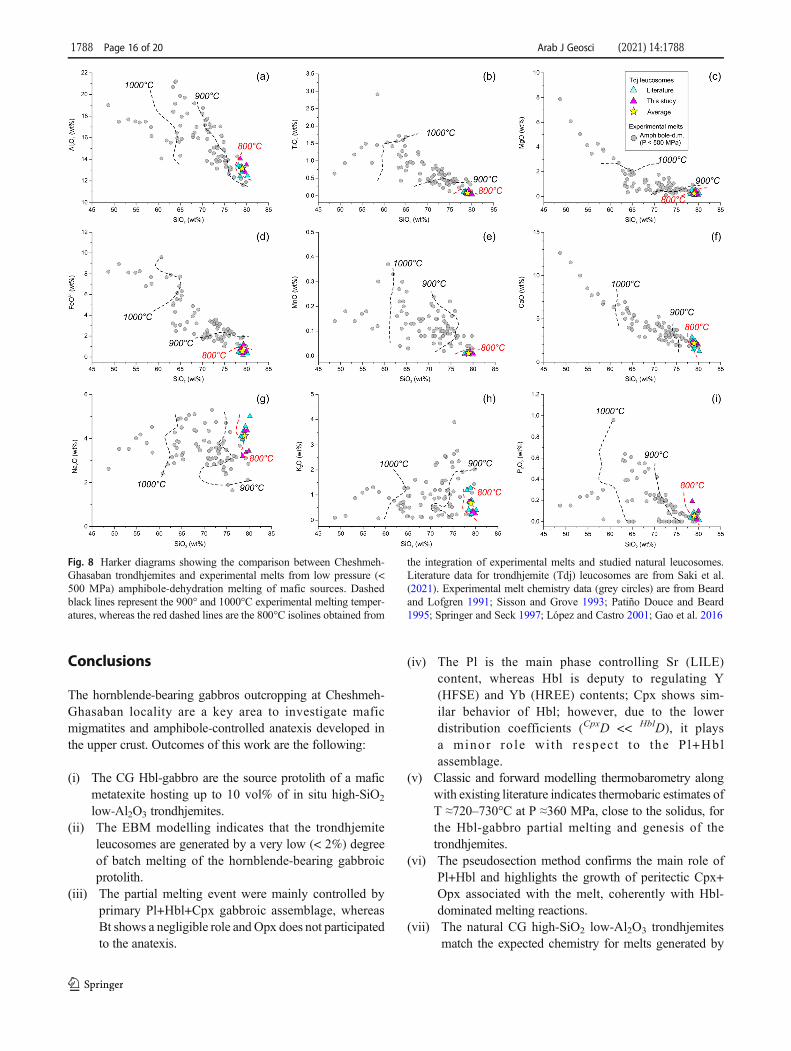
In the work of Saki et al. (2021), it was proposed acompar ison between the chemis t ry of the CGtrondhjemite leucosomes and that of experimental meltsproduced at 850–1100°C for P 100–500 MPa conditionsby partial melting of amphibole-bearing source rocks(e.g., Beard and Lofgren 1991; Sisson and Grove1993; Patiño Douce and Beard 1995; Springer andSeck 1997; López and Castro 2001; Gao et al. 2016).Following their approach and using SiO2 content as dif-ferentiation index, through the application of the “ColorFill Contour” tool in OriginPro 8.5.0 software, we de-rived the isolines (dashed black lines in Fig. 8) for the900°C and the 1000°C experimental melting tempera-tures, for all the major elements. A decrease in meltingtemperature corresponds to experimental melts (greycircles in Fig. 8) characterized by a progressive SiO2
(wt%) content increase associated with an opposite de-crease of Al2O3, TiO2, MgO, FeOtot, MnO, CaO, andP2O5 (wt%) contents. No clear relationship is highlight-ed for Na2O and K2O contents. As explained by Sissonet al. (2005), experimental runs close to the solidus andfor T< 800°C are usually not attempted because of thevery small volumes of melt produced precluding trust-worthy bulk analyses. However, observing the Harkerdiagrams of Fig. 8, it would be expected that melt gen-erated at such low temperatures would present stillhigher SiO2 content and even lower Al2O3, TiO2,MgO, FeOtot, MnO, CaO, and P2O5 contents. WhenCG trondhjemites are plotted in Harker diagram ofFig. 8, they completely match the expected composi-tional characteristics for low T and low P melts derivedby amphibole-dominated dehydration melting from amafic protolith. Furthermore, their integration in theseHarker diagrams permit also to graphically trace the800°C isoline (red dashed lines) contributing to ourknowledge on low-pressure amphibole-dominated incip-ient anatectic events affecting amphibole-bearingsources, and furthermore to the genesis of high-SiO2
(>70 wt%) low-Al2O3 (<15 wt%) trondhjemites (sensuBarker and Arth 1976).
Fig. 7 Classic and forward modelling thermobarometry. Therepresentative model A pseudosection presented in Fig. 4 a is integratedwith its selected melt (wt%) isopleths and zircon-saturation thermometry(TZr) weighted mean value (cyan dashed line) and 1s range (cyan dottedfield) calculated for trondhjemite samples. The blue star represents Ti-in-Hbl thermometry and Al-in-Hbl barometry estimates from Saki et al.(2021). The pressure-temperature (P-T) genetic domain of Cheshmeh-Ghasaban trondhjemites is indicated with the yellow shaded area.Mineral abbreviations follow Whitney and Evans (2010)
Arab J Geosci (2021) 14:1788 Page 15 of 20 1788
Conclusions
The hornblende-bearing gabbros outcropping at Cheshmeh-Ghasaban locality are a key area to investigate maficmigmatites and amphibole-controlled anatexis developed inthe upper crust. Outcomes of this work are the following:
(i) The CG Hbl-gabbro are the source protolith of a maficmetatexite hosting up to 10 vol% of in situ high-SiO2
low-Al2O3 trondhjemites.(ii) The EBM modelling indicates that the trondhjemite
leucosomes are generated by a very low (< 2%) degreeof batch melting of the hornblende-bearing gabbroicprotolith.
(iii) The partial melting event were mainly controlled byprimary Pl+Hbl+Cpx gabbroic assemblage, whereasBt shows a negligible role and Opx does not participatedto the anatexis.
(iv) The Pl is the main phase controlling Sr (LILE)content, whereas Hbl is deputy to regulating Y(HFSE) and Yb (HREE) contents; Cpx shows sim-ilar behavior of Hbl; however, due to the lowerdistribution coefficients (CpxD << HblD), it playsa minor ro le wi th respec t to the Pl+Hblassemblage.
(v) Classic and forward modelling thermobarometry alongwith existing literature indicates thermobaric estimates ofT ≈720–730°C at P ≈360 MPa, close to the solidus, forthe Hbl-gabbro partial melting and genesis of thetrondhjemites.
(vi) The pseudosection method confirms the main role ofPl+Hbl and highlights the growth of peritectic Cpx+Opx associated with the melt, coherently with Hbl-dominated melting reactions.
(vii) The natural CG high-SiO2 low-Al2O3 trondhjemitesmatch the expected chemistry for melts generated by
Fig. 8 Harker diagrams showing the comparison between Cheshmeh-Ghasaban trondhjemites and experimental melts from low pressure (<500 MPa) amphibole-dehydration melting of mafic sources. Dashedblack lines represent the 900° and 1000°C experimental melting temper-atures, whereas the red dashed lines are the 800°C isolines obtained from
the integration of experimental melts and studied natural leucosomes.Literature data for trondhjemite (Tdj) leucosomes are from Saki et al.(2021). Experimental melt chemistry data (grey circles) are from Beardand Lofgren 1991; Sisson and Grove 1993; Patiño Douce and Beard1995; Springer and Seck 1997; López and Castro 2001; Gao et al. 2016
1788 Page 16 of 20 Arab J Geosci (2021) 14:1788
amphibole-dominated partial melting of a mafic sourceat T < 800°C and P < 500 MPa.
These results fully describe how trondhjemites can be gen-erated by a low-temperature incipient melting controlled byCa–Al-bearing Pl+Hbl assemblage of a hornblende-bearingmafic source in upper crust conditions.
Acknowledgements We gratefully thank J. Connolly for the useful ad-vice during the manuscript preparation. F. L. and A. R. gratefully ac-knowledge Claudio Faccenna and the grant to Department of Science,Roma Tre University (MIUR-Italy Dipartimenti di Eccellenza,ARTICOLO 1, COMMI 314 – 337 LEGGE 232/2016) and thePRIN2017 Project 20177BX42Z_001 (intraplate deformation,magmatism, and topographic evolution of a diffuse collisional belt: in-sights into the geodynamics of the Arabia-Eurasia collisional zones)funded by MIUR-Italy. A. S. and M. M. acknowledge the grant No.SCU.EG99.44295 funded by Shahid Chamran University of Ahvaz-Iran. The constructive reviews of two anonymous reviewers as well asthe professional handling of the Editor Abdullah M. Al-Amri greatlycontributed to improve the manuscript.
Funding Open access funding provided by Università degli Studi RomaTre within the CRUI-CARE Agreement. This research is part of thecorresponding author postdoc programme at the Roma Tre University.This researchwas supported by the PRIN2017 Project 20177BX42Z_001(intraplate deformation, magmatism and topographic evolution of a dif-fuse collisional belt: Insights into the geodynamics of the Arabia-Eurasiacollisional zones) funded by MIUR-Italy. The research was also support-ed by Shahid Chamran University of Ahvaz (grant nos. EG98.44295 andSCU.EG98.44295).
Declarations
Competing interests The authors declare that they have no competinginterests.
Open Access This article is licensed under a Creative CommonsAttribution 4.0 International License, which permits use, sharing, adap-tation, distribution and reproduction in any medium or format, as long asyou give appropriate credit to the original author(s) and the source, pro-vide a link to the Creative Commons licence, and indicate if changes weremade. The images or other third party material in this article are includedin the article's Creative Commons licence, unless indicated otherwise in acredit line to the material. If material is not included in the article'sCreative Commons licence and your intended use is not permitted bystatutory regulation or exceeds the permitted use, you will need to obtainpermission directly from the copyright holder. To view a copy of thislicence, visit http://creativecommons.org/licenses/by/4.0/.
References
Agard P, Omrani J, Jolivet L, Mouthereau F (2005) Convergence historyacross. Zagros (Iran): constraints from collisional and earlier defor-mation: International Journal of Earth Sciences 94(3):401–419.https://doi.org/10.1007/s00531-005-0481-4
Aliani F, Maanijou M, Sabouri Z, Sepahi AA (2012) Petrology, geo-chemistry and geotectonic environment of the Alvand Intrusive
Complex. Hamedan, Iran: Chemie der Erde-Geochemistry 72:363–383. https://doi.org/10.1016/j.chemer.2012.05.001
Azizi H, Stern RJ (2019) Jurassic igneous rocks of the central Sanandaj–Sirjan zone (Iran) mark a propagating continental rift, not a magmat-ic arc. Terra Nova 31(5):415–423
Azizi H,Mohammadi K, Asahara Y, Tsuboi M, Daneshvar N,Mehrabi B(2016) Strongly peraluminous leucogranite (Ebrahim-Attar granite)as evidence for extensional tectonic regime in the Cretaceous.Sanandaj Sirjan zone, northwest Iran: Chemie der Erde-Geochemistry 76:529–541. https://doi.org/10.1016/j.chemer.2016.08.006
Azizi H, Lucci F, Stern RJ, Hasannejad S, Asahara Y (2018a) The LateJurassic Panjeh submarine volcano in the northern Sanandaj-SirjanZone, northwest Iran: mantle plume or active margin. Lithos 308:364–380. https://doi.org/10.1016/j.lithos.2018.03.019
Azizi H, Nouri F, Stern RJ, Azizi M, Lucci F, Asahara Y, ZarinkoubMH,and Chung SL, 2018b, New evidence for Jurassic continental riftingin the northern Sanandaj Sirjan Zone, western Iran: the Ghalaylanseamount, southwest Ghorveh: International Geology Review, p. 1–23. https://doi.org/10.1080/00206814.2018.1535913
Badr A, Davoudian AR, Shabanian N, Azizi H, Asahara Y, Neubauer F,Dong Y, Yamamoto K (2018) A-and I-type metagranites from theNorth Shahrekord Metamorphic Complex, Iran: evidence for EarlyPaleozoic post-collisional magmatism. Lithos 300:86–104
Baharifar A, Moinevaziri H, Bellon H, Piqué A (2004) The crystallinecomplexes of Hamadan (Sanandaj–Sirjan zone, western Iran):metasedimentary Mesozoic sequences affected by late cretaceoustectono-metamorphic and plutonic events. Compt Rendus Geosci336:1443–1452. https://doi.org/10.1016/j.crte.2004.09.014
Barker, F., 1979, Trondhjemite: definition, environment, and hypothesesof origin, in Barker, F., ed., Trondhjemites, dacites and related rocks:Amsterdam, Elsevier, p. 1-11.
Barker E, Arth JG (1976) Generation of trondhjemitic tonalitic liquidsand Archean bimodal trondhjemite-basalt suites. Geology 4:596–600. https://doi.org/10.1130/0091-7613(1976)4<596:gotlaa>2.0.co;2
Beard JS, Lofgren GE (1991) Dehydration melting and water-saturatedmelting of basaltic and andesitic greenstones and amphibolites at 1,3, and 6.9 kbar. J Petrol 32:365–401. https://doi.org/10.1093/petrology/32.2.365
Bryan WB, Finger LT, Chayes F (1969) Estimating proportions in pet-rographic mixing equations by least-squares approximation. Science163(3870):926–927
Castro A (2013) Tonalite–granodiorite suites as cotectic systems: a re-view of experimental studies with applications to granitoid petro-genesis. Earth Sci Rev 124:68–95
Castro A, Patiño Douce AE, Corretge LG, de la Rosa JD, El Biad M, ElHmidi H (1999) Origin of peraluminous granites and granodiorites.Iberian massif, Spain: an experimental test of granite petrogenesis:Contributions to Mineralogy and Petrology 135:255–276. https://doi.org/10.1007/s004100050511
Chiu HY, Chung SL, Zarrinkoub M, Mohammadi SS, Khatib MM,Iizuka Y (2013) Zircon U–Pb age constraints from Iran on the mag-matic evolution related to Neotethyan subduction and Zagros orog-eny. Lithos 162–163:70–87. https://doi.org/10.1016/j.lithos.2013.01.006
Clemens JD (1990) The granulite–granite connexion. In: Vielzeuf D,Vidal P (eds) Granulites and crustal differentiation. KluwerAcademic Publishers, Dordrecht, pp 25–36
Clemens JD, Stevens G (2012) What controls chemical variation in gra-nitic magmas? Lithos 134–135:317–329. https://doi.org/10.1016/j.lithos.2012.01.001
Clemens, J.D., and Watkins, J.M., 2001, The fluid regime of high-temperature metamorphism during granitoid magma genesis: con-tributions to Mineralogy and Petrology, v. 140, p. 600–606. doi:https://doi.org/10.1007/s004100000205
Arab J Geosci (2021) 14:1788 Page 17 of 20 1788

Connolly JAD (2005) Computation of phase equilibria by linear pro-gramming: a tool for geodynamic modeling and its application tosubduction zone decarbonation. Earth Planet Sci Lett 236:524–541.https://doi.org/10.1016/j.epsl.2005.04.033
Conrad WK, Nicholls IA, Wall VJ (1988) Water-saturated and -undersaturated melting of metaluminous and peraluminous crustalcompositions at 10 kbar: evidence for the origin of silicic magmas inthe Taupo Volcanic Zone, New Zealand, and other occurrences. JPetrol 29:765–803. https://doi.org/10.1093/petrology/29.4.765
Dale J, Powell R, White RW, Elmer FL, Holland TJB (2005) A thermo-dynamic model for Ca-Na clinoamphiboles in Na2O-CaO-FeO-MgO-Al2O3-SiO2-H2O-O for petrological calculations. JMetamorph Geol 23:771–791. https://doi.org/10.1111/j.1525-1314.2005.00609.x
Eftekharnejad J (1981) Tectonic division of Iran with respect to sedimen-tary basins (in Persian). J Iran Petrol Soc 82:19–28
Eghlimi B 1998, Geological map of Iran 1:100.000 Sheet 5759“Hamadan”: Geological Survey of Iran, 1 sheet.
Ersoy EY (2013) PETROMODELER (Petrological Modeler): aMicrosoft® Excel© spreadsheet program for modelling melting,mixing, crystallization and assimilation processes in magmatic sys-tems. Turk J Earth Sci 22(1):115–125
Eshraghi, S.A., Mahmoudi Gharai, M., 2003, Geological map of Iran 1:100.000 Sheet 5659 “Tuyserkan”: Geological Survey of Iran, 1sheet.
Fuhrman ML, Lindsley DH (1988) Ternary feldspar modeling and ther-mometry. Am Mineral 73:201–215. https://doi.org/10.1007/bf00379455
Gao P, Zheng YF, Zhao ZF (2016) Experimental melts from crustalrocks: a lithochemical constraint on granite petrogenesis. Lithos266–267:133–157. https://doi.org/10.1016/j.lithos.2016.10.005
García-Arias M, Corretge LG, Castro A (2012) Trace element behaviorduring partial melting of Iberian orthogneisses: an experimentalstudy. Chem Geol 292–293:1–17. https://doi.org/10.1016/j.chemgeo.2011.10.024
García-Casco A, Lázaro C, Torres-Roldán RL, Núñez Cambra K, RojasAgramonte Y, Kröner A, Neubauer F, Millán G, Blanco Quintero I(2008) Partial melting and counterclockwise P–T path of subductedoceanic crust (Sierra del Convento mélange, Cuba). J Petrol 49:129–161
Ghasemi A, Talbot CJ (2006) A new tectonic scenario for the Sanandaj–Sirjan Zone (Iran). J Asia Earth Sci 26:683–693. https://doi.org/10.1016/j.jseaes.2005.01.003
Graphchikov AA, Konilov AN, Clemens JD (1999) Biotite dehydration,partial melting, and fluid composition: experiments in the systemKAlO2-FeO-MgO-SiO2-H2O-CO2. Am Mineral 84(1-2):15–26
Green ECR, White RW, Diener JFA, Powell R, Holland TJB, Palin RM(2016) Activity-composition relations for the calculation of partialmelting equilibria in metabasic rocks. J Metamorph Geol 34:845–869. https://doi.org/10.1111/jmg.12211
Hassanzadeh J, Wernicke B (2016) The Neotethyan Sanadaj–Sirjan zoneof Iran as an archetype for passive margin–arc transitions. Tectonics35:586–621. https://doi.org/10.1002/2015tc003926
Hassanzadeh J, Stockli DF, Horton BK, Axen GJ, Stockli LD, Grove M,Schmitt AK, Walker JD (2008) U–Pb zircon geochronology of lateNeoproterozoic-Early Cambrian granitoids in Iran: implications forpaleogeography, magmatism, and exhumation history of Iranianbasement. Tectonophysics 451:71–96. https://doi.org/10.1016/j.tecto.2007.11.062
Holland TJB, Powell R (2003) Activity–composition relations for phasesin petrological calculations: an asymmetric multicomponent formu-lation. Contrib Mineral Petrol 145(4):492–501
Holland TJB, Powell R (2011) An improved and extended internallyconsistent thermodynamic dataset for phases of petrological interest,involving a new equation of state for solids. J Metamorph Geol29(3):333–383
Hosseini SA, Afzal P, Sadeghi B, Shahrokhi SV, Farhadinejad T (2015)Prospection of Au mineralization based on stream sediments andlithogeochemical data using multifractal modeling in Alut 1:100,000 sheet. NW Iran: Arabian Journal of Geosciences v 8:3867–3879. https://doi.org/10.1007/s12517-014-1436-5
Hu ZP, Zhang YS, Hu R, Wang J, Siebel W, Chen F (2016) Amphibole-bearing migmatite in North Dabie, eastern China: Water-fluxedmelting of the orogenic crust. J Asian Earth Sci 125:100-116. https://doi.org/10.1016/j.jseaes.2016.05.018
Johannes W, Holtz F (1996) Petrogenesis and experimental petrology ofgranitic rock: Berlin. Springer Press, Heidelberg, p 335
Koepke J, Feig ST, Snow JE (2005) Hydrous partial melting within thelower oceanic crust. Terra Nova 17:286–291. https://doi.org/10.1111/j.1365-3121.2005.00613.x
Kriegsman L (2001) Partial melting, partial melt extraction and partialback reaction in anatectic migmatites. Lithos 56:75–96. https://doi.org/10.1016/S0024-4937(00)00060-8
Laurie A, Stevens G (2012) Water-present eclogite melting to produceEarth's early felsic crust. Chem Geol 314–317:83–95. https://doi.org/10.1016/j.chemgeo.2012.05.001
LeMaitre RW, Streckeisen A, Zanettin B, Le Bas MJ, Bonin B, BatemanP, Bellieni G, Dudek A, Efremova S, Keller J, Lameyre J, SabinePA, Schmid R, Sqrensen H, Woolley AR (2002) Igneous rocks aclassification and glossary of terms recommendations of theInternational Union of Geological Sciences, Sub-Commission onthe Systematics of Igneous Rocks: Cambridge University Press.UK, Cambridge, p 236
López S, Castro A (2001) Determination of the fluid-absent solidus andsupersolidus phase relationships of MORB-derived amphibolites inthe range 4–14 kbar. AmMineral 86:1396–1403. https://doi.org/10.2138/am-2001-11-1208
Lucci F, Rossetti F, White JC, Moghadam HS, Shirzadi A, Nasrabady M(2016) Tschermak fractionation in calc-alkaline magmas: theEocene Sabzevar volcanism (NE Iran). Arab J Geosci 9(10):573.https://doi.org/10.1007/s12517-016-2598-0
Lucci F, Rossetti F, Becchio R, Theye T, Gerdes A, Opitz J, Baez W,Bardelli L, De Astis G, Viramonte J, Giordano G (2018) MagmaticMn-rich garnets in volcanic settings: age and longevity of the mag-matic plumbing system of the Miocene Ramadas volcanism (NWArgentina). Lithos 322:238–249. https://doi.org/10.1016/j.lithos.2018.10.016
Mahmoudi S, Corfu F, Masoudi F, Mehrabi B, Mohajjel M (2011) U–Pbdating and emplacement history of granitoid plutons in the northernSanandaj–Sirjan Zone. Iran: Journal of Asian Earth Sciences 41:238–249. https://doi.org/10.1016/j.jseaes.2011.03.006
Malek-Mahmoudi F, Davoudian AR, Shabanian N, Azizi H, Asahara Y,Neubauer F, Dong Y (2017) Geochemistry of metabasites from theNorth Shahrekord metamorphic complex, Sanandaj-Sirjan Zone:geodynamic implications for the Pan-African basement in Iran.Precambrian Res 293:56–72. https://doi.org/10.1016/j.precamres.2017.03.003
Middlemost EAK (1994) Naming materials in the magma/igneous rocksystem. Earth-Sci Rev 37:215–224. https://doi.org/10.1016/0012-8252(94)90029-9
Miller CF, McDowell SM, Mapes RW (2003) Hot and cold granites?Implications of zircon saturation temperatures and preservation ofinheritance. Geology 31:529–532. https://doi.org/10.1130/0091-7613(2003)031<0529:HACGIO>2.0.CO;2
MoghadamHS, Li QL, GriffinWL, Stern RJ, Ishizuka O, Henry H, LucciF, O’Reilly SY, Ghorbani G (2020) Repeated magmatic buildup anddeep “hot zones” in continental evolution: the Cadomian crust ofIran. Earth Planet Sci Lett 531:115989. https://doi.org/10.1016/j.epsl.2019.115989
Moghadam HS, Li QL, Griffin WL, Stern RJ, Santos JF, Lucci F,Beyarslan M, Ghorbani G, Ravankhah A, Tilhac R, O'Reilly SY(2021) Prolonged magmatism and growth of the Iran-Anatolia
1788 Page 18 of 20 Arab J Geosci (2021) 14:1788

Cadomian continental arc segment in Northern Gondwana. Lithos,384:105940. https://doi.org/10.1016/j.lithos.2020.105940
Mohajjel M, Fergusson CL (2000) Dextral transpression in LateCretaceous continental collision. Sanandaj–Sirjan zone, westernIran: J Structural Geol 22(8):1125–1139
Mohajjel M, Fergusson CL, Sahandi MR (2003) Cretaceous–Tertiaryconvergence and continental collision, Sanandaj–Sirjan zone,Western Iran. J Asian Earth Sci 21:397–412. https://doi.org/10.1016/s1367-9120(02)00035-4
Montel JM (1993) A model for monazite/melt equilibrium and applica-tion to the generation of granitic magmas. ChemGeol 110:127–146.https://doi.org/10.1016/0009-2541(93)90250-m
Montel JM, and Vielzeuf D, (1997), Partial melting of metagreywackes,part II. Compositions of minerals and melts: contributions toMineralogy and Petrology, v. 128, p. 176–196. doi:https://doi.org/10.1007/s004100050302
Moyen J, Stevens G (2006) Experimental constraints on TTG petrogen-esis: implications for Archean geodynamics. In: Benn K, MareschalJ-C, Condie KC (eds) Archean Geodynamics and Environments,Geophysical Monograph Series-American Geophysical Union, vol164, pp 149–175. https://doi.org/10.1029/164GM11
Nilsen O, Sundvoll B, Roberts D, Corfu F (2003) U-Pb geochronologyand geochemistry of trondhjemites and a norite pluton from the SWTrondheim Region, Central Norwegian Caledonides. Norges GeolUnders Bull 441:5–16
Patiño Douce AE (1999) What do experiments tell us about the relativecontributions of crust and mantle to the origin of granitic magmas.In: Castro A, Fernandez C, Vigneresse JL (eds) UnderstandingGranites: Integrating New and Classical Techniques, GeologicalSociety, vol 168. Special Publications, London, pp 55–75
Patiño Douce AE, Beard JS (1995) Dehydration-melting of biotite gneissand quartz amphibolite from 3 to 15 kbar. J Petrol 36:707–738.https://doi.org/10.1093/petrology/36.3.707
Pattison DRM (1991) Infiltration-driven dehydration and anatexis ingranulite facies metagabbro, Grenville Province, Ontario, Canada.J Metamorph Geol 9(3):315–332
Rabiee A, Rossetti F, Asahara Y, Azizi H, Lucci F, Lustrino M, NozaemR (2020) Long-lived, Eocene-Miocene stationary magmatism inNW Iran along a transform plate boundary. Gondwana Res 85:237–262
Ratajeski K, Glazner AF,Miller BV (2001) Geology and geochemistry ofmafic to felsic plutonic rocks associated with the intrusive suite ofYosemite Valley. California: Geol Soc America Bullet 113:1486–1502. https://doi.org/10.1130/0016-7606(2001)113<1486:GAGOMT>2.0.CO;2
Ratajeski K, Sisson TW, Glazner AF (2005) Experimental and geochem-ical evidence for derivation of the El Capitan Granite. California, bypartial melting of hydrous gabbroic lower crust: Contributions toMineralogy and Petrology 149:713–734. https://doi.org/10.1007/s00410-005-0677-4
Rossetti F, Dini A, Lucci F, Bouybaouene M, Faccenna C (2013) EarlyMiocene strike-slip tectonics and granite emplacement in theAlboran Domain (Rif Chain, Morocco): significance for thegeodynamic evolution of Western Mediterranean. Tectonophysics608:774–791. https://doi.org/10.1016/j.tecto.2013.08.002.
Rossetti F, Nasrabady M, Theye T, Gerdes A, Monie P, Lucci F,Vignaroli G (2014) Adakite differentiation and emplacement in asubduction channel: the late Paleocene Sabzevar magmatism (NEIran). Geol Soc Am Bull 126:317–343. https://doi.org/10.1130/b30913.1
Rossetti F, Lucci F, Theye T, Bouybaouenne M, Gerdes A, Opitz J, DiniA, Lipp C (2020) Hercynian anatexis in the envelope of the BeniBousera peridotites (Alboran Domain, Morocco): implications forthe tectono-metamorphic evolution of the deep crustal roots of theMediterranean region. Gondwana Res 83:157–182. https://doi.org/10.1016/j.gr.2020.01.020
Rushmer T (1991) Partial melting of two amphibolites: contrasting ex-perimental results under fluid-absent conditions. Contrib MineralPetrol 107(1):41–59
Saki A, Moazzen M, Baharifar A (2012) Migmatite microstructures andpartial melting of Hamadan metapelitic rocks, Alvand contact aure-ole, western Iran. Int Geol Rev 54:1229–1240. https://doi.org/10.1080/00206814.2011.636639
Saki, A., Miri, M., and Oberhänsli, R., 2020, High temperature – lowpressure metamorphism during subduction of Neo-Tethys beneaththe Iranian plate: evidence for mafic migmatite formation in theAlvand complex (western Iran): Mineralogy and Petrology, doi:https://doi.org/10.1007/s00710-020-00721-z
Saki A, Lucci F, Miri M, White JC (2021) Trondhjemite leucosomesgenerated by partial melting of a hornblende-gabbro (Alvand plu-tonic complex, Hamedan, NW Iran). Int Geol Rev 1-34:1–34.https://doi.org/10.1080/00206814.2020.1861554
Sawyer EW (2008) Atlas of Migmatites: the Canadian MineralogistSpecial Publication 9. National Research Press, Ottawa, Canada, p371
Sepahi AA (2008), Typology and petrogenesis of granitic rocks in theSanandaj-Sirjan metamorphic belt, Iran: with emphasis on theAlvand plutonic complex: Neues Jahrbuch für Geologie undPaläontologie-Abhandlungen, v. 247, p. 295–312. doi:https://doi.org/10.1127/0077-7749/2008/0247-0295
Sepahi AA, Jafari SR, Mani-Kashani S (2009) Low pressure migmatitesfrom the Sanandaj-Sirjan Metamorphic Belt in the Hamedan regionIran. Geol Carpath 602:107–119. https://doi.org/10.2478/v10096-009-0007-2
Sepahi AA, Borzoei K, Salami S (2013) Mineral chemistry andthermobarometry of plutonic, metamorphic and anatectic rocks fromthe Tueyserkan area (Hamedan, Iran). Geological Quarterly 57(3):515–526
Sepahi AA, Salami S, Lentz D, McFarlane C, Maanijou M (2018)Petrography, Geochemistry and U-pb geochronology of pegmatitesand aplites associated with the Alvand intrusive complex in theHamedan Region, Sanandaj-sirjan Zone, Zagros Orogen (Iran). IntJ Earth Sci 107:1059–1096. https://doi.org/10.1007/s00531-017-1515-4
Sepahi AA, Jafari SR, Osanai Y, Shahbazi H, Moazzen M (2019) Age,petrologic significance and provenance analysis of the Hamedanlow pressure migmatites, Sanandaj-Sirjan zone, west Iran. Int GeolRev 61:1446–1461. https://doi.org/10.1080/00206814.2018.1517392
Sepahi AA, Vahidpour H, Lentz DR, McFarlane CM, Maanijou M,Salami S, Miri M, Mansouri M, Mohammadi R (2020) Raresapphire-bearing syenitoid pegmatites and associated granitoids ofthe Hamedan region, Sanandaj–Sirjan zone, Iran: analysis of petrol-ogy, lithogeochemistry and zircon geochronology / trace elementgeochemistry. Geol Mag 157:1499–1525. https://doi.org/10.1017/S0016756820000023
Shahbazi H, Siebel W, Pourmoafee M, Ghorbani M, Sepahi AA, ShangCK, Abedini MV (2010) Geochemistry and U–Pb zircon geochro-nology of the Alvand plutonic complex in Sanandaj–Sirjan Zone(Iran): new evidence for Jurassic magmatism. J Asian Earth Sci39:668–683. https://doi.org/10.1016/j.jseaes.2010.04.014
Shahbazi H, Salami S, Siebel W (2014) Genetic classification of mag-matic rocks from the Alvand plutonic complex, Hamedan, westernIran, based on zircon crystal morphology. Chemie der Erde-Geochemistry 74:577–584. https://doi.org/10.1016/j.chemer.2013.11.001
ShawGE (1970) A summary of lightning current measurements collectedat Mount Lemmon, Arizona. J Geophys Res 75:2159–2164. https://doi.org/10.1029/JC075i012p02159 issn: 0148-0227
Sheikhi Gheshlaghi R, GhorbaniM, Sepahi AA, Deevsalar R, and ShinjoR, (2020), Petrogenesis of gem sapphire in a pegmatite-aplite vein
Arab J Geosci (2021) 14:1788 Page 19 of 20 1788

from the Alvand batholith,Western Iran: Mineralogy and Petrology,doi:https://doi.org/10.1007/s00710-020-00716-w
Singh J, Johannes W (1996) Dehydration melting of tonalites. Part IBeginning of melting: contributions to mineralogy and petrology125(1):16–25
Sisson TW, and Grove TL, (1993), Temperatures and H2O contents oflow-MgO high-alumina basalts: contributions to Mineralogy andPetrology, v. 113, p. 167–184. doi:https://doi.org/10.1007/bf00283226
Sisson TW, Ratajeski K, Hankins WB, and Glazner AF, (2005),Voluminous granitic magmas from common basaltic sources: con-tributions to Mineralogy and Petrology, v. 148, p. 635–661. doi:https://doi.org/10.1007/s00410-004-0632-9
Skjerlie KP, Johnston AD (1996) Vapour-absent melting from 10 to 20kbar of crustal rocks that contain multiple hydrous phases: implica-tions for anatexis in the deep to very deep continental crust andactive continental margins. J Petrol 37:661–691. https://doi.org/10.1093/petrology/37.3.661
Skjerlie KP, and Patiño Douce AE, (1995), Anatexis of interlayered am-phibolite and pelite at 10 kbar: effect of diffusion of major compo-nents on phase relations and melt fraction: Contributions toMineralogy and Petrology, v. 122, p. 62–78. doi:https://doi.org/10.1007/s004100050113
Skjerlie KP, PatiñoDouceAE (2002) The fluid-absent partial melting of azoisite-bearing quartz eclogite from 1· 0 to 3· 2 GPa; Implications formelting in thickened continental crust and for subduction-zone pro-cesses. J Petrol 43(2):291–314
Springer W, and Seck HA, 1997, Partial fusion of basic granulites at 5 to15 kbar: Implications for the origin of TTG magmas: contributionsto Mineralogy and Petrology, v. 127, p. 30−45. doi:https://doi.org/10.1007/s004100050263
Stöcklin J (1968) Structural history and tectonics of Iran: a review. AmAssoc Pet Geol Bull 52:1229–1258. https://doi.org/10.1306/5d25c4a5-16c1-11d7-8645000102c1865d
Stöcklin J, and Nabavi MH, 1973, Tectonic map of iran: geological sur-vey of Iran, scale 1:2 500 000.
Streckeisen AL (1976) Classification and nomenclature of igneous rocks.Final report of an inquiry. Neues Jb Mineral Abh 107:144–240
Sun SS, McDonough WF (1989) Chemical and isotopic systematics ofoceanic basalts: implications for mantle composition and processes.In: Saunders AD, Norry MJ (eds) Magmatism in the Ocean Basins,vol 42. The Geological Society of London, London, pp 313–345.https://doi.org/10.1144/gsl.sp.1989.042.01.19
Tajcmanova L, Connolly JAD, Cesare B (2009) A thermodynamic modelfor titanium, ferric iron solution in biotite. J Metamorph Geol 27:153–165. https://doi.org/10.1111/j.1525-1314.2009.00812.x
Taylor J, Stevens G (2010) Selective entrainment of peritectic garnet intoS-type granitic magmas: evidence from Archaean mid-crustalanatectites. Lithos 120(3-4):277–292
Thompson AB, Ellis DJ (1994) CaO+ MgO+ Al2O3+ SiO2+ H2O to 35kb; amphibole, talc, and zoisite dehydration andmelting reactions in
the silica-excess part of the system and their possible significance insubduction zones, amphibolite melting, and magma fractionation.Am J Sci 294(10):1229–1289
Vielzeuf D, and Montel JM, 1994, Partial melting of metagreywackes.Part I. Fluid-absent experiments and phase relationships:Contributions to Mineralogy and Petrology, v. 117, p. 375–393.doi:https://doi.org/10.1007/bf00307272
Vielzeuf D, and Vidal Ph (eds) (1990), Granulites and crustal differenti-ation: Kluwer Academic Publishers, Dordrecht, p. 601.
Watkins JM, Clemens JD, and Treloar PJ, 2007, Archaean TTGs assources of younger granitic magmas: melting of sodic metatonalitesat 0.6–1.2 GPa: contributions to Mineralogy and Petrology, v. 154,p. 91–110. doi:https://doi.org/10.1007/s00410-007-0181-0
Watson EB, Harrison TM (1983) Zircon saturation revisited: temperatureand composition effects in a variety of crustal magma types. EarthPlanet Sci Lett 64:295–304. https://doi.org/10.1016/0012-821X(83)90211-X
Weinberg RF, Hasalová P (2015)Water-fluxed melting of the continentalcrust: a review. Lithos 212:158–188
White JC, Parker DF, Ren M (2009) The origin of trachyte andpantellerite from Pantelleria, Italy: insights from major element,trace element, and thermodynamic modelling. J VolcanolGeotherm Res 179(1):33–55
White RW, Powell R, Holland TJB, Johnson TE, Green ECR (2014)Newmineral activity–composition relations for thermodynamic calcula-tions in metapelitic systems. J MetamorphGeol 32:261–286. https://doi.org/10.1111/jmg.12071
Whitney DL, Evans BW (2010) Abbreviations for names of rock-formingminerals. Am Mineral 95:185–187. https://doi.org/10.2138/am.2010.3371
Yang TN, Chen JL, LiangMJ, Xin D,AghazadehM,Hou ZQ, ZhangHR(2018) Two plutonic complexes of the Sanandaj-Sirjan magmatic-metamorphic belt record Jurassic to Early Cretaceous subduction ofan old Neo-Tethys beneath the Iran microplate. Gondwana Res 62:246–268. https://doi.org/10.1016/j.gr.2018.03.016
Zhang H, Chen J, Yang T, Hou Z, Aghazadeh M (2018a) Jurassic gran-itoids in the northwestern Sanandaj–Sirjan zone: evolvingmagmatism in response to the development of a Neo-Tethyan slabwindow. Gondwana Res 62:269–286. https://doi.org/10.1016/j.gr.2018.01.012
Zhang Z, XiaoW, Ji W, MajidifardMR, Rezaeian M, TalebianM, XiangD, Chen L, Wan B, Ao S, Esmaeili R (2018b) Geochemistry, zirconU-Pb and Hf isotope for granitoids, NW Sanandaj-Sirjan zone, Iran:implications for Mesozoic-Cenozoic episodic magmatism duringNeo-Tethyan lithospheric subduction. Gondwana Res 62:227–245.https://doi.org/10.1016/j.gr.2018.04.002
Zou HB (1998) Trace element fractionation during modal and non-modaldynamic melting and open-system melting: a mathematical treat-ment. Geochim Cosmochim Acta 62:1937–1945
1788 Page 20 of 20 Arab J Geosci (2021) 14:1788