genes and gene networks involved in sodium fluoride...
TRANSCRIPT

Int. J. Mol. Sci. 2014, 15, 8959-8978; doi:10.3390/ijms15058959
International Journal of
Molecular Sciences ISSN 1422-0067
www.mdpi.com/journal/ijms
Article
Genes and Gene Networks Involved in Sodium Fluoride-Elicited Cell Death Accompanying Endoplasmic Reticulum Stress in Oral Epithelial Cells
Yoshiaki Tabuchi 1,*, Tatsuya Yunoki 2, Nobuhiko Hoshi 3, Nobuo Suzuki 4 and Takashi Kondo 2
1 Division of Molecular Genetics Research, Life Science Research Center, University of Toyama,
2630 Sugitani, Toyama 930-0194, Japan 2 Department of Radiological Sciences, Graduate School of Medicine and Pharmaceutical Sciences,
University of Toyama, 2630 Sugitani, Toyama 930-0194, Japan;
E-Mails: [email protected] (T.Y.); [email protected] (T.K.) 3 Department of Animal Science, Graduate School of Agricultural Science, Kobe University,
1-1 Rokkodai, Kobe 657-8501, Japan; E-Mail: [email protected] 4 Noto Marine Laboratory, Institute of Nature and Environmental Technology, Kanazawa University,
Housu-gun, Ishikawa 927-0553, Japan; E-Mail: [email protected]
* Author to whom correspondence should be addressed; E-Mail: [email protected];
Tel.: +81-76-434-7185; Fax: +81-76-434-5176.
Received: 13 February 2014; in revised form: 5 May 2014 / Accepted: 13 May 2014 /
Published: 20 May 2014
Abstract: Here, to understand the molecular mechanisms underlying cell death induced by
sodium fluoride (NaF), we analyzed gene expression patterns in rat oral epithelial ROE2
cells exposed to NaF using global-scale microarrays and bioinformatics tools. A relatively
high concentration of NaF (2 mM) induced cell death concomitant with decreases in
mitochondrial membrane potential, chromatin condensation and caspase-3 activation.
Using 980 probe sets, we identified 432 up-regulated and 548 down-regulated genes, that
were differentially expressed by >2.5-fold in the cells treated with 2 mM of NaF and
categorized them into 4 groups by K-means clustering. Ingenuity® pathway analysis
revealed several gene networks from gene clusters. The gene networks Up-I and Up-II
included many up-regulated genes that were mainly associated with the biological function
of induction or prevention of cell death, respectively, such as Atf3, Ddit3 and Fos (for Up-I)
and Atf4 and Hspa5 (for Up-II). Interestingly, knockdown of Ddit3 and Hspa5 significantly
increased and decreased the number of viable cells, respectively. Moreover, several
endoplasmic reticulum (ER) stress-related genes including, Ddit3, Atf4 and Hapa5, were
OPEN ACCESS
Int. J. Mol. Sci. 2014, 15 8960
observed in these gene networks. These findings will provide further insight into
the molecular mechanisms of NaF-induced cell death accompanying ER stress in oral
epithelial cells.
Keywords: sodium fluoride; gene expression; gene network; cell death; endoplasmic
reticulum stress; oral epithelial cell
1. Introduction
Fluoride is abundant in the environment and its addition to water and toothpaste has been
instrumental in the decline of dental caries. A major source of fluoride is drinking water, including
underground water contaminated by geological sources and fluoridated community drinking water.
Although an appropriate range of fluoride is thought to be safe and effective for caries reduction,
excessive fluoride intake results in toxic effects in either hard tissues of the teeth and skeleton or soft
tissues of the kidneys, lungs and brain [1–4]. In addition, when toothpastes or mouse rinses are applied
to the tooth surface, a relatively high concentration of fluoride comes into contact with and can be
absorbed by the oral mucosa [5]. Previous reports have demonstrated that toxic effects of fluoride were
observed in the oral mucosa in vivo [6,7] and oral cells in vitro [8–10].
Fluoride at a millimolar range affects diverse cellular functions such as enzyme activity, induction
of DNA damage, signal transduction and cell-cycle changes [1,4,6,8,11], and induces forms of cell
death, including apoptosis [1,6,8,11–13]. Sodium fluoride (NaF) is reported to be cytotoxic to oral
mucosal fibroblasts due to its inhibition of protein synthesis and mitochondrial functions [8]. He and
Chen [6] reported that fluoride could induce DNA damage and cell cycle changes and lead to apoptosis
in oral mucosal cells and hepatocytes. In addition, NaF induces apoptosis through bcl-2 family
protein-, caspase- and/or c-jun N-terminal kinase-mediated pathways [11,13].
The endoplasmic reticulum (ER) is a key organelle in the secretory pathway. ER stress occurs when
unfolded or misfolded proteins are increased in the ER, triggering an unfolded protein response that is
designed to restore protein homeostasis [14,15]. A variety of physiological and pharmacological insults
lead to ER stress. The chaperone-binding protein, heat shock 70 kDa protein 5, glucose-regulated
protein, and 78 kDa (Hspa5), a central regulator of ER homeostasis, are up-regulated under ER stress
conditions [16]. The basic-region leucine zipper (bZIP) transcription factor DNA-damage-inducible
transcript 3 (Ddit3) is induced in response to cellular stresses, especially ER stress, and is involved in
the process of apoptosis associated with ER stress [17]. Experimental data have demonstrated that
fluoride induces ER stress in several kinds of cells [9,10,18,19]. In ameloblast cells, fluoride elicits ER
stress and expression of Hspa5 and inhibits cell growth and protein secretion [10,18]. Also, treatment
with fluoride is reported to induce ER stress and apoptosis or cell damage and to increase the
expressions of Hspa5 and Ddit3 [9,19]. As described above, many biological processes are affected by
fluoride [1], whereas the overall responses to fluoride in cells are still unclear. Transcript profiling
technologies including DNA microarray have made it possible to profile global gene expression
patterns associated with different biological responses during chemical and physiological stresses. To
date, several studies have utilized this technology for identifying changes in the gene expression of

Int. J. Mol. Sci. 2014, 15 8961
odontoblast culture cells induced by a fluoride at non-toxic doses [20], incisor pulp tissue during
fluorosis [21] and the sperm of mice treated with fluoride [22]. Recently, pathway analysis technologies
have enabled the mapping of gene expression data into relevant pathway maps on the basis of their
functional annotation and known molecular interactions and we have used these in biological
experiments [23,24]. The aim of the present study was to better understand the molecular mechanisms
by which NaF induces cell death; thus, we determined the gene expression patterns of oral epithelial
ROE2 cells exposed to this compound using a combination of global-scale microarrays and
bioinformatics tools.
2. Results
2.1. The Effects of Sodium Fluoride (NaF) on Cell Number and Cell Viability in Oral Epithelial
ROE2 Cells
We monitored whether NaF affected cell number and cell viability in oral epithelial ROE2
cells [25]. NaF at concentrations of 2 and 4 mM resulted in a significant decrease in cell number by the
trypan blue dye exclusion assay, and the inhibition percentages were 59.3% and 74.4%, respectively
(Figure 1A). Exposure of the cells to NaF at concentrations of 1, 2 and 4 mM significantly and
concentration-dependently decreased cell viability in the WST-8 assay, and the inhibition percentages
were 22.3%, 50.5% and 74.7%, respectively (Figure 1B).
Figure 1. Effects of sodium fluoride (NaF) on cell number and cell viability in rat oral
epithelial ROE2 cells. Cells were incubated with NaF at concentrations of 0 to 4 mM for
24 h. (A) Cell number was counted using a hematocytometer. The data represent the
means ± standard deviations (N = 4); and (B) Cell viability was monitored using a WST-8
assay. Cells treated with 0 mM NaF served as a control (100%). The data represent the
means ± standard deviations (N = 8). * p < 0.05 vs. NaF (0 mM) (Student’s t-test).
2.2. The Effects of NaF on Protein Content, Mitochondrial Membrane Potential (MMP) and Cell
Death in ROE2 Cells
NaF (2 and 4 mM) significantly reduced the protein content in cells, and the inhibition percentages
were 15.4% and 25.9%, respectively (Figure 2A). Mitochondrial membrane potential (MMP) was

Int. J. Mol. Sci. 2014, 15 8962
determined using JC-1, a cytofluorimetric dye. JC-1 can selectively enter into mitochondria and
reversibly change color from green (the monomeric form of JC-1) to red (the aggregate form) as the
membrane potential increases [26]. Although intact MMP (red fluorescence) was observed in the
control group (Figure 3A–C), exposure of the cells to NaF (2 mM) induced a marked decrease of
MMP (green fluorescence) (Figure 3D–F). When cell death was evaluated as the level of chromatin
condensation, it was significantly increased to 15.0% and 27.1% in the cells treated with NaF at
concentrations of 2 and 4 mM, respectively (Figure 2B). Caspase-3 is known to be a critical
executioner of apoptosis, and is activated by the proteolytic processing of its inactive zymogen into
activated p17 and p12 fragments [27]. A Western blot with anti-caspase-3 antibody clearly
demonstrated that although the protein level of cleaved caspase-3 was below the detection limit in
vehicle-treated cells, the level was markedly elevated in NaF (2 mM)-treated cells. The peak
expression of the fragment was observed at 6 h after the treatment. On the other hand, the protein
level of procaspase-3 was constant under both experimental conditions. Moreover, an increase in
the expression level of cleaved caspase-3 was observed in compound-treated cells, which was
demonstrated by Western blot with anti-cleaved caspase-3 antibody (Figure 4). These data indicated
that NaF (2 mM) decreased either the protein content or MMP, and induced cell death. For further
experiments, we selected a concentration of 2 mM NaF.
Figure 2. Effects of NaF on protein content and chromatin condensation in ROE2 cells.
Cells were incubated with NaF at concentrations of 0 to 4 mM for 24 h.
(A) The protein contents in cells were estimated by using a Pierce® bicinchoninic acid
(BCA) Protein Assay Kit (Pierce Biotechnology, Rockford, IL, USA); and (B) Chromatin
condensation was measured using a Nuclear-ID Green Chromatin Condensation Kit
(Enzo Life Sciences Inc., Farmingdale, NY, USA). The data represent the means ± standard
deviations (N = 3).* p < 0.05 vs. NaF (0 mM) (Student’s t-test).

Int. J. Mol. Sci. 2014, 15 8963
Figure 3. Effects of NaF on mitochondrial membrane potential (MMP) in ROE2 cells.
Cells were cultured with or without 2 mM of NaF for 6 h. MMP was measured by
JC-1, an indicator of mitochondrial function. (A,D) monomeric JC-1 green fluorescence;
(B,E) aggregate JC-1 red fluorescence; and (C,F) merge images. (A–C) control cells (Ctr.);
and (D–F) NaF-treated cells. Ctr., control. Scale Bar, 200 μm.
2.3. Global Gene Expression and Cluster Analyses
To identify genes that were differentially expressed and were involved in cell death induced by
NaF in ROE2 cells, time course global-scale gene expression analysis was performed using
a GeneChip® system. Of the 31,099 probe sets analyzed, 11,379 probe sets were expressed in ROE2
cells treated with or without 2 mM of NaF for 3, 6 and 12 h treatments. The lists of probe sets obtained
from cell samples have been deposited in the Gene Expression Omnibus, a public database, and are
accessible through the series accession number (GSE53937). Expression analysis using GeneSpring®
software demonstrated that a total of 980 probe sets, 432 up-regulated and 548 down-regulated, were
differentially regulated by a factor of 2.5 or more. In addition, K-means clustering, a non-hierarchical
gene clustering algorithm, was conducted to generate the major patterns of gene expression during
NaF-elicited cell death. As shown in Figure 5, the differentially expressed probe sets were classified in
4 clusters, designated as Up-I, Up-II, Down-I and Down-II. Clusters Up-I and Down-I contained 133
rapidly increased and 210 rapidly decreased probe sets, respectively. Clusters Up-II and Down-II
contained 299 gradually increased and 338 gradually decreased probe sets, respectively. Information
on the probe sets of these clusters is listed in Tables S1–S4 of the supplementary data.
Int. J. Mol. Sci. 2014, 15 8964
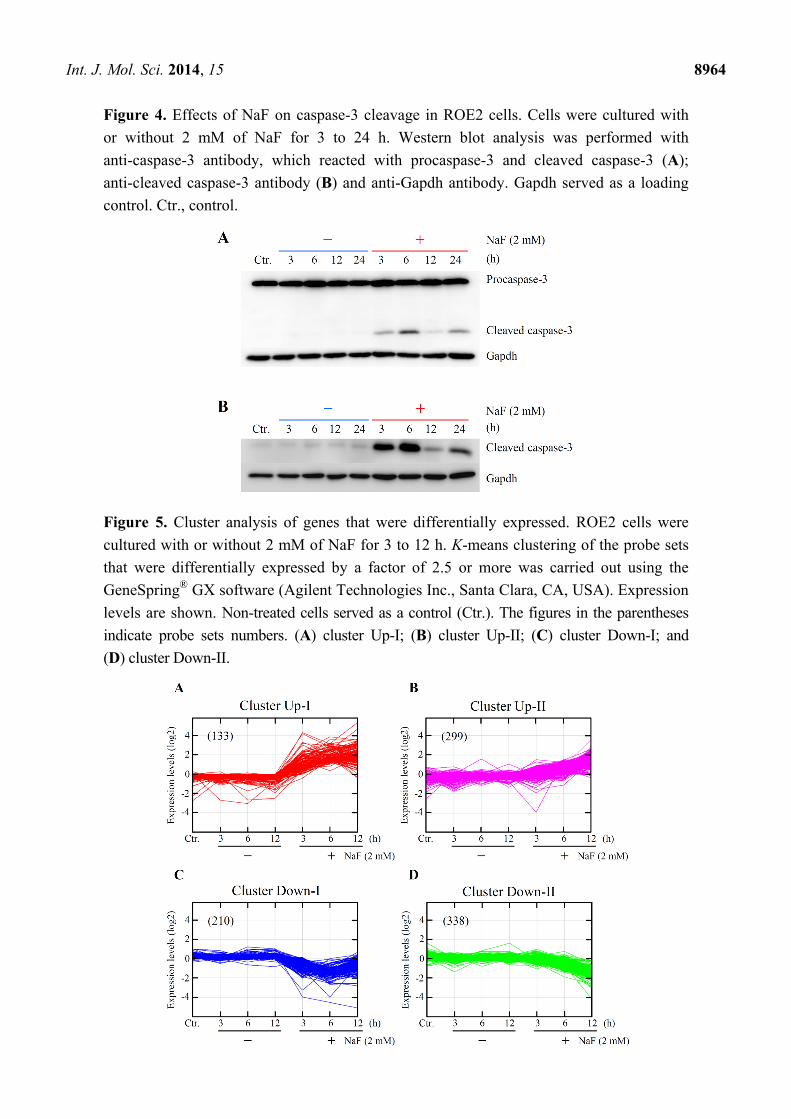
Figure 4. Effects of NaF on caspase-3 cleavage in ROE2 cells. Cells were cultured with
or without 2 mM of NaF for 3 to 24 h. Western blot analysis was performed with
anti-caspase-3 antibody, which reacted with procaspase-3 and cleaved caspase-3 (A);
anti-cleaved caspase-3 antibody (B) and anti-Gapdh antibody. Gapdh served as a loading
control. Ctr., control.
Figure 5. Cluster analysis of genes that were differentially expressed. ROE2 cells were
cultured with or without 2 mM of NaF for 3 to 12 h. K-means clustering of the probe sets
that were differentially expressed by a factor of 2.5 or more was carried out using the
GeneSpring® GX software (Agilent Technologies Inc., Santa Clara, CA, USA). Expression
levels are shown. Non-treated cells served as a control (Ctr.). The figures in the parentheses
indicate probe sets numbers. (A) cluster Up-I; (B) cluster Up-II; (C) cluster Down-I; and
(D) cluster Down-II.

Int. J. Mol. Sci. 2014, 15 8965
2.4. Identification of Gene Functions and Gene Networks
To gain further insight into the molecular mechanism of NaF-induced cell death in ROE2 cells,
we performed gene function and pathway analyses using the Ingenuity® Pathways Knowledge Base
(Ingenuity Systems Inc., Mountain View, CA, USA). The numbers of functionally annotated genes in
the clusters Up-I (133 probe sets), Up-II (299), Down-I (210) and Down-II (338) were 58, 100, 103
and 158, respectively. Functional category analysis of genes of these clusters demonstrated many
biological functions, including cell death or ER-stress. Table 1 shows the number of cell death-related
genes whose functions were increased or decreased in Up-I and Up-II clusters. Moreover, ER
stress-associated genes, such as Ddit3 [17], homocysteine-inducible, endoplasmic reticulum stress-inducible,
ubiquitin-like domain member 1 (Herpud1) [28], protein phosphatase 1, regulatory subunit 15A
(Ppp1r15a) [29] and tumor necrosis factor (Tnf) [30] (for Up-I) and activating transcription factor 4
(Atf4) [31], caspase 12 (Casp12) [32], glucosidase β 2 (Gba2) [33], heat shock protein 4-like
(Hspa4l) [34] and Hspa5 [16] (for Up-II) were observed in these clusters. When cell death-associated
genes belonging to clusters Up-I and Up-II were analyzed, the gene networks Up-I and Up-II were
identified, respectively (Figures 6 and 7). The gene network Up-I contained many cell death-inducing
genes, including activating transcription factor 3 (Atf3) [35], Ddit3 [17] and FBJ osteosarcoma
oncogene (Fos) [36]. The gene network Up-II contained many cell death-preventing genes, including
Atf4 [37], Hspa5 [38] and sequestosome 1 (Sqstm1) [39].
Table 1. The function of cell death-related genes in Up-I and Up-II clusters.
Clusters Functions Genes
Up-I
Pro-cell death 1 Atf3, Ddit3, Egr1, Fos, Fosb, Fosl1, Gch1, Hbegf, Icam1, Mmp10, Nedd9, Nr4a1,
Ppp1r15a, Rassf1, Tnf, Trib3, Zfp36, VGF
Anti-cell death 2 Abcb4, Areg, Bdkrb2, Clcf1, Dusp1, Egr2, Gdf15, Herpud1, Il6, Itsn1, Nr4a2,
Nr4a3, Plaur, Procr, Sema6a, Tslp, Vegfa, Zmynd15
Up-II
Pro-cell death Abcb1, Atf2, Casp4, Casp12, Cxcl12, Fem1b, Il23a, Mllt11, Nrg1, Per1, Slscr1,
Ppif, S100a8, Smox, Surf1, Tfrc, Zc3h8
Anti-cell death Alkbh1, Atf4, Atp2b1, Bcl2a1, Cd55, Cdhr1, Cflar, Csf3, Dnajb9, Ehd4, Hspa5, Hyou1, Itgav, Lin7c, Lonp1, Mafk, Manf, Naa30, Nabp1, Odc1, Plaur, Rbbp6,
Rbpj, Slc1a1, Slc25a19, Slc29a2, Sqstm1, Thbd 1 Genes that are reported to induce cell death; 2 Genes that are reported to prevent cell death.

Int. J. Mol. Sci. 2014, 15 8966
Figure 6. A gene network Up-I. Genes that were up-regulated in the cluster Up-I were
analyzed by the Ingenuity® Pathway analysis software. The network is displayed graphically
as nodes (genes) and edges (the biological relationships between the nodes). Nodes and
edges are displayed as various shapes and labels that present the functional class of genes
and the nature of the relationship between the nodes, respectively.

Int. J. Mol. Sci. 2014, 15 8967
Figure 7. A gene network Up-II. Genes that were up-regulated in the cluster Up-II were
analyzed by Ingenuity® Pathway analysis software. For an explanation of the symbols and
letters, see Figure 6.
2.5. Verification of Differentially Expressed Genes
A real-time quantitative polymerase chain reaction (qPCR) assay was conducted to verify the
microarray results. Five genes, Atf3, Atf4, Ddit3, Fos and Hspa5, were selected from the up-regulated
genes that belonged to the gene networks Up-I and Up-II and were associated with cell death and/or
ER stress. As demonstrated in Figure 8, the expression levels of 3 genes, Atf3, Ddit3 and Fos,
belonging to gene network Up-I were immediately and significantly up-regulated from 3 h after NaF
(2 mM) exposure. Gradual and significant increases in the expressions of Atf4 and Hspa5 in gene network
Up-II were detected. These data were almost comparable to the results of microarray analysis (Figure 8).
Next, the expression levels of Hspa5 and Ddit3 proteins were monitored using Western blot analysis. The
protein expression level of Hspa5 was constant in non-treated and vehicle-treated cells, but significantly
elevated in the cells at 12 and 24 h after NaF (2 mM) treatment (Figure 9A). As shown in Figure 9B,
although no expression of Ddit3 protein was detected in the control cells, the expression was
significantly increased in the compound-treated cells in a time-dependent manner.
2.6. Effects of Knockdown of Hspa5 and Ddit3 on Cell Viability
To knockdown genes such as Hspa5 and Ddit3, RNA interference technology was used. As shown
in Figure 10A, NaF (2 mM) induced significant increases in the protein expression levels of both
Hspa5 and Ddit3 in rat oral epithelial ROE2 cells. On the other hand, treatment of the cells with the
siRNAs for Hspa5 and Ddit3 effectively decreased the NaF-induced increases in the Hspa5 and Ddit3
protein expressions, respectively. In addition, silencing of either Hspa5 or Ddit3 significantly reduced
or elevated the cell viability, respectively, to 46.0% (vs. 55.0% in the control) or 60.4% (vs. 51.9% in
the control) (Figure 10B). Next, the roles of these proteins in the human malignant oral epithelial cell
line HSC-3 were evaluated. NaF at a concentration of 2 mM elicited a marked elevation in the protein
expression levels of Hspa5 and Ddit3 compared with control cells. When the siRNAs for Hspa5 and
Ddit3 were transfected into HSC-3 cells, effective silencing of these gene products was observed
(Figure 10C). In HSC-3 cells, knockdown of Hspa5 significantly reduced the cell viability to 46.6% vs.
59.0% in control cells. In contrast, Ddit3-knockdown significantly increased the cell viability to 68.3%
vs. 47.9% in the control group (Figure 10D). These data demonstrated that Hspa5 and Ddit3 exerted
cytoprotective and cytodamaging effects, respectively, in both cell lines exposed to NaF.

Int. J. Mol. Sci. 2014, 15 8968
Figure 8. Verification of microarray results with real-time quantitative polymerase chain
reaction (qPCR). Cells were incubated with or without NaF (2 mM) for 0 to 12 h.
Real-time qPCR was performed. (A) Atf3; (B) Atf4; (C) Ddit3; (D) Fos; and (E) Hspa5.
The data represent means ± standard deviations from 4 different experiments. Each
expression level was normalized by Gapdh. Open circles, 0 mM NaF; closed circles, 2 mM
NaF. * p < 0.05 vs. each NaF (0 mM) (Student’s t-test).

Int. J. Mol. Sci. 2014, 15 8969
Figure 9. Effects of NaF on protein expressions for Hspa5 and Ddit3 in ROE2 cells.
Cells were cultured with or without 2 mM of NaF for 3 to 24 h. Western blot analysis was
performed with the specific primary antibodies for Hspa5 (A) and Ddit3 (B). Gapdh served
as a loading control. Ctr., control (non-treated cells).
Figure 10. Effects of knockdown of Hspa5 and Ddit3 on the NaF-induced decrease in cell
viability in rat oral epithelial ROE2 cells (A,B) and human malignant oral epithelial HSC-3
cells (C,D). Cells transfected with siRNA for Hspa5, Ddit3 or luciferase were cultured
with or without 2 mM of NaF for 24 h. Luciferase siRNA-treated cells served as a control.
(A,C) Western blot analysis was performed with the specific primary antibodies for Hspa5
and Ddit3. Gapdh was used as a loading control; and (B,D) Cell viability was monitored
using a WST-8 assay. Cell viability in the cells treated with 0 mM NaF was taken as 100%.
The data represent the means ± standard deviations (N = 4–6). * p < 0.05 (Student’s t-test).

Int. J. Mol. Sci. 2014, 15 8970
3. Discussion
The oral application of toothpastes and mouth rinses results in relatively high fluoride levels in the
oral cavity. In fact, fluoride toxicity has been reported in both in vivo [6,7] and in vitro oral mucosal
models [8–10]. It is also well known that fluoride at a millimolar range elicits complex cellular
responses such as enzyme activity, signal transduction, ER stress and cell death in a wide variety of
cell types [1]. Because of the complex cellular responses induced by fluoride, we thought that a
combination of array-based transcript profiling with bioinformatics analysis technologies was the most
useful approach for elucidating the molecular mechanisms of fluoride. This approach, as used in the
present study, was the first to demonstrate the genes and gene networks involved in the cell death
accompanying ER stress induced by NaF in oral epithelial cells.
In the present study, cell death measured as chromatin condensation was induced by relatively high
concentrations of NaF (2 and 4 mM) in rat oral epithelial ROE2 cells. The induction of apoptosis by
this compound was confirmed by the activation of caspase-3. In addition, NaF inhibited the protein
synthesis and decreased MMP in ROE2 cells as previously reported in oral mucosal fibroblasts [8].
These results were comparable to those in previous studies [1,6,8,11–13]. Global-scale microarray
and computational gene expression analyses clearly demonstrated that many probe sets that were
differentially expressed by a factor of 2.5-fold or greater could be categorized into 4 gene clusters with
distinct expression patterns. Interestingly, we further identified a number of genes and several gene
networks associated with cell death from each gene cluster by using the Ingenuity® Pathways Knowledge
Base. Moreover, these gene clusters included many ER stress-related genes such as Ddit3 [17] and
Hspa5 [16]. In our cell system exposed to NaF, the remarkable elevations of the expressions of Ddit3
and Hspa5 were verified by real-time qPCR and Western blotting, suggesting that NaF induces ER
stress as described in previous manuscripts [9,10,18,19]. In this study, ER stress-related genes
were observed in up-regulated gene clusters rather than down-regulated gene clusters. Therefore, we
focused on either the up-regulated genes or gene clusters Up-I and Up-II. It was of particular interest
that, among the 133 rapidly increased probe sets (gene cluster Up-I), the gene network Up-I consisting
of 13 genes was principally associated with the biological function of increased cell death (Figure 6).
This gene network included several bZIP transcription factors, such as Atf3 [35], Ddit3 [17], Fos [36],
FBJ osteosarcoma oncogene B (Fosb) [40], and fos-like antigen 1 (Fosl1) [41]. Of these, Ddit3 has
been reported to be a key molecule in the induction of apoptosis during ER stress [17]. As expected,
gene silencing experiments using siRNA for Ddit3 demonstrated that Ddit3 had a role in the induction
of cell death induced by NaF in the oral epithelial cell lines ROE2 and HSC-3. It has been suggested
that homo- and hetero-dimeric protein complexes of the bZIP protein act as activators and repressors
of transcription [42]. In the gene network Up-I, relationships have been identified between Ddit3 and
each of Atf3, Fos, Fosb and Fosl1 [42,43]. In addition, previous studies demonstrated that Ppp1r15a
and tribbles pseudokinase 3 (Trib3) are targets of Ddit3 and are involved in Ddit3-dependent apoptosis
accompanying ER stress [29,44,45]. In addition, increased apoptotic effects of intercellular adhesion
molecule 1 (Icam1) [46], matrix metallopeptidase 10 (Mmp10) [47], nuclear receptor subfamily 4,
group A, member 1 (Nr4a1) [48], Tnf [49], and zinc finger protein 36 (Zfp36) [50] have been
documented. In the present work, we further uncovered the gene network Up-II (8 genes), which was
associated with the cell death-preventing function, from the gene cluster Up-II that contained 299

Int. J. Mol. Sci. 2014, 15 8971
gradually increased probe sets (Figure 7). In NaF-treated ROE2 cells, increases in the expression levels
of Atf4 and Hspa5 were confirmed by real-time qPCR. Under ER stress conditions, ATF4 activates the
transcription of Hspa5 [14,15] and this gene product is reported to inhibit apoptosis [37,38]. In the
present study, cytoprotective effects of Hspa5 were observed in our cell systems treated with NaF.
Under both gene clusters Up-I (13 genes) and Up-II (8 genes), 6 genes, Atf4 [51], Ddit3 [9], Fos [52],
Hspa5 [9], Icam1 [46] and Tnf [53], out of 21 genes were shown to be increased under apoptotic
conditions induced by NaF. However, a large portion of the differentially regulated genes represented
newly identified genes whose relationships to the effects of NaF have not yet been reported.
The differentially expressed genes identified here, and/or the gene networks they act within, are likely
to be involved in cell death accompanying ER stress induced by NaF in oral epithelial cells. However,
the relationship between gene expression and cell death and/or ER stress is unknown. Further
investigations will be required to clarify this issue.
Several studies have investigated the effects of fluoride on gene expression using microarray
technologies. Although Wurtz et al. [20] demonstrated 8 differentially expressed genes in odontoblast
culture cells induced by a fluoride at a non-toxic dose (1 mM), these were not detected in genes that
were identified in our cell system. Wu et al. [21] also reported that 247 genes were 1.5-fold or more
differentially expressed after fluoride treatment in rat incisor pulp tissue. Up-regulation of period
circadian clock 1 (Per1) and down-regulations of calpastatin (Cast) and programmed cell death 4
(Pdcd4) could be detected in ROE2 cells treated with NaF. Moreover, Sun et al. [22] identified
97 genes whose expressions were changed >2.0-fold in the sperm of mice treated with fluoride. Only
2 genes, A kinase (PRKA) anchor protein 12 (Akap12) and calcium/calmodulin-dependent protein
kinase 1, alpha (Camkk1), were found to be down-regulated in our NaF-treated cells. Therefore,
almost all of the genes that were differentially regulated and identified here were not observed in these
three microarray examinations [20–22].
4. Experimental Section
4.1. Cell Culture
Recently, we succeeded in establishing the immortalized oral epithelial cell line ROE2 from fetal
transgenic rats harboring the temperature-sensitive simian virus 40 large T-antigen [25]. The cells with
stratified epithelial-like morphology proliferated continuously at a permissive temperature of 33 °C
and at an intermediate temperature of 37 °C. ROE2 cells were maintained in Dulbecco’s modified
Eagle medium/Ham F-12 (1:1) (DMEM/F12) medium (Life Technologies Co., Grand Island, NY,
USA) supplemented with 2% fetal bovine serum (FBS; Equitech-Bio Inc., Kerrville, TX, USA),
20 μg/L insulin, 20 μg/L transferrin, 1.22 μg/L ethanolamine, 91.4 ng/L sodium selenite and 10 μg/L
epidermal growth factor (Sigma-Aldrich Co., St. Louis, MO, USA) in a collagen type I-precoated
culture vessel (Asahi Glass Co., Ltd., Tokyo, Japan) at 33 °C [25]. The human malignant oral
epithelial cell line HSC-3 was obtained from the Human Science Research Resources Bank of the
Japan Health Sciences Foundation (Tokyo, Japan). HSC-3 cells were cultured in Eagle’s minimal
essential medium (E-MEM; Wako Pure Chemical Industries Ltd., Osaka, Japan) supplemented with
10% FBS at 37 °C.

Int. J. Mol. Sci. 2014, 15 8972
4.2. Incubation of Cells with the Compound
NaF (purity: 99.0%, Wako Pure Chemical Industries Ltd., Osaka, Japan) was dissolved in sterilized
water. ROE2 cells were cultivated in DMEM/F12 medium supplemented with 2% FBS for 24 h at
37 °C, followed by incubation in DMEM/F12 medium supplemented with 2% FBS and the compound
at final concentrations of 0 to 4 mM for 0–24 h at 37 °C. HSC-3 cells were cultured in E-MEM
supplemented with 10% FBS and 2 mM NaF for 24 h at 37 °C. Cells treated with vehicle (sterilized
water; 1% v/v) alone were used as a control.
4.3. Measurements of Cell Number, Cell Viability and Cell Death
For the trypan blue dye exclusion test, the number of cells excluding the dye was counted by
using a hematocytometer. We also used Cell Count Reagent SF (Nacalai Tesque Inc., Kyoto, Japan),
a water-soluble tetrazolium salt WST-8 [2-(2-methoxy-4-nitrophenyl)-3-(4-nitrophenyl)-5-(2,4-
disulfophenyl)-2H-tetrazolium, monosodium salt] based assay, for this purpose. In short, cells were
incubated in 110 μL of Daigo’s T medium (phenol red free, Wako Pure Chemical Industries Ltd.)
containing 9.1% (v/v) of Cell Count Reagent SF in a 96-well cell culture plate at 37 °C. Two hours
later, the produced formazan dye concentration was determined from the absorbance at 450 nm [54].
For measuring chromatin condensation, a Nuclear-ID™ Green Chromatin Condensation Kit (Enzo Life
Sciences Inc., Farmingdale, NY, USA) was used. Finally, the stained samples were run on an Epics
XL flow cytometer (Beckman Coulter Inc., Brea, CA, USA) [55].
4.4. Measurements of Protein Content and MMP
Protein content in cells was estimated by using a Pierce® bicinchoninic acid (BCA) Protein Assay
Kit (Pierce Biotechnology, Rockford, IL, USA). Bovine serum albumin was used as a standard.
The optical density of the developed blue color was read at 570 nm. MMP was evaluated by
JC-1 (5,5',6,6'-tetrachloro-1,1',3,3'-tetraethylbenzimidazolylcarbocyanine iodide) (JC-1 Mitochondrial
Membrane Potential Assay Kit, Cayman Chemical Co., Ann Arbor, MI, USA). The fluorescence of
monomeric (green) or aggregate JC-1 (red) was examined at an emission wavelength of 525 or
597 nm, respectively, under a fluorescence microscope.
4.5. Sodium Dodecyl Sulfate-Polyacrylamide Gel Electrophoresis (SDS-PAGE) and Western Blotting
After washing once with phosphate-buffered saline, the cells were scraped using a rubber
policeman. Cells were dissolved in 50 mM Tris–HCl buffer (pH 7.4) containing 150 mM NaCl, 1%
NP-40 and protease inhibitor cocktail (Nacalai Tesque, Inc.) and homogenized by an ultrasonic
disruptor. Sodium dodecyl sulfate-polyacrylamide gel electrophoresis (SDS-PAGE) and Western
blotting were carried out as described elsewhere [56,57]. The polyvinylidene difluoride membranes
were incubated with the primary antibody at 4 °C overnight, and exposed to the peroxidase-conjugated
secondary antibody at room temperature for 1 h. Immunoreactive proteins were visualized by
a luminescent image analyzer using a chemiluminescence detection system. Primary antibodies used
were as follows: anti-caspase-3 antibody (#9662, Cell Signaling Technology Inc., Beverly, MA, USA),
anti-cleaved caspase-3 antibody (#9664, Cell Signaling Technology Inc.), anti-Hspa5 antibody

Int. J. Mol. Sci. 2014, 15 8973
(#3183, Cell Signaling Technology Inc.); anti-Ddit3 antibody (#2895, Cell Signaling Technology Inc.)
and anti-glyceraldehyde 3-phosphate dehydrogenase (Gapdh) antibody (MAB374, Millipore Co.,
Temecula, CA, USA).
4.6. RNA Isolation
Total RNA was extracted from cells using an RNeasy Total RNA Extraction kit (Qiagen, Valencia,
CA, USA) along with on-column DNase I treatment. RNA quality was analyzed using a Bioanalyzer
2100 (Agilent Technologies Inc., Santa Clara, CA, USA). RNA samples that had RNA integrity
number values above 9.8 were considered acceptable.
4.7. Microarray and Pathway Analyses
A time course microarray analysis was carried out using a GeneChip® system. RNA samples were
obtained at 0, 3, 6 and 12 h post-vehicle treatment (0 mM NaF), and were obtained at 3, 6 and 12 h
post-NaF (2 mM) treatment. For each time point, RNA from 3 independent experiments was pooled to
generate 7 RNA pools. Seven Rat Genome 230 2.0 arrays, which were spotted with 31,099 probe sets
(Affymetrix Inc., Santa Clara, CA, USA), were used. According to the manufacturer’s instructions, 500 ng
of total RNA was used to synthesize cRNA with a GeneChip® 3' IVT Express Kit (Affymetrix, Inc.).
Biotin-labeled cRNA was hybridized to the arrays at 45 °C for 16 h, and the arrays were stained with
streptavidin phycoerythrin and scanned using a probe array scanner. The obtained hybridization
intensity data were analyzed using GeneSpring® GX (Agilent Technologies Inc.) to extract the
significant genes. To examine gene ontology, including biological processes, cellular components,
molecular functions, and gene networks, the obtained data were analyzed using Ingenuity® Pathway
Analysis tools (Ingenuity Systems Inc., Mountain View, CA, USA), a web-delivered application that
enables the identification, visualization, and exploration of molecular interaction networks in gene
expression data [23,24].
4.8. Real-Time Quantitative Polymerase Chain Reaction (qPCR)
Real-time qPCR was carried out on an Mx3000P real-time PCR system (Agilent Technologies Inc.)
using SYBR PreMix ExTaq (Takara Bio Inc., Shiga, Japan) or Premix Ex Taq (for the use of TaqMan
probes; Takara Bio Inc.) according to the manufacturer’s protocols. The reverse transcriptase reaction
was carried out with total RNA by using a random 6 mers and an oligo dT primer. Based on the
database, the specific PCR primers and probes were designed (Table S5). Each mRNA expression
level was normalized with respect to the mRNA expression of Gapdh [23,24].
4.9. siRNA Transfection
ROE2 or HSC-3 cells were incubated in Opti-MEM® I Reduced Serum Medium (Life Technologies
Co.) containing Lipofectamine™ RNAiMAX (Life Technologies Co.) and 40 or 20 nM siRNA for
6 h at 37 °C, respectively, and were cultured in each standard culture medium for 42 h at 37 °C.
The siRNAs were synthesized by Nippon Gene Co., Ltd. (Toyama, Japan) (Table S6). Luciferase
siRNA was used as a negative control siRNA [55].

Int. J. Mol. Sci. 2014, 15 8974
4.10. Statistical Analysis
Data are shown as the means ± standard deviations for at least 3 independent experiments except in
the case of the microarray experiment. Statistical analysis was analyzed using Student’s t-test and
p values less than 0.05 were regarded as statistically significant.
5. Conclusions
In conclusion, knowledge of the changes in gene expression and gene networks will provide further
insight into the molecular mechanisms of NaF-induced cell death accompanying ER stress in oral
epithelial cells.
Acknowledgments
This study was supported in part by a Grant-in-Aid for Scientific Research B (24310046) from
Japan Society for the Promotion of Science.
Author Contributions
Y.T. and N.H. designed the experiments. Y.T. and T.Y. performed the experiments. Y.T. and T.Y.
analyzed the data. N.H., N.S. and T.K. contributed reagents/materials/analysis tools. Y.T. wrote
the paper.
Conflicts of Interest
The authors declare no conflict of interest.
References
1. Barbier, O.; Arreola-Mendoza, L.; del Razo, L.M. Molecular mechanisms of fluoride toxicity.
Chem. Biol. Interact. 2010, 188, 319–333.
2. Choi, A.L.; Sun, G.; Zhang, Y.; Grandjean, P. Developmental fluoride neurotoxicity:
A systematic review and meta-analysis. Environ. Health Perspect. 2012, 120, 1362–1368.
3. Denbesten, P.; Li, W. Chronic fluoride toxicity: Dental fluorosis. Monogr. Oral Sci. 2012, 22,
81–96.
4. Whitford, G.M. The physiological and toxicological characteristics of fluoride. J. Dent. Res. 1990,
69, 539–549.
5. Gabler, W.L. Absorption of fluoride through the oral mucosa of rats. Arch. Oral Biol. 1968, 13,
619–623.
6. He, L.F.; Chen, J.G. DNA damage, apoptosis and cell cycle changes induced by fluoride in rat
oral mucosal cells and hepatocytes. World J. Gastroenterol. 2006, 12, 1144–1148.
7. Tsai, C.L.; Lin, J.W.; Kuo, H.K.; Tai, M.H.; Wu, Y.C.; Shyr, C.R.; Wu, P.C. Induction of
apoptosis in rabbit oral mucosa by 1.23% acidulated phosphate fluoride gel. Arch. Toxicol. 2008,
82, 81–87.

Int. J. Mol. Sci. 2014, 15 8975
8. Jeng, J.H.; Hsieh, C.C.; Lan, W.H.; Chang, M.C.; Lin, S.K.; Hahn, L.J.; Kuo, M.Y. Cytotoxicity
of sodium fluoride on human oral mucosal fibroblasts and its mechanisms. Cell Biol. Toxicol.
1998, 14, 383–389.
9. Kubota, K.; Lee, D.H.; Tsuchiya, M.; Young, C.S.; Everett, E.T.; Martinez-Mier, E.A.;
Snead, M.L.; Nguyen, L.; Urano, F.; Bartlett, J.D. Fluoride induces endoplasmic reticulum stress
in ameloblasts responsible for dental enamel formation. J. Biol. Chem. 2005, 280, 23194–23202.
10. Sharma, R.; Tsuchiya, M.; Bartlett, J.D. Fluoride induces endoplasmic reticulum stress and
inhibits protein synthesis and secretion. Environ. Health Perspect. 2008, 116, 1142–1146.
11. Yang, S.; Wang, Z.; Farquharson, C.; Alkasir, R.; Zahra, M.; Ren, G.; Han, B. Sodium fluoride
induces apoptosis and alters bcl-2 family protein expression in MC3T3-E1 osteoblastic cells.
Biochem. Biophys. Res. Commun. 2011, 410, 910–915.
12. Hirano, S.; Ando, M. Fluoride mediates apoptosis in osteosarcoma UMR 106 and its cytotoxicity
depends on the pH. Arch. Toxicol. 1997, 72, 52–58.
13. Nguyen Ngoc, T.D.; Son, Y.O.; Lim, S.S.; Shi, X.; Kim, J.G.; Heo, J.S.; Choe, Y.; Jeon, Y.M.;
Lee, J.C. Sodium fluoride induces apoptosis in mouse embryonic stem cells through
ROS-dependent and caspase- and JNK-mediated pathways. Toxicol. Appl. Pharmacol. 2012, 259,
329–337.
14. Sano, R.; Reed, J.C. ER stress-induced cell death mechanisms. Biochim. Biophys. Acta 2013,
1833, 3460–3470.
15. Wu, J.; Kaufman, R.J. From acute ER stress to physiological roles of the unfolded protein
response. Cell Death Differ. 2006, 13, 374–384.
16. Gass, J.N.; Gifford, N.M.; Brewer, J.W. Activation of an unfolded protein response during
differentiation of antibody-secreting B cells. J. Biol. Chem. 2002, 277, 49047–49054.
17. Zinszner, H.; Kuroda, M.; Wang, X.; Batchvarova, N.; Lightfoot, R.T.; Remotti, H.; Stevens, J.L.;
Ron, D. CHOP is implicated in programmed cell death in response to impaired function of the
endoplasmic reticulum. Genes Dev. 1998, 12, 982–995.
18. Wei, W.; Gao, Y.; Wang, C.; Zhao, L.; Sun, D. Excessive fluoride induces endoplasmic reticulum
stress and interferes enamel proteinases secretion. Environ. Toxicol. 2013, 28, 332–341.
19. Zhou, Y.L.; Shi, H.Y.; Li, X.N.; Lv, P.; Li, G.S.; Liu, Q.Y.; Xu, H. Role of endoplasmic
reticulum stress in aberrant activation of fluoride-treated osteoblasts. Biol. Trace Elem. Res. 2013,
154, 448–456.
20. Wurtz, T.; Houari, S.; Mauro, N.; MacDougall, M.; Peters, H.; Berdal, A. Fluoride at non-toxic
dose affects odontoblast gene expression in vitro. Toxicology 2008, 249, 26–34.
21. Wu, Y.; Hao, Y.Q.; Li, J.Y.; Zhou, X.D. Gene expression profiles of the incisor pulp tissue during
fluorosis. Int. Endod. J. 2010, 43, 629–636.
22. Sun, Z.; Niu, R.; Wang, B.; Jiao, Z.; Wang, J.; Zhang, J.; Wang, S.; Wang, J. Fluoride-induced
apoptosis and gene expression profiling in mice sperm in vivo. Arch. Toxicol. 2011, 85,
1441–1452.
23. Tabuchi, Y.; Furusawa, Y.; Kariya, A.; Wada, S.; Ohtsuka, K.; Kondo, T. Common gene
expression patterns responsive to mild temperature hyperthermia in normal human fibroblastic
cells. Int. J. Hyperth. 2013, 29, 38–50.

Int. J. Mol. Sci. 2014, 15 8976
24. Tabuchi, Y.; Sugahara, Y.; Ikegame, M.; Suzuki, N.; Kitamura, K.; Kondo, T. Genes responsive
to low-intensity pulsed ultrasound in MC3T3-E1 preosteoblast cells. Int. J. Mol. Sci. 2013, 14,
22721–22740.
25. Tabuchi, Y.; Wada, S.; Ikegame, M.; Kariya, A.; Furusawa, Y.; Hoshi, N.; Yunoki, T.;
Suzuki, N.; Takasaki, I.; Kondo, T.; et al. Development of an oral epithelial cell line ROE2 with
differentiation potential from transgenic rats harboring temperature-sensitive simian virus 40 large
T-antigen. Exp. Anim. 2014, 63, 31–44.
26. Smiley, S.T.; Reers, M.; Mottola-Hartshorn, C.; Lin, M.; Chen, A.; Smith, T.W.; Steele, G.D., Jr.;
Chen, L.B. Intracellular heterogeneity in mitochondrial membrane potentials revealed by a
J-aggregate-forming lipophilic cation JC-1. Proc. Natl. Acad. Sci. USA 1991, 88, 3671–3675.
27. Fernandes-Alnemri, T.; Litwack, G.; Alnemri, E.S. CPP32, a novel human apoptotic protein with
homology to Caenorhabditis elegans cell death protein Ced-3 and mammalian interleukin-1
β-converting enzyme. J. Biol. Chem. 1994, 269, 30761–30764.
28. Chan, S.L.; Fu, W.; Zhang, P.; Cheng, A.; Lee, J.; Kokame, K.; Mattson, M.P. Herp stabilizes
neuronal Ca2+ homeostasis and mitochondrial function during endoplasmic reticulum stress.
J. Biol. Chem. 2004, 279, 28733–28743.
29. Marciniak, S.J.; Yun, C.Y.; Oyadomari, S.; Novoa, I.; Zhang, Y.; Jungreis, R.; Nagata, K.;
Harding, H.P.; Ron, D. CHOP induces death by promoting protein synthesis and oxidation in the
stressed endoplasmic reticulum. Genes Dev. 2004, 18, 3066–3077.
30. Xue, X.; Piao, J.H.; Nakajima, A.; Sakon-Komazawa, S.; Kojima, Y.; Mori, K.; Yagita, H.;
Okumura, K.; Harding, H.; Nakano, H. Tumor necrosis factor alpha (TNFα) induces the unfolded
protein response (UPR) in a reactive oxygen species (ROS)-dependent fashion, and the UPR
counteracts ROS accumulation by TNFα. J. Biol. Chem. 2005, 280, 33917–33925.
31. Outinen, P.A.; Sood, S.K.; Pfeifer, S.I.; Pamidi, S.; Podor, T.J.; Li, J.; Weitz, J.I.; Austin, R.C.
Homocysteine-induced endoplasmic reticulum stress and growth arrest leads to specific changes
in gene expression in human vascular endothelial cells. Blood 1999, 94, 959–967.
32. Nakagawa, T.; Zhu, H.; Morishima, N.; Li, E.; Xu, J.; Yankner, B.A.; Yuan, J. Caspase-12 mediates
endoplasmic-reticulum-specific apoptosis and cytotoxicity by amyloid-β. Nature 2000, 403, 98–103.
33. Sorli, S.C.; Colié, S.; Albinet, V.; Dubrac, A.; Touriol, C.; Guilbaud, N.; Bedia, C.; Fabriàs, G.;
Casas, J.; Ségui, B.; et al. The nonlysosomal β-glucosidase GBA2 promotes endoplasmic reticulum
stress and impairs tumorigenicity of human melanoma cells. FASEB J. 2013, 27, 489–498.
34. Matsumori, M.; Itoh, H.; Toyoshima, I.; Komatsuda, A.; Sawada, K.; Fukuda, J.; Tanaka, T.;
Okubo, A.; Kinouchi, H.; Mizoi, K.; et al. Characterization of the 105-kDa molecular chaperone.
Identification, biochemical properties, and localization. Eur. J. Biochem. 2002, 269, 5632–5641.
35. Lu, D.; Wolfgang, C.D.; Hai, T. Activating transcription factor 3, a stress-inducible gene,
suppresses Ras-stimulated tumorigenesis. J. Biol. Chem. 2006, 281, 10473–10481.
36. Wang, Y.H.; Chiu, W.T.; Wang, Y.K.; Wu, C.C.; Chen, T.L.; Teng, C.F.; Chang, W.T.;
Chang, H.C.; Tang, M.J. Deregulation of AP-1 proteins in collagen gel-induced epithelial cell
apoptosis mediated by low substratum rigidity. J. Biol. Chem. 2007, 282, 752–763.
37. Tanaka, T.; Tsujimura, T.; Takeda, K.; Sugihara, A.; Maekawa, A.; Terada, N.; Yoshida, N.;
Akira, S. Targeted disruption of ATF4 discloses its essential role in the formation of eye lens fibres.
Genes Cells 1998, 3, 801–810.
Int. J. Mol. Sci. 2014, 15 8977
38. Zhou, H.; Zhang, Y.; Fu, Y.; Chan, L.; Lee, A.S. Novel mechanism of anti-apoptotic function of
78-kDa glucose-regulated protein (GRP78): Endocrine resistance factor in breast cancer, through
release of B-cell lymphoma 2 (BCL-2) from BCL-2-interacting killer (BIK). J. Biol. Chem. 2011,
286, 25687–25696.
39. Bjørkøy, G.; Lamark, T.; Brech, A.; Outzen, H.; Perander, M.; Overvatn, A.; Stenmark, H.;
Johansen, T. p62/SQSTM1 forms protein aggregates degraded by autophagy and has a protective
effect on huntingtin-induced cell death. J. Cell Biol. 2005, 171, 603–614.
40. Yamamura, Y.; Hua, X.; Bergelson, S.; Lodish, H.F. Critical role of Smads and AP-1 complex in
transforming growth factor-β-dependent apoptosis. J. Biol. Chem. 2000, 275, 36295–36302.
41. Shirsat, N.V.; Shaikh, S.A. Overexpression of the immediate early gene fra-1 inhibits proliferation,
induces apoptosis, and reduces tumourigenicity of c6 glioma cells. Exp. Cell Res. 2003, 291, 91–100.
42. Newman, J.R.; Keating, A.E. Comprehensive identification of human bZIP interactions with
coiled-coil arrays. Science 2003, 300, 2097–2101.
43. Chen, B.P.; Wolfgang, C.D.; Hai, T. Analysis of ATF3, a transcription factor induced by
physiological stresses and modulated by gadd153/Chop10. Mol. Cell Biol. 1996, 16, 1157–1168.
44. Ohoka, N.; Yoshii, S.; Hattori, T.; Onozaki, K.; Hayashi, H. TRB3, a novel ER stress-inducible
gene, is induced via ATF4–CHOP pathway and is involved in cell death. EMBO J. 2005, 24,
1243–1255.
45. Sarkar, D.; Su, Z.Z.; Lebedeva, I.V.; Sauane, M.; Gopalkrishnan, R.V.; Valerie, K.; Dent, P.;
Fisher, P.B. mda-7 (IL-24) Mediates selective apoptosis in human melanoma cells by inducing the
coordinated overexpression of the GADD family of genes by means of p38 MAPK. Proc. Natl.
Acad. Sci. USA 2002, 99, 10054–10059.
46. Szczepański, M.; Kamianowska, M.; Kamianowski, G. Effects of fluorides on apoptosis and
activation of human umbilical vein endothelial cells. Oral Dis. 2012, 18, 280–284.
47. Meyer, E.; Vollmer, J.Y.; Bovey, R.; Stamenkovic, I. Matrix metalloproteinases 9 and 10 inhibit
protein kinase C-potentiated, p53-mediated apoptosis. Cancer Res. 2005, 65, 4261–4272.
48. Lee, K.W.; Ma, L.; Yan, X.; Liu, B.; Zhang, X.K.; Cohen, P. Rapid apoptosis induction by
IGFBP-3 involves an insulin-like growth factor-independent nucleomitochondrial translocation of
RXRalpha/Nur77. J. Biol. Chem. 2005, 280, 16942–16948.
49. Sidoti-de Fraisse, C.; Rincheval, V.; Risler, Y.; Mignotte, B.; Vayssière, J.L. TNF-α activates at
least two apoptotic signaling cascades. Oncogene 1998, 17, 1639–1651.
50. Johnson, B.A.; Blackwell, T.K. Multiple tristetraprolin sequence domains required to induce
apoptosis and modulate responses to TNFα through distinct pathways. Oncogene 2002, 21,
4237–4246.
51. Xu, H.; Zhou, Y.L.; Zhang, X.Y.; Lu, P.; Li, G.S. Activation of PERK signaling through
fluoride-mediated endoplasmic reticulum stress in OS732 cells. Toxicology 2010, 277, 1–5.
52. Niu, Q.; Liu, H.; Guan, Z.; Zeng, Q.; Guo, S.; He, P.; Guo, L.; Gao, P.; Xu, B.; Xu, Z.; et al.
The effect of c-Fos demethylation on sodium fluoride-induced apoptosis in L-02 cells. Biol. Trace
Elem. Res. 2012, 149, 102–109.
53. Zhang, S.; Jiang, C.; Liu, H.; Guan, Z.; Zeng, Q.; Zhang, C.; Lei, R.; Xia, T.; Gao, H.;
Yang, L.; et al. Fluoride-elicited developmental testicular toxicity in rats: Roles of endoplasmic
reticulum stress and inflammatory response. Toxicol. Appl. Pharmacol. 2013, 271, 206–215.

Int. J. Mol. Sci. 2014, 15 8978
54. Ishiyama, M.; Miyazono, Y.; Sasamoto, K.; Ohkura, Y.; Ueno, K. A highly water-soluble
disulfonated tetrazolium salt as a chromogenic indicator for NADH as well as cell viability.
Talanta 1997, 44, 1299–1305.
55. Yunoki, T.; Kariya, A.; Kondo, T.; Hayashi, A.; Tabuchi, Y. The combination of silencing BAG3
and inhibition of the JNK pathway enhances hyperthermia sensitivity in human oral squamous
cell carcinoma cells. Cancer Lett. 2013, 335, 52–57.
56. Laemmli, U.K. Cleavage of structural proteins during the assembly of the head of bacteriophage T4.
Nature 1970, 227, 680–685.
57. Towbin, H.; Staehelin, T.; Gordon, J. Electrophoretic transfer of proteins from polyacrylamide
gels to nitrocellulose sheets: Procedure and some applications. Proc. Natl. Acad. Sci. USA 1979,
76, 4350–4354.
© 2014 by the authors; licensee MDPI, Basel, Switzerland. This article is an open access article
distributed under the terms and conditions of the Creative Commons Attribution license
(http://creativecommons.org/licenses/by/3.0/).