generic r&d logic models suggest key performance...
TRANSCRIPT

Generic R&D Logic Models Suggest Key Performance Indicators
Workshop on National Models for Public R&D EvaluationHosted by the
Korea Institute of S&T Evaluation and Planning (KISTEP)In Cooperation with the
Washington Research Evaluation Network (WREN)May 31, 2005Seoul, Korea
Dr. Gretchen JordanSandia National Laboratories, USA
[email protected] work presented here was completed for the U.S. Department of Energy (DOE) Offices of Science and Energy Efficiency
and Renewable Energy by Sandia National Laboratories, Albuquerque, New Mexico, USA under Contract DE-AC04-94AL8500.
Sandia is operated by Sandia Corporation, a subsidiary of Lockheed Martin Corporation. Opinions expressed are solely those of
the authors.

Presentation Outline
• Brief introduction to logic models (program theory)
• Challenges of comparative indicators and how logic models can help
• Example generic R&D and Deployment logics and suggested general indicators
• A capacity indicator
• General outcome measures that recognize R&D diversity, with an example of how indicators would differ
• Summary
2G. Jordan May 2005

G. Jordan May 2005 3
LOGIC MODELING –What and Why?
• The logic model concept was introduced in the 1970s or earlier, has evolved to meet new needs, and is a basic tool for program management, evaluation and performance measurement.
• A logic model describes the theory and design of the program, how program activities and outputs influence program participants, customers and / or beneficiaries, leading to the achievement of the intended outcomes (short term, intermediate and long term).
• A logic model describes the key elements of the “Results Chain” or “Pathway to Success”, linking program to long term objectives (i.e. government policy objectives).
• A logic model provides the basis for accountability, by identifying key relationships and performance indicators linked to success along the results chain.
• A logic model (diagram or table, with text) can describe a project, program, or portfolio of programs.

G. Jordan May 2005 4
Logic Models Communicate Program Theoryand Outcomes Within the Larger System
R&D
Policies,
Programs
Goals
WHY will these activities help us achieve our goals?
HOW do investments in R&D help us
achieve goals?
Context: Social, technical, economic, political

G. Jordan May 2005 5
Logic Models Communicate How, Who For and With, What and Why the Program Exists
indirect influenceExternal Influences, context
Customers/Partners
Activities Outputs Short-Term
Outcomes
Intermediate
Outcomes
Long-Term
Outcomes
Resources
Strategic Goals
Strategic Objectives
Research Program Results ChainFor/ With
Customer Decisions & Actions
(IncludesTransfer,
Use)
direct influenceProgram control

G. Jordan May 2005 6
Multi-Year Planning During Logic Modeling Is Then Tested and Measured During Implementation
Short-Term
OutcomesIntermediate
OutcomesLong-
Term
Outcomes
Strategic Goals
Strategic Objectives
Changes in Customer
Knowledge, Decisions,
Actions
Accountability
Indicators
PG 2PG 1
APM 2
APM 1
FY 03
FY 04
FY 05
PG 3
Effective Transfer
to Customers
Domain of Multi-Year Research Plans
Research Activity 1
Research Activity 2
Research Activity n
Research Output 1
Research Output 2
Research Output n
Programs are designed from RIGHT to LEFTPG = performance goal
APM = annual performance measure
External Influences, context
Adapted from Pahl & Norland, March 2002
Programs are implemented & managed from LEFT to RIGHT

G. Jordan May 2005 7
build franchise through innovations achieve operational excellence through operations and logistics processesIncrease customer value through customer management processes become a good corporate citizen through regulatory and environmental processes
Product Leadership√ √
employee competencies technology corporate cultureLearning and Growth Perspective
Internal Process Perspective
Customer Perspective
Financial Perspective
Customer IntimacyOperational Excellence√ √ •Customer acquisition, retention, and satisfaction
Customer Value Proposition
Revenue Growth Strategybuild the franchise increase value to customers improve cost structure improve use of assets•revenue from new sources •customer profitability •operating cost per unit produced •asset utilizationProductivity StrategyImprove Shareholder ValueImprove Shareholder ValueImprove Shareholder ValueImprove Shareholder Value•share price •return on capital employed
The Strategy Map For a Balanced Scorecard Also Can Show Program Theory and Logic
(Kaplan and Norton 2000)
Resources
ActivitiesAnd Outputs
Short term Outcomes
For/ With
Intermediate and Longer-termOutcomes
Logic Model

G. Jordan May 2005 8
Challenges of Defining Comparative Performance Indicators
All the challenges of R&D performance indicators, plus
• Comparing apples to apples requires
– Matching project/program/organizational domains and settings, and comparisons that recognize differences
– Defining indicators that can be generalized across domains/settings and time
– Similar data definition and collection methods

G. Jordan May 2005 9
Program theory and logic can help ---
• Generic logic models can capture theories of innovation, diversity of R&D organizations, and diffusion of innovation,
• Which then suggest general indicators of performance for different phases of innovation, different contexts.
• Comparable indicators could then be further defined, keeping with each the contextual factors that influence that performance.
• Use of measures must recognize the inter-relatedness of the stages.
• Logic modeling reveals the “magic in the middle”, the measures of short and intermediate outcomes, filling the gap between current measures of outputs and ultimate outcomes.
• Proposed measures/indicators are a sequence of key points along the way to achieving goals, so all programs can measure one or more.

G. Jordan May 2005 10
EERE has 7 different strategies and multiple policy instruments
U.S. Department of Energy, Office of Energy Efficiency and Renewable Energy (EERE) includes programs from research to utilization.
Strategies are to• Plan and assess programs, technologies, markets• Develop and maintain program infrastructure• Conduct research• Develop technology • Demonstrate technology • Develop government and market infrastructure• Deploy technology
An Example of a Generic R&D Logic Model and Comparative Indicators The Model Suggests
G. Jordan May 2005 11
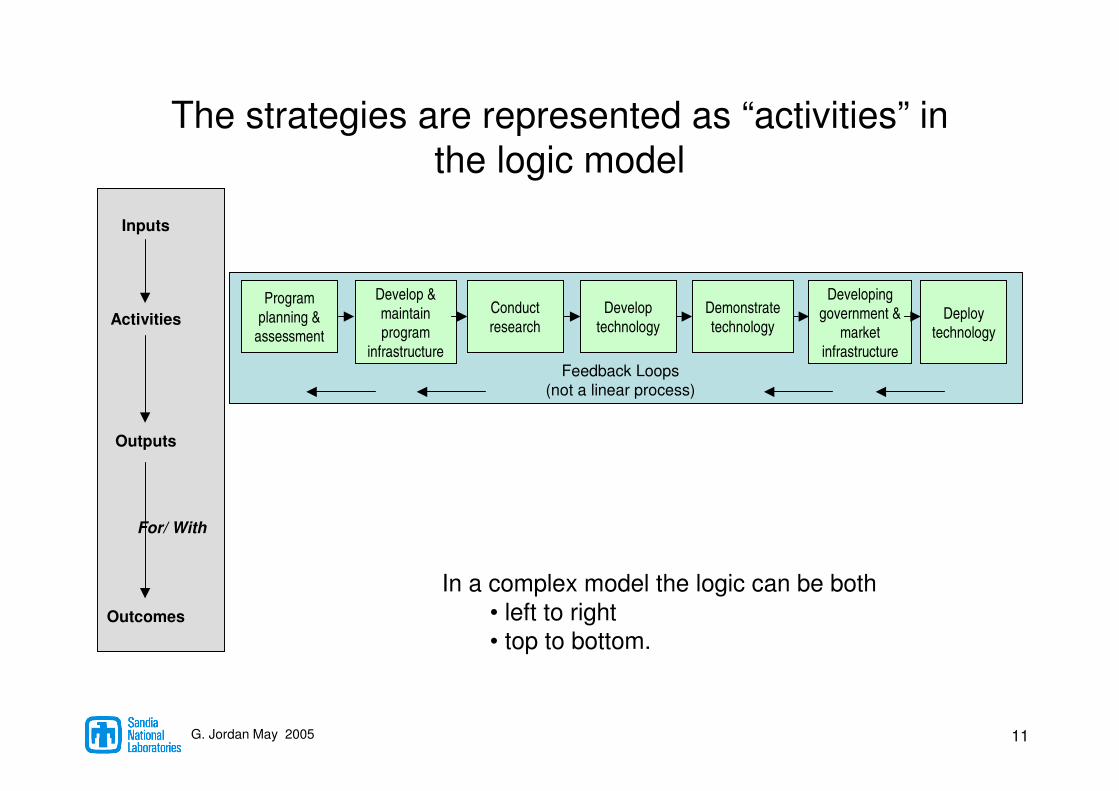
The strategies are represented as “activities” in the logic model
Program
planning & assessment
Conduct
research
Develop
technology
Demonstrate
technologyDeploy
technology
Develop &
maintain program
infrastructure
Developing
government & market
infrastructure
Feedback Loops(not a linear process)
Inputs
Activities
Outputs
Outcomes
For/ With
In a complex model the logic can be both • left to right• top to bottom.

G. Jordan May 2005 12
Outputs and a sequence of outcomes for each activity are in the columns
Outputs &Outcomes directly
influenced
Demonstrate technology
Test, improve, & validate commercial-
scale technology,Give industry hands-on
experience
Investment by industry in innovative or
advanced commercial products
Relevant
industries
Inputs
Activities
Outcomes
For/ With

G. Jordan May 2005 13
EERE’s draft logic model shows how its strategies/activities are linked to its goals
Inputs
Activities
Outputs
Outcomes
Program planning &
assessment
Conduct research
Developtechnology
Demonstrate technology
Deploy technology
Federal, state & local government fundingPrivate funding, Personnel, Facilities, Past R&D results
Develop & maintain program
infrastructure
Developing government &
market infrastructure
Benefit estimates,Priorities identified,Budget
requests,Program plans
New knowledge,
proof of concepts as
represented by data,
publications
Technologyprototypes
-initial-intermediate-commercial
Performance analysis
Test, improve, & validate
commercial-scale
technology,Give industry
hands-on experience
Government purchases,Information
disseminated,Early seeding
of technologies
Public & private labs
and test beds,Knowledge
bases,Trained S&T personnel,
Partnerships
Codes and standards,
Trained personnel,
Audits tools,State
programs
Concepts & designs with
possible applications,Knowledge spill-over
Investment by industry in
innovative or advanced
commercial products
Favorable policies, capable delivery
channels for EERE
products
Widespread adoption of
EERE products; More productive use
of energy
For
Economic, security, and
environmental benefits
Technology leadership
Programs,
CFO, OMB,Congress
Programs,partners
R&Dcommunity
R&D Community,Industry
Relevantindustries
Relevantmarkets
Potentialpurchasers
Potentially commercializ-
able technologies
to replace existing or fill a system need
Political environment
Quality of R&D proposals
Unpredictable nature of R&D
Cost and performance of competing technologies
Industry willingness to
take risk
Energy prices
State of the economy
Government policies and regulations
External
Influences
Spin-off products and their associated benefits
New products & businesses
Program funding in
appropriate areas;
Efficiency, Fiscal
responsibility
Relevant S&T expertise,
capabilities and facilities to
deliver programs
Feedback Loops
National R&D capabilities, including options if circumstances change
Logic developed by G. Jordan, J.R. Reed, J. Mortensen, G. Teather

G. Jordan May 2005 14
Each box in the logic model is a potential key measurement area or indicator
Inputs
Activities
Outputs
Outcomes
Program planning &
assessment
Conduct research
Developtechnology
Demonstrate technology
Deploy technology
Federal funding (millions of nominal $) Federal personnel (FTEs)Private funding (millions of nominal $) # of RD&D facilities
Develop & maintain program
infrastructure
Developing government &
market infrastructure
% programs w/benefit estimates
% program w/program
plans
# of journal articles
# of presentations
# prototypes-initial-intermediate-commercial
Prototype cost & performance
# and % of commercial-
scale technologies
validated
# of tech’s purchased by
gov’t,# of materials disseminated,# of website
hits
# of partnerships
# codes and standards,
# personnel trained,# audits,# state
programs
# journal article citations
# of innovative or advanced commercial
products with improved cost & performance
# of recommenda-tions for using
advanced commercial
products and practices
# and % of advanced
commercial products by
adoption stage
For
Energy saved (quad. Btu), GW of add’lRE capacity,Expenditure savings ($)
Carbon saved (mmtce)
Programs,CFO, OMB,Congress
Programs,partners
R&Dcommunity
R&D Community,Industry
Relevantindustries
Relevantmarkets
Potentialpurchasers
# of potentially commercializ-
able technologies
Cost and performance of competing technologies
(varies by technology)
Oil prices ($/barrel)
NG prices ($/tcf)
Electricity prices (c/kWh)
Coal prices ($/ton)
GDP (billion 1996 $)
RE production tax credit (c/kWh)
EE/RE tax credits ($)
CAFÉ standards
(mpg)
Vehicle & power plant
emission standards(varies by pollutant)
External
Influences
# of technology spinoffs
Feedback Loops

G. Jordan May 2005 15
Important Measures for All R&D Programs MEASURESTAGE
Market Development. Likelihood of absorption into market (measured by on the ground changes, e.g., extent to which supply chain is present, incentives/ standards in place, barriers such as grid connection lowered)
Develop Market Infrastructure
Commercialization. Number and Impact of Potential and Actual Commercialized Technologies (number, sales and per unit benefits); extent to which program accelerated or expanded this)
Commercialized
Market Validation Success. Extent to which commercial scale technologies have been validated in a market setting (perhaps measured by reduced uncertainty of market success)
Demonstrate Technology
Technology Uncertainty. At a sub program level, the extent to which technology performance expectations have been met and technical uncertainty reduced (# and %, by category of lab and market scale prototypes; technical risk)
Develop Technology
Knowledge Created. Key knowledge goals met; advances and indications this has been transferred and is useful to others (as measured by a new material available, papers, citations, patents, and patent citations)
Conduct Research
Delivery Infrastructure. Growth in capabilities (human capital, networks)and private R&D investment in the research area (e.g. test beds built; DOE systems analysis used)
Build Program & R&D Infrastructure
Planning Effectiveness. Amount and use of peer review and market assessments (% pre-competitive review, in progress reviewed; research efficiency; market risk)
Program Planning & Assessment
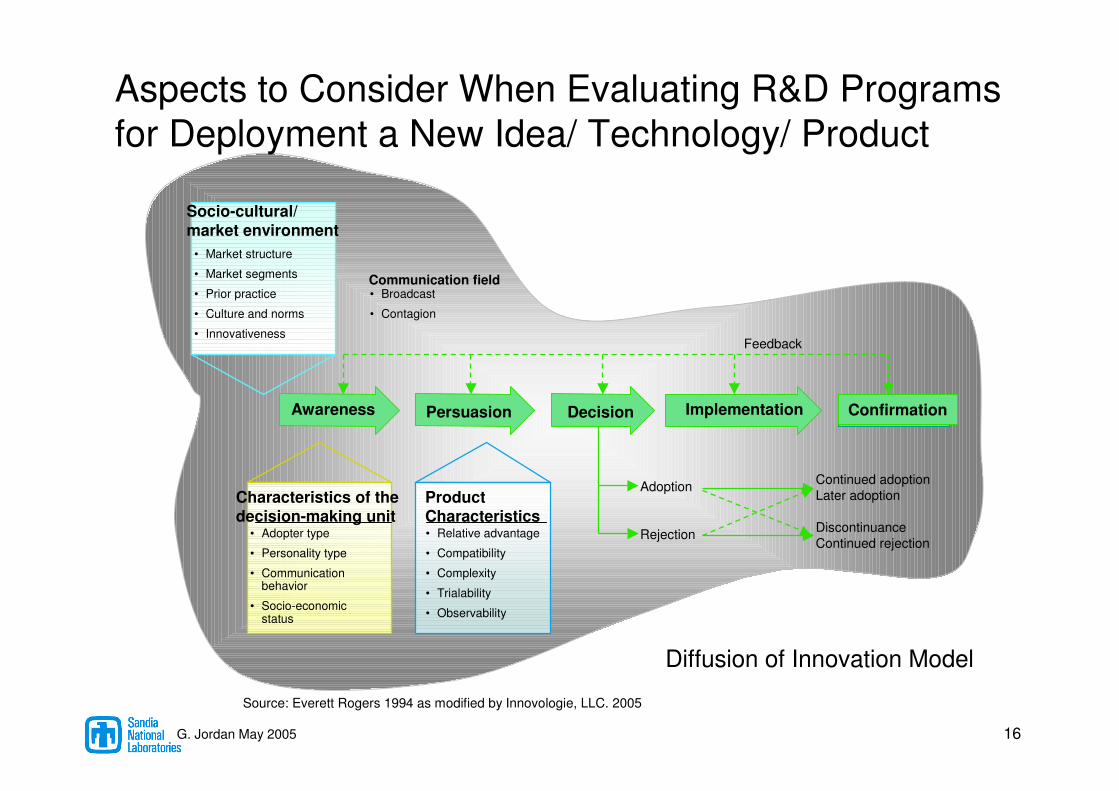
ConfirmationAwareness Persuasion Decision Implementation
Feedback
Continued adoptionLater adoption
DiscontinuanceContinued rejection
Adoption
Rejection
Product Characteristics• Relative advantage
• Compatibility
• Complexity
• Trialability
• Observability
Characteristics of the decision-making unit
• Adopter type
• Personality type
• Communication behavior
• Socio-economic status
Socio-cultural/market environment
• Market structure
• Market segments
• Prior practice
• Culture and norms
• Innovativeness
Communication field• Broadcast
• Contagion
Source: Everett Rogers 1994 as modified by Innovologie, LLC. 2005
Aspects to Consider When Evaluating R&D Programs for Deployment a New Idea/ Technology/ Product
G. Jordan May 2005 16
Diffusion of Innovation Model

G. Jordan May 2005 17
Important Measures for All Deployment ProgramsMEASURESTAGE
Early Adoption. Energy savings achieved by (1) innovators and early adopters and (2) early and late majorities (attribution for accelerated/expanded technology or practice adoption; sales and per unit benefits)
Support Adoption Implementation
Widespread Adoption. Extent to which purchase/use has become routine, thus market penetration is widespread and sustainable (e.g., replication at other sites, incorporation into standard operating procedures)
Replication and Confirmation
Behavior Change. Changes in behavior influenced by the program, e.g. changes in stocking patterns, policy/procedures, use of assessments, decision to manufacture
Support Adoption Decisions
Knowledge and Skills. Extent to which public/market segment has increased knowledge, skills, and capabilities in the targeted area
Provide Information and Capabilities
Awareness and Acceptance. Change in the extent to which public/market segment is aware of the technology or practice and accept it
Stimulate Awareness
Delivery Infrastructure. Growth in capabilities and external coalitions and partners and extent to which they take responsibility for continued delivery without DOE assistance (e.g., Clean cities, networks)
Build Program & Partner Infrastructure
Planning Effectiveness. Amount and use of market assessments and expert review to target and track markets & needs and revise programs to meet these
Program Planning & Assessment
G. Jordan May 2005 18
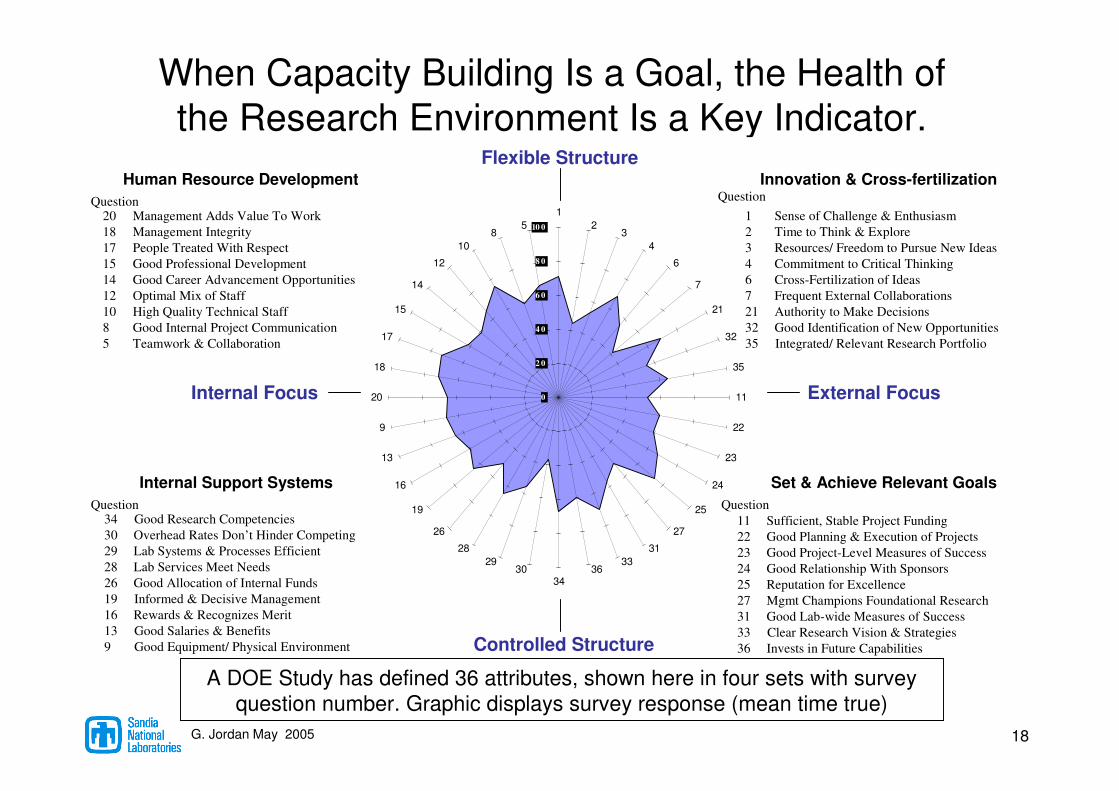
When Capacity Building Is a Goal, the Health of the Research Environment Is a Key Indicator.
0
2 0
4 0
6 0
8 0
10 0
12
34
6
7
21
32
35
11
22
23
24
25
27
3133
3634
3029
28
26
19
16
13
9
20
18
17
15
14
12
108
51 Sense of Challenge & Enthusiasm
2 Time to Think & Explore
3 Resources/ Freedom to Pursue New Ideas
4 Commitment to Critical Thinking
6 Cross-Fertilization of Ideas
7 Frequent External Collaborations
21 Authority to Make Decisions
32 Good Identification of New Opportunities
35 Integrated/ Relevant Research Portfolio
Innovation & Cross-fertilizationQuestion
External FocusInternal Focus
Controlled Structure
Flexible Structure
20 Management Adds Value To Work
18 Management Integrity
17 People Treated With Respect
15 Good Professional Development
14 Good Career Advancement Opportunities
12 Optimal Mix of Staff
10 High Quality Technical Staff
8 Good Internal Project Communication
5 Teamwork & Collaboration
Human Resource Development
Question
11 Sufficient, Stable Project Funding
22 Good Planning & Execution of Projects
23 Good Project-Level Measures of Success
24 Good Relationship With Sponsors
25 Reputation for Excellence
27 Mgmt Champions Foundational Research
31 Good Lab-wide Measures of Success
33 Clear Research Vision & Strategies
36 Invests in Future Capabilities
Set & Achieve Relevant Goals
Question34 Good Research Competencies
30 Overhead Rates Don’t Hinder Competing
29 Lab Systems & Processes Efficient
28 Lab Services Meet Needs
26 Good Allocation of Internal Funds
19 Informed & Decisive Management
16 Rewards & Recognizes Merit
13 Good Salaries & Benefits
9 Good Equipment/ Physical Environment
Internal Support Systems
Question
A DOE Study has defined 36 attributes, shown here in four sets with survey question number. Graphic displays survey response (mean time true)

G. Jordan May 2005 19
Two General Indicators For Science Advance and New Product Development Relate to Management:
Radicalness and Scope of Desired/Actual Outcomes
Quality
Outcome
Research Profiles is a U.S. DOE/Sandia project (G. Jordan PI) with the University of Maryland Center for Innovation. It builds on the Competing Values Framework of the University of Michigan.
Incremental AdvanceSpecialized Task
Intra-Organizational
Broad Scope of FocusLarge, Coordinated Programs
Narrow Scope AdvanceSmall, Autonomous Projects
Be Sustainable Be New
Be FirstBe Better
Four “Research Profiles” along the
two dimensions suggest
1. The more radical the advance, the more complex the task and need for inter-organizational ties, and more risk, longer time frames.
2. The more broad the scope of focus, the larger the project size and more coordination required, and more uncertainty, more resources.
Radical AdvanceComplex Task
Inter-Organizational

G. Jordan May 2005 20
Focus on Evolutionary
Science
Be New
Be Better Be First
Be Sustainable
1- Radically new idea or prototype
1- Radically new product or process1- Incrementally improved product/process
1- Incrementally new idea or prototype
Large Broad Focused Science
Small Narrow Focus Science
Focus on Revolutionary
Science
K E Y
Outcome Areas
(Feller & Gamota)
Draft 20021 – Scientific Impact
2 – Research Agility3 – Structure of Knowledge
4 – Science Infrastructure
5 – Societal Impacts
6 – Research Performance
K E Y
Outcome Areas
(Feller & Gamota)
Draft 20021 – Scientific Impact
2 – Research Agility3 – Structure of Knowledge
4 – Science Infrastructure
5 – Societal Impacts
6 – Research Performance
Differentiate Existing Measures by ProfileAs Well As Defining More Appropriate Measures
2- Develop common language/ teachable points 2- Change the way people think and ask
2- Standardized knowledge or language 2- Identified applications for knowledge
3- Coordinated activities/Revised textbooks 3- Uncoordinated activities/Emerging fields
3- Correct diagnosis of the challenge 3- Rapidly deploying activities; strategic coalitions
4- Facilitated workshops, colloquia 4- An expanding portfolio, risk
4- Access to, utilization of facilities 4- Converge on theory/project aimed at technical need
5- Ideas seeded, awareness fostered 5- International thought leadership
5- New standards for quality, reduced harm 5- Influenced public/private sector R&D/outputs
6- Great contributors participating 6- Portfolio of highly unusual projects
6- Organized projects making steady progress 6- Projects have high yield, expected high yield

Summary
• Generic logic modeling using program and innovation theories is essential for defining key comparative indicators.
• There are many aspects of the logic of R&D for which we need to model the logic in more detail.
• We have provided – a generic R&D logic, – proposed general (comparative) indicators, and – a caution about recognizing the diversity of R&D
when measuring and making comparisons.
21G. Jordan May 2005

Selected References
22
Jordan, Gretchen, “What is Important to R&D Workers”, Research Technology Management, Vol. 48 No. 3, May-June 2005.
Jordan, Gretchen, Jerald Hage and Jonathon Mote, “Constructing R&D Profiles: Toward A Theory of Diversity of Research Organizations,” presentation at IAMOT 2004 and paper submitted to Academy of Management Review April 2005.
Jordan, Gretchen, John Mortensen, John Reed, George Teather, “R&D Logic Models, Using Logic Models In Managing Performance of Research and Technology Programs: An example for a Federal energy efficiency and renewable energy program,” presented at IAMOT, Washington, D.C., April 2004.
Kaplan, R. S. and D. P. Norton. “Having trouble with your strategy? Then map it.” Harvard Business Review, September-October 2000, pp. 167-176.
McLaughlin, John A., and Jordan, Gretchen B., “Chapter 1: Logic Models,” in Handbook of Practical Program Evaluation, 2nd Edition, Wholey, J., Hatry, H., and Newcomer, K., Eds., Jossey-Bass, 2004.
McLaughlin, John A., and Jordan, Gretchen B., “Logic Models: A Tool for Telling Your Performance Story,” Evaluation and Program Planning, Elsevier Science: New York, Vol. 22, Issue 1, February 1999, Pp. 65-72.
See also www. WREN-network.net
G. Jordan May 2005