generic object classification for … · the system is emulated in the sony aibo robot, showing...
TRANSCRIPT

GENERIC OBJECT CLASSIFICATION FOR AUTONOMOUS ROBOTS
Memòria del Projecte Fi de Carrera d'Enginyeria en Informàtica realitzat per Raúl Pérez Trapilla.......................... i dirigit per Sergio Escalera i Petia Radeva......... Bellaterra,.29..de..gener....de 2007.

Abstract One of the main problems of autonomous robots interaction is the scene knowledge. Recognition is concerned to deal with this problem and to allow robots to interact in uncontrolled environments. In this paper, we present a practical application for object fitting, normalization and classification of triangular and circular signs. The system is introduced in the Aibo robot of Sony to increase the robot interaction behaviour. The presented methodology has been tested in real simulations and categorization problems, as the traffic signs classification, with very promising results. Resumen Uno de los principales problemas de la interacción de los robots autónomos es el conocimiento de la escena. El reconocimiento es fundamental para solventar este problema y permitir a los robots interactuar en un escenario no controlado. En este documento, presentamos una aplicación práctica de captura del objeto, normalización y clasificación de señales triangulares y circulares. El sistema es introducido en el robot Aibo de Sony para mejorar el comportamiento de la interacción del robot. La metodología presentada ha sido testeada en simulaciones y problemas de categorización reales, como es la clasificación de señales de tráfico, con resultados muy prometedores. Resum Un dels principals problemes de la interacció dels robots autònoms és el coneixement de l'escena. El reconeixement és fonamental per a solucionar aquest problema i permetre als robots interactuar en un escenari no controlat. En aquest document presentem una aplicació practica de la captura d’objectes, normalització i classificació de senyals triangulars i circulars. El sistema és introduït en el robot Aibo de Sony per a millorar la interacció del robot. La metodologia presentada ha estat testejada en simulacions i problemes de categorització reals, com és la classificació de senyals de transit, amb resultats molt prometedors.

Generic Object Classification for Autonomous Robots
Abstract .............................................................................................................................1 1. Introduction.................................................................................................................1 2. Aibo robot ...................................................................................................................3 3. Multi-class Classifiers.................................................................................................5 4. System.........................................................................................................................9
4.1 Object detection ..............................................................................................9 4.2 Model Fitting and normalization...................................................................11 4.3 Classification.................................................................................................14
5. Results.......................................................................................................................14 5.1 Work parameters ...........................................................................................15
5.1.1 Model fitting............................................................................................15 5.1.2 Classification...........................................................................................15
5.2 Aibo Experiments .........................................................................................15 5.3 Traffic signs classification ............................................................................16 5.4 Discussion .....................................................................................................18
5.4.1 "Apropat a la ciència"..............................................................................18 5.4.2 "Redes"....................................................................................................19
6. Conclusions...............................................................................................................19 7. Acknowledges...........................................................................................................20 8. References.................................................................................................................20 9. Appendices................................................................................................................22
9.1 The AIBO® Entertainment Robot ERS-7M3 parts ......................................22 9.2 Computer Vision ...........................................................................................27 9.3 Traffic sign recognition mobile mapping acquisition ...................................33 9.4 Artificial Intelligence History .......................................................................36 9.5 Apropa't a la Ciencia .....................................................................................46

Generic Object Classification for Autonomous
Robots
Raul Perez Trapilla
Informatics, ETSE, UAB, Campus UAB, 08193 Bellaterra, Spain
Abstract
One of the main problems of autonomous robots interaction is the scene knowl-edge. Recognition is concerned to deal with this problem and to allow robots tointeract in uncontrolled environments. In this paper, we present a practical appli-cation for object fitting, normalization, and classification of triangular and circularsigns. The system is tested in the Aibo robot of Sony to increase the robot inter-action behavior. The presented methodology has been tested in real simulationsand categorization problems, as the traffic signs classification, with very promisingresults.
Key words: Object Recognition, Autonomous Robots, Model fitting, spatialnormalization, multi-class Classification, Adaboost.
1 Introduction
Autonomous robots[1] are desired to perform tasks in unstructured environ-ments without continuous human guidance. Any meaningful interaction withthe environment will involve multiple related sentences that describe somecomplex ongoing events. To allow the robot to act in an intelligent and flex-ible way, it requires to recognize objects and learn the identity of unknownobjects. In fact, there are an infinite number of scenes that contain the sameobject, which makes direct computation of scene geometry from a single imageimpossible. The use of external knowledge about the world and the current vi-sual task reduces the number of plausible scene interpretations and may makethe problem solvable. This approach is referred to as knowledge-based vision.Work in the area of knowledge-based vision incorporates methods from thefield of AI in order to focus on the influence of context on scene understanding,the role of high level knowledge, and appropriate knowledge representationsfor visual tasks.

Computer vision is the technology concerned with computational understand-ing and use of the information present in visual images. In part, computervision is analogous to the transformation of visual sensation into visual percep-tion in biological vision. For this reasons the motivation, objectives, formula-tion, and methodology of computer vision frequently intersect with knowledgeabout their counterparts in biological vision. However, the goal of computervision is primarily to enable engineering systems to model and manipulatethe environment by using visual sensing. The machine’s ability to monitor itsenvironment, allowing it to adjust its actions based on what it has sensed, is aprerequisite for intelligence, such as Mars micro-rover shown in fig.1. The termintelligent machine is an anthropomorphism in that intelligence is defined bythe criterion that the actions would appear intelligent if a person were to doit. A precise, unambiguous, and commonly held definition of intelligence doesnot exist.
Fig. 1. Mars micro-rover mobile robot.
Since the physical embodiment of the machine or the particular task performedby the machine does not mark it as intelligent, the appearance of intelligencemust come from the nature of the control or decision-making process that themachine performs. Given the centrality of control to any form of intelligentmachine, intelligent control is the essence of an intelligent machine. A centralobjective of image interpretation is to recognize the scene contents. Recogni-tion involves identifying an object based on a variety of criteria. It may involveidentifying a certain object in the image as one seen before once an object isdetect, categorization is required. Schemes for visual classification usually pro-ceed in two stages. First, features are extracted from the image, and the objectto be classified is represented using these features. Second, a classifier is ap-plied to the measured features to reach a decision regarding the representedclass. Powerful methods have been developed for performing visual classifica-tion. Some of the most used are K-Nearest Neighbors [7], Tangent Distance[9], Fisher Linear Discriminant Analysis [6] or Principal Component Analysis
2

[8]. Nowadays, Support Vector Machine [10] and Adaboost [11] are the mostfrequently used.
In this paper, we deal with the multi-class classification task applied to au-tonomous robots. Robotics deals with the practical application of many ar-tificial intelligence techniques to solve real world problems. This combinesproblems of sensing and modeling the world, planning and performing tasks,and interacting with the world. The Aibo robot from Sony is a perfect tool toimplement and test artificial intelligent techniques in robotics. It establishescommunication with people by displaying emotions, and assumes various be-haviors based on information which it gathers from its environment. In thisway, we used this tool to test the present system. In our application, we use theresults of the Adaboost procedure as a detection algorithm. The use of this al-gorithm let us to detect regions of interest with high probability of containingsigns. Once the Adaboost returns a ROI [15], we fit the model using the houghtransform (triangular sign) or fast radial symmetry (circular sign). Once wehave fit the object, we compare a wide set of the state-of-the-art classifica-tion strategies in order to obtain the label of the present object in the scene.The system is emulated in the Sony Aibo robot, showing high performance onclassifying different objects in real-time.We also tested our system in a realcategorization problem: real traffic sign classification. Besides, we presentedthis work in different scientific exhibitions.
This paper is organized as follows: Section 2 explain the Aibo robot tool.Section 3 overview the classification technique applied in this paper. Section 4presents our system. Section 5 shows the experiments and results, and section6 concludes the paper.
2 Aibo Robot
Robots are growing in complexity and their use in industry is becoming morewidespread. The main use of robots has so far been in the automation of massproduction industries, where the same, definable tasks must be performed re-peatedly in exactly the same fashion. Industrial robots can be manufactured ina wide range of sizes and so can handle more tasks requiring heavy lifting thana human could. Car production is the primary example of the employment oflarge and complex robots for producing goods.
Robots are also useful in environments which are unpleasant or dangerous forhumans to work in, for example bomb disposal, work in space (eg. Canadarm2)or underwater, in mining, and for the cleaning of toxic waste. Robots arealso used for patrolling these toxic areas, robots equipped for this job aree.g. the Robowatch OFRO[2], and Robowatch MOSRO.Automated Guided
3

Vehicles (AGVs) are movable robots that are used in large facilities such aswarehouses hospitals and container ports, for the movement of goods, or evenfor safety and security patrols. Such vehicles follow wires, markers or laser-guidance to navigate around the location and can be programmed to movebetween places to deliver goods or patrol a certain area. One robot beingused in the United States is the Tug robot by Aethon Inc[3], an automateddelivery system for hospitals. This robot travels around hospitals to delivermedical supplies, medication, food trays, or just about anything to nursingstations. Once it is finished it goes back to its charging station and waits forits next task. Domestic robots are now available that perform simple taskssuch as vacuum cleaning and grass cutting. Nowadays domestic robots havethe aim of providing companionship (social robots) or play partners (ludobots)to people. In this scope we find the Aibo robot.
AIBO (Artificial Intelligence roBOt[4], also means ”love” or ”attachment” inJapanese) is one of several types of robotic pets designed and manufacturedby Sony; there have been several different models since their introduction in1999. Able to walk, ”see” its environment via camera, and recognize spokencommands, they are considered to be autonomous robots, since they are able tolearn and mature based on external stimuli from their owner or environment,or from other AIBOs. The AIBO has seen used as an inexpensive platform forartificial intelligence research, because it integrates a computer, vision system,and articulators in a package vastly cheaper than conventional research robots.
Fig. 2. Aibo relationship.
The AIBO robot establishes communication with people by displaying emo-tions, and assumes various behaviors (autonomous actions) based on infor-mation which it gathers from its environment. The AIBO robot is not onlya robot, but an autonomous robot with the ability to complement your life.While living with you, the AIBO robot’s behavioral patterns will develop as it
4

learns and grows.Emotions and instincts form the basis for the AIBO robot’sautonomous behavior. Based on all sorts of factors which it picks up fromits surroundings, the AIBO robot undergoes changes in spirit that displaythemselves in the form of emotional expression.
3 Multi-class Classifiers
To deal with the multi-class categorization problem, we perform a wide com-parative among the state-of-the-art multi-class classifiers: K-Nearest Neigh-bors [7], Fisher Linear Discriminant Analysis [6], Support Vector Machines[10], and Adaboost [11].
Table 1 shows the formulation for the different multi-class classifiers and therest of the paper techniques:
Var Meaning
N number of samples
x vector features test
n dimension
i, j, m, t index
M number of runs
q distance
y Training samples
C number of class
ci class with index i
z new projected samples
H number of ranges
g gradient
ve affected pixel
X, Y components
θ angle
λ set of intersection points
Var Meaning
W projection matrix
Sb Scatter matrix between-class
Sw Scatter matrix intra-class
s index
T Transpose
l label
d, r, γ Kernel parameters
ξ, b SVM optimization parameters
w eigen vectors
φ Kernel function
h range of distance
p point
O orientation matrix
a pendent of the line
ϕ constant
Table 1Paper formulation
5

K-Nearest Neighbors
Among the various methods of supervised statistical pattern recognition, theNearest Neighbor is the most traditional one, it does not consider a prioriassumptions about the distributions from which the training examples aredrawn. It involves a training set of both positive and negative cases. A newsample is classified by calculating the distance to the nearest training case;the sign of that point then determines the classification of the sample. Thek−NN classifier extends this idea by taking the k nearest points and assigningthe sign of the majority. It is common to select k small and odd to break ties(typically 1, 3 or 5). Larger k values help reduce the effects of noisy pointswithin the training data set, and the choice of k is often performed throughcross-validation. In this way, given a input test sample vector of features x ofdimension n, we estimate its Euclidean distance d (eq.1) with all the trainingsamples (y) and classify to the class of the minimal distance.
q(x, y) =
√√√√n∑
j=1
(xj − yj)2 (1)
Fisher Linear Discriminant Analysis
Given the binary classification problem, Fisher projects at one dimension eachpair of classes (reducing to C − 1 where C is the number of classes), multi-plying each sample by its projection matrix, which minimize the distancebetween samples of the same class, and maximizes the distance between thetwo classes.The result is shown in fig. 3, where the blue and red points belongto the samples of the two projected classes, and the green line indicates thethreshold that best separates them .
Fig. 3. Fisher projection for two classes and threshold value.
The algorithm is:
Given the set of N column vectors {−→yi } of dimension n, we calculate the meanof the data. For C classes {c1, c2, , cC}, the mean of the class ci that containsNi elements is:
−→µ yi =1
Ni
∑−→y jεci
−→y i (2)
6

The separability maximization between classes will be defined as the quotientbetween the scatter matrix between-class:
Sb =I∑
i=1
Ni(−→µ yi −−→µ y)(−→µ yi −−→µ y)
T (3)
and the scatter matrix intra-class:
Sw =I∑
i=1
∑−→y jεci
(−→y j −−→µ yi)(−→y j −−→µ yi)
T (4)
obtaining a projection that define an optimal discriminant features.
The projection matrix W maximizes:
det(W T SBW )
det(W T SW W )(5)
Let{−→w 1,−→w s, ...,−→w n} be the generalized eigenvectors of SB and SW. Then,selecting the d < n that corresponds to the highest eigenvalue, we have theprojection matrix W = [
−→W 1,
−→W s, ...,
−→W n] , project the samples to the new
space by using:
−→z = W Td−→y
The generalized eigenvectors of eq.(5) are the eigenvectors of SBS−1W
Support Vector Machines
The goal of SVM is to produce a model which predicts target value of datainstances in the testing set which are given the attributes . Given a training setof instance-label pairs (yi, l), where yiεR
n and lε{1,−1}, the support vectormachines require the solution of the following optimization problem:
minw,b,ξ
1
2wT w + C
I∑
i=1
ξi (6)
Subject to
l(wT φ(yi) + b) ≥ 1− ξi, ξi ≥ 0 (7)
7

Here training vectors yi are mapped into a higher (maybe infinite) dimensionalspace by the function φ . Then SVM finds a linear separating hyperplane withthe maximal margin in this higher dimensional space. c > 0 is the penaltyparameter of the error term. We can define, K(yi, yj ≡ φ(yi)
T φ(yj)) called thekernel function. Though new kernels are being proposed by researchers, themost common four basic kernels are:
Linear: K(yi, yj) = yTi yj
Polynomial: K(yi, yj) = (γyTi yj + r)d, γ > 0
Radial basis function (RBF): K(yi, yj) = exp(−γ ‖ yi − yj ‖2), γ > 0
Sigmoid: K(yi, yj) = tanh(γyTi yj + r)
Here γ, r, and d are kernel parameters.
Adaboost
The AdaBoost boosting algorithm has become over the last few years a verypopular algorithm to use in practice. The main idea of AdaBoost is to assigneach example of the given training set a weight. At the beginning all weightsare equal, but in every round the weak learner returns a hypothesis, and theweights of all examples classified wrong by that hypothesis are increased. Thatway the weak learner is forced to focus on the difficult examples of the trainingset. The final hypothesis is a combination of the hypotheses of all rounds,namely a weighted majority vote, where hypotheses with lower classificationerror have higher weight. Summarizing, the approach consists of a) choosinga (weak) classifier, b) modifying example weights in order to give priorityto examples where the previous classifiers fail, and c) combining classifiersin a multiple classifier. The combined classifier allows a good generalizationperformance with the only requirement that each weak learner obtains anaccuracy better than random. The Adaboost procedure has been used forfeature selection, detection, and classification problems. In our problem, theGentle Adaboost has been previously applied to detect the regions of interest(ROI) with high probability of containing signs from the Aibo video data[15].In fig. 4, the Gentle Adaboost algorithm used in the first step of this system[15]is shown.
In fig.4, the weights of each of the samples of the training set are initialized.Normally, the same weight is assigned to each sample satisfying
∑Ni=1 fi = 1.
At iteration m of the algorithm, a weak classifier evaluates the feature spaceand selects the best feature based on the weights of the samples. The samples
8

Fig. 4. Gentle Adaboost algorithm
are re-weighted with a exponential loss function, and the process is repeatedM times or when the training classification error is zero. The final strongclassifier of the Gentle Adaboost algorithm[12] is an additive model that usea threshold as a final classifier. To classify a new input, the results of applyingthe m weak classifiers with the test sample are added or subtracted dependingon the accuracy of each weak classifier. In the common case of using decisionstumps as a weak classifier, the additive model assigns the same weight toeach of the hypothesis, so all the features are considered to have the sameimportance. The last fact is the main difference between the Gentle Adaboostand the traditional Adaboost versions.
4 System
This section explains the details of our system scheme shown in fig. 5, fo-cusing on the relationship between each of the methods explained above andtheir integration in a real time recognition system. The system is composedby three main stages: object detection, model fitting and normalization, andclassification.
4.1 Object Detection
Detected region are provided by the detection process based on an attentionalcascade of boosting classifiers applying the Haar-like featuring estimated overthe integral image. Given an Adaboost positive sample, it determines a regionof interest (ROI) that contains an object [15] (training detector and objectdetection steps of fig.5). However, besides the ROI we miss information aboutscale and position, so before applying recognition we need to apply a spatialnormalization. Concerned with the correlation of sign distortion, we look foraffine transformations that can perform the spatial normalization to improvefinal recognition.
9

Fig. 5. Object detection and classification system of the Aibo robot
10

4.2 Model Fitting and normalization
To deal with the Model fitting step of fig.5,we apply the fast radial symmetryto fit circular signs, that offers great robustness against the noise [5]. On theother hand, for the case of triangular signs, the method that allows a successfulmodel fitting is based on the Hough transform [13].
Fast radial symmetry
In order to capture the model contained in the detected ROI, we considerthe radial properties of the circular signs to fit a possible instance and toestimate its center and radius.The fast radial symmetry is calculated overa set of one or more ranges H depending on the scale of the features one istrying to detect. The value of the transform at range indicates the contributionto radial symmetry of the gradients at a distance h away from each point.At each range h, we examine the gradient g at each point p, from which acorresponding positively-affected pixel p+ve(p) and negatively-affected pixelp−ve(p) are determined and accumulated in the orientation projection imageOn:
a) P+ve(p) = p + roundg(p)
||g(p)||h, P−ve(p) = p− roundg(p)
||g(p)||h (8)
b) Oh(P+ve(p)) = Oh(P+ve(p)) + 1, Oh(P−ve(p)) = Oh(P−ve(p)) + 1(9)
Now, to locate the radial symmetry position, we search for the position (X, Y )of maximal value at accumulated orientations matrix OT =
∑hi=1 Oh. Locat-
ing that maximum we determine the radius length. This procedure allows toobtain robust results for circular traffic signs fitting. An example is shown infig. 6, where the X and Y gradient components, gradient module, orientationsmatrix, and estimated center and radius are shown.
(a) (b) (c) (d) (e) (f)
Fig. 6. (a) Input image, (b) X-derived, (c) Y-derived, (d) image gradient g, (e) totalorientations accumulator matrix OT , (f) Captured center and radius.
11

Hough transform
The Hough transform is a technique which can be used to isolate features of aparticular shape within an image. Because it requires that the desired featuresbe specified in some parametric form, the generalized Hough transform canbe employed in applications where a simple analytic description of a featuresis not possible.The underlying principle of the Hough transform is that thereare an infinite number of potential lines that pass through any point, each ata different orientation. The purpose of the transform is to determine whichof these theoretical lines pass through most features in an image - that is,which lines fit most closely to the data in the image. In order to determinethat two points lie on the same potential line, it is necessary to create arepresentation of a line that allows meaningful comparison in this context. Inthe standard Hough transform, each line is represented by two parameters,commonly called r and θ (theta), which represent the length and angle fromthe origin of a normal to the line in question fig. 7. Using this parametrization,an equation of the line can be written as:
q = X cos θ + Y sin θ (10)
Y1 = round(q −X1 cos θ
sin θ) (11)
Y2 = round(q − Y2 cos θ
sin θ) (12)
a =Y2 − Y1
X2 −X1
(13)
b = Y1 − aX1 (14)
Fig. 7. Correspondence to Hough
Given an input image (fig. 8)(a) we used Canny detector to obtain the contoursmap (fig. 8(b)) before of applying the Hough transform..
12

Given a region of interest that contains a sign, we know a priori that the threepossible angles of each side of the triangle and an error margin. With thisinformation, we searched at three possible angles range for the three threerepresentative lines at Hough space fig. 8(e). Once we had the three lines,we only needed to calculate its intersection to find the three corners of thetriangle fig. 8(c). With the three corners of the triangle we can transform theimage to correct the affine transformations to proceed with the classificationprocedure.
(a) (b) (c) (d) (e)
Fig. 8. (a) Input image, (b) Canny contours, (c) detected triangle lines and intersec-tions, (d) Hough space, (e) three detected lines for three known angles and marginerror,
Nevertheless,before final transformation, we need to consider additional re-strictions to obtain the three representative border lines of a triangular trafficsign. Each line has associated a position in relation to the others. In fig. 9(a)a false horizontal detected sign due to the background confusion is shown.As this line does not have the expected spatial restrictions of the object, weiterate Hough to detect the following representative line considering its rangeof degrees. The corrected image is shown in fig. 9(b). Once we have the threedetected lines we calculate their intersection, as shown in fig. 9(c). Given theparameters a and ϕ that define the equation y = a × x + ϕ for each of thethree lines, the intersection point (X,Y ) for each pair of lines is defined asfollows:
Xt = (ϕi2 − ϕi
1)/(ai1 − ai
2), Yt = ai1Xt + ϕi
1 | t, i ∈ [1, ..., 3] (15)
To assure that the lines are the expected ones, we complement the proceduresearching for a corner at a circular region at each intersection surroundings(as shown in fig. 9(d) and (e)):
λ = {(Xi, Yi) | ∃p < ((X −Xi)2 + (Y − Yi)
2 − d2)} | i ∈ [1, ..., 3] (16)
where λ is the set of valid intersection points, and p corresponds to a cornerpoint to be located in a neighborhood of the intersection point.
13

(a) (b) (c) (d) (e)
Fig. 9. (a) Three detected lines, (b) Corrected horizontal line, (c) Lines intersections,(d) Corner checking, (e) Corner found.
Normalization:
The analysis of sign images is a difficult problem given the low quality ofthe images, To cope with this problem, we need elaborate and study differ-ent spatial normalization. Once the sign model is fitted using the commentedmethods, the next procedure is the spatial normalization of the shape beforeclassification. The steps are: transform the image to make the recognition in-variant to small affine deformations, rescale to the signs database size, filterwith Weickert [14] anisotropic filter, and mask the image to exclude back-ground at the classification step. To prevent the effects of illumination changes,the histogram equalization improves image contrast and yields a uniform his-togram.
4.3 Classification
Once we have the image normalized, a set of classification strategies are appliedto deal with the multi-class sign categorization in order to obtain the label ofthe object.
5 Results
To validate the methods of our system, we apply a set of experiments: wesimulate the system in the Aibo robot, we test the system in a real traffic signsand classification problem, and finally, we show different scientific exhibitionsof the present work. In the following section, we show the parameters thatoptimize the performance of our system.
14

5.1 Work Parameters
5.1.1 Model fitting
The Hough transform applied is the probabilistic hough transform because itis more efficient in case of few long linear segments. The Distance resolutionin our system is 1 pixel-related units, and the angle resolution measured isπ
180radians. Others parameters are : 10 accumulated pixel orientations for
threshold, 2 pixels for the maximum gap between line segments lieing on thesame line and, finally, 3 pixels for minimum line length. For the fast radialsymmetry, we apply a range of possible radius between 12 and 32 pixels,and a threshold of 10% of the maxim gradient magnitude to compute theorientations.
5.1.2 Classification
The parameter used for the classification strategies are: 3 neighbors for K −NN , 99% or a previous PCA and 3 neighbors for the FLDA strategy, RadialBasis function SVM with the gamma parameter set to 1, and 40 runs of GentleAdaboost with decision stumps. K −NN algorithm is applied directly in themulti-class case, the rest of classification strategies are binary (they distinguishagainst just two classes). To extend the categorization strategies to the multi-class case, we used a voting scheme. The voting scheme consist on trainingeach pair of possible classes (C(C − 1)/2 pair of classes for C classes), andfinally classify by the class with highest number of votes. The estimation ofthe accuracy is obtained using stratified ten-fold cross-validation at 95% ofthe confidence interval.
5.2 Aibo Experiments
For this experiment, we used a set of 500 triangular and 500 circular signsobtained from the method of [15]. The triangular and circular signs are dividedin the classes of fig.13. Some real detected regions from the 416 × 320 pixelsAibo resolution are shown in fig.12
We can observe the good results of the vector classification in fig.10 and 11for circular and triangular signs, respectively. The results in both cases arequite similar. In the same figures, Gentle Adaboost also obtain good results,and the last positions are for FLDA and KNN, respectively.
An example of the detection and classification of triangular signs is shown infig.14, with an experimental interface designed for our application in [15].
15

Fig. 10. Multi-class classifiers Accuracy for circular signs
Fig. 11. Multi-class classifiers Accuracy for tringular signs
Fig. 12. detected regions from Aibo resolution
Fig. 13. Aibo experiment classes
5.3 Traffic signs classification
For the problem of real traffic sign classification, we use regions from [16] thatcontain a wide set of traffic signs. In particular, we classify the 12 triangular
16

Fig. 14. Experimental interface with detection and classification of triangular signs
classes of fig.19, and the 18 circular classes of fig.17 and 18. The classificationresults are shown in figures fig.15 and 16 for circular and triangular classes,respectively. In this case, the ranking of the classifiers is similar comparedto the Aibo results, and we also obtain high results for the triangular groupapplying our fitting and normalization strategies. Nevertheless, the circularresults are some inferior in this case. It is a normal behavior since the speedgroup has very similar classes, and the resolution of the considered regions (atleast 24× 24 pixels) makes the classification ambiguous in some cases.
Fig. 15. Multi-class classifiers Accuracy for circular traffic signs
Fig. 16. Multi-class classifiers Accuracy for triangular traffic signs
In the figures 17,18,19 we can observe as all classes except classes of speedsigns are quite different.
17

Fig. 17. Circular traffic classes
Fig. 18. Speed traffic classes
Fig. 19. Triangular traffic classes
5.4 Discussion
In this chapter, we comment different exhibitions of the present system ondifferent social events.
5.4.1 ”Apropa’t a la cincia”
Robotics is a focus of attention for a high number of scientists. Now, 50 yearsafter the birth of the Artificial Intelligence, we presented, during the year2006/2007 in the ”Apropa’t a la Cincia” event organized by the Generalitat deCatalunya, a simulation of the Aibo robot using our system. Different illustra-tions from the event are shown in figures fig. 20. For more details of the eventsee Appendix X or enter in http://www10.gencat.net/probert/catala/exposicio/ex14 ciencia.htm
18

(a) Aibo environment (b) Aibo interface
Fig. 20. Pictures of the exhibition ”Apropa’t a la cincia(2006/2007”)
(a) Program frame (b) Documental logo
Fig. 21. Redes TV program ”Programming emotions”(7.1.2007)
5.4.2 ”Redes”
Besides, our work was emitted as a part of the documental ”REDES” fromTV2 with the little ”programing emotions”, in date of 7.1.2007. Differentimages from the show are shown in figure fig.21. For more details enter inhttp://www.rtve.es/tve/b/redes/semanal/prg418/index.html
6 Conclusions
We presented a multi-class classification system for triangular and circularsigns that allow to autonomous robots to interact with its environment. Thestrategy fits the model and normalize the image region contain. Besides, aset of state-of-the-art classification strategic has been tested to obtain robustresults. The presented methodology has been introduced in the Aibo robot ofSony and tested in a real traffic signs problem,with great success.
19

7 Acknowledges
I want to acknowledge Sergio Escalera and Petia Radeva by their directionin this project. To my companions Carlos and Pepelu by its contributions,and the inestimable aid of Xavi. Also I want to acknowledge my family andMiriam, by the support, helps, and sometimes by their patience.Thank you!!!
References
[1] George A. Bekey, ”Autonomous Robots: From Biological Inspiration toImplementation and Control (Intelligent Robotics and Autonomous Agents)”2005
[2] ”http://www.adx2.com/content/category/8/22/59/”, ”OFRO +detect”Digital 2007
[3] ”http://www.aethon.com/inthenews/archive.html”, ”The Tug in the News”Digital 2007
[4] ”support.sony-europe.com/aibo/downloads/”, ”Sony Aibo Robot” Digital2005
[5] G. Loy, and A. Zelinsky, ”A Fast Radial Symmetry Transform for DetectingPoints of Interest”, Transactions on PAMI, 2003.
[6] MaxWelling , ”Fisher Linear Discriminant Analysis”, Department of ComputerScience, University of Toronto, 2002.
[7] Wen-Jyi Hwang, Kuo-Wei Wen, ”Fast kNN classification algorithm based onpartial distance search”, Chung Yuan Christian Univ 1998.
[8] Ian T. Jolliffe, ”Principal Component Analysis”, 2002.
[9] Patrice Y. Simard, Yann A. Le Cun, John S. Denker, Bernard Victorri,”Transformation Invariance in Pattern Recognition Tangent Distance andTangent Propagation” ,Image Processing Services Research Lab, ATT LabsUSA
[10] Chih-Wei Hsu, Chih-Chung Chang, and Chih-Jen Lin, ”A Practical Guideto Support Vector Classification”, Department of Computer Science andInformation Engineering, National Taiwan University, 2002.
[11] J. Friedman, T. Hastie, and R. Tibshirani, Additive logistic regression: astatistical view of boosting,” Technical Report, 1998.
[12] S. Escalera, O. Pujol, and P. Radeva, ”Boosted Landmarks of contextualdescriptors and Forest-ECOC: A novel framework to detect and classify objectsin cluttered scenes”, International Conference on Pattern Recognition, HongKong, 2006.
20

[13] B. S. Morse, Segmentation (edge based, hough transform),” technical report,2000.
[14] Weickert J., ”Anisotropic diffusion in image processing”, EuropeanConsortium for Mathematics in Industry (B.G. Teubner,Stuttgart), 1998.
[15] C. Gallardo, ”Generic Object Detection for Autonomous Robots ,” technicalreport UAB, 2007.
[16] url:”http://www.icc.es/” ”Institut Cartogrfic de Catalunya”
[17] url:”http://www.seudigital.cat/ciencia/” ”Barcelona ciutat de la Ciencia”
[18] url:”http://www10.gencat.net/probert/catala/exposicio/ex14 ciencia.htm””Apropa’t a la ciencia. De la Recerca a la Innovacio”
21

8 Appendices
Appendices To complement the information of the project that can not beincluded in the article, some appendices have been included. In order to explainin more detail the domain of the work.
8.1 The AIBO Entertainment Robot ERS-7M3 parts
Fig. 22. Front view of Aibo Robot
[1] Stereo microphones Allow the AIBO Entertainment Robot to listen to thesurrounding environment.
[2] Head distance sensor Measures the distance between the AIBO robot andother objects.
[3] Color camera Detects the color, shape, and movement of nearby objects.
[4] Mouth Picks up the AIBOne toy and expresses emotions.
[5] Chest distance sensor Measures the distance between the AIBO robot andother objects.
[6]Tail Moves up, down, left, and right to express the AIBO robot’s emotions.
[7] Ears Indicates the AIBO robot’s emotions and condition.
22

Fig. 23. Top view of Aibo Robot.
[8] Head sensor Detects and turns white when you gently stroke the AIBOrobot’s head.
[9] Wireless light (on the back of the AIBO robot’s head) Indicator used withthe wireless LAN function. This light turns blue when the AIBO robot isconnected to the e-mail server.
[10] Pause button When pressed, the AIBO robot’s activity will pause orresume.
[11] Back sensors (front, middle, and rear) Detect and turn white when yougently stroke the AIBO robot’s back.
[12] Face lights (illuminated face) These lights turn various colors to show theAIBO robot’s emotions and conditions.
[13] Head light Detects and turns white when you touch the head sensor.Lights / flashes orange when one of the AIBO robot’s joints is jammed .
[14] Mode indicators (inner side of ears) These indicate the present mode andcondition of the AIBO robot .
23

[15] Operation light During operation: turns green. During preparation forshutdown: flashes green. During charging: turns orange. When a charging erroroccurs: flashes orange. When operation stops: turns OFF. Outside hours ofactivity (Sleeping on the Energy Station): slowly flashing green.
[16] Back lights (front, middle, and rear) Detect and turn white when yougently touch the AIBO robot’s back sensors. These lights also turn blue (front),orange (middle), and red (rear) to indicate a variety of actions.
This shows the AIBO robot with its stomach compartment cover off.24
Fig. 24. Bottom view of Aibo Robot.
[1] Paw sensors These are located on the bottom of the AIBO EntertainmentRobot’s paws, and detect contact with any surface it touches. When the AIBO
24

robot extends one of its paws, it will react with happiness if you touch it.
[2] Speaker Emits music, sound effects, and voice guide.
[3] Charging terminal When you place the AIBO robot on the Energy Station,this part makes contact with the station to allow charging of the AIBO robot’sbattery.
[4] Volume control switch (VOLUME) Adjusts the volume of the speaker toone of four levels (including no sound).
[5] Wireless LAN switch (WIRELESS) This turns the AIBO robot’s wirelessLAN function ON or OFF.
[6] ”Memory Stick” media access indicator This indicator turns red while theAIBO robot is reading or writing to a ”Memory Stick” media. While theindicator is ON, you cannot remove the ”Memory Stick” media or batteryby means of the ”Memory Stick” media eject button (Z) or the battery latch(Z). Under this circumstance, never attempt to forcibly remove the ”MemoryStick” media.
[7] Battery pack latch (BATT Z) Flip this latch to the rear when you want toremove the battery.
[8] Chin sensor Senses when you touch the AIBO robot’s chin.
[9] FCC ID/MAC address label Indicates the FCC ID and MAC address ofthe AIBO robot’s wireless unit.
[10] Battery slot Holds the AIBO robot’s lithium-ion battery.
[11] ”Memory Stick” media eject button (Z) Press to eject the ”Memory Stick”media. L ”Memory Stick” media slot This is where you insert the providedAIBO-ware ”Memory Stick” media.
If you experience difficulties ejecting the ”Memory Stick” media or batterybecause of a malfunction or operation problems, place the AIBO robot inPause mode, and then insert an object such as a paper clip into the emergencyeject hole. (Do not use fragile objects, such as toothpicks, into the emergencyeject hole as they may break.) Under normal circumstances, you do not needto use the emergency eject hole.
8.1.1 AIBO COLOR CAMERA
About the pictures o Pictures are stored on the ”Memory Stick” media inJPEG format.The picture resolution is 416x320 pixels. Depending on lighting
25

Fig. 25. Aibo color camera.
conditions at the time the picture is taken, flicker (horizontal stripes) mayappear in pictures, or pictures may have red or blue hues.Fast movement mayresult in distortion of pictures.
26

8.2 Computer Vision
The field of computer vision can be characterized as immature and diverse.Even though earlier work exists, it was not until the late 1970s that a morefocused study of the field started when computers could manage the processingof large data sets such as images. However, these studies usually originatedfrom various other fields, and consequently there is no standard formulationof the computer vision problem. Also, and to an even larger extent, there isno standard formulation of how computer vision problems should be solved.Instead, there exists an abundance of methods for solving various well-definedcomputer vision tasks, where the methods often are very task specific andseldom can be generalized over a wide range of applications. Many of themethods and applications are still in the state of basic research, but moreand more methods have found their way into commercial products, wherethey often constitute a part of a larger system which can solve complex tasks(e.g., in the area of medical images, or quality control and measurements inindustrial processes).
Computer vision is by some seen as a subfield of artificial intelligence whereimage data is being fed into a system as an alternative to text based input forcontrolling the behavior of a system. Some of the learning methods which areused in computer vision are based on learning techniques developed withinartificial intelligence.
Since a camera can be seen as a light sensor, there are various methods incomputer vision based on correspondences between a physical phenomenonrelated to light and images of that phenomenon. For example, it is possibleto extract information about motion in fluids and about waves by analyzingimages of these phenomena. Also, a subfield within computer vision deals withthe physical process which given a scene of objects, light sources, and cameralenses forms the image in a camera. Consequently, computer vision can alsobe seen as an extension of physics.
A third field which plays an important role is neurobiology, specifically thestudy of the biological vision system. Over the last century, there has beenan extensive study of eyes, neurons, and the brain structures devoted to pro-cessing of visual stimuli in both humans and various animals. This has led toa coarse, yet complicated, description of how real vision systems operate inorder to solve certain vision related tasks. These results have led to a subfieldwithin computer vision where artificial systems are designed to mimic the pro-cessing and behavior of biological systems, at different levels of complexity.Also, some of the learning-based methods developed within computer visionhave their background in biology.
27

Yet another field related to computer vision is signal processing. Many existingmethods for processing of one-variable signals, typically temporal signals, canbe extended in a natural way to processing of two-variable signals or multi-variable signals in computer vision. However, because of the specific nature ofimages there are many methods developed within computer vision which haveno counterpart in the processing of one-variable signals. A distinct characterof these methods is the fact that they are non-linear which, together with themulti-dimensionality of the 19 22 signal, defines a subfield in signal processingas a part of computer vision.
Beside the above mentioned views on computer vision, many of the relatedresearch topics can also be studied from a purely mathematical point of view.For example, many methods in computer vision are based on statistics, opti-mization or geometry. Finally, a significant part of the field is devoted to theimplementation aspect of computer vision; how existing methods can be real-ized in various combinations of software and hardware, or how these methodscan be modified in order to gain processing speed without losing too muchperformance.
8.2.1 Related fields
Computer vision, Image processing, Image analysis, Robot vision and Machinevision are closely related fields. If you look inside text books which have eitherof these names in the title there is a significant overlap in terms of whattechniques and applications they cover. This implies that the basic techniquesthat are used and developed in these fields are more or less identical, somethingwhich can be interpreted as there is only one field with different names.
On the other hand, it appears to be necessary for research groups, scientificjournals, conferences and companies to present or market themselves as be-longing specifically to one of these fields and, hence, various characterizationswhich distinguish each of the fields from the others have been presented. Thefollowing characterizations appear relevant but should not be taken as univer-sally accepted.
Image processing and Image analysis tend to focus on 2D images, how totransform one image to another, e.g., by pixel-wise operations such as con-trast enhancement, local operations such as edge extraction or noise removal,or geometrical transformations such as rotating the image. This characteri-zation implies that image processing/ analysis does not produce nor requireassumptions about what a specific image is an image of.
Computer vision tends to focus on the 3D scene projected onto one or severalimages, e.g., how to reconstruct structure or other information about the 3Dscene from one or several images. Computer vision often relies on more or less
28

complex assumptions about the scene depicted in an image.
Machine vision tends to focus on applications, mainly in industry, e.g., visionbased autonomous robots and systems for vision based inspection or measure-ment. This implies that image sensor technologies and control theory oftenare integrated with the processing of image data to control a robot and thatreal-time processing is emphasized by means of efficient implementations inhardware and software. There is also a field called Imaging which primarilyfocus on the process of producing images, but sometimes also deals with pro-cessing and analysis of images. For example, Medical imaging contains lots ofwork on the analysis of image data in medical applications.
Finally, pattern recognition is a field which uses various methods to extractinformation from signals in general, mainly based on statistical approaches.A significant part of this field is devoted to applying these methods to imagedata. A consequence of this state of affairs is that you can be working in alab related to one of these fields, apply methods from a second field to solvea problem in a third field and present the result at a conference related to afourth field!
8.2.2 Examples of applications for computer vision
Another way to describe computer vision is in terms of applications areas. Oneof the most prominent application fields is medical computer vision or medicalimage processing. This area is characterized by the extraction of informationfrom image data for the purpose of making a medical diagnosis of a patient.Typically image data is in the form of microscopy images, X-ray images, an-giography images, ultrasonic images, and tomography images. An example ofinformation which can be extracted from such image data is detection of tu-mours, arteriosclerosis or other malign changes. It can also be measurementsof organ dimensions, blood flow, etc. This application area also supports med-ical research by providing new information, e.g., about the structure of thebrain, or about the quality of medical treatments.
A second application area in computer vision is in industry. Here, informa-tion is extracted for the purpose of supporting a manufacturing process. Oneexample is quality control where details or final products are being automat-ically inspected in order to find defects. Another example is measurement ofposition and orientation of details to be picked up by a robot arm. See thearticle on machine vision for more details on this area.
Military applications are probably one of the largest areas for computer vi-sion, even though only a small part of this work is open to the public. Theobvious examples are detection of enemy soldiers or vehicles and guidance ofmissiles to a designated target. More advanced systems for missile guidance
29

send the missile to an area rather than a specific target, and target selection ismade when the missile reaches the area based on locally acquired image data.Modern military concepts, such as battlefield awareness, imply that varioussensors, including image sensors, provide a rich set of information about acombat scene which can be used to support strategic decisions. In this case,automatic processing of the data is used to reduce complexity and to fuseinformation from multiple sensors to increase reliability.
One of the newer application areas is autonomous vehicles, which include sub-mersibles, land-based vehicles (small robots with wheels, cars or trucks), andaerial vehicles. An unmanned aerial vehicle is often denoted UAV. The levelof autonomy ranges from fully autonomous (unmanned) vehicles to vehicleswhere computer vision based systems support a driver or a pilot in varioussituations. Fully autonomous vehicles typically use computer vision for navi-gation, i.e. for knowing where it is, or for producing a map of its environment(SLAM) and for detecting obstacles. It can also be used for detecting cer-tain task specific events, e. g., a UAV looking for forest fires. Examples ofsupporting system are obstacle warning systems 21 24 in cars and systemsfor autonomous landing of aircraft. Several car manufacturers have demon-strated systems for autonomous driving of cars, but this technology has stillnot reached a level where it can be put on the market. There are ample ex-amples of military autonomous vehicles ranging from advanced missiles toUAVs for recon missions or missile guidance. Space exploration is already be-ing made with autonomous vehicles using computer vision, e. g., NASAs MarsExploration Rover.
Other application areas include the creation of visual effects for cinema andbroadcast, e.g., camera tracking or matchmoving, and surveillance.
8.2.3 Typical tasks of computer vision
Object recognition
Detecting the presence of known objects or living beings in an image, possiblytogether with estimating the pose of these objects.
Examples: Searching in digital images for specific content (content-based im-age retrieval) Recognizing human faces and their location in images. Estima-tion of the three-dimensional pose of humans and their limbs Detection ofobjects which are passing through a manufacturing process, e.g., on a con-veyor belt, and estimation of their pose so that a robot arm can pick up theobjects from the belt. Optical character recognition OCR (optical characterrecognition) takes pictures of printed or handwritten text and converts it intocomputer readable text such as ASCII or Unicode. In the past images wereacquired with a computer scanner, however more recently some software can
30

also read text from pictures taken with a digital camera.
Tracking
Tracking known objects through an image sequence.
Examples: Tracking a single person walking through a shopping center. Track-ing of vehicles moving along a road.
Scene interpretation
Creating a model from an image/video.
Examples: Creating a model of the surrounding terrain from images, whichare being taken by a robot-mounted camera. Anticipating the pattern of theimage to determine size and density to estimate the volume using tomographylike device. The cloud recognition is one the government project using thismethod.
Egomotion
The goal of egomotion computation is to describe the motion of an objectwith respect to an external reference system, by analyzing data acquired bysensors onboard on the object. i.e. the camera itself.
Examples: Given two images of a scene, determine the 3d rigid motion of thecamera between the two views.
8.2.4 Computer vision systems
A typical computer vision system can be divided in the following subsystems:
Image acquisition
The image or image sequence is acquired with an imaging system (camera,radar, lidar, tomography system). Often the imaging system has to be cali-brated before being used.
Preprocessing
In the preprocessing step, the image is being treated with low-level-operations.The aim of this step is to do noise reduction on the image (i.e. to dissociatethe signal from the noise) and to reduce the overall amount of data. This istypically being done by employing different (digital)image processing meth-ods such as: Downsampling the image. Applying digital filters convolutions,computing a scale space representation Correlations or linear shift invariant
31

filters Sobel operator Computing the x- and y-gradient (possibly also the time-gradient). Segmenting the image. Pixelwise thresholding. Performing an eigen-transform on the image Fourier transform Doing motion estimation for localregions of the image (also known as optical flow estimation). Estimating dis-parity in stereo images.
Feature extraction
The aim of feature extraction is to further reduce the data to a set of features,which ought to be invariant to disturbances such as lighting conditions, cameraposition, noise and distortion. Examples of feature extraction are: Performingedge detection or estimation of local orientation. Extracting corner features.Detecting blob features. Extracting spin images from depth maps. Extractinggeons or other three-dimensional primitives, such as superquadrics. Acquiringcontour lines and maybe curvature zero crossings. Generating features withthe Scale-invariant feature transform.
Registration
The aim of the registration step is to establish correspondence between thefeatures in the acquired set and the features of known objects in a model-database and/or the features of the preceding image. The registration stephas to bring up a final hypothesis. To name a few methods: Least squaresestimation Hough transform in many variations Geometric hashing Particlefiltering RANdom SAmple Consensus.
32

8.3 Traffic sign recognition mobile mapping acquisition
The Traffic Sign Recognition (TSR) is a field of applied computer vision re-search concerned with the automatical detection and classification of trafficsigns in traffic scene images acquired from a moving car. Most part of the workdone in this field is enclosed in the problem of the Intelligent TransportationSystems (ITS), which aim is to provide Driver Support Systems (DSS) withthe ability to understand its neighborhood environment and so permit ad-vanced driver support such as collision prediction and avoidance. Driving isa task based fully on visual information processing. The road signs and traf-fic signals define a visual language interpreted by drivers. Road signs carrymany information necessary for successful driving - they describe current traf-fic situation, define right-of-way, prohibit or permit certain directions, warnabout risky factors, etc. Road signs also help drivers with navigation. Twobasic applications of TSR are under consideration in the research community- drivers aid (DSS) and automated surveillance of road traffic devices. It isdesirable to design smart car control systems in such a way to allow evolu-tion of fully autonomous vehicles in the future. The TSR system is also beingconsidered as the valuable complement of the GPS-based navigation system.The dynamical environmental map may be enriched by road sign types andpositions (acquired by TSR) and so help with the precision of current vehicleposition.
Mobile mapping: the Geomobil project on Mobile mapping is a useful tech-nique used to compile cartographic information from a mobile vehicle. Themobile vehicle is usually equipped with a set of sensors synchronized with anorientation system in order to link the obtained information with its positionover the map. We are working with the mobile mapping system named Ge-omobil. The Geomobil is a Land Based Mobile Mapping System (LBMMS)developed by the Institut Cartogr‘afic de Catalunya (ICC) (fig.26). It is amodular system that allows the direct orientation of any sensor mounted on aroof platform. The Geomobil system is composed of the following subsystems:orientation subsystem, image subsystem, laser ranging subsystem, synchro-nization subsystem, power and environmental control subsystem. In our casewe only use information from the image and orientation subsystems, whichwill be briefly explained in the rest of this point.
Geomobil system: the orientation subsystem is responsible for georeferencingthe images acquired by the Geomobil. Thus it provides the coordinates (posi-tion) and the angles (attitude) of their projection centers. It is a system thatcombines inertial and GPS observations at a high level of integration, wherethe GPS derived trajectories are used to correct and calibrate the drifts ofthe Inertial Measurement Unit (IMU) gyros and accelerometers so that theposition and velocity errors derived from inertial sensors are minimized. This
33

combination of GPS and IMU systems allows the system to calculate the po-sition even when the GPS satellites signals are blocked by terrain conditions(buildings, bridges, tunnels,...). The image subsystem design has been drivenby two main requirements: to acquire images of at least 1Mpix and to get 10mstereoscopic overlap at a 10m distance from the van.
Fig. 26. Geomobil system.
The stereo overlap is conditioned by two factors: getting the maximum stereo-scopic overlap free of obstacles and preserving a B/D ratio (stereoscopic Base- object Distance) as good as possible. The system links the captured im-ages with their position and orientation data, and saves the information tothe discs. The acquisition frequency is limited by the storage system capacity,and nowadays is programmed to take a stereo-pair of images each 10 metersor a turn higher than 60 degrees, which corresponds to the camera field ofview
Fig. 27. Stereoscopic system diagram. We can see the relation between overlap zoneand distance.
34

Fig. 28. Geovan camera characteristics.
35

8.4 Artificial Intelligence History
8.4.1 Prehistory of AI
Humans have always speculated about the nature of mind, thought, and lan-guage, and searched for discrete representations of their knowledge. Aristotletried to formalize this speculation by means of syllogistic logic, which remainsone of the key strategies of AI. The first is-a hierarchy was created in 260 byPorphyry of Tyros. Classical and medieval grammarians explored more subtlefeatures of language that Aristotle shortchanged, and mathematician BernardBolzano made the first modern attempt to formalize semantics in 1837.
Early computer design was driven mainly by the complex mathematics neededto target weapons accurately, with analog feedback devices inspiring an idealof cybernetics. The expression ”artificial intelligence” was introduced as a’digital’ replacement for the analog ’cybernetics’.
8.4.2 Development of AI theory
Much of the (original) focus of artificial intelligence research draws from anexperimental approach to psychology, and emphasizes what may be calledlinguistic intelligence (best exemplified in the Turing test).
Approaches to Artificial Intelligence that do not focus on linguistic intelligenceinclude robotics and collective intelligence approaches, which focus on activemanipulation of an environment, or consensus decision making, and draw frombiology and political science when seeking models of how ”intelligent” behav-ior is organized. AI also draws from animal studies, in particular with insects,which are easier to emulate as robots (see artificial life), as well as animals withmore complex cognition, including apes, who resemble humans in many waysbut have less developed capacities for planning and cognition. Some researchersargue that animals, which are apparently simpler than humans, ought to beconsiderably easier to mimic. But satisfactory computational models for ani-mal intelligence are not available.
Seminal papers advancing AI include ”A Logical Calculus of the Ideas Im-manent in Nervous Activity” (1943), by Warren McCulloch and Walter Pitts,and ”On Computing Machinery and Intelligence” (1950), by Alan Turing, and”Man-Computer Symbiosis” by J.C.R. Licklider. See Cybernetics and Turingtest for further discussion. There were also early papers which denied thepossibility of machine intelligence on logical or philosophical grounds such as”Minds, Machines and Godel” (1961) by John Lucas. With the developmentof practical techniques based on AI research, advocates of 10 AI have arguedthat opponents of AI have repeatedly changed their position on tasks such as
36

computer chess or speech recognition that were previously regarded as ”intel-ligent” in order to deny the accomplishments of AI. Douglas Hofstadter, inGodel, Escher, Bach, pointed out that this moving of the goalposts effectivelydefines ”intelligence” as ”whatever humans can do that machines cannot”.John von Neumann (quoted by E.T. Jaynes) anticipated this in 1948 by say-ing, in response to a comment at a lecture that it was impossible for a machineto think: ”You insist that there is something a machine cannot do. If you willtell me precisely what it is that a machine cannot do, then I can always makea machine which will do just that!”. Von Neumann was presumably alludingto the Church-Turing thesis which states that any effective procedure can besimulated by a (generalized) computer.
In 1969 McCarthy and Hayes started the discussion about the frame prob-lem with their essay, ”Some Philosophical Problems from the Standpoint ofArtificial Intelligence”.
8.4.3 Experimental AI research
Artificial intelligence began as an experimental field in the 1950s with suchpioneers as Allen Newell and Herbert Simon, who founded the first artificialintelligence laboratory at Carnegie Mellon University, and John McCarthyand Marvin Minsky, who founded the MIT AI Lab in 1959. They all attendedthe Dartmouth College summer AI conference in 1956, which was organizedby McCarthy, Minsky, Nathan Rochester of IBM and Claude Shannon.
Historically, there are two broad styles of AI research - the ”neats” and”scruffies”. ”Neat”, classical or symbolic AI research, in general, involvessymbolic manipulation of abstract concepts, and is the methodology used inmost expert systems. Parallel to this are the ”scruffy”, or ”connectionist”,approaches, of which artificial neural networks are the best-known example,which try to ”evolve” intelligence through building systems and then improv-ing them through some automatic process rather than systematically designingsomething to complete the task. Both approaches appeared very early in AIhistory.
Throughout the 1960s and 1970s scruffy approaches were pushed to the back-ground, but interest was regained in the 1980s when the limitations of the”neat” approaches of the time became clearer. However, it has become clearthat contemporary methods using both broad approaches have severe limita-tions.
Artificial intelligence research was very heavily funded in the 1980s by the De-fense Advanced Research Projects Agency in the United States and by the fifthgeneration computer systems project in Japan. The failure of the work fundedat the time to produce immediate results, despite the grandiose promises of
37
some AI practitioners, led to correspondingly large cutbacks in funding bygovernment agencies in the late 1980s, leading to a general downturn in ac-tivity in the field known as AI winter. Over the following decade, many AIresearchers moved into related areas with more modest goals such as machinelearning, robotics, and computer vision, though research in pure AI continuedat reduced levels.
8.4.4 Micro-World AI
The real world is full of distracting and obscuring detail: generally scienceprogresses by focusing on artificially simple models of reality (in physics, fric-tionless planes and perfectly rigid bodies, for example). In 1970 Marvin Minskyand Seymour Papert, of the MIT AI Laboratory, proposed that AI researchshould likewise focus on developing programs capable of intelligent behaviourin artificially simple situations known as micro-worlds. Much research has fo-cused on the so-called blocks world, which consists of coloured blocks of variousshapes and sizes arrayed on a flat surface.
8.4.5 Spinoffs
Whilst progress towards the ultimate goal of human-like intelligence has beenslow, many spinoffs have come in the process. Notable examples include thelanguages LISP and Prolog, which were invented for AI research but are nowused for non-AI tasks. Hacker culture first sprang from AI laboratories, inparticular the MIT AI Lab, home at various times to such luminaries as JohnMcCarthy, Marvin Minsky, Seymour Papert (who developed Logo there) andTerry Winograd (who abandoned AI after developing SHRDLU).
8.4.6 AI languages and programming styles
AI research has led to many advances in programming languages includingthe first list processing language by Allen Newell et. al., Lisp dialects, Plan-ner, Actors, the Scientific Community Metaphor, production systems, andrule-based languages. GOFAI TEST research is often done in programminglanguages such as Prolog or Lisp. Bayesian work often uses Matlab or Lush(a numerical dialect of Lisp). These languages include many specialist prob-abilistic libraries. Real-life and especially real-time systems are likely to useC++. AI programmers are often academics and emphasise rapid developmentand prototyping rather than bulletproof software engineering practices, hencethe use of interpreted languages to empower rapid command-line testing andexperimentation.
The most basic AI program is a single If-Then statement, such as ”If A,
38
then B.” If you type an ’A’ letter, the computer will show you a ’B’ letter.Basically, you are teaching a computer to do a task. You input one thing, andthe computer responds with something you told it to do or say. All programshave If-Then logic. A more complex example is if you type in ”Hello.”, and thecomputer responds ”How are you today?” This response is not the computer’sown thought, but rather a line you wrote into the program before. Wheneveryou type in ”Hello.”, the computer always responds ”How are you today?”.It seems as if the computer is alive and thinking to the casual observer, butactually it is an automated response. AI is often a long series of If-Then (orCause and Effect) statements.
A randomizer can be added to this. The randomizer creates two or moreresponse paths. For example, if you type ”Hello”, the computer may respondwith ”How are you today?” or ”Nice weather” or ”Would you like to play agame?” Three responses (or ’thens’) are now possible instead of one. There isan equal chance that any one of the three responses will show. This is similar toa pull-cord talking doll that can respond with a number of sayings. A computerAI program can have thousands of responses to the same input. This makesit less predictable and closer to how a real person would respond, arguablybecause living people respond somewhat unpredictably. When thousands ofinput (”if”) are written in (not just ”Hello.”) and thousands of responses(”then”) are written into the AI program, then the computer can talk (ortype) with most people, if those people know the If statement input lines totype.
Many games, like chess and strategy games, use action responses instead oftyped responses, so that players can play against the computer. Robots withAI brains would use If-Then statements and randomizers to make decisionsand speak. However, the input may be a sensed object in front of the robotinstead of a ”Hello.” line, and the response may be to pick up the objectinstead of a response line.
8.4.7 Chronological History
Historical Antecedents
Greek myths of Hephaestus and Pygmalion incorporate the idea of intelligentrobots. In the 5th century BC, Aristotle invented syllogistic logic, the firstformal deductive reasoning system.
Ramon Llull, Spanish theologian, invented paper ”machines” for discoveringnonmathematical truths through combinattions of words from lists in the 13thcentury. By the 15th century and 16th century, clocks, the first modern mea-suring machines, were first produced using lathes. Clockmakers extended theircraft to creating mechanical animals and other novelties. Rabbi Judah Loew
39

ben Bezalel of Prague is said to have invented the Golem, a clay man broughtto life (1580).
Early in the 17th century, Rene Descartes proposed that bodies of animalsare nothing more than complex machines. Many other 17th century thinkersoffered variations and elaborations of Cartesian mechanism. Thomas Hobbespublished Leviathan, containing a material and combinatorial theory of think-ing. Blaise Pascal created the second mechanical and first digital calculatingmachine (1642). Gottfried Leibniz improved Pascal’s machine, making theStepped Reckoner to do multiplication and division (1673) and evisioned auniversal calculus of reasoning (Alphabet of human thought) by which argu-ments could be decided mechanically.
The 18th century saw a profusion of mechanical toys, including the celebratedmechanical duck of Jacques de Vaucanson and Wolfgang von Kempelen’sphony chessplaying automaton, The Turk (1769).
Mary Shelley published the story of Frankenstein; or the Modern Prometheus(1818).
19th and Early 20th Century
George Boole developed a binary algebra (Boolean algebra) representing (some)”laws of thought.” Charles Babbage and Ada Lovelace worked on programmablemechanical calculating machines.
In the first years of the 20th century Bertrand Russell and Alfred North White-head published Principia Mathematica, which revolutionized formal logic.Russell, Ludwig Wittgenstein, and Rudolf Carnap lead philosophy into log-ical analysis of knowledge. Karel Capek’s play R.U.R. (Rossum’s UniversalRobots)) opens in London (1923). This is the first use of the word ”robot” inEnglish.
Mid 20th century and Early AI
Warren Sturgis McCulloch and Walter Pitts publish ”A Logical Calculus of theIdeas Immanent in Nervous Activity” (1943), laying foundations for artificialneural networks. Arturo Rosenblueth, Norbert Wiener and Julian Bigelow cointhe term ”cybernetics” in a 1943 paper. Wiener’s popular book by that namepublished in 1948. Vannevar Bush published As We May Think (The AtlanticMonthly, July 1945) a prescient vision of the future in which computers assisthumans in many activities.
The man widely acknowledged as the father of computer science, Alan Turing,published ”Computing Machinery and Intelligence” (1950) which introducedthe Turing test as a way of operationalizing a test of intelligent behavior.
40

Claude Shannon published a detailed analysis of chess playing as search (1950).Isaac Asimov published his Three Laws of Robotics (1950).
1956: John McCarthy coined the term ”artificial intelligence” as the topicof the Dartmouth Conference, the first conference devoted to the subject.Demonstration of the first running AI program, the Logic Theorist (LT) writ-ten by Allen Newell, J.C. Shaw and Herbert Simon (Carnegie Institute ofTechnology, now Carnegie Mellon University).
1957: The General Problem Solver (GPS) demonstrated by Newell, Shaw andSimon.
1952-1962: Arthur Samuel (IBM) wrote the first game-playing program, forcheckers (draughts), to achieve sufficient skill to challenge a world champion.Samuel’s machine learning programs were responsible for the high performanceof the checkers player.
1958: John McCarthy (Massachusetts Institute of Technology or MIT) in-vented the Lisp programming language. Herb Gelernter and Nathan Rochester(IBM) described a theorem prover in geometry that exploits a semantic modelof the domain in the form of diagrams of ”typical” cases. Teddington Con-ference on the Mechanization of Thought Processes was held in the UK andamong the papers presented were John McCarthy’s Programs with CommonSense, Oliver Selfridge’s Pandemonium, and Marvin Minsky’s Some Methodsof Heuristic Programming and Artificial Intelligence.
Late 1950s and early 1960s: Margaret Masterman and colleagues at Universityof Cambridge design semantic nets for machine translation.
1961: James Slagle (PhD dissertation, MIT) wrote (in Lisp) the first symbolicintegration program, SAINT, which solved calculus problems at the collegefreshman level.
1962: First industrial robot company, Unimation, founded.
1963: Thomas Evans’ program, ANALOGY, written as part of his PhD workat MIT, demonstrated that computers can solve the same analogy problemsas are given on IQ tests. Edward Feigenbaum and Julian Feldman publishedComputers and Thought, the first collection of articles about artificial intelli-gence.
1964: Danny Bobrow’s dissertation at MIT (technical report from MIT’s AIgroup, Project MAC), shows that computers can understand natural languagewell enough to solve algebra word problems correctly. Bert Raphael’s MITdissertation on the SIR program demonstrates the power of a logical repre-sentation of knowledge for question-answering systems.
41

1965: J. Alan Robinson invented a mechanical proof procedure, the ResolutionMethod, which allowed programs to work efficiently with formal logic as arepresentation language. Joseph Weizenbaum (MIT) built ELIZA (program),an interactive program that carries on a dialogue in English language on anytopic. It was a popular toy at AI centers on the ARPANET when a versionthat ”simulated” the dialogue of a psychotherapist was programmed.
1966: Ross Quillian (PhD dissertation, Carnegie Inst. of Technology, nowCMU) demonstrated semantic nets. First Machine Intelligence workshop atEdinburgh: the first of an influential annual series organized by Donald Michieand others. Negative report on machine translation kills much work in Naturallanguage processing (NLP) for many years.
1967: Dendral program (Edward Feigenbaum, Joshua Lederberg, Bruce Buchanan,Georgia Sutherland at Stanford University) demonstrated to interpret massspectra on organic chemical compounds. First successful knowledge-based pro-gram for scientific reasoning. Joel Moses (PhD work at MIT) demonstratedthe power of symbolic reasoning for integration problems in the Macsymaprogram. First successful knowledge-based program in mathematics. RichardGreenblatt (programmer) at MIT built a knowledge-based chess-playing pro-gram, MacHack, that was good enough to achieve a class-C rating in tourna-ment play.
1968: Marvin Minsky and Seymour Papert publish Perceptrons, demonstratinglimits of simple neural nets.
1969: Stanford Research Institute (SRI): Shakey the Robot, demonstratedcombining animal locomotion, perception and problem solving. Roger Schank(Stanford) defined conceptual dependency model for natural language under-standing. Later developed (in PhD dissertations at Yale University) for use instory understanding by Robert Wilensky and Wendy Lehnert, and for use inunderstanding memory by Janet Kolodner. Yorick Wilks (Stanford) developedthe semantic coherence view of language called Preference Semantics, embod-ied in the first semantics-driven machine translation program, and the basisof many PhD dissertations since such as Bran Boguraev and David Carterat Cambridge. First International Joint Conference on Artificial Intelligence(IJCAI) held at Stanford.
1970: Jaime Carbonell (Sr.) developed SCHOLAR, an interactive program forcomputer assisted instruction based on semantic nets as the representation ofknowledge. Bill Woods described Augmented Transition Networks (ATN’s) asa representation for natural language understanding. Patrick Winston’s PhDprogram, ARCH, at MIT learned concepts from examples in the world ofchildren’s blocks. Early 70’s: Jane Robinson and Don Walker established aninfluential Natural Language Processing group at SRI.
42

1971: Terry Winograd’s PhD thesis (MIT) demonstrated the ability of comput-ers to understand English sentences in a restricted world of children’s blocks,in a coupling of his language understanding program, SHRDLU, with a robotarm that carried out instructions typed in English.
1972: Prolog programming language developed by Alain Colmerauer.
1973: The Assembly Robotics Group at University of Edinburgh builds FreddyRobot, capable of using visual perception to locate and assemble models. TheLighthill report gives a largely negative verdict on AI research in Great Britainand forms the basis for the decision by the British government to discontinesupport for AI research in all but two universities.
1974: Ted Shortliffe’s PhD dissertation on the MYCIN program (Stanford)demonstrated the power of rule-based systems for knowledge representationand inference in the domain of medical diagnosis and therapy. Sometimescalled the first expert system. Earl Sacerdoti developed one of the first plan-ning programs, ABSTRIPS, and developed techniques of hierarchical plan-ning.
1975: Marvin Minsky published his widely-read and influential article onFrames as a representation of knowledge, in which many ideas about schemasand semantic links are brought together. The Meta-Dendral learning programproduced new results in chemistry (some rules of mass spectrometry) the firstscientific discoveries by a computer to be published in a referreed journal.
Mid 70’s: Barbara Grosz (SRI) established limits to traditional AI approachesto discourse modeling. Subsequent work by Grosz, BonnieWebber and Can-dace Sidner developed the notion of ”centering”, used in establishing focus ofdiscourse and anaphoric references in NLP. David Marr and MIT colleaguesdescribe the ”primal sketch” and its role in visual perception.
1976: Douglas Lenat’s AM program (Stanford PhD dissertation) demonstratedthe discovery model (loosely-guided search for interesting conjectures). Ran-dall Davis demonstrated the power of meta-level reasoning in his PhD disser-tation at Stanford.
Late 70’s: Stanford’s SUMEX-AIM resource, headed by Ed Feigenbaum andJoshua Lederberg, demonstrates the power of the ARPAnet for scientific col-laboration.
1978: Tom Mitchell, at Stanford, invented the concept of Version Spaces fordescribing the search space of a concept formation program. Herbert Simonwins the Nobel Prize in Economics for his theory of bounded rationality, oneof the cornerstones of AI known as ”satisficing”. The MOLGEN program,written at Stanford by Mark Stefik and Peter Friedland, demonstrated that
43

an object-oriented programming representation of knowledge can be used toplan gene-cloning experiments.
1979: Bill VanMelle’s PhD dissertation at Stanford demonstrated the gener-ality of MYCIN’s representation of knowledge and style of reasoning in hisEMYCIN program, the model for many commercial expert system ”shells”.Jack Myers and Harry Pople at University of Pittsburgh developed INTERNIST,a knowledge-based medical diagnosis program based on Dr. Myers’ clinicalknowledge. Cordell Green, David Barstow, Elaine Kant and others at Stanforddemonstrated the CHI system for automatic programming. The Stanford Cart,built by Hans Moravec, becomes the first computer-controlled, autonomousvehicle when it successfully traverses a chair-filled room and circumnavigatesthe Stanford AI Lab. Drew McDermott and Jon Doyle at MIT, and John Mc-Carthy at Stanford begin publishing work on nonmonotonic logics and formalaspects of truth maintenance.
1980s: Lisp machines developed and marketed. First expert system shells andcommercial applications.
1980: Lee Erman, Rick Hayes-Roth, Victor Lesser and Raj Reddy publishedthe first description of the blackboard model, as the framework for the HEARSAY-II speech understanding system. First National Conference of the AmericanAssociation for Artificial Intelligence (AAAI) held at Stanford.
1981: Danny Hillis designs the connection machine, a massively parallel archi-tecture that brings new power to AI, and to computation in general. (Laterfounds Thinking Machines, Inc.)
1982: The Fifth Generation Computer Systems project (FGCS), an initiativeby Japan’s Ministry of International Trade and Industry, begun in 1982, to cre-ate a ”fifth generation computer” (see history of computing hardware) whichwas supposed to perform much calculation utilizing massive parallelism.
1983: John Laird and Paul Rosenbloom, working with Allen Newell, completeCMU dissertations on Soar (program). James F. Allen invents the IntervalCalculus, the first widely used formalization of temporal events.
Mid 80’s: Neural Networks become widely used with the Backpropagationalgorithm (first described by Paul Werbos in 1974).
1985: The autonomous drawing program, AARON, created by Harold Cohen,is demonstrated at the AAAI National Conference (based on more than adecade of work, and with subsequent work showing major developments).
1987: Marvin Minsky publishes The Society of Mind, a theoretical descriptionof the mind as a collection of cooperating agents.
44

1989: Dean Pomerleau at CMU creates ALVINN (An Autonomous Land Ve-hicle in a Neural Network), which grew into the system that drove a carcoast-to-coast under computer control for all but about 50 of the 2850 miles.
1990s: Major advances in all areas of AI, with significant demonstrations inmachine learning, intelligent tutoring, case-based reasoning, multi-agent plan-ning, scheduling, uncertain reasoning, data mining, natural language under-standing and translation, vision, virtual reality, games, and other topics. Rod-ney Brooks’ MIT Cog project, with numerous collaborators, makes significantprogress in building a humanoid robot.
Early 90’s: TD-Gammon, a backgammon program written by Gerry Tesauro,demonstrates that reinforcement (learning) is powerful enough to create achampionshiplevel game-playing program by competing favorably with world-class players.
1997: The Deep Blue chess program (IBM) beats the world chess champion,Garry Kasparov, in a widely followed match. First official RoboCup football(soccer) match featuring table-top matches with 40 teams of interacting robotsand over 5000 spectators.
1998: Tim Berners-Lee published his Semantic Web Road map paper [2]. Late90’s: Web crawlers and other AI-based information extraction programs be-come essential in widespread use of the World Wide Web. Demonstration ofan Intelligent room and Emotional Agents at MIT’s AI Lab. Initiation of workon the Oxygen architecture, which connects mobile and stationary computersin an adaptive network.
2000: Interactive robopets (”smart toys”) become commercially available, re-alizing the vision of the 18th century novelty toy makers. Cynthia Breazealat MIT publishes her dissertation on Sociable machines, describing Kismet(robot), with a face that expresses emotions. The Nomad robot explores re-mote regions of Antarctica looking for meteorite samples.
2004: OWL Web Ontology Language W3C Recommendation (10 February2004).
45
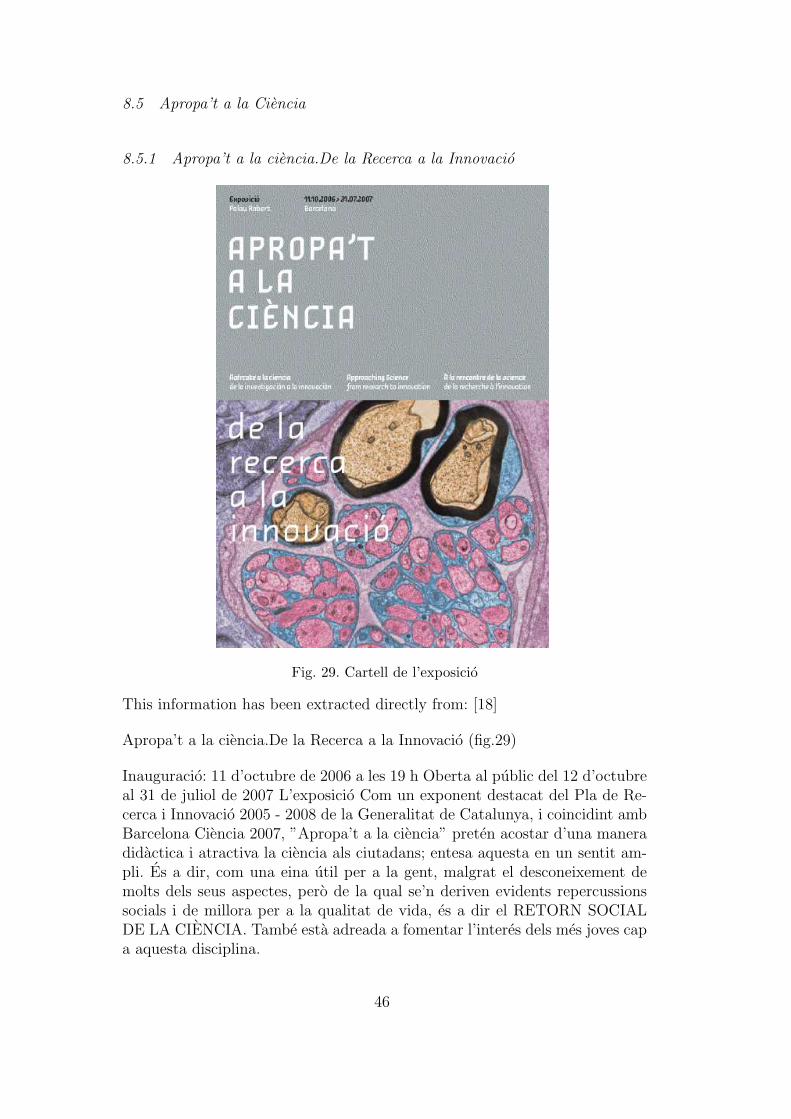
8.5 Apropa’t a la Ciencia
8.5.1 Apropa’t a la ciencia.De la Recerca a la Innovacio
Fig. 29. Cartell de l’exposicio
This information has been extracted directly from: [18]
Apropa’t a la ciencia.De la Recerca a la Innovacio (fig.29)
Inauguracio: 11 d’octubre de 2006 a les 19 h Oberta al public del 12 d’octubreal 31 de juliol de 2007 L’exposicio Com un exponent destacat del Pla de Re-cerca i Innovacio 2005 - 2008 de la Generalitat de Catalunya, i coincidint ambBarcelona Ciencia 2007, ”Apropa’t a la ciencia” preten acostar d’una maneradidactica i atractiva la ciencia als ciutadans; entesa aquesta en un sentit am-pli. Es a dir, com una eina util per a la gent, malgrat el desconeixement demolts dels seus aspectes, pero de la qual se’n deriven evidents repercussionssocials i de millora per a la qualitat de vida, es a dir el RETORN SOCIALDE LA CIENCIA. Tambe esta adreada a fomentar l’interes dels mes joves capa aquesta disciplina.
46

Any de la ciencia Sota el tıtol de Barcelona Ciencia 2007 l’ajuntament deBarcelona commemora el centenari del premi Nobel atorgat a Santiago Ramony Cajal. Engega un ampli programa cultural que posara un accent especial enel vincle entre les ciencies, la cultura i la societat. A mes a mes, el 2007 escommemora tambe el centenari de la creacio de l’Institut d’Estudis Catalansi el de la Junta de Ampliacion de Estudios, institucio precursora del ConsejoSuperior de Investigaciones Cientıficas. Per tal de donar un impuls decisiua la polıtica en relacio amb la promocio de la cultura cientıfica i crear unadefinitiva major sensibilitat social i cultural cap a la ciencia, aquest programacultural anuncia entre les seves lınies concretes d’accio la proposta que l’any2007 sigui declarat ”Any de la Ciencia” a la ciutat de Barcelona. [17]
L’exposicio Apropat a la Ciencia. De la recerca a la innovacio ha estat dis-senyada per donar a coneixer els plans de recerca i desenvolupament impulsatsper la Generalitat de Catalunya per tal de fer veure la relacio entre els coneix-ements cientıfics i la innovacio tecnologica i promoure vocacions cientıfiques.Se’ns ofereix en l’exposicio amb exemples ben concrets i molt suggerents. Enella no se’ns parla de res que recordi el contingut dels llibres de text (potserperque es reconeix de manera implıcita que, si ho fes, seria difıcil l’apropamentdel public que es vol aconseguir), la seva finalitat no es fer comprendre con-ceptes teorics, formules ni equacions. Se’ns presenta, en canvi, una ampliapanoramica de l’activitat cientıfica real, la que es produeix en diversos con-textos i impregna la vida de totes les persones. Per aixo, per la novetat querepresenta i per les noves possibilitats educatives que ofereix, es molt impor-tant donar aquest nou significat, d’empresa collectiva, a la paraula ’ciencia’.
Anem del passat mes remot, de quan encara no hi havia humans sobre la Terrafins a l’avenir incert dels viatges espacials i dels robots. En Pau d’Hostaletsde Pierola ens proporciona una ocasio per a pensar en el lent proces que hadonat lloc a l’emergencia de l’especie humana (una evolucio afortunada dela clavıcula que proporciona noves possibilitats de manipulacio) i la cadiraMares ens fa veure les dificultats d’adaptar un cos que ha de moure’s a lainactivitat forosa en l’interior d’una nau espacial. Els robots ens fan pensar enquines tasques faran en lloc nostre i com fer-les o no fer-les podra afectar lesnostres propies capacitats. S’han ampliat les comunicacions, que connecten elssatellits artificials, tan llunyans, amb els mobils, tan propers. Les intervencionshumanes en el mon son ara d’abast planetari i transformen la Natura, perqueen son part. Les tecnologies per a l’aprofitament de l’energia (els molins devent), per a la conservacio dels aliments, per a prevenir malalties o superar-ned’incurables (les vacunes i els trasplantaments), han de poder arribar a totarreu.. La mostra ocupa fısicament la sala 3 del Palau Robert dividida envuit ambits, a mes dels escenaris un d’entrada i un de sortida, en el primerdels quals es fa una rapida pinzellada a les aportacions realitzades pels granscientıfics de la historia com ara Newton o Curie, entre molts d’altres. Aquestaintroduccio inicial remet al darrer dels apartats de tancament de l’exposicio,
47

tot invitant les generacions futures a prendre el relleu cientıfic.
8.5.2 La robotica i les seves aplicacions socials
Un futur de persones i robots. Tot i que per a la majoria de persones elsrobots son una realitat confinada a les fabriques i a la produccio, el futur de larobotica no passa per les naus industrials. Si l’any 2000 els robots industrialsrepresentaven el 95% dels 6.000 milions de dolars del mercat global de larobotica, es calcula que durant el 2025 no passaran de ser el 20% d’aquestmercat (situat als 65.000 milions de dolars), perdent el seu lideratge en favordels robots personals i de serveis. Els seus usos es distribuiran en tres gransapartats: - En el sector professional, des de l’agricultura a la cirurgia passantpel transport i la construccio. L’aplicacio de la robotica en aquest sector,en el que Europa mante un cert lideratge, constitueix l’evolucio natural de larobotica tradicional i ha de permetre automatitzar processos fins ara exclusiusdels humans durant la seva vida professional. - En el sector domestic, des dela neteja de la casa fins a la cura de la gent gran o dels malalts. Aquestesaplicacions, liderades actualment pels EUA i Corea, faran canviar la imatgedel robot amb forma de ”brac mecanic” que munta el vidre d’un cotxe a lalınia de produccio per un robot, en alguns casos antropomorfic, que conviu iactua a l’entorn domestic de les persones fent tasques de suport a les persones.- El sector de l’oci i l’entreteniment, des de les joguines robotitzades fins alsentrenadors personals d’algun esport. Aquest sector, liderat pel Japo, es jauna realitat amb una gran capacitat de creixement que pot fins i tot superarals jocs d’ordinador.
A l’exposicio veurem el robot AIBO (fig.30) i les possibilitats que un progra-mari especial te per a les persones amb discapacitats, persones grans, etc.
48

Fig. 30. Stand de la fira
49