generation y students perception of packaging and pricing
TRANSCRIPT

University of Arkansas, FayettevilleScholarWorks@UARKGeneral Human Environmental SciencesUndergraduate Honors Theses General Human Environmental Sciences
5-2013
Generation Y Students Perception of Packagingand Pricing of Arkansas WinesKatie GillespieUniversity of Arkansas, Fayetteville
Follow this and additional works at: http://scholarworks.uark.edu/ghesuht
This Thesis is brought to you for free and open access by the General Human Environmental Sciences at ScholarWorks@UARK. It has been acceptedfor inclusion in General Human Environmental Sciences Undergraduate Honors Theses by an authorized administrator of ScholarWorks@UARK. Formore information, please contact [email protected].
Recommended CitationGillespie, Katie, "Generation Y Students Perception of Packaging and Pricing of Arkansas Wines" (2013). General HumanEnvironmental Sciences Undergraduate Honors Theses. 1.http://scholarworks.uark.edu/ghesuht/1
brought to you by COREView metadata, citation and similar papers at core.ac.uk
provided by ScholarWorks@UARK

Gillespie 1
Generation Y Students Perception of Packaging and Pricing of Arkansas Wines
KATIE GILLESPIE
ALLEN POWELL
DR. ROBERT HARRINGTON
DR. KELLY WAY
Abstract
The objective of this research focuses on “Generation Y students perceptions of
packaging and pricing of Arkansas wines”. A thirteen-question quantitative survey was given to
200 Generation Y students at a mid-south land-grant university student union. The questions
focused on consumers’ preferences on labeling, packaging, and pricing of Arkansas wines. This
research is important to the state’s wineries success with implication on product satisfaction,
perceived quality, and price value. Generation Y prefers the glass bottle with the traditional cork
and description of the wine. Majority of Generation Y would spend $10 to $15 on a 750 ml of
Arkansas wine.
KEYWORDS wine pricing, wine packaging, label, design
Introduction
This study is important because of the limited studies that specifically focus on Arkansas
wines concerning Generation Y. The objective focuses on Generation Y preferences on
packaging and pricing of Arkansas wine. This research was constructed through a thirteen
question quantitative survey at a mid-south land-grant university student union. The results were
compiled through the International Business Machines Corporation (IBM) SPSS version 20
statistics program. This paper is organized as: Arkansas tourism, Generation Y, marketing,

Gillespie 2
pricing, packaging and labeling. The research focuses on: What does Generation Y think the
appropriate price range is for a 750 ml bottle of Arkansas wine? What type of packaging does
Generation Y prefer for the wine product? What kind of design labeling does Generation Y
prefer? What color layout does Generation Y prefer on the wine bottle’s label?
Arkansas Tourism
The Bureau of Economic Analysis (BEA) has defined travel and tourism as “the
economic activity generated by inside of the United States of America by ‘visitors’ of either
business or pleasure that are considered residents and nonresidents, and visitors outside of the
United States” (Wilkerson, 2003). The employment rate of travel and tourism varies from across
the states. Unfortunately, Arkansas has one of the lowest shares of travel and tourism
employment at only 2% of the USA (Wilkerson, 2003).
The wineries are an important aspect of any states’ tourism industry. Some examples
include the retail sales that impact the local economy by: increase economic development,
enhance regional cuisine, and generates local tax dollars. According to the Jefferson County’s
annual report in 2003, $95 million was spent in travel expenditures. In Arkansas, the hospitality
field contributes to 1,340 jobs and about $18 million annually in payroll (Anonymous, 2005).
Generation Y
In 2008, the United States of America ranked third in the world’s total wine consumption.
The growth of the total wine consumption is at a constant rate. The main reason for the recent
growth of wine consumption is in the intake of wine by the early adulthood of Generation Y
(Hussain, M., Cholette, S., & Castaldi, R., 2007). The top three reasons why Generation Y drinks
Gillespie 3
wine is because: they enjoy the taste of the wine, wine pairing, and for relaxation. Also, this
generation has the largest purchasing power compared to the other generations in the United
States. The USA’s annual income of wine sales is $211 billion (Henley, C. D., Fowler, D. C.,
Jingxue (Jessica) Yuan, Stout, B. L., & Goh, B. K., 2011).
Every generation has specific values that lead to different behaviors (Mueller, S., Hervé
Remaud, & Chabin, Y., 2011). According to Chrysochou (Krystallis, Mocanu, & Lewis, (2012),
Generation Y could become the consumer segment that is able to fuel the wine consumption
growth in the coming future. Chrysochou et al. (2012) states, there is not an exact age group
classification for this generation. Most researchers agree that Generation Y begins at the years of
1978 to 2003. The age range is from 9 years to 34 years old. There are about 76 million people in
Generation Y.
Generation Y is considered technology savvy compared to the previous generation
known as Generation X. The reasoning behind this is because Generation Y has learned how to
operate computers at an early age. Ninety percent of Generation Y is known to be dependent on
the Internet. Generation Y is considered to more educated, affluent, and ethnically diverse
compared to the past generations (Chrysochou, P., Krystallis, A., Mocanu, A., & Lewis, R. L.,
2012).
Since Generation Y is known to be dependent on the Internet, they are more likely to
relate to the mass media of advertising. Also, they are likely to respond to mass media, and buy
products from a company that uses mass media to their advantage in marketing. Generation Y is
more acceptable towards positive brands as long as the products are at a fair price point. They are
also more oriented towards the quality value in a product than a product that is oriented towards
quantity value (Chrysochou, P., Krystallis, A., Mocanu, A., & Lewis, R. L., 2012).

Gillespie 4
Generation Y are more open to suggestions from other people who are more
knowledgeable than they are on products. The reason why is because they are influenced by their
family and friends when deciding on which product to buy. They are also more likely to ask for
recommendations from retail clerks about their products compared to past generations. However,
they tend to buy their wines at grocery stores and purchase wine online due to convenience
(Chrysochou, P., Krystallis, A., Mocanu, A., & Lewis, R. L., 2012).
Generation Y is slowly increasing their monthly purchases of wine. One study shows that
45% of this generation will buy wine at least once a month or less. Twenty-seven percent will
buy wine two to three times per month, and 27% will buy wine more than once a week. Also,
thirty-five percent of their wine purchases were at a liquor store, and 22% were at a grocery
store. Eighteen percent of the wine purchases were at a wine shop, and 11% were in restaurants.
The lowest percentage was 10% of wine purchases at wineries (Chrysochou, P., Krystallis, A.,
Mocanu, A., & Lewis, R. L., 2012). It seems that there are variations of this generation’s
purchase of wine, during various times of the month as well as to where they purchase their
wine.
Marketing
"If we can understand how consumers choose wine, then we have a much better
framework to decide pricing, packaging, distribution, advertising, and merchandising strategies"
(Lockshin, L., 2003). Marketing is an important aspect to invest time and money in order to
increase income from sales. Wine producers need to have a good strategy on wine marketing
and promotions in order to increase or maintain market shares, sales, and to sustain customer
interest in their products (Henley et al., 2011).

Gillespie 5
Research shows that consumers who buy regional brands of wine will have a higher
perceived knowledge of wine (Atkin, T., & Johnson, R., 2010). Over the years, the USA wine
market has an increase in the demand market, but they are still losing domestically in market
share. The reason why is due to foreign competition of wine products and an unstable
environment. The United States wineries need to adapt to a stronger market orientation in order
to their meet consumers’ requirements of the wineries wine products. They need to have a
understanding of their potential customers’ habits and needs (Hussain, M., Cholette, S., &
Castaldi, R., 2007).
Marketing in the wine business usually presents different types of products and product
attributes of consideration when the consumer is making a decision to purchase a wine product
(Mueller, S., Hervé Remaud, & Chabin, Y., 2011). Marketing is an important aspect in the wine
industry for local wineries when designing and promoting wine products (Barth, S. & Salazar, J.,
2010).
Another aspect to consider in the marketing field is the marketing channel. There are
three important marketing channels: the wholesale, retail sales, and consumer direct (Barth, S.
and Salazar, J., 2010). Also, it is important to differentiate a product because you want
consumer’s to pick your product over your competitors. Particularly, since the wine market is an
international business. This is especially true in the European wineries due to their prestigious
reputation to consumers. United States wineries are starting to invest in marketing on their wine
products to consumers in order to not lose their national business to the international competition
(Atkin, T., & Johnson, R., 2010).
The key advantage of cost and quality of wine is the understanding of the retailer’s
current and potential customers. In addition, the wineries also should concentrate on the potential

Gillespie 6
customer’s needs and desires of wines. The wineries also need to concentrate on their customers
by focusing on who their customers are, consumer motivations for consuming wine, how
consumers make purchasing decisions about wine, how to create a pleasant experience, and how
to convert sporadic consumers into loyal customers (Hussain, M., Cholette, S., & Castaldi, R.,
2007).
One researcher suggested the geographical location of wine production could be
influential of consumers buying into a local wine product because the new local wineries may
not have a strong brand image with consumers. This is due to consumer’s association with the
location of the winery and the quality of the wine (Atkin, T., & Johnson, R., 2010).
Pricing
For most wine consumers, it can be confusing to purchase wine due to the complexity of
the wine market. There are five areas of resistance to consumer adaption of new products. They
are: usage barriers, value barriers, risk barriers, tradition barriers, and image barriers. These
barriers become pertinent when consumers are buying a product due to being uncertain about the
physical, economic, functional, or the social risks from using a product. The major motivation
for wine purchases decisions are: risks to consumers, brands, label, and price. Other risks
include, the product familiarity and knowledge, and the product-use situation (Atkin, T., &
Johnson, R., 2010).
According to Henley, et al. (2011), research indicates that the average price of wine for
the household is $17.16, and as a gift is $21.69 per bottle. This research is based on a national
level and not individual state level.

Gillespie 7
Another study analyses a standardized model with price as a dependent variable and
personality traits as independent variables. This confirms that price expectations of consumers
are related to perceptions of wine personality. The more creativity and sophistication in the
packaging and quality of the product, the higher priced the product. The formula of Price =
0:233 Sophistication - 0:087 Excitement + 0:031 Ruggedness + 0:011 Competence - Sincerity +
0:055 Creativity (Heslop, A., Cray, D., & Armenakyan, A., 2009).
Past research has also suggested that more experienced wine consumers tend to buy wine
at specialty wine shops. While less experienced wine consumers tend to purchase low cost wines
in a large volume at discounted shops, indicating that price is part of the consumers’ important
decision-making process. Consumers usually use price as an indicator to reduce the risk within
the purchase decision, supporting the theory of why most people purchase well-known brands in
wine. Also, research indicates the number one decision-making reason for selecting wine in a
retail store is prior wine tasting experience (Barth, S. & Salazar, J., 2010).
Atkin et al. (2010) showed that “brand” is an important aspect when spending less than
$15 on a 750 ml bottle of wine. The region of the wine where it was produced was an important
aspect for those spending over $15. Consumer’s spending more money want to know more about
the wine product compared to the consumer’s who spend less.
In addition, consumers are becoming more knowledgeable about wine, so they may not
consistently purchase wine based on the expense of the wine alone. One study shows that 49% of
the more knowledgeable wine consumers have not bought wine over $15 in the last six months.
This demonstrates that wineries limit themselves to selling wine over $10, losing sales from
regular wine drinkers and more knowledgeable consumers (Hussain, M., Cholette, S., &
Castaldi, R., 2007).

Gillespie 8
One model estimates the demand for wine are:
“Casesijt =. _B0 . B1 Priceijt .+ B2 Incomejt +.X_Tt .X” “where Casesijt represents the number of cases of wine of type i (color or varietal) sold in
month j and year t ; Priceijt represents the price of wine type i , sold in month j and year t ;
Incomejt represents per capita disposable income in month j and year t ; X is a vector of
bottle price prices of wine for color or varietals j 6. i ; andTt represents the fixed effect for
year t (Cuellar, S. S., Colgan, T., Hunnicutt, H., & Ransom, G., 2010).”
The equation of the model shows the concerns and indicates the presence of similarity
between the price per bottle of wine and the number of cases sold. This shows that endogeneity
can be cored by using grape prices as an instrument for wine prices (Cuellar, S. S., Colgan, T.,
Hunnicutt, H., & Ransom, G., 2010).
Packaging
The three key concepts that are important for consumers when purchasing wine are:
imagery, layout, and color. The wine industry shows that labeling is relevant to the buyer’s
decision-making process when purchasing wine (Boudreaux, C., & Palmer, S., 2007). Also, the
color, shape, and size of the package are factors of the consumer’s process of purchasing wine
(Rocchi, B., & Stefani, G., 2006). Packaging plays an important role in the wine market because
it provides information on the wine product and the manufacture’s promise to the consumers
(Thomas, A., & G. P., 2003).
The four key design elements for packaging are: brand logo, brand name, front label
information, and the back label information. Also, there are four main key elements that focus on
the information located on the label. This includes: taste information, price information,

Gillespie 9
information about the wine producer, and suggested food pairings (Henley, et al., 2011). Atkin,
T., & Johnson, R., (2010) stated that packaging is crucial to the consumer’s approval of product
because this is the last opportunity for retailer’s to correspond and influence the buyers to
purchase their product.
The consumer looks at different types of packaging of the wine before making a decision.
Glass wine bottles are the most common type of packaging. Over the past few decades, other
semi-rigid packaging structures have also started to gain acceptance for packaging of wine in
various marketplaces, including bag-in-box (BIB) and multilayer plastic bottles. BIB packaging
represents one of the most significant changes in the packaging of wine because it offers
improved distribution efficiency, enhanced end-use convenience, and increased cost-
effectiveness (Fu, Y., Lim, L., & McNicholas, P., 2009).
Another important aspect of packaging is the type of closure on the wine product. The
natural cork is expensive to produce due to the harvesting of a certain type of wood. Most
companies avoid using natural wood corks because it saves companies money, and appeases to
the customers who are concerned about the environment. Corks can not be reused because the
cork will absorb the wine. (Pfefferkorn, B., & Reiter, V., 1976). The plastic stoppers are
inexpensive to produce and recyclable. Unfortunately, the plastic stoppers are hazardous during
shipping because the amount pressure from the wine bottle (Lopes, P., Saucier, C., Tessedre, P.,
& Glories, Y., 2006).
Labeling
It is important to have a good and lasting appearance on the label. The labeling has to fit
the package of the wine product. Also the size, shape, and label proportions have to correlate

Gillespie 10
with the product (Rocchi, B., & Stefani, G., 2006). The wine producer needs to have labeling on
the front of the bottle because it will acquire the consumer’s interest on the wine. Usually, the
front label includes: grape type, alcohol content, vintage year, and the product’s name of the
vineyard or company (Mueller, S., Hervé Remaud, & Chabin, Y., 2011).
Consumers often face a challenge when selecting a bottle of wine. Their decision is based
on: the type of packaging, labeling of the wine product, and the their knowledge on wines.
Inexperienced wine purchasers usually base their decision on the wine’s label. Thomas (2003)
states, “Consumers may decide to make their wine choice primarily on the basis of the objective
characteristics (appearing on the label of the wine bottle).” The characteristics include: color,
shape, and front labels as part of the consumer decision-making.
Information is key to influence consumers to purchase a product. The purchasing
behavior can influence consumers by the information that is presented, and the way that
information is processed. The information about the winery on the wine product helps the
consumer to reduce their risk or uncertainty about the wine. Some risks involved in the
purchasing decisions are: the taste of the wine, social influence, financial aspect, and the physical
influence. In order for the consumers to contradict these risks when purchasing a product, they
look for: information, brand loyal, trusting a well-known brand, and use pricing as an indicator
(Thomas, A., & G. P., 2003).
The type of font on the wine labeling is an important aspect to the manufactures. The key
points includes: features, benefits, and the surrogates. The positioning of the wine label
information is an important feature to focus on when designing the wine product. The seven
positioning statements of the information on the product’s front and back label consist of:
attributes, nonpareil, parentage, manufacture, end user, end use, and endorsements. The emphasis
Gillespie 11
of the positioning on the information label is the parentage. The descriptions of the information
of seven components are:
attributes are the features or benefits of a wine. The information describes the
character of the wine in terms of how it appears, smells, or tastes.
nonpareil a reflection of quality in that the products are without equal, unrivalled
or unique.
parentage this reflects the history, the history of the growing region or the history
of the wine maker.
manufacture this is how the product was made including sub-categories of
process, ingredients, and design.
target-end user this identifies who the product was made for in terms of a person
type.
target-end use the identification of the types of situations or end uses for which
the product was made for.
endorsements this highlights expert opinions or the recognition of awards and
medals.
The seven aspects of the positioning statements are important to recognize and utilized when
designing the label of the wine product (Thomas, A., & G. P., 2003).
According to Thomas (Thomas, A., & G. P., 2003), research shows that there was no
significant difference in preference on the label based on: gender, age, and household income.
However, the front label had differences on the preference of the label based on the level of
education and the type of wine. The top three levels of importance on the label’s information
were: wine company, wine brand name, and expert opinions or mention of awards/metals. The

Gillespie 12
three least importance of the label’s information were: type of person the wine would appeal,
type of situation, and unique, unrivalled wine.
The back labeling of the wine were seen as: interesting, provide useful information, and
receive variable use in the purchase decisions. Also, the back label information was found to be
favored more than the front label (Thomas, A., & G. P., 2003).
The words on the label need to have a certain amount of space in order to attract and
interest the consumer. If wine producers have the right amount of space on their label; then the
consumers are more likely to think that the wine producers put more care into their product. If
the wine producers have less spacing of words on their product; then consumers are going to
think that the wine producers did not put enough effort into making their product. On the other
hand, if the wine producers have too much spacing of words on their product, then consumers are
going to think that the wine producers are trying too hard to attract their attention along with
making the product look cheap (Rocchi, B., & Stefani, G., 2006).
The Purpose of The Study
The objective of this research focuses on “Generation Y students perceptions of
packaging and pricing of Arkansas wines”. The student conducted a thirteen-question
quantitative survey at a mid-south land-grant university student union. The questions focused on
Generation Y’s preferences on labeling, packaging, and pricing of Arkansas wines. This research
is important to the State’s wineries including: product satisfaction, perceived quality, and price
value.

Gillespie 13
Methodology
Data Collection
This quantitative survey focused on Generation Y perceptions of labeling, packaging, and
pricing of Arkansas wines. The survey was developed by talking to local wineries and
researching past academic journals. The survey was administered from August 20, 2012 to
August 22, 2012 at a mid-south land-grant university student union. Seven Arkansas wine
products were displayed while participants completed the survey. Participants completed a 13-
question survey in about 5 minutes from 10:30 a.m. until 2:30 p.m. Two questions focused on
demographic information while 11 questions focused on labeling, packaging, and pricing of
Arkansas wine. No incentives were given to any participants for completing the survey. Two-
hundred Generation Y people completed the survey. (See Appendix 1).
Results
Data Analysis
The data from the surveys were compiled by using an IBM SPSS statistics system. The
analysis data was used in a frequency format.

Gillespie 14
(Fig. 1)
Fifty-five percent of the participants who completed the survey were from in-state, 42.5%
are from out-of-state while 2.5% are international.
(Table 1)
Participant Consumption Of Arkansas Wines
Frequency Percent Valid Percent Cumulative Percent
Valid
No 66 33.0 33.0 33.0
Yes 134 67.0 67.0 100.0
Total 200 100.0 100.0
Sixty-seven percent of the participants had consumed Arkansas wine while 33% had not
consumed Arkansas wine.
0% 10% 20% 30% 40% 50% 60%
In-state
Out-state
International
Hometown
Hometown

Gillespie 15
(Table 2)
Participant Gender
Frequency Percent Valid Percent Cumulative Percent
Valid
Male 81 40.5 40.9 40.9
Female 117 58.5 59.1 100.0
Total 198 99.0 100.0
Missing System 2 1.0
Total 200 100.0
There were 58.5% females and 40.5% males that completed the survey. One percent of
the people did not answer the question.

Gillespie 16
(Table 3)
Participant Age
Frequency Percent Valid Percent Cumulative Percent
Valid
21 to 23 135 67.5 68.2 68.2
24 to 26 25 12.5 12.6 80.8
27 to 29 20 10.0 10.1 90.9
30 to 32 18 9.0 9.1 100.0
Total 198 99.0 100.0
Missing System 2 1.0
Total 200 100.0
(Fig. 2)
The compiled data shows that out of 200 participants, 67.5% people were in the age
group of 21 to 23, 12.5% people in the age group of 24 to 26, 10% people in the age group of 27
to 29, and 9% people who are in the age group of 30 to 32. One percent of the people did not
0.00% 10.00% 20.00% 30.00% 40.00% 50.00% 60.00% 70.00% 80.00%
21 to 23
24 to 26
27 to 29
30 to 32
Participant Age - Percentage
Age Division

Gillespie 17
answer the question. According to the survey, the majority of people in the age division were
between 21 to 23 years old. The least amount of people in the age division is between 30 to 32
year old.
(Table 4)
Participant Color Label Layout Preferences
Frequency Percent Valid Percent Cumulative Percent
Valid
One color 32 16.0 16.1 16.1
Two colors 57 28.5 28.6 44.7
Multicolor 95 47.5 47.7 92.5
Black & White 15 7.5 7.5 100.0
Total 199 99.5 100.0
Missing System 1 .5
Total 200 100.0
Out of 200 participants, 16% preferred the one color layout, 28.5% preferred two-color
layout, 47.5% preferred the multicolor layout, and 7.5% preferred the black and white color
layout. One percent of the people did not answer the question. The majority of the participants
preferred the multicolor layout for the bottle of wine, while the black and white layout was the
least preferred.

Gillespie 18
(Table 5)
Most Recognized Label Layout
Frequency Percent Valid Percent Cumulative Percent
Valid
Symbols 52 26.0 26.3 26.3
Brand Name 41 20.5 20.7 47.0
Colors 55 27.5 27.8 74.7
Font Style 50 25.0 25.3 100.0
Total 198 99.0 100.0
Missing System 2 1.0
Total 200 100.0
Out of 200 participants, 26% said symbols on the labeling caught their attention to the
product, 20.5% said brand name caught their attention to the product, 27.5% said colors on the
bottle caught their attention to the product, and 25% said font style caught their attention to the
product. One percent of the people did not answer the question.
Gillespie 19
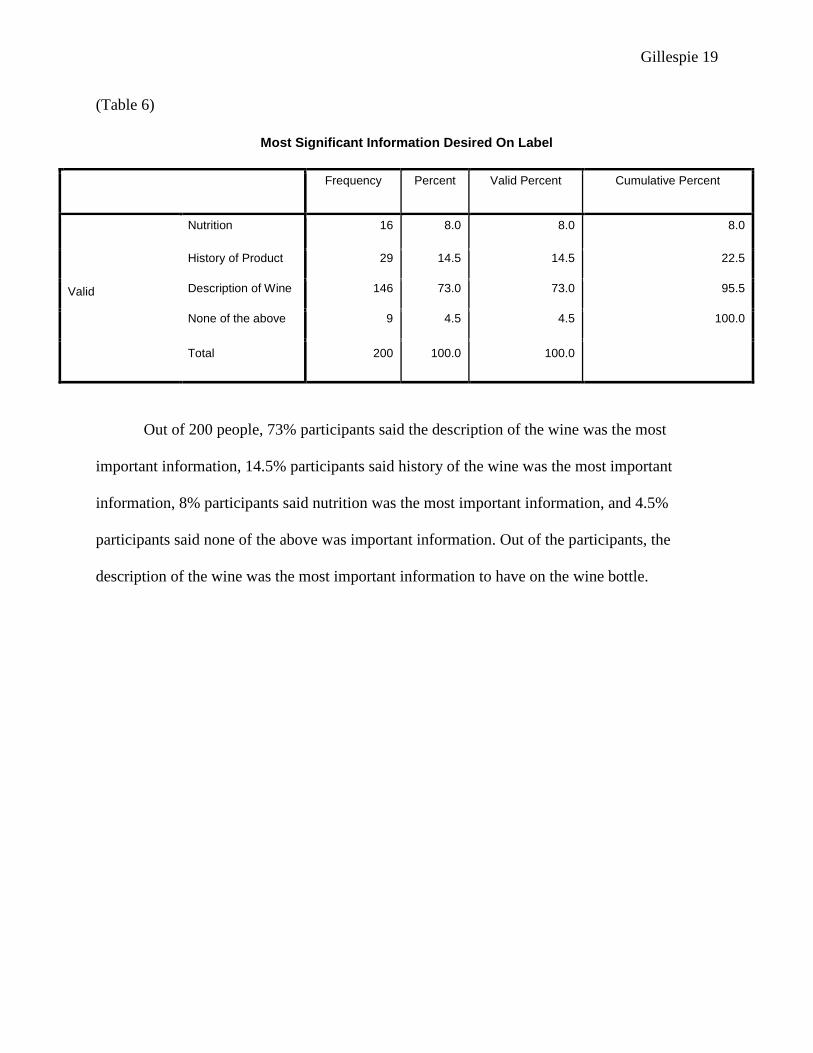
(Table 6)
Most Significant Information Desired On Label
Frequency Percent Valid Percent Cumulative Percent
Valid
Nutrition 16 8.0 8.0 8.0
History of Product 29 14.5 14.5 22.5
Description of Wine 146 73.0 73.0 95.5
None of the above 9 4.5 4.5 100.0
Total 200 100.0 100.0
Out of 200 people, 73% participants said the description of the wine was the most
important information, 14.5% participants said history of the wine was the most important
information, 8% participants said nutrition was the most important information, and 4.5%
participants said none of the above was important information. Out of the participants, the
description of the wine was the most important information to have on the wine bottle.

Gillespie 20
(Table 7)
Most Desirable Font
Frequency Percent Valid Percent Cumulative Percent
Valid
Bold Font 29 14.5 14.6 14.6
Cursive Font 116 58.0 58.3 72.9
Block Font 33 16.5 16.6 89.4
Other 21 10.5 10.6 100.0
Total 199 99.5 100.0
Missing System 1 .5
Total 200 100.0
Out of 200 participants, 58% participants said that they preferred the cursive font, 16.5%
participants said that they preferred the block font, 14.5% participants said that they preferred the
bold font, and 10.5% participants said they preferred other fonts. The majority of the participants
preferred the cursive font on the wine bottle.
(Table 8)
Most Desirable Packaging
Frequency Percent Valid Percent Cumulative Percent
Valid
Boxed 12 6.0 6.0 6.0
Glass Bottle 183 91.5 91.5 97.5
Plastic Bottle 3 1.5 1.5 99.0
Other 2 1.0 1.0 100.0
Total 200 100.0 100.0

Gillespie 21
Out of 200 participants, 91.5% participants preferred the glass bottle, 6% participants
preferred the boxed wine, 1.5% participants preferred the plastic wine bottle, and 1% preferred
other types of packaging of wine.
(Table 9)
Most Desirable Closure
Frequency Percent Valid Percent Cumulative Percent
Valid
Traditional Cork 162 81.0 81.8 81.8
Plastic Closure 8 4.0 4.0 85.9
Metal screw tips 28 14.0 14.1 100.0
Total 198 99.0 100.0
Missing System 2 1.0
Total 200 100.0
Out of 200 participants, 81% of the participants preferred the traditional cork, 14%
participants preferred the metal screw tops, and 4% participants preferred the plastic closure.
One percent of the people did not answer the question

Gillespie 22
(Table 10)
Price Point Related to 750ml Bottle of Arkansas Wine
Frequency Percent Valid Percent Cumulative Percent
Valid
Under $10 30 15.0 15.2 15.2
$10-$15 94 47.0 47.7 62.9
$15-$20 61 30.5 31.0 93.9
Over $20 12 6.0 6.1 100.0
Total 197 98.5 100.0
Missing System 3 1.5
Total 200 100.0
Out of 200 participants, 47% participants said that they would spend $10 to $15 on a 750
ml bottle of Arkansas wine, 30.5% participants would spend $15 to $20 on a 750 ml bottle of
Arkansas wine, 15% participants would spend under $10 on a 750 ml bottle of wine, and 6%
would spend over $20 on a 750 ml bottle of Arkansas wine.

Gillespie 23
(Fig. 3)
Comparison of Age to Spending on Arkansas Wine
In each age group of Generation Y, most of the participants would spend $10 to $15 on a
750ml bottle of Arkansas wine. The most diverse age group on the spending price for Arkansas
wine was the age of 21 to 23 years old.
0.00% 10.00% 20.00% 30.00% 40.00% 50.00% 60.00%
Under $10
$10 to $15
$15 to $20
Over $20
Age 30 to 32
Age 27 to 29
Age 24 to 26
Age 21 to 23
Gillespie 24
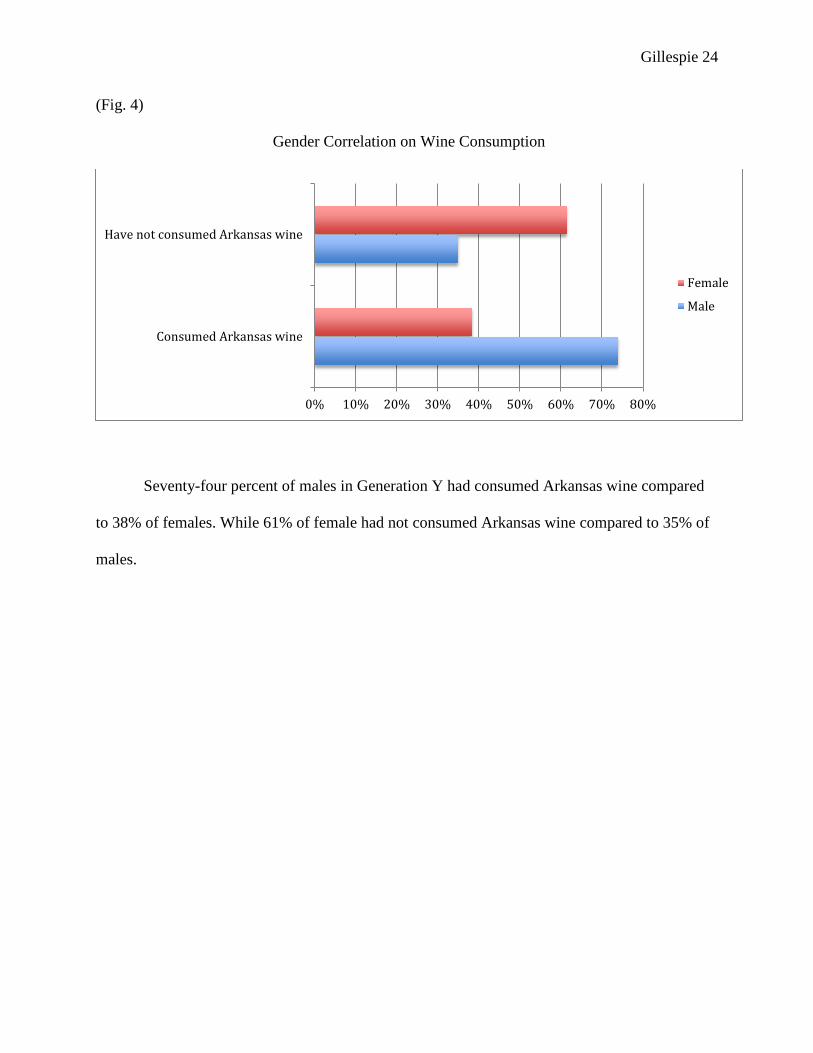
(Fig. 4)
Gender Correlation on Wine Consumption
Seventy-four percent of males in Generation Y had consumed Arkansas wine compared
to 38% of females. While 61% of female had not consumed Arkansas wine compared to 35% of
males.
0% 10% 20% 30% 40% 50% 60% 70% 80%
Consumed Arkansas wine
Have not consumed Arkansas wine
Female
Male

Gillespie 25
Conclusion
There were several reasons why people selected the $10 to $15 price range of Arkansas
wine. The most important reason to spend money on wine is the value, quality, and budget. This
information was found from answering the following question: Why would you spend a certain
amount of money on a 750 ml bottle of Arkansas wine? Consumers are becoming more value
conscious when selecting their wine. Inexpensive wine does not necessarily mean the quality of
wine is unsatisfactory. In order to maximize wine sales, the price has to match the value and
quality of the product (Horowitz, I., & Lockshin, L., 2002).
The most important information listed on a wine product is to have the description of the
wine. Generation Y wine consumers look for more descriptions on the wine bottle due to their
limited wine knowledge. The Arkansas wineries need to have the description of the wine in order
to accommodate their needs. The majority of Generation Y preferred the traditional cork
enclosures due to the classic look of the bottle. Generation Y preferred the glass wine bottles due
to the traditional style of most wine bottles. Generation Y preferred the cursive font due to giving
the label a more sophisticated look. According to the research, 26% said symbols on the labeling
caught their attention to the product, 20.5% said brand name caught their attention to the product,
27.5% said colors on the bottle caught their attention to the product, and 25% said font style
caught their attention to the product. Overall, there doesn’t seem to be one type of style of
labeling that stands out to Generation Y. The wineries need to have a symbol, their brand name,
font style, and color to maintain Generation Y’s attention to their product. Also, the majority of
women have not consumed Arkansas wine, whereas, majority of males have consumed Arkansas
wine. The local wineries should focus on women consumers in order to increase awareness of
their products, therefore, increasing wine sales. The wineries could hold events that would attract

Gillespie 26
women to purchase wine. Also, they could make their product more attractive to women to
purchase by adding color to the labeling of the package.
Majority of the participants preferred the multicolor label layout. This could be due Generation Y being young, inexperienced wine consumers, and overall appearance of the wine
bottle. Generation Y prefers the cursive font. This could be due to the font making the label look
more sophisticated and makes the bottle look like old world wine.
The majority of Generation Y would spend $10 to $15 on a bottle of 750 ml of Arkansas
wine. This could be due to being a younger generation that does not have a lot of experience of
purchasing, may have budget constraints, and perceived value of Arkansas wine.
Discussion and Implications
Future studies should focus on the concept of environmental friendly wine products. Past
studies have shown that Generation Y is more aware of the environment than previous
generations (Ainsworth, S. J., 2009). Local wineries should focus on going green by recycling
their materials and encouraging consumers to recycle their purchased product. The wineries
should have a recycling program at their retail stores to promote awareness. Also, they should
offer discounts to consumers’ in order to enhance their brand image, save money on packaging,
and receive state tax incentives. This in turn may give wineries a competitive advantage.
According to the research, the majority of Generation Y prefers the glass bottle.
However, the wineries should use plastic bottles instead of glass because breakage would be
minimized, recycling would be easier on the consumers, and wineries may save money.
Producing plastic bottles is more cost efficient than glass bottles.

Gillespie 27
The wineries should use plastic closures instead of traditional cork because it reduces the
amount of trees being used for corks, more cost efficient, and to recycle plastic materials.
Traditional corks are not recyclable due to the absorption of the wine within the cork.
Another concept local wineries should focus on is the blending of wines. The process of
blending wines is becoming more popular to consumers because of the uniqueness of flavor. The
blending of the wine can be considered more of an art form than science. In order to have a
successful blending of wines, this relies on sensory evaluation of the consumer. The key to have
a successful blend of wine is to have similar wine qualities (Dooley, L., Threlfall, R., &
Meullenet, J., 2012). The Arkansas wineries can differentiate by having more unique blending of
wines from imported grapes.
In order to obtain a competitive advantage, local wineries should attend national and
regional wine conventions promoting their products to consumers and retailers. This may
enhance awareness of their product to consumers, increase networking and marketing
opportunities, and enhance national reputation.
One of the limitations to the study includes the predominant age group of 21-23 years
old. According to the research, 67.5% people were in the age group of 21 to 23, 12.5% people in
the age group of 24 to 26, 10% people in the age group of 27 to 29, and 9% people who are in
the age group of 30 to 32. This is due to the location of the survey being at a mid-south land-
grant university student union. To overcome this limitation, surveys would be conducted at
liquor stores, restaurants, and night clubs. Also, students may fill out the surveys in classrooms
to extend the data collection to 300 participants.
Another limitation includes some participants were confused about the question
pertaining to closures, packaging, and labeling. To overcome that limitation, place pictures of

Gillespie 28
different closures, packaging, and labeling on the table layout while the participants took the
survey.

Gillespie 29
Appendix
1. Have you consumed Arkansas wine before? a. Yes b. No 2. Which color layout do you prefer? a. One color b. Two colors c. Multicolor d. Black & White 3. Which design of labeling catches your attention to the product? a. Symbols b. Brand Name c. Colors d. Font Style 4. Which is the most important to have listed on the wine product? a. Nutrition b. History of Product c. Description of Wine d. None of the above 5. Which style of font do you prefer? a. Bold Font b. Cursive Font c. BLOCK Font d. Other 6. Which type of packaging do you prefer for wine? a. Boxed b. Glass bottle c. Plastic bottle d. Other please explain: _____ 7. Which type of closure do you prefer on wine bottles? a. Wooden cork b. Plastic closure c. Metal screw tops d. Other ________________ 8. How much would you spend on a 750 ml bottle of Arkansas wine? a. Under $10 b. $10 - $15 c. $15 - $20 d. Over $20 9. Please explain reasoning? ________________________ 10. Have you been to a winery before? a. Yes b. No 11. Which age division are you? a. 21-23 b. 24-26 c. 27-29 d. 30-32 12. Which gender are you: a. Male b. Female 13. What is your hometown? _____________________________

Gillespie 30
References
Ainsworth, S. J. (2009). Courting generation Y. Chemical & Engineering News, 87(44), 53.
Retrieved from http://0-search.proquest.com.library.uark.edu/docview/222744114?
accountid=8361
Anonymous. (2005). Tourism plays significant role in Pine Bluff’s economy. Arkansas Business,
12 (22), 5. Retrieved from http://proquest.umi.com/pqdweb?did=814401961&Fmt=3
&clientId=13929&RQT=309&VName=PQD
Atkin, T., & Johnson, R. (2010). Appellation as an indicator of quality. International Journal
of Wine Business Research, 22(1), 42-61.doi:http://dx.doi.org/10.1108/17511061011035
198
Barth, S. & Salazar, J. (2010) "Wine Tourism and Consumer Behaviors Related to Wine
Purchases," Journal of Tourism Insights. Retrieved from http://scholarworks.gvsu.edu
/jti/vol1/iss1/2
Boudreaux, C., & Palmer, S. (2007). A charming little Cabernet effects of wine label design on
purchase intent and brand personality. International Journal of Wine Business Research, 1
9(3), 170-186. Retrieved from http://www.emeraldinsight.com/journ
als.htm?articleid=1621877.
Chrysochou, P., Krystallis, A., Mocanu, A., & Lewis, R. L. (2012). Generation Y preferences for
wine. British Food Journal, 114(4), 516-528. doi:http://dx.doi.org/
10.1108/00070701211219531
Cuellar, S. S., Colgan, T., Hunnicutt, H., & Ransom, G. (2010). The demand for wine in the
USA. International Journal of Wine Business Research, 22(2), 178-190. doi: http://
dx.doi.org/10.1108/17511061011061739

Gillespie 31
Dooley, L., Threlfall, R., & Meullenet, J. (2012). Optimization of blended wine quality
through maximization of consumer liking. Food Quality and Preference. 24(1), 40-
47. Retrieved from http://www.sciencedirect.com/science/article/pii/S09503293
11001819.
Fu, Y., Lim, L., & McNicholas, P. (2009). Changes on enological parameters of White Wine
packaged in Bag-in-Box during secondary shelf life. Journal of Food Science, 74(8),
608-618. Retrieved from http://0onlinelibrary.Wiley.com.library.uark
.edu/doi/10.1111/j.1750-3841.2009.01316.x/pdf.
Henley, C. D., Fowler, D. C., Jingxue (Jessica) Yuan, Stout, B. L., & Goh, B. K. (2011). Label
design: Impact on millennials' perceptions of wine. International Journal of Wine
Business Research, 23(1), 7-20. doi:http://dx.doi.org/
10.1108/17511061111121371
Heslop, A., Cray, D., & Armenakyan, A. (2009). Cue incongruity in wine personality
formation and purchasing. International Journal of Wine Business Research, 22(3) 288-
307. Retrieved from http://0www.emeraldinsight.com.library.uark.
edu/journals.htm?issn=1751- 1062&volume=22&issue=3&aricleid=1881320&show
html.
Horowitz, I., & Lockshin, L. (2002). What price quality? an investigation into the prediction of
wine-quality ratings. Journal of Wine Research, 13(1), 7-22. Retrieved from http://0-
search.proquest.com.library.uark.edu/docview/216797015?accountid=8361
Hussain, M., Cholette, S., & Castaldi, R. (2007). Determinants of wine consumption of US
consumers: An econometric analysis. International Journal of Wine Business Research,
19(1), 49-62. doi: http://dx.doi.org/10.1108/17511060710740343

Gillespie 32
Lockshin, L. (2003), "Consumer purchasing behavior for wine: what we know and where we are
going", Marchés et Marketing du Vin, Bordeaux École de Management, Août, n57-03.
Lopes, P., Saucier, C., Tessedre, P., & Glories, Y. (2006). Impact of storage on oxygen ingress
through different closures into wine bottles. J. Agric. Food Chem., 54(18) 6741-6746.
Retrieved from http://0-pubs.acs.org.library.uark.edu/doi/pdf/10.1021/jf0614239.
Mueller, S., Hervé Remaud, & Chabin, Y. (2011). How strong and generalisable is the generation Y effect? A cross-cultural study for wine. International Journal of Wine Business Research, 23(2), 125-144. doi: http://dx.doi.org/10.1108/17511061111142990 Pfefferkorn, B., & Reiter, V. (1976). Bottle stopper means for wine bottles. Patents. Retrieved
from http://0-www.google.com.library.uark.edu/patents?hl=en&lr=&vid=USPAT399
5762&id=MI44AAAAEBAJ&oi=fnd&dq=Bottle+stopper+ means+for+wine+bottles&
printsec=abstract#v=onepage&q&f=false.
Rocchi, B., & Stefani, G. (2006). Consumers' perception of wine packaging: A case study.
International Journal of Wine Marketing, 18(1), 33-44. Retrieved from http://0-s
search.proquest.com.library.uark.edu/docview/235113349?accountid=8361
Thomas, A., & G. P. (2003). The importance of wine label information. International Journal of
Wine Marketing, 15(2), 58-74. Retrieved from http://0search.proquest.com.library.uark.edu
/docview/235112246?accountid=8361
Wilkerson, C. (2003). Travel and tourism: An overlooked industry in the U.S. and tenth district.
Economic Review - Federal Reserve Bank of Kansas City, 88(3), 45-71. Retrieved from
http://0-search.proquest.com. library.uark.edu/docview/218486463?accountid=8361