generation of dna barcodes in indian mottled eel (anguilla...
TRANSCRIPT

Generation of DNA barcodes in Indian mottled EEL (AnguillaBengalensis): A threatened ichthyofauna of Assam, IndiaShamim Rahman1*, Ellora Barua2, Jitendra K Choudhury3, Amalesh Du a4 andMohan C Kalita1
1Department of Biotechnology, Gauha University, Guwaha 781014, Assam, India.2,3Department of Zoology, North Gauha College, Guwaha 781031, Assam, India.4Department of Zoology, Gauha University, Guwaha 781014, Assam, India.
*Corresponding author: [email protected]
Paper No. 342 Received: 8 August 2014 Accepted: 21 August 2015
Abstract
Eels have always been a source of fascination because of their charismatic shape and size. They aregood source of animal protein and bear high food values. Dwindling population of eels has meanwhileled certain species to IUCN threatened categories. In spite of these, scientifi c investigations on the onlyspecies of this genus, Anguilla bengalensis, in this region have not been reported much. Many biologicalquestions of the catadromous fi sh are still unanswered. Quick but authentic identifi cation of threatenedspecies is vital to unveil such query and frame out conservation and management strategies. DNAbarcodes utilising partial mitochondrial cytochrome c oxidase I gene and nuclear rhodopsin genewere developed in this current study. Conventional taxonomic information has also been includedcontemplating inevitable role of it in unambiguous species level discrimination. The study has generatednovel barcode of the species from this region to decipher implications on congeneric and conspecifi cdivergence.
Highlights
● Generation of mt-COI DNA barcode● Generation of nuclear rhodopsin gene DNA barcode● Taxonomic review of Anguilla bengalensis
Keywords: DNA-Barcoding, threatened fi sh, eel, Anguiila bengalensis
Fish is an integral part of socio economic fabric ofthe state of Assam which is part of biodiversityhot-spot. Anguillids and other eel shaped fi shspecies of Assam bear high market price and manya times more compatible than carps. A few Anguillaspecies are introduced in aquaculture in countrieslike Japan (Leander et al. 2012). Ege (1939), Castleand Williamson (1974) and Watanabe et al. (2009)
mentioned sixteen species of the genus Anguilla(Aoyama 2009). Eels are found in the tropical,subtropical and temperate parts of the globe and notavailable at South Atlantic and the west coasts of Northand South America (Aoyama 2009). At present FISH-BOL has enlisted eighteen species of genus Anguilla,viz., Anguilla anguilla, Anguilla australis, Anguillabengalensis, Anguilla bicolor, Anguilla borneensis,
International Journal of Agriculture, Environment and BiotechnologyCitation: IJAEB: 8(3): 511-519 September 2015DOI Number: 10.5958/2230-732X.2015.00058.3
©2015 New Delhi Publishers. All rights reserved GENETICS AND PLANT BREEDING

512
Rahman et al.
Anguilla celebesensis, Anguilla dieff enbachii, Anguillainterioris, Anguilla japonica, Anguilla luzonensis,Anguilla malgumora, Anguilla marmorata, Anguillamegastoma, Anguilla mossambica, Anguilla nebulosa,Anguilla obscura, Anguilla reinhardtii and Anguillarostrata. Among these, Anguilla bengalensis is theonly species of genus Anguilla in Assam. In additionto its high market price, the species plays role intraditional therapeutics in Assam and neighbouringstates in treatment of burn injury (Rahman et al.2014). The mucous of Anguilla bengalensis is reportedto be used in arthritis in combination of rice or wheatfl our (Arunachalam, M. and Sankaranarayanan, A.2000). Observation of intraspecifi c variation createstwo sub species of Anguilla bengalensis. The nativein this region is the Anguilla bengalensis bengalensis(Indian Mo led Eel) and Anguilla bengalensis labiata(Peter 1852) is the African Mo led Eel (IUCN 2015).The fi rst systematic comprehensive study on genusAnguilla was carried out by Ege (1939), followed byWatanabe (2001).
Eels have always been a source for human interestfor their interesting shape and size (Leander et al.2012). They are the source of good food values indiff erent part of the globe. Moreover, there are manyunanswered facts to be resolved on eels (Leander etal. 2012). Tropical eels migrate shorter distances, incontrast to European eels those show long distancemigration. Tropical eels with short migrationhabits are considered to be the basal group thatgave rise to long distance migration of Europeaneels (Aoyama 2009). Facultative catadromy, i.e. eelsremain in estuary or move back and forth betweenfreshwater and estuary has also been observed inmany eels (Tsukamoto and Arai 2001). The onlyspecies of this genus, Anguilla bengalensis in thisregion has not obtained much a ention towardsscientifi c exploration. In most of the classical workson Anguillids in the world, position of Anguillabengalensis seems to be ambiguous due to eithernon inclusion in the investigation or use of doubtfulsynonyms. In addition mere use of morphologywill be insuffi cient in identifi cation of eels atdiff erent life stages (Aoyama 2009). Identifi cationthrough protein profi ling in closely related species
is diffi cult as their proteins contain similar kinds ofconstituents (Bartle and Davidson 1991), (Smith etal. 1996). DNA based techniques independent of celltype and age has grown as choice for researchers infi sh identifi cation (Davidson 1998), (Bossier 1999),(Lockley and Bardsley 2000).
DNA barcoding has been proved to be a successfulmode in error free identifi cation specially in case ofanimals utilising mitochondrial partial cytochromec oxidase subunit I gene (COI), nearer to its 5' end(Hebert et al. 2003). In popular term ‘barcode’ isknown as some codes in the form of bars to give aunique identity to a product. The cardinal objectiveof barcode is the easy and quick investigation ofany product in the midst of lot. In simple term, itis the nucleotide diff erences between sequences,whereby, a gap of diff erence is always foundfunctional between individuals of diff erent speciesin comparison to individuals of the same species. Thegap is referred as ‘barcode gap’ and is considered as‘threshold value’ for species discrimination. DNAbarcoding is not to wipe out traditional methods. Onthe contrary, DNA barcoding is a complementaryapproach to conventional taxonomy for providingindications towards phylogenetics and populationgenetics (Hajibabaei et al. 2007). Mitochondrial genesare considered as good choice (Kochzius 2009),(Teletchea 2009) for fi sh identifi cation due to highcopy numbers of mtDNA in cells and consequentlyhigh probability of DNA recovery (Hubert et al. 2008),maternally inherited nature giving rise to rare or norecombination (Sangthong and Jondeung 2003). Theadvantage over selecting COI gene is the universalprimers for this gene are very robust, enablingrecovery of its 5΄end from the representatives, mostlyin case of animals. Moreover, COI appears to possessa greater range of phylogenetic signal than any othermitochondrial genes. Its third position nucleotideshows a high incidence of base substitutions, leadingto a rate of molecular evolution that is about threetimes greater than that of 12S or 16 rDNA (Ghosh2012). However, simultaneous use of two genes hasalso been advocated by researchers to make gooduse of DNA barcoding in fi sh (Sevilla et al. 2007).

Generation of DNA Barcodes in Indian Mottled EEL (Anguilla Bengalensis): A Threatened Ichthyofauna of Assam
513
Fig. 1: Anguilla bengalensis
Fig. 3: Radiographic image of Anguilla bengalensis
Total genomic DNA was isolated from white muscletissue following the procedure developed by Milleret al. (1988) with minor alterations. Genomic DNA,so obtained, was passed through quantitative andqualitative checking using 0.8% agarose gel in horizontalelectrophoresis. Partial mitochondrial cytochromec oxidase I (COI) and nuclear rhodopsin gene wereamplifi ed using genomic DNA as template in polymerasechain reactions (PCR). Sets of universal primers, viz. FishF1: 5ʹ-TCAACCAACCACAAAGACATTGGCAC-3ʹ andFishR1: 5ʹ-TAGACTTCTGGGTGGCCAAAGAATCA-
Materials and Methods
Fish samples were collected from various locationsof Assam and Assam-Meghalaya border zones withthe aid of fi shermen. The sampling stations with theircoordinates are given in Table: 1. Diagnostic keys(Vishwanath et al. 2007) were used in identifyingthe fi sh and morphometric measurements wereconsidered following Ege (1939). Radiographic imageof the fi sh were taken for vertebrae reckoning. Beforepreservation of the specimen, small amount of tissue(white muscle) was kept in -20°C for short period oftime or in 100% ethanol for long term preservation.
Table 1. Sampling stations with coordinates
Fig. 2: Schematic representation of important bodymeasurements used in Anguilla bengalensis
514
Rahman et al.
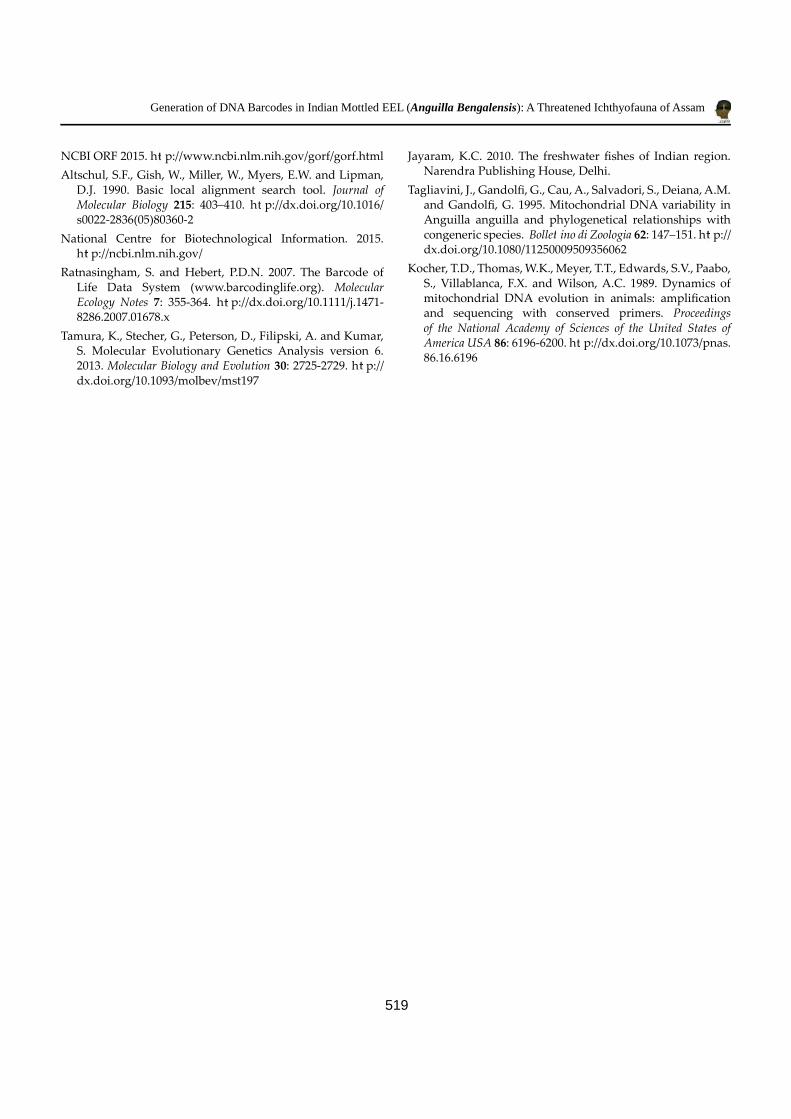
3ʹ, were used in amplifi cation of 669bp COI gene (Wardet al. 2004) and RodF2W: 5ʹ-AGCAACTTCCGCTTCGGTGAGAA-3ʹ and Rod4Rn: 5ʹ-GGAACTGCTTGTTCATGCAGATGTAGAT-3ʹ were used in amplifi cation of447 bp nuclear rhodopsin gene (Sevillaet al.2007). Both thegenes were amplifi ed in 25 l reaction mixture containing1X PCR buffer, 2mM MgCl
2, 10 pmol each primer, 1mM
dNTPs and 1U Taq polymerase (New England Biolabs)in case of COI amplifi cation and 1X PCR buffer, 2.5 mMMgCl
2, 0.4 mM dNTPs and 1 U Taq DNA polymerase.
1l DNA was used as template with concentration at 50-100 ng/l for COI and 20-30 ng/l for rhodopsin. Thethermal conditions for polymerase chain reactions were asfollows: an initial denaturation at 95°C for 2 minutes, 35cycles at denaturation temperature of 95°C for 30 seconds,annealing temperature of 55°C for 30 seconds andextension temperature of 68°C for 1 minute and concludedwith a fi nal extension step at 68°C for 10 minutes followedby a hold at 4°C for COI and an initial denaturation at95°C for 4 minutes, 40 cycles at denaturation temperatureof 95°C for 30 seconds, annealing temperature of 60°Cfor 30 seconds and extension temperature of 72°C for 45seconds and concluded with a fi nal extension step at 72°Cfor 8 minutes for rhodopsin.
The amplifi ed PCR products were analysed in 1% agarosegel containing ethidium bromide (10mg/ml) and singleband was obtained without non specifi c amplifi cation.PCR products were purifi ed using HiMedia PCR productpurifi cation kit and sequenced commercially on bothdirection.
All the COI PCR products and their subsequentsequences are more than 600 bp and this indicatesthat there is no NUMT sequence; because vertebratesNUMTs are typically smaller than 600 bp. Rawsequences were edited by trimming noisy terminalsand contig was obtained from bi directionalsequences in so ware BIOEDIT (Hall, 1999). Noinsertion/deletion (indel) was observed either insequence replications or in BLASTN use of NationalCentre for Biotechnology Information (NCBI).
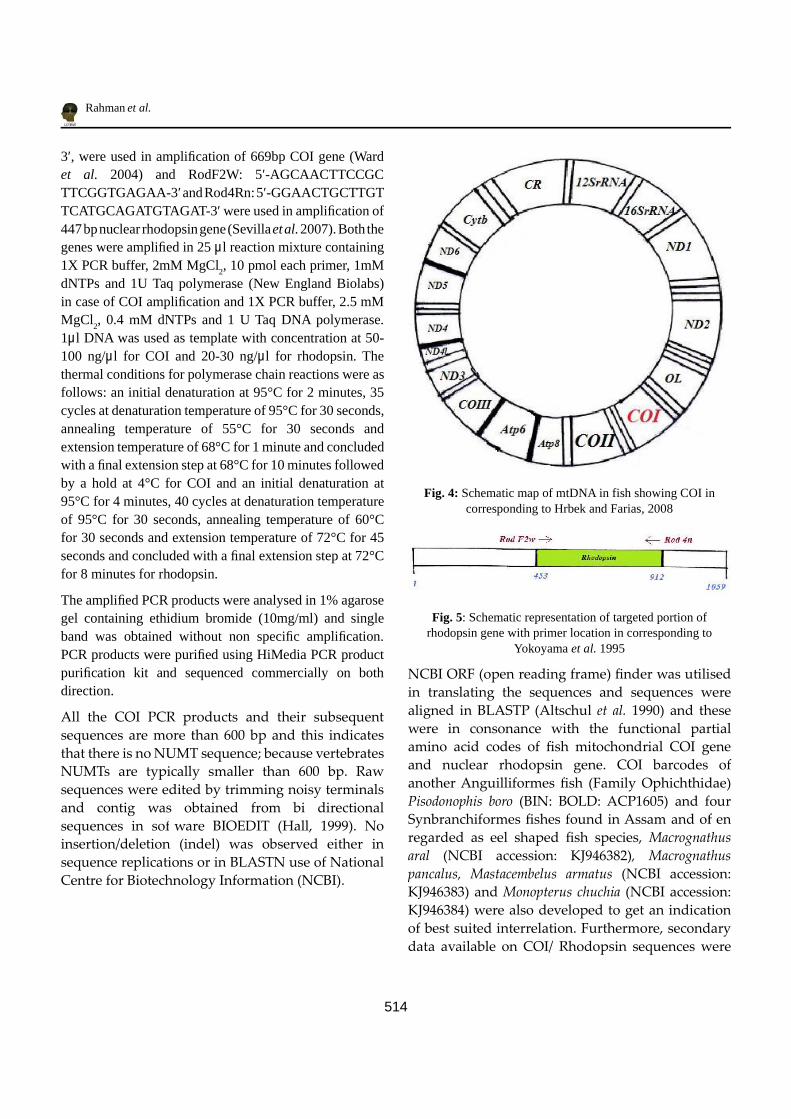
Fig. 4: Schematic map of mtDNA in fish showing COI incorresponding to Hrbek and Farias, 2008
Fig. 5: Schematic representation of targeted portion ofrhodopsin gene with primer location in corresponding to
Yokoyama et al. 1995
NCBI ORF (open reading frame) fi nder was utilisedin translating the sequences and sequences werealigned in BLASTP (Altschul et al. 1990) and thesewere in consonance with the functional partialamino acid codes of fi sh mitochondrial COI geneand nuclear rhodopsin gene. COI barcodes ofanother Anguilliformes fi sh (Family Ophichthidae)Pisodonophis boro (BIN: BOLD: ACP1605) and fourSynbranchiformes fi shes found in Assam and o enregarded as eel shaped fi sh species, Macrognathusaral (NCBI accession: KJ946382), Macrognathuspancalus, Mastacembelus armatus (NCBI accession:KJ946383) and Monopterus chuchia (NCBI accession:KJ946384) were also developed to get an indicationof best suited interrelation. Furthermore, secondarydata available on COI/ Rhodopsin sequences were

Generation of DNA Barcodes in Indian Mottled EEL (Anguilla Bengalensis): A Threatened Ichthyofauna of Assam
515
obtained from National Centre for BiotechnologicalInformation (NCBI) and Barcode of Life Database(BOLD). These primary and secondary informationhave been utilised in determination of congenericand conspecifi c genetic divergences using Kimura2-parameter distance model with Anguilla bengalensis(NCBI accession: KP982886) and Neighbor Joiningtrees were created using so ware MEGA version 6(Tamura et al. 2013)
Results and Discussion
Taxonomic Review
Muraena bengalensis Gray, 1831
Anguilla nebulosa nebulosa McClelland, 1844: unclearsynonym (Ege, 1939)
Anguilla anguilla Kulkarni and Ranade, 1974
Anguilla bengalensis Day, 1878
Current Valid Scientifi c Name: Anguilla bengalensis
Gray, 1831
Vernacular: Nadal Bami, in Assamese
Fin formula: D 250-305; A 220-250; P 18
Phylum: Chordata
Class: Actinopterygii
Order: Anguilliformes
Family: Anguillidae
Genus: Anguilla
Species: bengalensis
Diagnosis (Vishwanath, 2007) (Jayaram, 2010)
Body elongated, cylindrical, abdomen rounded,head long and compressed, dorsal and anal fi ncontinuous around tail, lips thick, villiform teeth onjaws and palate, dorsal fi n inserted nearer anus thangill opening, body colour variegated yellow-oliveover brown markings, vertebrae 106-112.
(A) (B)
Fig. 6. 1% Agarose gel image of PCR products. A: M-100bp DNA ladder, 1-5 COI, 6 negative control.
B: M-100 bp DNA ladder, 1-4 Rhodopsin, 5 negative control.

516
Rahman et al.
Table 2: Average body measurements in terms of percentageof Total Length with standard deviations
Measurements Mean (% of Total Length) with SDStandard Length 97.25 ±0.77
Head Length 12.92 ±0.53
Body Depth 7.64±1.39
Pre Dorsal Length 31.05 ±1.39
Pre Anal Length 44.19 ±2.58
Ano-dorsal length 13.11 ±1.48
Genetic divergence analysis using Kimura2-parameter model based on COI gene sequenceshowed less conspecifi c divergence (0.024) incomparison to other Anguillliformes (0.164) andSynbranchiformes (0.212 with Macrognathuspancalus, 0.144 with Monopterus cuchia, 0.247 withMastacembelus armatus and 0.252 with Macrognathusaral). The neighbour joining tree prepared on the basisof developed COI barcodes and barcodes availableon BOLD database revealed close conspecifi c clusterof Anguilla bengalensis with congeners viz. Anguillanebulosa (0.012 K2P genetic divergence).
Fig. 7: Neighbour-joining (NJ) tree developed using K2Pdistance among primary (marked) and secondary COI gene
sequences
Fig. 8: Neighbour-joining (NJ) tree developed using K2P distance among primary (marked) and secondary Rodopsin gene sequences

Generation of DNA Barcodes in Indian Mottled EEL (Anguilla Bengalensis): A Threatened Ichthyofauna of Assam
517
On the other hand distinct grouping has beenobserved with other cogeners. The genetic divergenceanalysis on the basis of rhodopsin gene sequence wasfound limited because of the paucity of sequenceinformation in public databases.
There is plethora of fi sh species from India’sNortheast declining from Earth even before theirproper scientifi c documentation. In case of Anguillabengalensis, being no exception, the research scenariois in nascent stage, specially in terms of molecularcharacterization. More number of sequenceinformation from this region would reveal newerinformation to the scientifi c community. In thisstudy, novel DNA barcodes from this region aredeveloped in Anguilla bengalensis in complementaryto conventional taxonomy realising inevitable roleof traditional taxonomy in resolving species leveldiscrimination. Ano-dorasal length in relation tototal length (ADL%TL) had played an important rolein species diff erentiation across the genus Anguilla.ADL%TL obtained in this study (13.11%) showedobvious distinction with congeners; 10.03% inAnguilla japonica, 0.43% in Anguilla bicolour pacifi ca,15.57% in Anguilla marmorata and 10.30% in Anguillacelebesensis (Leander et al. 2012).
COI barcode of Anguilla bengalensis from this part ofthe world would complement earlier mitochondriabased studies on genus Anguilla (Tagliavini etal. 1995). Close cluster with A. nebulosa providesan indication of use of synonyms in consonancewith A. bengalensis in past records (Aoyama 2009).Lesser genetic divergence between A. bengalensisand A. nebulosa in comparison to conspecifi cgenetic divergence of A. bengalensis asserts thesaid statement. Moreover, less genetic divergencebetween A. bengalensis bengalensis and A. bengalensislabiata (0.016) and between A. bengalensis labiataand A. nebulosa nebulosa (0.004) advocates need oftaxonomic review of these Anguillids incorporatingnewly generated sequences. Authentic identifi cationof freshwater eels and their phylogenetic analysiswould remain inconclusive till morphological andmolecular characterisations are put together acrossthe Anguillids all over the globe. Generation of
DNA barcodes through this study would plug thevoids of database to hammer out interrelationsamong the species. Development of rhodopsingene based barcode in Anguilla bengalensis wouldbroaden the use of multigene to make results moreconclusive. This also generates information suchas nucleotide frequencies (A= 25.9%, G= 18.1%, C=26.9%, T= 29.1% for COI) and (A= 18.6%, 23.7%, C=32&, T= 25.7% for rhodopsin). Diff erent organismsshow diff erent pa ern of nucleotide composition,GC content and substitutions bias. Mitochondrialgenomes show profound shi in nucleotide usageand GC content and can have serious impacton phylogenetic analysis. Therefore, it is indeedimportant to analyse GC content and substitutionalbias for reference in evolutionary history (Tamuraet al. 2013). Through sequence characterisation, itwould be possible to follow gene frequency changesin course of time using both old museum specimensand current representatives of a population (Kocheret al. 1989). Besides the inherent benefi t of DNAbarcoding in tagging species, this would createbaseline information on molecular characterizationto decipher some indication on phylogeneticsignifi cance of this species. The outcome of the studymay be of good use for conservationists and fi eldbiologists as a whole.
Acknowledgment
We do sincerely acknowledge Department ofBiotechnology, Government of India sponsoredInstitutional Biotech Hub of Gauhati Universityand North Gauhati College and Department ofBiotechnology and Department of Zoology, GauhatiUniversity for providing infrastructure facility tocarry out the research.
ReferencesLeander, N.J., Shen, K.N., Chen, R.T. and Tzeng, W.N.
2012. Species Composition and Seasonal Occurrence ofRecruiting Glass Eels (Anguilla spp.) in the HsiukuluanRiver, Eastern Taiwan. Zoological Studies 51(1): 59-71.
Aoyama, Jun. 2009. Life History and Evolution of Migrationin Catadromous Eels (Genus Anguilla). Aqua-BioScienceMonographs 2(1): 1–42. h p://dx.doi.org/10.5047/absm.2009.00201.0001

518
Rahman et al.
Fish barcode of life. 2015. www.fi shbol.orgRahman, S., Choudhury, J.K., Du a, A. and Kalita, M.C.
2014. Eel Ichthyofauna of Assam in folklore therapeuticpractices. International Journal of Interdisciplinary andMultidisciplinary Studies. 1(5): 273-276.
Arunachalam, M. and Sankaranarayanan, A. 2000. Someeconomically important and cultivable in Gadana river,western Ghats, In A.G. Ponniah and A. Gopalakrishnan(eds.) Endemic fi sh diversity of Western Ghats. NBFGR-NATP Publication. National Bureau of Fish Genetic Resources,Lucknow. 244-246.
The IUCN Red List of Threatened Species. 2015. h p://www.iucnredlist.org
Ege, V. 1939. A revision of the genus Anguilla Shaw. DanaRep. 16: 8–256.
Watanabe, S. 2001. Taxonomic study of the freshwater eel, thegenus Anguilla, Schrank 1798. Thesis Ph.D. University ofTokyo.
Tsukamoto, K. and Arai, T. 2001. Facultative catadromy of theeel Anguilla japonica between freshwater and seawaterhabitats. Marine Ecology Progress Series 220: 265–276. h p://dx.doi.org/10.3354/meps220265
Bartle , S.E. and Davidson, W.S. 1991. Identifi cation ofThunnus tuna species by the polymerase chain reactionand direct sequence analysis of their mitochondrialcytochrome b genes. Canadian Journal of Fisheries andAquatic Sciences. 48: 309-317. h p://dx.doi.org/10.1139/f91-043
Smith, P. J., Roberts, C.D., McVeagh, S.M. and Benson, P.G.1996. Genetic evidence for two species of tarakihi. Teleostei:Cheilodactylidae: Nemadactylus in New Zealand waters.New Zealand Journal of Marine and Freshwater Research. 30:209-220. h p://dx.doi.org/10.1080/00288330.1996.9516709
Davidson, W.S. 1998. PCR techniques. In PR Ashurst and MJDennis (eds.). Analytical methods of food authentication.Blackie Academic and Professional, London. 182-203.
Bossier, P. 1999. Authentication of seafood products by DNApa erns. Journal of Food Science. 64: 189-193. h p://dx.doi.org/10.1111/j.1365-2621.1999.tb15862.x
Lockley, A.K. and Bardsley, R.G. 2000. DNA-based methodsfor food authentication. Trends Food Science and Technology11: 67-77. h p://dx.doi.org/10.1016/s0924-2244(00)00049-2
Hebert, P.D.N., Cywinska, A., Ball, S.L. and deWaard, J.R.2003. Biological identifi cation through DNA barcodes.Proc. R.Soc.Lond.B. 270: 313–321. h p://dx.doi.org/10.1098/rspb.2002.2218
Hajibabaei, M., Singer, G.A.C., Hebert, P.D.N. and Hickey,D.A. 2007. DNA barcoding: how it complements taxonomy,molecular phylogenetics and population genetics. Trendsin genetics. 23(4): 167–172. h p://dx.doi.org/10.1016/j.tig.2007.02.001
Kochzius, M. 2009. Trends in fi shery genetics. In BeamishRJ and BJ Rothschild (eds). The future of fi sheries sciencein North America. The Netherlands: Fish and Fisheries.Springer 31: 453-493. h p://dx.doi.org/10.1007/978-1-4020-9210-7_24
Teletchea, F. 2009. Molecular identifi cation methods of fi shspecies: reassessment and possible applications. Reviewin Fish Biology and Fisheries 19: 265-293. h p://dx.doi.org/10.1007/s11160-009-9107-4
Hubert, N., Torrico, J.P., Bonhomme, F. and Renno, J.F. 2008.Species polyphyly and mtDNA introgression amongthree Serrasalmus sister-species. Molecular Phylogeneticsand Evolution 46: 375-381. h p://dx.doi.org/10.1016/j.ympev.2007.04.002
Sangthong, P. and Jondeung, A. 2003. Cloning and nucleotidesequence of four tRNA genes in mitochondrial genome ofThai walking catfi sh (Clarias macrocephalus) KasetsartJournal Natural Science 37: 33-40.
Ghosh, S.K. 2012. A text book on DNA barcoding. Booksspace, Kolkata.
Sevilla, R.G., Diez, A., Norén, M., Mouchel, O., Jérôme, M.,Verrez-Bagnis, V., Pelt, H.V., Favre-Krey, L. and Krey, G.2007. The FishTrace Consortium, Bautista, J.M. Primers andpolymerase chain reaction conditions for DNA barcodingteleost fi sh based on the mitochondrial cytochrome b andnuclear rhodopsin genes. Molecular Ecology Notes. 7(5):730-734. h p://dx.doi.org/10.1111/j.1471-8286.2007.01863.x
Vishwanath, W., Lakra, W.S. and Sarkar, U.K. 2007. Fishesof North East India. National Bureau of Fish GeneticResoures, Lucknow.
Miller, S.A., Dykes, D.D. and Polesky, H.F. 1988. A simplesalting out procedure for extracting DNA from humannucleated cells. Nucleic Acid Research. 16(3):1215. h p://dx.doi.org/10.1093/nar/16.3.1215
Ward, R.D., Zemlak, T.S., Innes, B.H., Last, P.R. and Hebert,P.D.N. 2004. DNA barcoding Australian fi sh species.Philosophical Transactions Royal Society B. 360: 1847–1857.h p://dx.doi.org/10.1098/rstb.2005.1716
Hall, T.A. 1999. BioEdit: a user-friendly biological sequencealignment editor and analysis program for Windows95/98/NT. Nucleic Acids Symposium Series 41: 95-98.
h p://blast.ncbi.nlm.nih.gov/Blast.Hrbek, T. and Farias, I.P. 2008. The complete mitochondrial
genome of the pirarucu (Arapaima gigas, Arapaimidae,Osteoglossiformes). Genetics and Molecular Biology 31(1):293-302. h p://dx.doi.org/10.1590/s1415-47572008000200024
Yokoyama, R., Knox, B.E. and Yokoyama, S. 1995. Rhodopsinfrom the fi sh, Astyanax: role of tyrosine 261 in the red shi .Invest. Ophthalmology and Visual Science 36: 939–945.
Generation of DNA Barcodes in Indian Mottled EEL (Anguilla Bengalensis): A Threatened Ichthyofauna of Assam
519
NCBI ORF 2015. h p://www.ncbi.nlm.nih.gov/gorf/gorf.htmlAltschul, S.F., Gish, W., Miller, W., Myers, E.W. and Lipman,
D.J. 1990. Basic local alignment search tool. Journal ofMolecular Biology 215: 403–410. h p://dx.doi.org/10.1016/s0022-2836(05)80360-2
National Centre for Biotechnological Information. 2015.h p://ncbi.nlm.nih.gov/
Ratnasingham, S. and Hebert, P.D.N. 2007. The Barcode ofLife Data System (www.barcodinglife.org). MolecularEcology Notes 7: 355-364. h p://dx.doi.org/10.1111/j.1471-8286.2007.01678.x
Tamura, K., Stecher, G., Peterson, D., Filipski, A. and Kumar,S. Molecular Evolutionary Genetics Analysis version 6.2013. Molecular Biology and Evolution 30: 2725-2729. h p://dx.doi.org/10.1093/molbev/mst197
Jayaram, K.C. 2010. The freshwater fi shes of Indian region.Narendra Publishing House, Delhi.
Tagliavini, J., Gandolfi , G., Cau, A., Salvadori, S., Deiana, A.M.and Gandolfi , G. 1995. Mitochondrial DNA variability inAnguilla anguilla and phylogenetical relationships withcongeneric species. Bolle ino di Zoologia 62: 147–151. h p://dx.doi.org/10.1080/11250009509356062
Kocher, T.D., Thomas, W.K., Meyer, T.T., Edwards, S.V., Paabo,S., Villablanca, F.X. and Wilson, A.C. 1989. Dynamics ofmitochondrial DNA evolution in animals: amplifi cationand sequencing with conserved primers. Proceedingsof the National Academy of Sciences of the United States ofAmerica USA 86: 6196-6200. h p://dx.doi.org/10.1073/pnas.86.16.6196