generation and reversal of surface flows by propagating...
TRANSCRIPT

LETTERSPUBLISHED ONLINE: 10 AUGUST 2014 | DOI: 10.1038/NPHYS3041
Generation and reversal of surface flows bypropagating wavesHorst Punzmann1, Nicolas Francois1, Hua Xia1, Gregory Falkovich2,3 and Michael Shats1*The ability to send a wave to fetch an object from a distancewould find a broad range of applications. Quasi-standingFaraday waves on water create horizontal vortices1,2, yetit is not known whether propagating waves can generatelarge-scale flows—small-amplitude irrotational waves onlypush particles in the direction of propagation3–5. Here we showthat when waves become three-dimensional as a result of themodulation instability, a floater can be forced to move towardsthe wave source. The mechanism for this is the generation ofsurface vortices by waves propagating away from verticallyoscillatingplungers.We introduceanewconceptual frameworkfor understanding wave-driven flows, which enables us toengineer inward and outward surface jets, stationary vortices,and other complex flows. The results form a new basis forthe remote manipulation of objects on fluid surfaces andfor a better understanding of the motion of floaters in theocean, the generation of wave-driven jets, and the formationof Lagrangian coherent structures.
What is perceived as fluid motion on a surface perturbed bywaves is a motion of the surface shape, not the fluid flow alongthe surface6. Trajectories of fluid parcels on the surface have beendescribed analytically for progressing irrotational waves, whereparticles move in the direction of wave propagation3–5,7–9. Suchwaves are rare in nature and in the laboratory because finite-amplitudewaves are unstable with respect to amplitudemodulation,a phenomenon also known as the Benjamin–Feir instability10. Two-dimensional (2D) waves of finite amplitude develop into 3D waves,forming complex wave patterns11–14. The motion of particles on thesurface of such wave fields is not understood. It has been foundrecently that Faraday waves, which are parametrically excited 3Dnonlinear waves, create vortices on the fluid surface that interactand lead to the development of 2D turbulence1,15. The generation ofhorizontal vortices by quasi-standing nonlinear waves2 is an effectwhich is impossible in planar irrotational waves. In this paper weshow that progressing nonlinear waves produced by a localizedsource are also capable of creating surface vortices. The interactionbetween such vortices is shown to lead to the formation of large-scale surface flows, far away from a wave maker.
In our experiments we generate progressing waves usingvertically moving plungers, periodically inserted into the water. Thewave fields are visualized using a diffusive light imaging technique16and fast video imaging of tracer particles on the fluid surface. The3D fluid particle trajectories are tracked using a novel method,developed as part of this work, which is described in Methods andthe Supplementary Information.
A cylindrical wave maker oscillates at low amplitude, asillustrated in the schematic of Fig. 1g (for details of the experimentalset-up see Supplementary Section 1). The wave maker produces
nearly planar propagating wavefronts, as seen in Fig. 1a. To visualizethe fluid motion, buoyant tracer particles are uniformly dispersedover the fluid surface. The particles are pushed in the directionof the wave propagation, forming an outward jet, as seen in thetime-averaged particle streak image of Fig. 1b. As a consequence,a compensating return flow converges towards the sides of thewave maker. The flow changes markedly as the wave amplitudeis increased above the threshold for the onset of the modulationinstability17,18 (Fig. 1c,d). As the modulation grows and the cross-wave instability breaks the wavefront into trains of propagatingpulses, the wave field becomes three-dimensional (see Fig. 1c,as well as Supplementary Fig. 1 and Supplementary Movie 1).Simultaneously, the direction of the central jet reverses. It nowpushes floaters towards the wave maker and against the wavepropagation. The flow is strong enough to move floating objects farfrom the plunger on the water surface (see SupplementaryMovie 2).The motion of the floater can thus be reversed simply by changingthe amplitude of the wave maker oscillations.
What is the reason for the flow reversal? In the nonlinear regimethe transverse modulation of the wavefronts is strongest (highestamplitude) in the near field (one to two wavelengths away from thewave maker), where soliton-like propagating pulses18 are generated,as seen in the digital representation of the experimentally measuredsurface elevation (Fig. 1c). The reversal of the mean flow in the farfield (tens or hundreds of wavelengths away from the wave maker)is always correlated with the generation of stochastic Lagrangiantrajectories within a flow region in front of the wavemaker (Fig. 1e).This localized complex chaotic flow efficiently transports fluid in thedirection perpendicular to the propagation of the wave pulses. Thenet result is a stochastic pumping, which seems to be responsible forthe ejection of surface fluid parcels parallel to the wave maker. Thistransport is compensated by the fluid flow towards the centre of thewave source, forming a ‘tractor beam’ against the wave propagation.The velocity of the central jet changes gradually with the increasein the vertical acceleration of the wave maker. As shown in Fig. 1f,at low amplitudes, the flow is outwards and the velocity increaseswith the increase in forcing. When the threshold of the modulationinstability is reached, the flow reverses abruptly and the inwardjet velocity saturates at higher forcing levels. Such a behaviour isobserved for a wide range of excitation frequencies, from 10 to200Hz.
The outward/inward central jets are compensated by the returnflows towards/away from the sides of a cylindrical wave maker(Fig. 1b,d). These return flows are guided by the walls of the wavetank forming the dipole structures on both sides of the wave maker.The larger the tank, the larger are the vortices forming dipoles (thiswas confirmed by performing experiments in different tanks). If oneguides the return flow by introducing baffles isolating central jets
1Research School of Physics and Engineering, The Australian National University, Canberra, ACT 0200, Australia, 2Weizmann Institute of Science, Rehovot76100, Israel, 3Institute for Information Transmission Problems, Moscow 127994, Russia. *e-mail: [email protected]
658 NATURE PHYSICS | VOL 10 | SEPTEMBER 2014 | www.nature.com/naturephysics
© 2014 Macmillan Publishers Limited. All rights reserved

NATURE PHYSICS DOI: 10.1038/NPHYS3041 LETTERS
y (mm)
Wave maker
Sideview
Vibration
Fluid surface
Top view
Wave propagation
Camera view
Tracer particles
y
z
0 50 100−100 −50
050
x (mm
)
y (mm)
Inward jet
Outward jet
x (m
m)
Camera
0
b d
e
g
f
100
200
300
−100−200 0 100 200
−20
−10
0
−Vx (
mm
s−1
)
10
20
y (mm)
−100−200 0 100 200
0.0 0.5 1.0 1.5a (g)
2.0 2.5 3.0
x
50−50(mm) (mm)
50−50a c
x (mm
)
0
100
200
300
Figure 1 | Wave fields and surface flows produced by the cylindrical wave maker. a, Top view of the wave field produced by the cylindrical wave maker(25 mm diameter, 130 mm long) at lower acceleration (f=20 Hz, wavelength λ= 12 mm, acceleration a=0.8g). It shows nearly planar waves propagatingaway from the wave maker (seen at the top of the panel). b, The waves produce a strong outward jet in the direction of the wave propagation (thick bluearrow) and the return flows towards the edges of the cylinder (thin red arrows). Thick grey lines between the streak images show the tank walls. c, As thewave maker acceleration is increased (a= 1.2g) the modulation instability destroys the wave planarity, generating the 3D wave field shown here. Pink andblue wave fields correspond to two consecutive periods of the wave maker phase. d, This 3D wave field generates a strong inward directed jet towards thecentre of the cylinder (thick red arrow) and the outward return flows away from the edges of the cylinder (thin red arrows). See the correspondingSupplementary Movie 3. e, Particle streaks in the vicinity of the cylindrical wave maker allow one to visualize the region of Lagrangian stochastic transport.Turbulence pumps particles away in the direction of red arrows, orthogonal to the wave propagation. f, Central jet velocity measured 120 mm away fromthe wave maker versus vertical acceleration of the plunger (in units of the gravitational acceleration g). Green dots show measured velocities, orange errorbars show the standard deviation. Blue, orange and red lines guide the eye. See the corresponding Supplementary Movies 3 and 4. Inward and outward jetsare strong enough to manipulate objects on the water surface. For an example with a ping-pong ball, see Supplementary Movie 2. g, Schematic of theexperimental set-up.
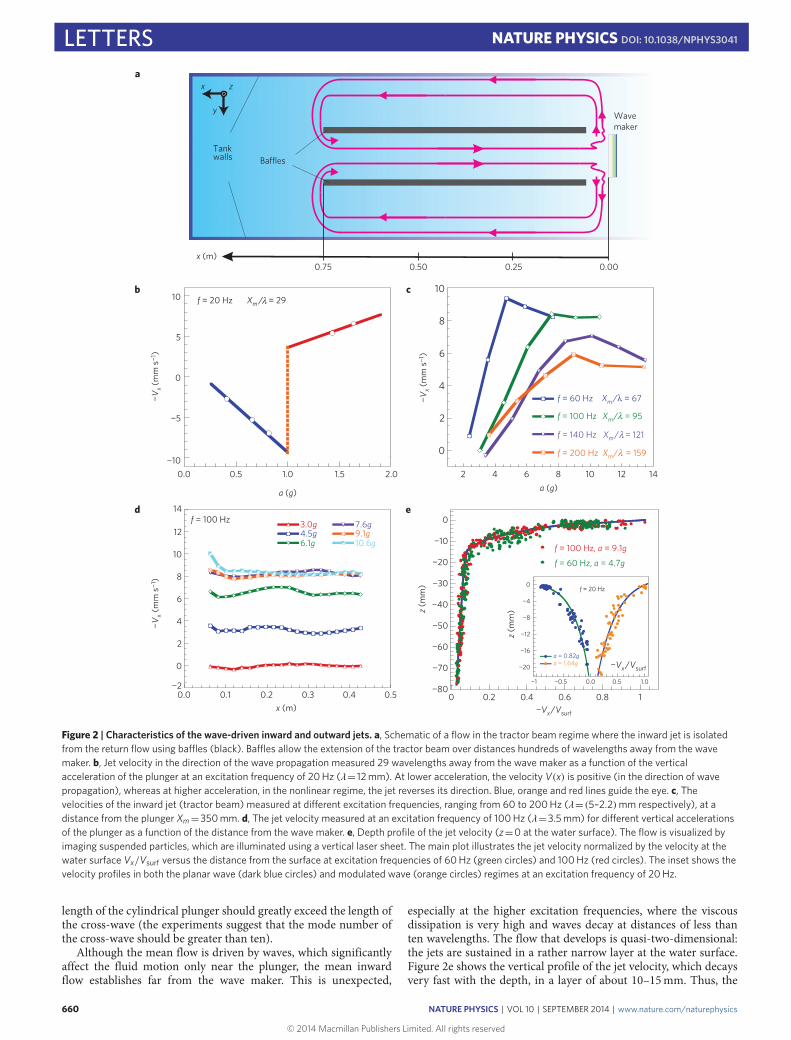
from the return flow, as shown in Fig. 2a, the lengths of the centraljets can be greatly increased. In this configuration, the widths ofthe jets are determined by the width of the cylindrical wave maker.Figure 2b shows the mean velocity of the central jet inside the chan-nel formed by the baffles as the forcing is increased. The presenceof the baffles does not affect the flow reversal of the jet above thethreshold of modulation instability, consistent with the case of no
baffles (Fig. 1f). Above the threshold, the inwardmean flow velocitygrows with increasing vertical acceleration and then saturates. Sucha trend is found for a wide range of excitation frequencies, as illus-trated in Fig. 2c. The mean flow velocity is approximately constantas a function of the distance from the wave maker (see Fig. 2d foran example). In these experiments the tractor beam extends overseveral hundreds of wavelengths. To obtain efficient pumping, the
NATURE PHYSICS | VOL 10 | SEPTEMBER 2014 | www.nature.com/naturephysics 659
© 2014 Macmillan Publishers Limited. All rights reserved
LETTERS NATURE PHYSICS DOI: 10.1038/NPHYS3041
3.0g 4.5g 6.1g
7.6g 9.1g 10.6g
x (m)
f = 100 Hz
f = 20 Hz Xm / = 29
Baffles
x (m)
Wave maker
Tank walls
x
y
z
0 0.2 0.4 0.6 0.8 1
f = 100 Hz, a = 9.1g
f = 60 Hz, a = 4.7g
−Vx/Vsurf
−20
−16
−12
−8
−4
0
−1 −0.5 0.0 0.5 1.0
a = 0.82g a = 1.64g
z (m
m)z
(mm
) f = 20 Hz
−10
−5
0
5
10
a
b c
d e
0.0 0.5 1.0 1.5 2.0
0
2
4
6
8
10
−Vx (
mm
s−1
)
−Vx (
mm
s−1
)
−Vx (
mm
s−1
)
−2
0
2
4
6
8
10
12
14
0.0 0.1 0.2 0.3 0.4 0.5 −80
−70
−60
−50
−40
−30
−20
−10
0
−Vx/Vsurf
f = 60 Hz Xm/ = 67
f = 100 Hz Xm/ = 95
f = 140 Hz Xm/ = 121
f = 200 Hz Xm/ = 159
a (g) a (g)10 12 148642
0.75 0.000.50 0.25
λ
λ
λ
λ
λ
Figure 2 | Characteristics of the wave-driven inward and outward jets. a, Schematic of a flow in the tractor beam regime where the inward jet is isolatedfrom the return flow using ba�es (black). Ba�es allow the extension of the tractor beam over distances hundreds of wavelengths away from the wavemaker. b, Jet velocity in the direction of the wave propagation measured 29 wavelengths away from the wave maker as a function of the verticalacceleration of the plunger at an excitation frequency of 20 Hz (λ= 12 mm). At lower acceleration, the velocity V(x) is positive (in the direction of wavepropagation), whereas at higher acceleration, in the nonlinear regime, the jet reverses its direction. Blue, orange and red lines guide the eye. c, Thevelocities of the inward jet (tractor beam) measured at di�erent excitation frequencies, ranging from 60 to 200 Hz (λ=(5–2.2)mm respectively), at adistance from the plunger Xm=350 mm. d, The jet velocity measured at an excitation frequency of 100 Hz (λ=3.5 mm) for di�erent vertical accelerationsof the plunger as a function of the distance from the wave maker. e, Depth profile of the jet velocity (z=0 at the water surface). The flow is visualized byimaging suspended particles, which are illuminated using a vertical laser sheet. The main plot illustrates the jet velocity normalized by the velocity at thewater surface Vx/Vsurf versus the distance from the surface at excitation frequencies of 60 Hz (green circles) and 100 Hz (red circles). The inset shows thevelocity profiles in both the planar wave (dark blue circles) and modulated wave (orange circles) regimes at an excitation frequency of 20 Hz.
length of the cylindrical plunger should greatly exceed the length ofthe cross-wave (the experiments suggest that the mode number ofthe cross-wave should be greater than ten).
Although the mean flow is driven by waves, which significantlyaffect the fluid motion only near the plunger, the mean inwardflow establishes far from the wave maker. This is unexpected,
especially at the higher excitation frequencies, where the viscousdissipation is very high and waves decay at distances of less thanten wavelengths. The flow that develops is quasi-two-dimensional:the jets are sustained in a rather narrow layer at the water surface.Figure 2e shows the vertical profile of the jet velocity, which decaysvery fast with the depth, in a layer of about 10–15mm. Thus, the
660 NATURE PHYSICS | VOL 10 | SEPTEMBER 2014 | www.nature.com/naturephysics
© 2014 Macmillan Publishers Limited. All rights reserved
NATURE PHYSICS DOI: 10.1038/NPHYS3041 LETTERS
3−1 0−2−3 1 2
1 s 2 s
Vorticity (s−1)
500−50
500−50y (mm)
x (m
m)
0
50x (m
m)
y (mm)500−50
y (mm)
500−50y (mm)
500−50y (mm)
0
50x (m
m)
0
50x (m
m)
0b
c d
e f
50
100
0
50x (m
m)
0.2 s 0.5 s
a
Figure 3 | Surface flow patterns and wave fields produced by the conical wave maker. a, Waves produced by a symmetric conical plunger at a frequencyf=20 Hz and at an acceleration above the threshold of the modulation instability18. The wave field consists of periodic radially propagating pulses. Pinkand blue wave fields correspond to two consecutive periods of the wave maker phase. b, Surface flow pattern produced by the 3D wave field. A chain ofspatially and temporally stationary vortices forms near the wave maker. c–f, Temporal development of vorticity on the water surface: Horizontal vorticesdeveloped at t=0.2 s (c), t=0.5 s (d), t= 1 s (e) and t=2 s (f) after the development of the 3D wave field.
depth of the water in these experiments (80mm) does not affect anyresults reported here.
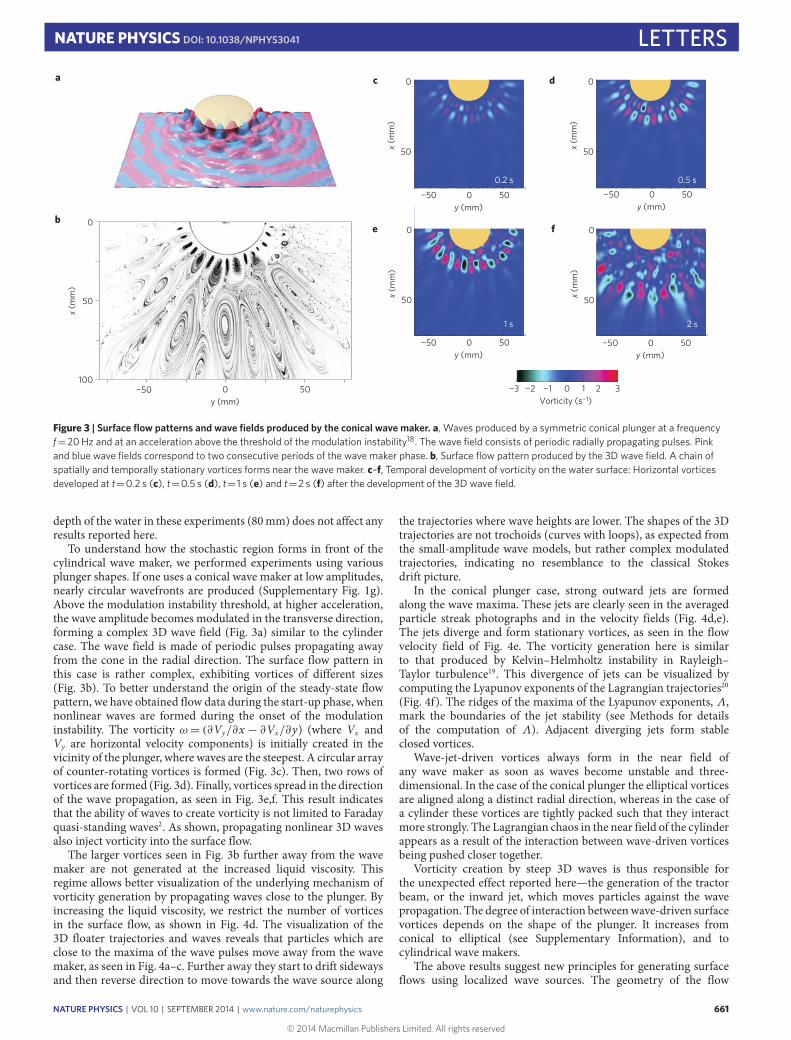
To understand how the stochastic region forms in front of thecylindrical wave maker, we performed experiments using variousplunger shapes. If one uses a conical wave maker at low amplitudes,nearly circular wavefronts are produced (Supplementary Fig. 1g).Above the modulation instability threshold, at higher acceleration,the wave amplitude becomes modulated in the transverse direction,forming a complex 3D wave field (Fig. 3a) similar to the cylindercase. The wave field is made of periodic pulses propagating awayfrom the cone in the radial direction. The surface flow pattern inthis case is rather complex, exhibiting vortices of different sizes(Fig. 3b). To better understand the origin of the steady-state flowpattern, we have obtained flow data during the start-up phase, whennonlinear waves are formed during the onset of the modulationinstability. The vorticity ω= (∂Vy/∂x − ∂Vx/∂y) (where Vx andVy are horizontal velocity components) is initially created in thevicinity of the plunger, where waves are the steepest. A circular arrayof counter-rotating vortices is formed (Fig. 3c). Then, two rows ofvortices are formed (Fig. 3d). Finally, vortices spread in the directionof the wave propagation, as seen in Fig. 3e,f. This result indicatesthat the ability of waves to create vorticity is not limited to Faradayquasi-standing waves2. As shown, propagating nonlinear 3D wavesalso inject vorticity into the surface flow.
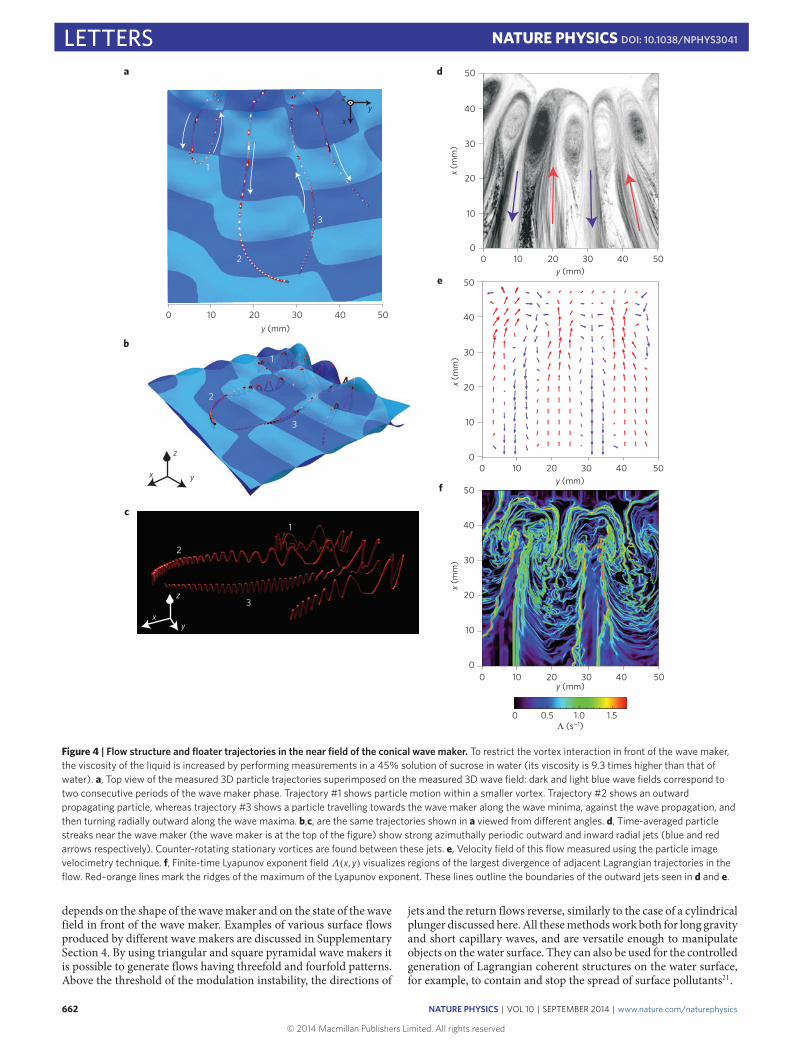
The larger vortices seen in Fig. 3b further away from the wavemaker are not generated at the increased liquid viscosity. Thisregime allows better visualization of the underlying mechanism ofvorticity generation by propagating waves close to the plunger. Byincreasing the liquid viscosity, we restrict the number of vorticesin the surface flow, as shown in Fig. 4d. The visualization of the3D floater trajectories and waves reveals that particles which areclose to the maxima of the wave pulses move away from the wavemaker, as seen in Fig. 4a–c. Further away they start to drift sidewaysand then reverse direction to move towards the wave source along
the trajectories where wave heights are lower. The shapes of the 3Dtrajectories are not trochoids (curves with loops), as expected fromthe small-amplitude wave models, but rather complex modulatedtrajectories, indicating no resemblance to the classical Stokesdrift picture.
In the conical plunger case, strong outward jets are formedalong the wave maxima. These jets are clearly seen in the averagedparticle streak photographs and in the velocity fields (Fig. 4d,e).The jets diverge and form stationary vortices, as seen in the flowvelocity field of Fig. 4e. The vorticity generation here is similarto that produced by Kelvin–Helmholtz instability in Rayleigh–Taylor turbulence19. This divergence of jets can be visualized bycomputing the Lyapunov exponents of the Lagrangian trajectories20(Fig. 4f). The ridges of the maxima of the Lyapunov exponents, Λ,mark the boundaries of the jet stability (see Methods for detailsof the computation of Λ). Adjacent diverging jets form stableclosed vortices.
Wave-jet-driven vortices always form in the near field ofany wave maker as soon as waves become unstable and three-dimensional. In the case of the conical plunger the elliptical vorticesare aligned along a distinct radial direction, whereas in the case ofa cylinder these vortices are tightly packed such that they interactmore strongly. The Lagrangian chaos in the near field of the cylinderappears as a result of the interaction between wave-driven vorticesbeing pushed closer together.
Vorticity creation by steep 3D waves is thus responsible forthe unexpected effect reported here—the generation of the tractorbeam, or the inward jet, which moves particles against the wavepropagation. The degree of interaction betweenwave-driven surfacevortices depends on the shape of the plunger. It increases fromconical to elliptical (see Supplementary Information), and tocylindrical wave makers.
The above results suggest new principles for generating surfaceflows using localized wave sources. The geometry of the flow
NATURE PHYSICS | VOL 10 | SEPTEMBER 2014 | www.nature.com/naturephysics 661
© 2014 Macmillan Publishers Limited. All rights reserved
LETTERS NATURE PHYSICS DOI: 10.1038/NPHYS3041
y (mm)
x (m
m)
x (m
m)
1
2
3x
y
z
1
2
3
x y
z
1
2
3
xy
z
0 10 20 30 40 50
0
10
20
30
40
50a d
e
f
b
c
y (mm)
0 10 20 30 40 50
0 10 20 30 40 50
y (mm)
Λ (s−1)
0 10
0 0.5 1.0 1.5
20 30 40 50
0
10
20
30
40
50
x (m
m)
0
10
20
30
40
50
y (mm)
Figure 4 | Flow structure and floater trajectories in the near field of the conical wave maker. To restrict the vortex interaction in front of the wave maker,the viscosity of the liquid is increased by performing measurements in a 45% solution of sucrose in water (its viscosity is 9.3 times higher than that ofwater). a, Top view of the measured 3D particle trajectories superimposed on the measured 3D wave field: dark and light blue wave fields correspond totwo consecutive periods of the wave maker phase. Trajectory #1 shows particle motion within a smaller vortex. Trajectory #2 shows an outwardpropagating particle, whereas trajectory #3 shows a particle travelling towards the wave maker along the wave minima, against the wave propagation, andthen turning radially outward along the wave maxima. b,c, are the same trajectories shown in a viewed from di�erent angles. d, Time-averaged particlestreaks near the wave maker (the wave maker is at the top of the figure) show strong azimuthally periodic outward and inward radial jets (blue and redarrows respectively). Counter-rotating stationary vortices are found between these jets. e, Velocity field of this flow measured using the particle imagevelocimetry technique. f, Finite-time Lyapunov exponent fieldΛ(x, y) visualizes regions of the largest divergence of adjacent Lagrangian trajectories in theflow. Red–orange lines mark the ridges of the maximum of the Lyapunov exponent. These lines outline the boundaries of the outward jets seen in d and e.
depends on the shape of the wavemaker and on the state of the wavefield in front of the wave maker. Examples of various surface flowsproduced by different wave makers are discussed in SupplementarySection 4. By using triangular and square pyramidal wave makers itis possible to generate flows having threefold and fourfold patterns.Above the threshold of the modulation instability, the directions of
jets and the return flows reverse, similarly to the case of a cylindricalplunger discussed here. All thesemethodswork both for long gravityand short capillary waves, and are versatile enough to manipulateobjects on the water surface. They can also be used for the controlledgeneration of Lagrangian coherent structures on the water surface,for example, to contain and stop the spread of surface pollutants21.
662 NATURE PHYSICS | VOL 10 | SEPTEMBER 2014 | www.nature.com/naturephysics
© 2014 Macmillan Publishers Limited. All rights reserved

NATURE PHYSICS DOI: 10.1038/NPHYS3041 LETTERSMethodsWave generation. Surface waves are generated by vertically oscillating plungersof different shapes (cylindrical, conical, pyramidal, and so on). Spatially localizedtime-periodic perturbations of the water surface generate waves propagatingaway from the plungers. The frequency of the plunger oscillations is varied in therange between 10Hz, corresponding to gravity waves, and 200Hz, correspondingto capillary waves. The dispersion relation at lower wave amplitudes is given byω=(gk+αk3/ρ)1/2, where k is the wavenumber, g is the acceleration due togravity, α is the surface tension and ρ is the fluid density. At higher amplitudes,the cross-wave instability modulates wavefronts in the transverse direction,destroying the two-dimensionality of the wave and breaking it into individualpulses, which then propagate away from the source. These propagating wavepulses oscillate vertically at half the driving frequency, f = f0/2, as expected forparametrically excited waves. The 2D wave fields shown in Fig. 1a,c arereconstructed using a diffusive light imaging technique. The results of Figs 1 and2 are obtained using a cylindrical wave maker of diameter d=25mm and lengthL=130mm. For Figs 3 and 4 we use a 60◦ angle conical plunger, submerged to adiameter of 50mm at the waterline. Experiments are performed in a rectangularcontainer (1.5×0.5m2) filled with water to a depth of 80mm. The wave makersare driven by an electrodynamic shaker. The forcing is sinusoidal andmonochromatic. The shaker frequency f0=20Hz corresponds to a wavelength ofλ=12mm. A vertically movable plunger is attached to the table of theelectromagnetic shaker via the plunger frame. Linear light-emitting diode (LED)arrays on the sides of the transparent water tank illuminate surface particleswhose motion is filmed from above using a high-resolution video camera.
Flow characterization. The flow characteristics are measured using a diffusivelight imaging technique, particle image velocimetry and particle trackingvelocimetry techniques. We use diffusive light imaging to visualize the surfaceelevation of the wave field2,16. The fluid surface is illuminated by an LED panelplaced underneath the transparent bottom of the container. A few per cent ofmilk added to water provides sufficient contrast to obtain a high-resolutionreconstruction of the wave field. The absorption coefficient is measured beforeeach experiment, allowing the calibration of the surface elevation with a verticalresolution of 20 µm. Floating imaging particles are used to visualize the fluidmotion on the water surface2. Three-dimensional Lagrangian trajectories areobtained using a combination of a two-dimensional particle tracking velocimetry(PTV) technique and a subsequent evaluation of the local surface elevation alongthe trajectory. First, the horizontal (x–y) coordinates of each point on a trajectoryare tracked using a nearest-neighbour algorithm22. Then, the particle elevations(z) are estimated as the mean of the wave elevation over a local window (500 µmradius) centred at the x–y particle coordinates at a given time. The 3Dtrajectories of the particle and the wave elevation are visualized using the 3Danimation software Houdini (Side Effects Software).
Finite-time Lyapunov exponent. The Lyapunov exponent measures thedivergence rate between two adjacent trajectories. A finite-time Lyapunovexponent (FTLE) algorithm has been developed to compute the maximumLyapunov exponents for the detection of Lagrangian coherent structures20,23. Weuse this method to locate the line of maximum divergence in the flow, as shownin Fig. 4f. The PTV velocity fields are interpolated on a refined spatial grid of 600× 600 with a time step of 1t=0.002 s. The particle trajectories are obtained bynumerical integration using a fourth-order Runge–Kutta method. Each trajectoryx(t ,x0) starts at a position x0 at a fixed initial time t0. By numericaldifferentiation we compute the largest singular-value field λmax(t , t0,x0) of thedeformation-gradient tensor field [∂x(t , t0,x0)/∂x0]T/[∂x(t , t0,x0)/∂x0]. The FTLEfield can be obtained for initial positions x0 as
Λ(x0)=[lnλmax(t , t0,x0)]/(2(t− t0))
Received 24 January 2014; accepted 23 June 2014;published online 10 August 2014
References1. Francois, N., Xia, H., Punzmann, H. & Shats, M. Inverse energy cascade and
emergence of large coherent vortices in turbulence driven by Faraday waves.Phys. Rev. Lett. 110, 194501 (2013).
2. Francois, N., Xia, H., Punzmann, H., Ramsden, S. & Shats, M.Three-dimensional fluid motion in Faraday waves: Creation of vorticity andgeneration of two-dimensional turbulence. Phys. Rev. X 4, 021021 (2014).
3. Stokes, G. G. On the theory of oscillatory waves. Trans. Camb. Phil. Soc. 8,441–455 (1847). Reprinted in Stokes, G. G.Mathematical and PhysicalPapers Vol. 1, 197–229 (Cambridge Univ. Press, 1880).
4. Falkovich, G. Fluid Mechanics: A Short Course for Physicists (Cambridge Univ.Press, 2011).
5. Constantin, A. On the deep water wave motion. J. Phys. A 34,1405–1417 (2001).
6. Scales, J. A. & Snieder, R. What is a wave? Nature 401, 739–740 (1999).7. Matioc, A-V. On particle trajectories in linear water waves. Nonlinear Anal.
Real World Appl. 11, 4275–4284 (2010).8. Longuet-Higgins, M. S. The trajectories of particles in steep, symmetric gravity
waves. J. Fluid Mech. 94, 497–517 (1979).9. Hogan, S. J. Particle trajectories in nonlinear capillary waves. J. Fluid Mech.
143, 243–252 (1984).10. Benjamin, T. B. & Feir, J. E. The disintegration of wave trains on deep water.
J. Fluid Mech. 27, 417–430 (1967).11. Zakharov, V. E. Stability of periodic waves of finite amplitude on the surface of
a deep fluid. J. Appl. Mech. Tech. Phys. 2, 190–194 (1968).12. Saffman, P. G. & Yuen, H. C. A new type of three-dimensional deep-water
waves of permanent form. J. Fluid Mech. 101, 797–808 (1980).13. Meiron, D. I., Saffman, P. G. & Yuen, H. C. Calculation of steady
three-dimensional deep-water waves. J . Fluid Mech. 124, 109–121 (1982).14. Su, M-Y. Three-dimensional deep water waves. Part 1. Experimental
measurements of skew and symmetric wave patterns. J. Fluid Mech. 124,73–108 (1982).
15. Von Kameke, A., Huhn, F., Fernández-García, G., Muñuzuri, A. P. &Pérez-Muñuzuri, V. Double cascade turbulence and Richardson dispersion in ahorizontal fluid flow induced by Faraday waves. Phys. Rev. Lett. 107,074502 (2011).
16. Wright, W. B., Budakian, R., Pine, D. J. & Putterman, S. J. Imaging ofintermittency in ripple-wave turbulence. Science 278, 1609–1612 (1997).
17. Xia, H., Shats, M. & Punzmann, H. Modulation instability and capillary waveturbulence. Europhys. Lett. 91, 14002 (2010).
18. Xia, H. & Shats, M. Propagating solitons generated by localized perturbationson the surface of deep water. Phys. Rev. E 85, 026313 (2012).
19. Sharp, D. H. An overview of Rayleigh–Taylor instability. Physica 12D,3–18 (1984).
20. Haller, G. & Yuan, G. Lagrangian coherent structures and mixing intwo-dimensional turbulence. Physica D 147, 352–370 (2000).
21. Peacock, T. & Haller, G. Lagrangian coherent structures: The hidden skeletonof fluid flows. Phys. Today 66(2), 41–47 (2013).
22. Crocker, J. C. & Grier, D. G. Methods of digital video microscopy for colloidalstudies. J. Colloid Interf. Sci. 179, 298–310 (1996).
23. Shadden, S. C., Lejien, F. & Marsden, J. E. Definition and properties ofLagrangian coherent structures from finite-time Lyapunov exponents intwo-dimensional aperiodic flows. Physica D 212, 271–304 (2005).
AcknowledgementsThis work was supported by the Australian Research Council’s Discovery Projectsfunding scheme (DP110101525). H.X. would like to acknowledge the support of theAustralian Research Council’s Discovery Early Career Research Award (DE120100364).The authors thank K. Szewc for developing the code for the finite-time Lyapunovexponent analysis used to generate Fig. 4f, and M. Gwynneth for his help withexperimental set-up. N.F. acknowledges the help of S. Ramsden of the NationalComputational Infrastructure, Vizlab, ANU with visualization of 3D flows andtrajectories using the Houdini animation software. The research of G.F. was supported bythe Minerva Foundation and the Binational Science Foundation (BSF).
Author contributionsH.P., N.F. and M.S. designed and performed the experiments; H.X., N.F., G.F. and H.P.analysed the data. M.S. and G.F. wrote the paper. All authors discussed and editedthe manuscript.
Additional informationSupplementary information is available in the online version of the paper. Reprints andpermissions information is available online at www.nature.com/reprints.Correspondence and requests for materials should be addressed to M.S.
Competing financial interestsThe authors declare no competing financial interests.
NATURE PHYSICS | VOL 10 | SEPTEMBER 2014 | www.nature.com/naturephysics 663
© 2014 Macmillan Publishers Limited. All rights reserved