generalist niche, specialist strategy: the diet of an
TRANSCRIPT

Journal of Fish Biology (2011) 78, 1183–1199
doi:10.1111/j.1095-8649.2011.02926.x, available online at wileyonlinelibrary.com
Generalist niche, specialist strategy: the dietof an Australian percichthyid
J. A. Smith*†‡, L. J. Baumgartner§, I. M. Suthers*†and M. D. Taylor*†
*Evolution and Ecology Research Centre, and School of Biological, Earth and EnvironmentalScience, University of New South Wales, Sydney 2052, Australia, †Sydney Institute of Marine
Science, Building 22, Chowder Bay Road, Mosman, New South Wales 2088, Australia and§Fisheries and Ecosystems Research, Narrandera Fisheries Centre, NSW Department of
Industry and Investment, Buckingbong Road, Narrandera, New South Wales 2700, Australia
(Received 20 October 2010, Accepted 27 January 2011)
Dietary analysis revealed that an impoundment population of Australian bass Macquaria novemac-uleata holds a generalist niche, but one arising from persistent individual specialization and interindi-vidual variation. This ‘individual specialist’ strategy appeared adaptive, but the strength of individualspecialization was largely independent of variation in diet composition, except during blooms ofDaphnia sp. Diet composition and dietary overlap showed only moderate ontogenetic variation,and niche breadth showed no relationship with ontogeny. Macquaria novemaculeata showed anasymmetric predator and prey size distribution, consistent with many aquatic predators, with posi-tive relationships between fish size and average, maximum and minimum prey size. There was noasymmetry in the relative size-based niche breadths of individuals, however, which indicates thatthe niche is a fixed ‘window’ of relative prey sizes. The difference in the dietary niche and prey-sizerelationships of M. novemaculeata at the population and individual levels highlights the necessityof assessing the niche at both these levels. © 2011 The Authors
Journal of Fish Biology © 2011 The Fisheries Society of the British Isles
Key words: interindividual variation; Macquaria novemaculeata; ontogeny; predation.
INTRODUCTION
Identifying the dietary niche of aquatic predators is essential to understanding thestructure of aquatic ecosystems. A dietary analysis is key to the assessment of feedingstrategy (Amundsen et al., 1996) and the breadth of a predator’s diet (i.e. niche width;Schoener, 1971), which ultimately identify the functional role of a predator in anecosystem. The main division of feeding strategies is that of generalist or specialist,where predators with a diverse diet or broad dietary niche are described as generalists,and specialists are predators that have low prey diversity or narrow niche width(Bridcut & Giller, 1995; Amundsen et al., 1996). Feeding strategies, however, havetraditionally been described for populations of predators under the assumption that
‡Author to whom correspondence should be addressed. Tel.: +61 2 9385 2065; email: [email protected]
1183© 2011 The AuthorsJournal of Fish Biology © 2011 The Fisheries Society of the British Isles

1184 J . A . S M I T H E T A L .
the individuals within the population share identical strategies (Bolnick et al., 2003).There are recent examples of individual feeding strategies differing from that definedby a population’s niche, with individual predators within a generalist populationactually holding more specialized niches (Fry et al., 1999; Bolnick et al., 2003).
Identifying interindividual variation in feeding strategies within a population hasincreasingly been recognized as an important part of population ecology, because itallows the creation of individual-based models (Bolnick et al., 2003) and providesa mechanistic understanding of population dynamics (Svanback & Bolnick, 2007).So while the population’s niche can largely describe the impact on a particular preyassemblage, i.e. a generalist can influence a diverse prey assemblage and a specialistinfluences only a sub-set (Jiang & Morin, 2005), the information obtained frominterindividual variation gives information on the actual feeding strategy adopted bya predator. It is becoming increasingly evident that a population’s niche is truly theproduct of individual feeding strategies (Bolnick et al., 2010). Much research is nowfocusing on interindividual variation (Fry et al., 1999; Bolnick et al., 2003, 2007;Quevedo et al., 2009), but empirical studies examining the strength of individualvariation within a broad dietary context are needed.
Niche width and feeding strategies can be evaluated using several approaches, thatincludes calculating diversity indices and dietary overlap (Krebs, 1989; Marshall &Elliott, 1997), constructing diet plots (Costello, 1990; Amundsen et al., 1996) andexamining the variation in prey size (Pearre, 1986). Niche theory, in particular, isuseful for identifying interindividual variation in feeding strategies. Roughgarden(1974), for example, helped shift the focus of niche theory to the role of the indi-vidual, by proposing that the total niche width (WTN) of a population be expressedas both a within-individual component (CWI) and a between-individual component(CBI). When the CWI comprises a large proportion of the WTN, there is little dietaryvariation between individuals; but when the proportion is small, individual special-ization is large (Bolnick et al., 2003). Thus, niche theory can be used to estimate thedegree of individual specialization with the ratio CWI:WTN (Bolnick et al., 2002).Despite individual specialization being examined in fishes, CWI:WTN values are notoften published for fish species (Bolnick et al., 2003), and not at all for Australianspecies. The aim of this study was to combine qualitative and quantitative diet anal-yses to address the broader question of the individual contribution to the niche ofa population using a widely distributed Australian aquatic predator, Australian bassMacquaria novemaculeata (Steindachner 1866).
Australia’s major group of native freshwater predators, the Percichthyidae, arepredominately classed as generalist carnivores (Allen et al., 2002), which have akey structuring role in lotic and lentic food webs. Macquaria novemaculeata isa top-level percichthyid common in the fresh waters of eastern Australia. Despitestudies of diet in this species (Harris, 1985) and in other Australian percichthyids(Howell et al., 2004; Ebner, 2006; Baumgartner, 2007; Ingram & De Silva, 2007;Sternberg et al., 2008), an analysis of the feeding niche of a percichthyid is lacking.Quantitative analysis of fine-scale dietary traits, such as size-specific prey selection,ontogenetic shifts and intraspecific niche overlap are also uncertain for the Perci-chthyidae. Furthermore, M. novemaculeata is commonly stocked in reservoirs ofeastern Australian states where substantial fisheries have been established (Wilde &Sawynok, 2005). The influence of releases of this predatory species on aquatic com-munities is uncertain, and an analysis of feeding strategy is essential if such impacts
© 2011 The AuthorsJournal of Fish Biology © 2011 The Fisheries Society of the British Isles, Journal of Fish Biology 2011, 78, 1183–1199

D I E TA RY N I C H E O F M A C Q UA R I A N OV E M A C U L E ATA 1185
are to be measured (Taylor & Suthers, 2008). So using an impoundment populationof M. novemaculeata, this study aimed to examine (1) differences in the niche andfeeding strategy at the population and individual level, (2) ontogenetic and temporalvariation of the niche and (3) size-specific prey selection and how this relates to theobserved dietary niche.
MATERIALS AND METHODS
S T U DY A R E A A N D P O P U L AT I O N
Macquaria novemaculeata were collected at Brogo Dam, NSW, Australia (36·491◦ S;149·740◦ E) over 3 days within each month of May (late autumn), August (winter) andDecember (summer) in 2008 and March 2009 (early autumn). Surface water temperatures forthese sampling periods were 17·0, 9·8, 21·3 and 21·0◦ C, respectively. Brogo Dam (capacityof 9000 Ml) is 28 m at its deepest point and has a largely undeveloped 400 km2 catchment. Itthermally stratifies at 5–10 m from November to June and has a conductivity of between 50and 100 μS cm−1. The reservoir provides downstream irrigation and can have large fluctua-tions in storage level as a result of rainfall variation and water extraction. Brogo Dam containsa substantial recreational fishery and is stocked most years with M. novemaculeata, includingreleases of c. 200 000 fingerlings over the last 10 years (NSW Department of Industry andInvestment, pers. comm.). Other than short-finned eels Anguilla australis Richardson 1841,there are no other large predatory fishes found in Brogo Dam.
S A M P L I N G A N D D I E TA RY A NA LY S I S
Fish were collected during the day and night by electrofishing or gillnetting, immediatelyeuthanized in 100 mg l−1 benzocaine (Barker et al., 2002), and then frozen until dissected.An effort was made to ensure sampling encompassed as many habitats and depths as possiblewithin each sampling period. Up to 10 fish in each of six size classes (<100, 101–150,151–200, 201–250, 251–300 and >300 mm total length, LT) were collected for dietaryanalysis during each sampling period. Size classes were arbitrarily chosen, but an interval of50 mm was considered small enough to observe any ontogenetic diet shifts. No fish <100 mmwere collected in the August 2008 sampling period. In May and August, a 200 μm planktonnet of 40 cm diameter was towed along the surface for 3 min at 3·704 km h−1 (2 knots),near both the edge and the middle of the reservoir to quantify the abundance of pelagiccrustaceans.
The LT and mass of each M. novemaculeata were measured, and the gut from oesophagusto intestine was removed and preserved in 5% formalin. The height of the mouth gape atfull extension was measured using vernier callipers for a sub-set of fish, to determine iforal morphology influenced stomach contents. Only the contents of the stomachs were usedin the analysis, as the contents of the intestine could not be identified. Each stomach wasweighed and then re-weighed with the contents removed, and the difference was consideredthe total prey wet mass. Prey items were identified, enumerated and sorted into taxonomicgroups before being dried separately in a drying oven for 72 h at 60◦ C, to determine ataxa-specific dry mass. Prey types were identified to varying taxonomic levels, which werebased on a desired parity with functional prey groups, the proficiency of the sorter and thelevel of digestion of the prey.
The lengths (longest axis, not including antennae) of ≤10 individual prey items per tax-onomic group were measured to the nearest μm using a dissecting microscope with aneyepiece graticule and used to estimate an average prey length per taxon. The largest andsmallest prey items were also measured to determine the range of prey sizes for each fish.A total average prey length was calculated by weighting the average lengths of individ-ual prey taxa by their abundance. This total average length was used in the size-specificpredator and prey relationships, which are essential to defining a species’ complete dietary
© 2011 The AuthorsJournal of Fish Biology © 2011 The Fisheries Society of the British Isles, Journal of Fish Biology 2011, 78, 1183–1199

1186 J . A . S M I T H E T A L .
niche. The lengths of partially digested items, particularly fishes, were estimated by com-paring dimensions of intact body parts, such as vertebrae, with whole specimens (Madenjianet al., 1998).
S TAT I S T I C A L A NA LY S I S
Relative importance of prey items, for interpretation of the feeding strategy, was con-structed graphically using a variation of the Costello method (Costello, 1990) proposed byAmundsen et al. (1996). This variation incorporates prey-specific measurements to improvethe resolution of a feeding strategy and the variation in the feeding of individual fish(Amundsen et al., 1996) and plots the prey-specific percentage abundance (i.e. each preyitem’s percentage contribution by number in only those stomachs that contained that prey)against the percentage occurrence (i.e. in how many fish the prey occurred). Feeding strate-gies are defined as follows (Amundsen et al., 1996): prey items with high prey-specific %abundance and high % occurrence indicate specialization by the population, and prey itemswith high prey-specific % abundance and low % occurrence indicate specialization by indi-viduals; a generalist diet would be indicated by all prey types having low prey-specific %abundance and moderate-to-high % occurrence, i.e. most individuals utilize many prey typessimultaneously. Prey types with low % abundance and low % occurrence are classed as ‘rare’and can reasonably occur to some degree within any feeding strategy, although many pointshere suggest a generalist diet (Amundsen et al., 1996).
Niche breadth, which increases as feeding becomes more generalized, was quantified forindividual fish and for groups, by calculating the diversity of prey types by mass using the
adjusted Levins index (BA) (Hurlbert, 1978): BA = (B − 1)(n − 1)−1 and B =(∑
p 2j
)−1,
where pj is the proportion of prey type j in the diet, n is the total number of prey typesfound in all seasons, and B is the Levins index. Niche breadth, based on the diversity ofprey sizes, was calculated as the s.d. of the log10 transformed prey sizes (SLH), weighted tothe abundance of prey types and with the exclusion of individuals with fewer than three preyitems (Pearre, 1986). To measure the degree of individual specialization, the ratio (CWI:WTN)of the within-individual niche component (CWI) and total niche width (WTN) was calculatedusing the Shannon index of niche width (Bolnick et al., 2002): WTNS = −∑
qj ln qj andCWIS = ∑
pi
(−∑pij ln pij
), where WTNS is the discrete index of total niche width, CWIS is
the discrete index of within-individual component, qj is the proportion of the j th prey typein the population’s total niche, pi is the proportion of all prey used by the population that isused by individual i and pij is the proportion of the j th prey type in individual i’s diet. Preymasses were used for these calculations, and this method was repeated using the adjustedLevins index of niche breadth.
Temporal and ontogenetic differences in diet composition (as proportions by mass) wereexamined with a two-factor permutational MANOVA (PERMANOVA). The two factors were‘time’ (May, August and December 2008 and March 2009) and ‘size’ (the six size classes).The analysis was run on a Bray–Curtis similarity resemblance matrix of arcsine transformeddata, with 1999 permutations. A ‘dummy species’ with negligible mass was added to controlfor empty stomachs, with the acknowledgement that a negligible mass is less likely to dampenthe similarities between non-sparse samples (Clarke et al., 2006). Pair-wise comparisons weremade to examine the differences between size classes within each season.
Diet overlap was measured to examine any ontogenetic niche shifts and was measuredbetween size classes using the % similarity index (Krebs, 1989). It calculates a sum of the min-imum prey proportions between two groups according to the following: Pjk = ∑
minimum(pij,pik), where Pjk is the proportion of overlap between groups j and k, and pij and pikrepresent the proportion of prey i in the diet of group j and group k. A value >0·6 is oftenused to indicate significance in overlap indices (Krebs, 1989). The index was used to calculatethe mean overlap between the six size classes within each sampling period and to create afrequency histogram of overlap values between individuals within each sampling period bybootstrapping 500 comparisons with replacement.
Prey size can also be used to calculate the degree of individual specialization (Bolnicket al., 2002), but this was not used here as, given the nature of the diversity index (Bolnick
© 2011 The AuthorsJournal of Fish Biology © 2011 The Fisheries Society of the British Isles, Journal of Fish Biology 2011, 78, 1183–1199

D I E TA RY N I C H E O F M A C Q UA R I A N OV E M A C U L E ATA 1187
et al., 2002), the results may be confounded by an increasing prey-size range. This could bea problem if a large range of predator sizes was examined simultaneously and positive size-specific prey selection existed (which was the case here). Instead, size-specific prey selectionwas examined in the context of the niche width to explore how these size relationshipsmight contribute to the overall dietary niche. Thus, linear relationships between prey sizeand predator size were created after transforming (log10) all size data, after the exclusion ofM. novemaculeata with fewer than three prey items in their stomachs.
All parametric tests were performed in JMP (SAS 7.0; www.sas.com). Normality wasassessed using a normal probability plot, and residuals were examined for homogeneity ofvariance. Multivariate analyses were undertaken using Primer (version 6.0, Plymouth MarineLaboratory; www.primer-e.com), with the PERMANOVA+ add-on.
RESULTS
F E E D I N G S T R AT E G Y
Feeding strategy plots (Fig. 1) showed that M. novemaculeata hold a gen-eralist niche, but one with periods of comparative specialization. Populations ofM. novemaculeata showed considerable specialization in August, when almost 80%of stomachs contained an average of 80% Daphnia sp., and moderate populationspecialization in May, when over half of the M. novemaculeata caught had diets con-sisting of 75% Chaoboridae larvae. The feeding strategy plots revealed prey types,which strongly indicated a generalist diet in every sampling period, e.g. unidentifiedinsects and fishes in May; Chaoboridae in August; fishes, unidentified insects andEcnomidae in December; Chironomidae and Culicidae in March. These plots alsoposition prey types which indicate some individual specialization in some periods,e.g. adult Diptera and Daphnia sp. in December and copepods in March.
Individual diet specialization, as quantified using niche theory and indicated by alow CWI:WTN value, appeared strong in M. novemaculeata (Table I). The individualcontributed between 31 and 45% (Shannon index) or 17 and 24% (adjusted Levinsindex) of the population’s niche, with values <50% indicating relatively strongindividual specialization (Bolnick et al., 2003). This level of individual specializationwas also persistent, though varying slightly in August.
O N TO G E N E T I C VA R I AT I O N
Piscivory was observed in M. novemaculeata as small as 67 mm, but was notcommon until fish exceeded 100 mm, and fish prey consisted of Australian smeltRetropinna semoni (Weber 1895) and flathead gudgeons (Philypnodon spp.). Pis-civory increased in autumn (March and May), particularly in M. novemaculeata101–250 mm in LT. No prey types were unique to any size class, with the exceptionof copepods and ostracods, which were only taken by M. novemaculeata <100 mm.Daphnia sp. dominated the diets of fish <200 mm in August, which matched theirincreased abundance: zooplankton tows in May found 1·8 ± 1·8 Daphnia sp.100 m−3 (mean ± s.e.) in the middle of the reservoir and none near the edges,which increased to 2350 ± 276 Daphnia sp. 100 m−3 near the edge and 5730± 2350 Daphnia sp. 100 m−3 in the middle of the reservoir in August. Daphniasp. was observed in the diet of all size classes, but was consumed less often forM. novemaculeata of >200 mm.
© 2011 The AuthorsJournal of Fish Biology © 2011 The Fisheries Society of the British Isles, Journal of Fish Biology 2011, 78, 1183–1199

1188 J . A . S M I T H E T A L .
0 20 40 60 80 100 0 20 40 60 80 100
0 20 40 60 80 100 0 20 40 60 80 100
Pre
y-sp
ecif
ic a
bund
ance
(%
)
0
20
40
60
80
100
0
20
40
60
80
100
Occurrence (%)
0
20
40
60
80
100
0
20
40
60
80
100
1
174
82 13
6
1415
(a) (b)
(c) (d)
6
8
9
13
10 1
5 1724
16
9
7
4810
3
17
62
13
14
1
5
28
11 1
1743
614 13
12
Specialist
Generalist
Specialisti
Fig. 1. Feeding strategy plots for Macquaria novemaculeata in (a) May 2008, (b) August 2008, (c) December2008 and (d) March 2009. Prey types are numbered as follows (insect groups are larvae unless other-wise noted): 1, Chaoboridae; 2, Culicidae; 3, Chironomidae; 4, Ecnomidae; 5, Dytiscidae; 6, Odonata;7, Diptera adults; 8, unidentified insects; 9, Daphnia sp.; 10, Atyidae (shrimp); 11, Ostracoda;12, Copepoda; 13, fishes; 14, Nematoda; 15, Acarina; 16, plant material; 17, unidentified material. Tosimplify the plot, not all points are numbered. (a) has been labelled to indicate the feeding strategiesassociated with different areas of the plot, including individual specialization (Specialisti ); adapted fromAmundsen et al. (1996).
A two-factor PERMANOVA [Table II(a)] indicated there were significant differ-ences between sampling periods and between size classes, but with a significantinteraction term. Pair-wise comparisons designed to examine the significant interac-tion term [Table II(b)] showed M. novemaculeata of <100 mm had different dietsfrom all other size classes, except in May 2008 (and unknown in August 2008). InAugust 2008, seven of the 10 sampled size classes showed significant differences indiet composition.
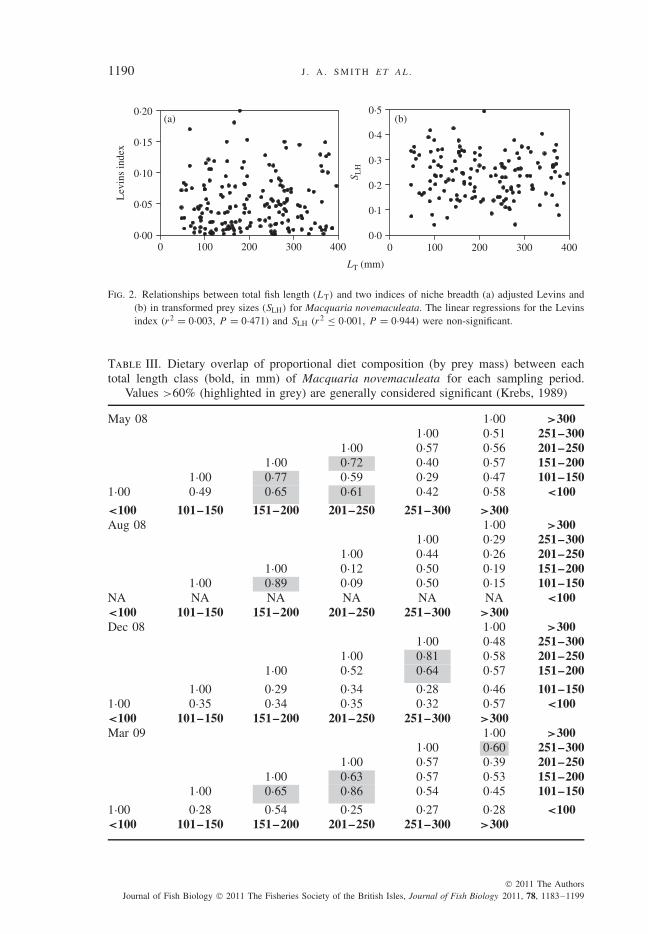
Niche breadth of individual fish, as measured by the diversity of prey types or rela-tive prey sizes, did not show ontogenetic variation (Fig. 2). The overlap of the dietaryniches of different size classes was variable and ranged from 9 to 89% (Table III), butonly one significant niche overlap (>60%) occurred between size classes >100 mm
© 2011 The AuthorsJournal of Fish Biology © 2011 The Fisheries Society of the British Isles, Journal of Fish Biology 2011, 78, 1183–1199

D I E TA RY N I C H E O F M A C Q UA R I A N OV E M A C U L E ATA 1189
Table I. Values for the total niche width (WTN), within-individual component (CWI) andthe ratio of the two (CWI:WTN) for Macquaria novemaculeata, calculated using the Shannonand adjusted Levins indices. The ratio indicates the proportional contribution of the average
individual to the population’s niche
WTN CWI CWI:WTN
ShannonMay 08 1·987 0·884 0·445Aug 08 1·738 0·537 0·309Dec 08 2·292 0·936 0·409Mar 09 2·159 0·795 0·368
Levins
May 08 0·230 0·040 0·174Aug 08 0·162 0·038 0·235Dec 08 0·350 0·062 0·177Mar 09 0·322 0·056 0·174
Table II. (a) Two-factor permutational MANOVA (PERMANOVA) results, comparing arc-sine transformed proportions of prey types in the diet of Macquaria novemaculeata. Sizeclasses are numbered 1–6 and represent fish 100, 101–150, 151–200, 201–250, 251–300and >300 mm total length, respectively. (b) The P -values of pair-wise comparisons of size
classes are shown
(a) Two-factor PERMANOVA
d.f. MS pseudo-F P -value
Time 3 29 282·0 10·6 <0·001Size 5 6691·4 2·4 <0·001Time × size 14 5234·5 1·9 <0·001Residual 188 2749·7
(b) Pair-wise comparisons
Size classes May 08 Aug 08 Dec 08 Mar 09
1 v. 2 0·485 NA <0·01 <0·051 v. 3 0·181 NA <0·001 <0·011 v. 4 0·436 NA <0·01 <0·011 v. 5 0·151 NA <0·01 <0·0011 v. 6 0·364 NA <0·05 <0·0012 v. 3 0·841 0·075 0·146 0·5982 v. 4 0·961 <0·01 <0·05 0·3912 v. 5 0·456 <0·01 0·155 0·1082 v. 6 0·918 <0·001 0·286 0·1793 v. 4 0·305 <0·05 0·094 0·3843 v. 5 0·051 0·059 0·713 0·1173 v. 6 0·345 <0·01 0·638 0·3614 v. 5 0·844 0·189 0·790 <0·054 v. 6 0·965 <0·05 0·425 0·2025 v. 6 0·937 <0·01 0·951 0·659
NA, a comparison which was not possible due to missing data.
© 2011 The AuthorsJournal of Fish Biology © 2011 The Fisheries Society of the British Isles, Journal of Fish Biology 2011, 78, 1183–1199
1190 J . A . S M I T H E T A L .
LT (mm)
100 200 300 400 0 100 200 3000 400
Lev
ins
inde
x
0·00
0·05
0·10
0·15
0·20(a) (b)
S LH
0·0
0·1
0·2
0·3
0·4
0·5
Fig. 2. Relationships between total fish length (LT) and two indices of niche breadth (a) adjusted Levins and(b) in transformed prey sizes (SLH) for Macquaria novemaculeata. The linear regressions for the Levinsindex (r2 = 0·003, P = 0·471) and SLH (r2 ≤ 0·001, P = 0·944) were non-significant.
Table III. Dietary overlap of proportional diet composition (by prey mass) between eachtotal length class (bold, in mm) of Macquaria novemaculeata for each sampling period.
Values >60% (highlighted in grey) are generally considered significant (Krebs, 1989)
May 08 1·00 >3001·00 0·51 251–300
1·00 0·57 0·56 201–2501·00 0·72 0·40 0·57 151–200
1·00 0·77 0·59 0·29 0·47 101–1501·00 0·49 0·65 0·61 0·42 0·58 <100
<100 101–150 151–200 201–250 251–300 >300Aug 08 1·00 >300
1·00 0·29 251–3001·00 0·44 0·26 201–250
1·00 0·12 0·50 0·19 151–2001·00 0·89 0·09 0·50 0·15 101–150
NA NA NA NA NA NA <100<100 101–150 151–200 201–250 251–300 >300Dec 08 1·00 >300
1·00 0·48 251–3001·00 0·81 0·58 201–250
1·00 0·52 0·64 0·57 151–200
1·00 0·29 0·34 0·28 0·46 101–1501·00 0·35 0·34 0·35 0·32 0·57 <100<100 101–150 151–200 201–250 251–300 >300Mar 09 1·00 >300
1·00 0·60 251–3001·00 0·57 0·39 201–250
1·00 0·63 0·57 0·53 151–2001·00 0·65 0·86 0·54 0·45 101–150
1·00 0·28 0·54 0·25 0·27 0·28 <100<100 101–150 151–200 201–250 251–300 >300
© 2011 The AuthorsJournal of Fish Biology © 2011 The Fisheries Society of the British Isles, Journal of Fish Biology 2011, 78, 1183–1199
D I E TA RY N I C H E O F M A C Q UA R I A N OV E M A C U L E ATA 1191
0 100 200 0 100 200 0 100 200 0 100 200 300
Prop
ortio
n di
et o
verl
ap
0·0
0·1
0·2
0·3
0·4
0·5
0·6
0·7
0·8
0·9
1·0(a) (b) (c) (d)
Number of pair-wise comparisons
Mean: 0·213Median: 0·076
Mean: 0·349Median: 0·214
Mean: 0·211Median: 0·130
Mean: 0·206Median: 0·131
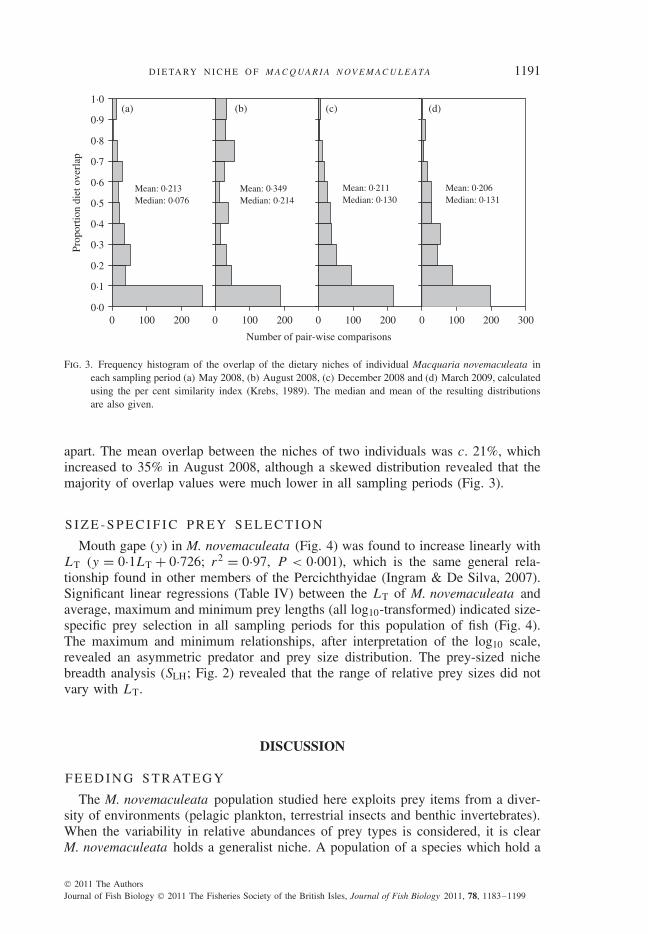
Fig. 3. Frequency histogram of the overlap of the dietary niches of individual Macquaria novemaculeata ineach sampling period (a) May 2008, (b) August 2008, (c) December 2008 and (d) March 2009, calculatedusing the per cent similarity index (Krebs, 1989). The median and mean of the resulting distributionsare also given.
apart. The mean overlap between the niches of two individuals was c. 21%, whichincreased to 35% in August 2008, although a skewed distribution revealed that themajority of overlap values were much lower in all sampling periods (Fig. 3).
S I Z E - S P E C I F I C P R E Y S E L E C T I O N
Mouth gape (y) in M. novemaculeata (Fig. 4) was found to increase linearly withLT (y = 0·1LT + 0·726; r2 = 0·97, P < 0·001), which is the same general rela-tionship found in other members of the Percichthyidae (Ingram & De Silva, 2007).Significant linear regressions (Table IV) between the LT of M. novemaculeata andaverage, maximum and minimum prey lengths (all log10-transformed) indicated size-specific prey selection in all sampling periods for this population of fish (Fig. 4).The maximum and minimum relationships, after interpretation of the log10 scale,revealed an asymmetric predator and prey size distribution. The prey-sized nichebreadth analysis (SLH; Fig. 2) revealed that the range of relative prey sizes did notvary with LT.
DISCUSSION
F E E D I N G S T R AT E G Y
The M. novemaculeata population studied here exploits prey items from a diver-sity of environments (pelagic plankton, terrestrial insects and benthic invertebrates).When the variability in relative abundances of prey types is considered, it is clearM. novemaculeata holds a generalist niche. A population of a species which hold a
© 2011 The AuthorsJournal of Fish Biology © 2011 The Fisheries Society of the British Isles, Journal of Fish Biology 2011, 78, 1183–1199

1192 J . A . S M I T H E T A L .
100 200 300 400 100 200 300 400
100 200 300 400100 200 300 400
1
5
10
20
30
(a) (b)
(c) (d)
4050
1
5
10
20
304050
Prey
leng
th (
mm
)
1
5
10
20
304050
LT (mm)
1
5
10
20
304050
Fig. 4. Relationships between fish total length (LT) and mean prey sizes ( ), maximum prey sizes ( )and minimum prey sizes ( ) of Macquaria novemaculeata in each sampling period (a) May 2008,(b) August 2008, (c) December 2008 and (d) March 2009, on a log10-log10 plot (see Table IV).The relationship between mouth gape (y) and LT (x) (y = 0·1x + 0·726; r2 = 0·97, P ≤ 0·001) isindicated ( ).
generalist niche will be made up of individuals with either many narrow but differ-ent dietary niches or a few shared broader niches (Pianka, 1994). This population ofM. novemaculeata displayed a high level of individual specialization in all samplingperiods, which means that although the population holds a broad niche, individu-als have much narrower niches. Macquaria novemaculeata therefore, as an exampleof a ‘population generalist, individual specialist’, supports the paradigm shift thatindividuals are not all alike, and high levels of individual specialization can occurwithin predator populations (Fry et al., 1999; Bolnick et al., 2003). The diversity inthis population’s diet, plus the high level of individual specialization, also supportsthe idea that the more generalized the population, the higher the level of individualspecialization (Bolnick et al., 2007).
Holding a generalist niche has been proposed as an adaptive strategy in fishesand most common when food availability is unpredictable (Dill, 1983). Adaptiveflexibility has also been proposed as a necessary precaution for variable Australianenvironments (Sternberg et al., 2008). Adaptive flexibility, most commonly observedas opportunistic feeding, has been recorded in other Australian freshwater generalists(Warburton et al., 1998), including two species of percichthyid (Howell et al., 2004;Sternberg et al., 2008). In the current study, since Daphnia sp. was the only preyto be quantified in the environment, the influence of prey abundance on the forag-ing behaviour of M. novemaculeata is uncertain, but given that M. novemaculeata
© 2011 The AuthorsJournal of Fish Biology © 2011 The Fisheries Society of the British Isles, Journal of Fish Biology 2011, 78, 1183–1199

D I E TA RY N I C H E O F M A C Q UA R I A N OV E M A C U L E ATA 1193
Tab
leIV
.R
esul
tsof
the
leas
t-sq
uare
sre
gres
sion
sbe
twee
nlo
g 10-t
rans
form
edfis
hto
tall
engt
h(L
T)
and
aver
age,
max
imum
and
min
imum
prey
size
s(L
prey
)of
Mac
quar
iano
vem
acul
eata
.T
het-
rati
oan
dP
-val
ueev
alua
teth
enu
llhy
poth
esis
that
the
slop
ebe
twee
nlo
g 10
LT
and
log 1
0L
prey
=0
May
2008
Aug
ust
2008
Dec
embe
r20
08M
arch
2009
Mea
nM
axim
umM
inim
umM
ean
Max
imum
Min
imum
Mea
nM
axim
umM
inim
umM
ean
Max
imum
Min
imum
Inte
rcep
t−0
·169
−0·85
7−0
·423
−3·18
5−1
·243
−1·34
2−0
·278
0·004
−0·21
0−0
·662
−0·35
5−1
·221
b0·4
630·9
500·4
241·6
741·0
630·7
400·4
610·5
250·2
990·6
490·6
450·7
79r
20·2
000·4
150·1
780·5
340·4
650·3
070·1
850·3
040·0
770·4
160·3
620·4
74n
2525
2528
2828
5151
5142
4242
t-ra
tio
2·39
4·04
2·23
5·46
3·40
11·97
3·33
4·63
2·01
5·34
4·76
6·00
P-v
alue
<0·0
5<
0·001
<0·0
5<
0·001
<0·0
1<
0·01
<0·0
1<
0·001
<0·0
5<
0·001
<0·0
01<
0 ·001
© 2011 The AuthorsJournal of Fish Biology © 2011 The Fisheries Society of the British Isles, Journal of Fish Biology 2011, 78, 1183–1199

1194 J . A . S M I T H E T A L .
exploited a proliferation of Daphnia sp., diet composition showed large temporalvariation, and adaptive flexibility has been observed in other Australian freshwatergeneralists, it seems likely the generalist niche of M. novemaculeata is also adaptive.
Given the potential adaptive significance of the generalist strategy for Australiafreshwater predators, how then does the ‘population generalist, individual special-ist’ pattern arise? Two potential forces thought to be involved in shaping such apattern are stochastic variability (i.e. foraging in a patchy environment) and underly-ing biological mechanisms (i.e. phenotypic or behavioural variation) (Bolnick et al.,2003). As no morphological differentiation (such as in jaw size; Roughgarden, 1974)was evident between M. novemaculeata, behavioural or stochastic variability prob-ably underpin the patterns here. The literature suggests that a change in WTN isultimately the result of environmental fluctuations (Schoener, 1971; Roughgarden,1974), while individual specialization is far more stable (Bolnick et al., 2010) andthe result of persistent biological mechanisms, such as the development of uniqueforaging behaviours (Schindler et al., 1997; Bolnick et al., 2007). Thus, the mecha-nistic view of the dietary niche of Australia’s freshwater predators is that they holda generalist niche because they are adaptive ‘specialists’ in a variable environment.A similar feeding strategy to that of the M. novemaculeata has been observed inyoung pond-reared silver perch Bidyanus bidyanus (Mitchell 1838), which is anotherAustralian generalist (Warburton et al., 1998). The authors found perch frequentlyspecialized on the dominant prey item and with little between-individual variation,but would target different prey when the prey community became more diverse.This latter case, when there was no single dominant prey type, suggests specialiststrategies, but an overall generalist niche.
Conclusively discovering the underlying cause of the feeding strategy of M. nove-maculeata is beyond the scope of this study. Distinguishing between ‘variablespecialization’ (i.e. narrow niches, which can move in respect to prey composi-tion) and ‘consistent specialization’ (i.e. narrow niches, which always contain thesame prey) requires following individuals through time (Schindler et al., 1997),or measuring the carbon and nitrogen isotopic composition of body tissue (Fryet al., 1999). Nevertheless, this study provides evidence that, in M. novemaculeata,stochastic factors influence the total possible niche of the population (i.e. tempo-ral variability in diet composition), and biological mechanisms drive the ‘individualspecialist’ strategy (i.e. a high level of individual specialization amidst this temporalvariability). Thus, M. novemaculeata show an interesting combination of adaptivegeneralization at the population level and strong specialization at the individual level.The mechanism through which this reasonably stable level of individual specializa-tion is maintained alongside large variations in diet composition is an intriguingunknown, yet this pattern does add support to the idea that a population’s nicheis driven by interindividual variation, not the extent of individual specialization(Bolnick et al., 2010).
Whether the feeding strategy of this impoundment population of M. novemaculeatareflects the strategy of riverine populations is uncertain. The diet composition (andtherefore the generalist niche) of this population generally agrees, however, withthat observed for riverine M. novemaculeata by Harris (1985), except for the impor-tance of Daphnia sp. as prey in August. Given that a population’s niche is drivenby mechanisms at the level of the individual (Bolnick et al., 2007, 2010), it is sug-gested that the similar population niche indicates a similar feeding strategy between
© 2011 The AuthorsJournal of Fish Biology © 2011 The Fisheries Society of the British Isles, Journal of Fish Biology 2011, 78, 1183–1199

D I E TA RY N I C H E O F M A C Q UA R I A N OV E M A C U L E ATA 1195
impoundment and riverine M. novemaculeata. This could be tested by applying theanalyses used in this study to riverine populations.
The high degree of individual specialization calculated using the Shannon andLevins indices is underestimated by the feeding strategy plots, which show onlysome specialization in December 2008 and March 2009. This discrepancy is dueto a limitation of feeding strategy plots. Two-dimensional diet plots use mean val-ues for % prey-specific abundance, which underestimates the strength of individualspecialization if the feeding strategy for a particular prey type is mixed (Amundsenet al., 1996). While this limitation is unlikely to affect the identification of a popu-lation’s niche, it could result in an underestimation of individual specialization. Thishighlights the advantage of a quantitative niche analysis.
O N TO G E N E T I C VA R I AT I O N
The significant interaction term in the PERMANOVA analysis and the results ofthe pair-wise comparisons showed that ontogenetic differences were not consistentacross sampling periods, which is supported by the dietary overlap calculations.Factors that vary temporally thus have a stronger influence on dietary composi-tion than factors that vary with ontogeny, which adds further support to the ideathat stochastic factors largely influence the total available niche of the population.This is particularly obvious in the lack of a relationship between niche breadth andfish size. Observed differences in diet composition in M. novemaculeata <100 mm(except in May 2008) are due to reduced piscivory, and two unique prey types inthis size class: ostracods and copepods. These two taxa were more common in theMarch period, which probably contributed to the significant differences in the PER-MANOVA for this size class. Small taxa are known to be more important for smallerM. novemaculeata and very important for percichthyid fry and larvae (Ingram & DeSilva, 2007).
Intraspecific diet partitioning, indicated by consistently small dietary overlap val-ues, means a species can belong to different feeding groups within its life (Rezsu& Specziar, 2006). Dietary overlap values for M. novemaculeata are frequently>50% and show substantial temporal variation between the same size classes. Thatonly one of the 11 significant overlap values (i.e. >60%) occurred between sizeclasses >100 mm apart means that, while consistent size-based feeding groups areunlikely to be distinguishable, broad ontogenetic variation in prey types does occa-sionally exist. This relatively weak and inconsistent intraspecific diet partitioningindicates the potential for strong food competition between M. novemaculeata of allsizes. This could explain the consistently strong level of individual specializationin M. novemaculeata, as this is known to increase as the strength of intraspecificcompetition increases (Svanback & Bolnick, 2007); however, this cannot be testedwithout information on resource availability.
The difference between the overlap of size classes and the mean overlap of individ-uals is due to the ‘individual specialist’ strategy: any two individuals, with their nar-row niches, have a median dietary overlap of just 13·8%, while size classes, with theirdifferent niches pooled, have greater levels of overlap averaging around 50%. Thisdifference clearly shows the strength of individual specialization in M. novemaculeataand the relevance of the generalist feeding strategy only at the population level. Thehighly skewed distribution of bootstrapped niche overlap measures, an unexpected
© 2011 The AuthorsJournal of Fish Biology © 2011 The Fisheries Society of the British Isles, Journal of Fish Biology 2011, 78, 1183–1199

1196 J . A . S M I T H E T A L .
distribution in a population of ‘generalists’, may be indicative of individual special-ization and deserves investigation in other species.
S I Z E - S P E C I F I C P R E Y S E L E C T I O N
A dietary niche is not only defined by the types of prey consumed but alsothe sizes of prey, which is particularly relevant when exploring the ontogeny ofa niche. The significant positive relationship between maximum prey size and fishsize, and to some extent average prey size and fish size, is facilitated by the linearincrease in mouth gape throughout ontogeny. Gape-related limitation of prey sizeis especially common in fishes that swallow their prey whole, as is the resultingpositive relationship between fish length and size range of prey (Pearre, 1986; StJohn, 1999; Scharf et al., 2000). While mouth gape imposes a physical limitation onprey size, however, other factors such as foraging ability, prey availability and preypreference may dictate a predator and prey size relationship (Ney, 1990; Bystrom& García-Berthou, 1999; Ward et al., 2006). In the current study, the increase inmaximum prey size closely resembles the increase in mouth gape. There are someprey items larger than mouth gape, but this is probably because the longest preydimension was not the one at which the prey was swallowed. For example, thebody depth of fish prey (Scharf et al., 2000), as opposed to fish length (Pearre,1986; Madenjian et al., 1998), has been used in similar relationships. Nonetheless,the close relationship between mouth gape and the upper limit of maximum preylength suggests mouth gape does limit maximum prey size for M. novemaculeata ofall sizes. The observed average prey size for M. novemaculeata was always muchsmaller than the maximum prey size, suggesting larger prey types, such as shrimpor fishes, were either less available (Balcombe et al., 2005) or harder to catch thanthe smaller prey, such as insects or Daphnia sp.
Although there were significant positive relationships between minimum preylength and LT of M. novemaculeata, it is clear that all but the smallest prey itemscontinue to be taken throughout a fish’s lifetime. This supports the belief of thewidespread occurrence of asymmetric predator and prey size distributions in aquaticecosystems (Scharf et al., 2000) and is the same general pattern as that observedin juvenile pond-reared Percichthyidae (Ingram & De Silva, 2007). Does this mean,however, based on prey size, that the dietary niche increases with ontogeny? Not ifthe size-specific niche breadth of individuals is considered, as calculated using theSLH method of Pearre (1986). The lack of relationship in SLH means that, althoughM. novemaculeata consume a wider range of prey sizes as they grow, the relativesize range of prey consumed remains the same. Thus, M. novemaculeata of any sizegenerally select prey between 1 and 10% of their own length. This pattern agrees withexisting research that suggests a constant size-based niche breadth may be common(Pearre, 1986; Scharf et al., 2000), and this examination helps fill the gap in researchexamining ratio-based predator and prey relationships over a large size range (Scharfet al., 2000).
In conclusion, the Percichthyidae have been widely described as generalists; how-ever, this study shows that this is the result of a population of individuals havingdifferent narrow niches. This study also suggests that a reasonably consistent level ofindividual specialization can be maintained alongside an adaptive dietary responseto a variable environment and an asymmetric predator and prey size distribution.
© 2011 The AuthorsJournal of Fish Biology © 2011 The Fisheries Society of the British Isles, Journal of Fish Biology 2011, 78, 1183–1199

D I E TA RY N I C H E O F M A C Q UA R I A N OV E M A C U L E ATA 1197
Species which show individual specialization (including M. novemaculeata) high-light the point that ‘generalist’ cannot be considered a sufficient description of apredator’s feeding strategy and only describes the relative width of a population’sniche. Considering the contextual nature of the specialist–generalist division and theincreasingly individual-based mechanistic view of the niche, a robust study of eitherniche or feeding strategy should include a range of analyses at the population andindividual level, and report WTN and CWI components as context.
The authors would like to thank A. Ferguson, L. Cameron and J. Stanger for their assis-tance in the field. This research was funded by the NSW Recreational Freshwater FishingTrust and the Australian Research Council (LP0776273) and conducted under UNSW AnimalCare and Ethics Approvals (07-62A). This manuscript is Sydney Institute of Marine ScienceContribution #0048.
References
Allen, G. R., Midgley, S. H. & Allen, M. (2002). Field Guide to the Freshwater Fishes ofAustralia. Perth: Western Australian Museum.
Amundsen, P. A., Gabler, H. M. & Staldvik, F. J. (1996). A new approach to graphicalanalysis of feeding strategy from stomach contents data – modification of the Costello(1990) method. Journal of Fish Biology 48, 607–614. doi: 10.1111/j.1095-8649.1996.tb01455.x
Balcombe, S. R., Bunn, S. E., McKenzie-Smith, F. J. & Davies, P. M. (2005). Variability offish diets between dry and flood periods in an arid zone floodplain river. Journal ofFish Biology 67, 1552–1567. doi: 10.1111/j.1095-8649.2005.00858.x
Barker, D., Allan, G. L., Rowland, S. J. & Pickles, J. M. (2002). A Guide to Acceptable Pro-cedures and Practices for Aquaculture and Fisheries Research. New South Wales: NSWFisheries.
Baumgartner, L. J. (2007). Diet and feeding habits of predatory fishes upstream and down-stream of a low-level weir. Journal of Fish Biology 70, 879–894. doi: 10.1111/j.1095-8649.2007.01352.x
Bolnick, D. I., Yang, L. H., Fordyce, J. A., Davis, J. M. & Svanback, R. (2002). Measuringindividual-level resource specialization. Ecology 83, 2936–2941. doi: 10.1890/0012-9658(2002)083[2936:MILRS]2.0.CO;2
Bolnick, D. I., Svanback, R., Fordyce, J. A., Yang, L. H., Davis, J. M., Hulsey, C. D.& Forister, M. L. (2003). The ecology of individuals: incidence and implications ofindividual specialization. American Naturalist 161, 1–28. doi: 10.1086/343878
Bolnick, D. I., Svanback, R., Araujo, M. S. & Persson, L. (2007). Comparative support forthe niche variation hypothesis that more generalized populations also are more het-erogeneous. Proceedings of the National Academy of Sciences of the United States ofAmerica 104, 10075–10079. doi: 10.1073/pnas.0703743104
Bolnick, D. I., Ingram, T., Stutz, W. E., Snowberg, L. K., Lau, O. L. & Paull, J. S. (2010).Ecological release from interspecific competition leads to decoupled changes in popu-lation and individual niche width. Proceedings of the Royal Society B 277, 1789–1797.doi: 10.1098/rspb.2010.0018
Bridcut, E. E. & Giller, P. S. (1995). Diet variability and foraging strategies in brown trout(Salmo trutta): an analysis from subpopulations to individuals. Canadian Journal ofFisheries and Aquatic Sciences 52, 2543–2552. doi: 10.1139/f95-845
Bystrom, P. & García-Berthou, E. (1999). Density dependent growth and size specific com-petitive interactions in young fish. Oikos 86, 217–232. doi: 10.2307/3546440
Clarke, K. R., Somerfield, P. J. & Chapman, M. G. (2006). On resemblance measures forecological studies, including taxonomic dissimilarities and a zero-adjusted Bray-Curtiscoefficient for denuded assemblages. Journal of Experimental Marine Biology andEcology 330, 55–80. doi: 10.1016/j.jembe.2005.12.017
Costello, M. J. (1990). Predator feeding strategy and prey importance – a new graphical anal-ysis. Journal of Fish Biology 36, 261–263. doi: 10.1111/j.1095-8649.1990.tb05601.x
© 2011 The AuthorsJournal of Fish Biology © 2011 The Fisheries Society of the British Isles, Journal of Fish Biology 2011, 78, 1183–1199

1198 J . A . S M I T H E T A L .
Dill, L. M. (1983). Adaptive flexibility in the foraging behaviour of fishes. Canadian Journalof Fisheries and Aquatic Sciences 40, 398–408.
Ebner, B. (2006). Murray cod an apex predator in the Murray River, Australia. Ecology ofFreshwater Fish 15, 510–520. doi: 10.1111/j.1600-0633.2006.00191.x
Fry, B., Mumford, P. L., Tam, F., Fox, D. D., Warren, G. L., Havens, K. E. & Steinman,A. D. (1999). Trophic position and individual feeding histories of fish from Lake Okee-chobee, Florida. Canadian Journal of Fisheries and Aquatic Sciences 56, 590–600.doi: 10.1139/cjfas-56-4-590
Harris, J. H. (1985). Diet of the Australian bass, Macquaria novemaculeata (Perciformes,Percichthyidae), in the Sydney basin. Australian Journal of Marine and FreshwaterResearch 36, 219–234. doi: 10.1071/MF9850219
Howell, T., Laurenson, L. J., Myers, J. H. & Jones, P. L. (2004). Spatial, temporal and size-class variation in the diet of estuary perch (Macquaria colonorum) in the HopkinsRiver, Victoria, Australia. Hydrobiologia 515, 29–37. doi: 10.1023/B:HYDR.0000027315.51291.fd
Hurlbert, S. H. (1978). Measurement of niche overlap and some relatives. Ecology 59, 67–77.Ingram, B. A. & De Silva, S. S. (2007). Diet composition and preference of juvenile Murray
cod, trout cod and Macquarie perch (Percichthyidae) reared in fertilised earthen ponds.Aquaculture 271, 260–270. doi: 10.1016/j.aquaculture.2007.06.012
Jiang, L. & Morin, P. J. (2005). Predator diet breadth influences the relative importance ofbottom-up and top-down control of prey biomass and diversity. American Naturalist165, 350–363.
Krebs, C. J. (1989). Ecological Methodology. New York, NY: Harper Collins.Madenjian, C. P., DeSorcie, T. J. & Stedman, R. M. (1998). Ontogenic and spatial patterns in
diet and growth of lake trout in Lake Michigan. Transactions of the American FisheriesSociety 127, 236–252. doi: 10.1577/1548-8659(1998)127<0236:OASPID>2.0.CO;2
Marshall, S. & Elliott, M. (1997). A comparison of univariate and multivariate numericaland graphical techniques for determining inter- and intraspecific feeding relation-ships in estuarine fish. Journal of Fish Biology 51, 526–545. doi: 10.1111/j.1095-8649.1997.tb01510.x
Ney, J. J. (1990). Trophic economics in fisheries assessment of demand-supply relationshipsbetween predators and prey. Reviews in Aquatic Sciences 2, 55–82.
Pearre, S. (1986). Ratio-based trophic niche breadths of fish, the Sheldon spectrum, and thesize-efficiency hypothesis. Marine Ecology Progress Series 27, 299–314.
Pianka, E. R. (1994). Evolutionary Ecology. New York, NY: HarperCollins College Publish-ers.
Quevedo, M., Svanback, R. & Eklov, P. (2009). Intrapopulation niche partitioning in a gener-alist predator limits food web connectivity. Ecology 90, 2263–2274. doi: 10.1890/07-1580.1
Rezsu, E. & Specziar, A. (2006). Ontogenetic diet profiles and size-dependent diet partitioningof ruffe Gymnocephalus cernuus, perch Perca fluviatilis and pumpkinseed Lepomis gib-bosus in Lake Balaton. Ecology of Freshwater Fish 15, 339–349. doi: 10.1111/j.1600-0633.2006.00172.x
Roughgarden, J. (1974). Niche width – biogeographic patterns among Anolis lizard popula-tions. American Naturalist 108, 429–442.
Scharf, F. S., Juanes, F. & Rountree, R. A. (2000). Predator size – prey size relationships ofmarine fish predators: interspecific variation and effects of ontogeny and body size ontrophic-niche breadth. Marine Ecology Progress Series 208, 229–248. doi: 10.3354/meps208229
Schindler, D. E., Hodgson, J. R. & Kitchell, J. F. (1997). Density-dependent changes in indi-vidual foraging specialization of largemouth bass. Oecologia 110, 592–600. doi: 10.1007/s004420050200
Schoener, T. W. (1971). Theory of feeding strategies. Annual Review of Ecology and System-atics 2, 369–404.
St John, J. (1999). Ontogenetic changes in the diet of the coral reef grouper Plectropomusleopardus (Serranidae): patterns in taxa, size and habitat of prey. Marine EcologyProgress Series 180, 233–246. doi: 10.3354/meps180233
© 2011 The AuthorsJournal of Fish Biology © 2011 The Fisheries Society of the British Isles, Journal of Fish Biology 2011, 78, 1183–1199

D I E TA RY N I C H E O F M A C Q UA R I A N OV E M A C U L E ATA 1199
Sternberg, D., Balcombe, S., Marshall, J. & Lobegeiger, J. (2008). Food resource variabilityin an Australian dryland river: evidence from the diet of two generalist native fishspecies. Marine and Freshwater Research 59, 137–144. doi: 10.1071/mf07125
Svanback, R. & Bolnick, D. I. (2007). Intraspecific competition drives increased resource usediversity within a natural population. Proceedings of the Royal Society B 274, 839–844.doi: 10.1098/rspb.2006.0198
Taylor, M. D. & Suthers, I. M. (2008). A predatory impact model and targeted stock enhance-ment approach for optimal release of mulloway (Argyrosomus japonicus). Reviews inFisheries Science 16, 125–134. doi: 10.1080/10641260701727293
Warburton, K., Retif, S. & Hume, D. (1998). Generalists as sequential specialists: diets andprey switching in juvenile silver perch. Environmental Biology of Fishes 51, 445–454.doi: 10.1023/A:1007489100809
Ward, A. J. W., Webster, M. M. & Hart, P. J. B. (2006). Intraspecific food competition infishes. Fish and Fisheries 7, 231–261. doi: 10.1111/j.1467-2979.2006.00224.x
Wilde, G. R. & Sawynok, W. (2005). Growth rate and mortality of Australian bass, Macquarianovemaculeata, in four freshwater impoundments in south-eastern Queensland,Australia. Fisheries Management and Ecology 12, 1–7. doi: 10.1111/j.1365-2400.2004.00412.x
© 2011 The AuthorsJournal of Fish Biology © 2011 The Fisheries Society of the British Isles, Journal of Fish Biology 2011, 78, 1183–1199