general revenue consensus estimating conference …
TRANSCRIPT
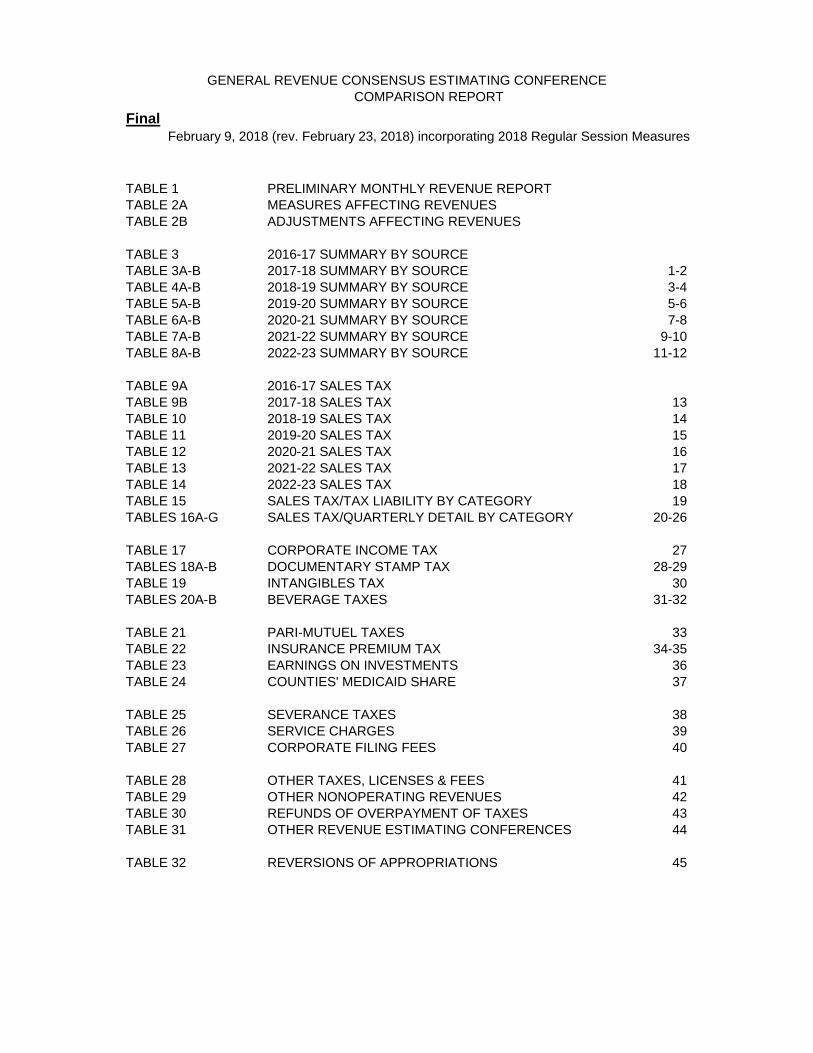
COMPARISON REPORT
February 9, 2018 (rev. February 23, 2018) incorporating 2018 Regular Session Measures
TABLE 1 PRELIMINARY MONTHLY REVENUE REPORT
TABLE 2A MEASURES AFFECTING REVENUES
TABLE 2B ADJUSTMENTS AFFECTING REVENUES
TABLE 3 2016-17 SUMMARY BY SOURCE
TABLE 3A-B 2017-18 SUMMARY BY SOURCE 1-2
TABLE 4A-B 2018-19 SUMMARY BY SOURCE 3-4
TABLE 5A-B 2019-20 SUMMARY BY SOURCE 5-6
TABLE 6A-B 2020-21 SUMMARY BY SOURCE 7-8
TABLE 7A-B 2021-22 SUMMARY BY SOURCE 9-10
TABLE 8A-B 2022-23 SUMMARY BY SOURCE 11-12
TABLE 9A 2016-17 SALES TAX
TABLE 9B 2017-18 SALES TAX 13
TABLE 10 2018-19 SALES TAX 14
TABLE 11 2019-20 SALES TAX 15
TABLE 12 2020-21 SALES TAX 16
TABLE 13 2021-22 SALES TAX 17
TABLE 14 2022-23 SALES TAX 18
TABLE 15 SALES TAX/TAX LIABILITY BY CATEGORY 19
TABLES 16A-G SALES TAX/QUARTERLY DETAIL BY CATEGORY 20-26
TABLE 17 CORPORATE INCOME TAX 27
TABLES 18A-B DOCUMENTARY STAMP TAX 28-29
TABLE 19 INTANGIBLES TAX 30
TABLES 20A-B BEVERAGE TAXES 31-32
TABLE 21 PARI-MUTUEL TAXES 33
TABLE 22 INSURANCE PREMIUM TAX 34-35
TABLE 23 EARNINGS ON INVESTMENTS 36
TABLE 24 COUNTIES' MEDICAID SHARE 37
TABLE 25 SEVERANCE TAXES 38
TABLE 26 SERVICE CHARGES 39
TABLE 27 CORPORATE FILING FEES 40
TABLE 28 OTHER TAXES, LICENSES & FEES 41
TABLE 29 OTHER NONOPERATING REVENUES 42
TABLE 30 REFUNDS OF OVERPAYMENT OF TAXES 43
TABLE 31 OTHER REVENUE ESTIMATING CONFERENCES 44
TABLE 32 REVERSIONS OF APPROPRIATIONS 45
GENERAL REVENUE CONSENSUS ESTIMATING CONFERENCE
Final

GENERAL REVENUE COLLECTIONS 2/7/18
SOURCE
January
Actual
January
Estimate
Over/
Under
Estimate
Current
Year Actual
Through
January
Current
Year
Estimate
Through
January
Over/
Under
Estimate
%
Difference
DOCUMENTARY STAMP TAX 72.1 67.9 4.2 512.1 532.4 (20.3) -3.8%
INSURANCE TAXES 12.6 14.1 (1.5) 270.3 256.8 13.5 5.2%
SERVICE CHARGES 63.7 58.8 4.9 289.2 291.9 (2.7) -0.9%
CORPORATE FILING FEES 55.7 49.6 6.1 119.8 109.8 10.0 9.1%
BEVERAGE TAXES 21.8 24.5 (2.7) 153.0 157.2 (4.2) -2.7%
COUNTIES' MEDICAID SHARE 27.5 24.1 3.4 170.6 171.6 (1.1) -0.6%
OTHER NONOPERATING REVENUES 17.3 17.5 (0.2) 94.0 96.7 (2.7) -2.8%
OTHER TAXES LICENSES AND FEES 5.3 5.7 (0.4) 22.6 22.5 0.2 0.8%
PARIMUTUEL TAXES 0.7 0.6 0.1 10.6 10.1 0.5 4.5%
REFUNDS 41.3 24.0 17.3 232.3 225.5 6.8 3.0%
Corporate Income Tax 33.1 14.0 19.1 148.0 138.5 9.5 6.9%
Insurance Premium Tax 0.6 1.4 (0.8) 26.1 28.3 (2.2) -7.7%
Other 0.1 0.4 (0.3) 2.2 1.8 0.4 24.0%
Sales Tax 7.5 8.2 (0.7) 55.9 56.8 (0.9) -1.6%
Sources Addressed in Previous Conferences
HIGHWAY SAFETY FEES 57.7 50.3 7.4 302.5 291.5 10.9 3.8%
INDIAN GAMING 19.5 19.5 - 182.9 178.5 4.4 2.4%
TOBACCO TAX 15.4 16.1 (0.7) 96.1 92.3 3.8 4.1%
ARTICLE V FEES AND TRANSFERS 6.8 9.2 (2.4) 58.2 64.6 (6.4) -9.9%
SOURCE
December
Actual
December
Estimate
Over/
Under
Estimate
Current
Year Actual
Through
December
Current
Year
Estimate
Through
December
Over/
Under
Estimate
%
Difference
SALES TAX 2,062.4 2,016.9 45.5 11,404.7 11,397.5 7.2 0.1%
CORPORATE INCOME TAX 336.9 386.0 (49.1) 912.7 1,025.3 (112.6) -11.0%
INTANGIBLES TAXES 33.2 30.9 2.3 183.4 193.8 (10.4) -5.4%
EARNINGS ON INVESTMENTS 10.6 15.4 (4.8) 70.8 85.3 (14.5) -17.0%
SEVERANCE TAXES 0.1 0.1 (0.0) 5.2 5.1 0.1 1.8%
DOCUMENTARY STAMP TAX TOTAL 206.5 199.1 7.4 1,193.9 1,243.1 (49.2) -4.0%
INSURANCE PREMIUM TOTAL 5.4 5.1 0.3 319.1 298.4 20.8 7.0%
ACTUAL COLLECTIONS THROUGH JANUARY 2018
ACTUAL COLLECTIONS THROUGH DECEMBER 2017

As of
01/26/18
10:13 AM (1) (2) (3) (4) (5) (6) (7) (8)
MONTH FISCAL YEAR TO DATE
ACTUAL ESTIMATE OVER/ CURRENT CURRENT OVER/ PRIOR PERCENT
CURRENT CURRENT UNDER YEAR YEAR UNDER YEAR INCREASE/
FINAL MONTH MONTH ESTIMATE ACTUAL ESTIMATE ESTIMATE ACTUAL DECREASE
SALES TAX COLLECTIONS 2,062.4 2,016.9 45.5 11,404.7 11,397.5 7.2 10,956.6 4.1%
CORPORATE INCOME TAX 336.9 386.0 (49.1) 912.7 1,025.3 (112.6) 1,024.9 -10.9%
DOCUMENTARY STAMP TAX 65.3 62.9 2.4 440.0 464.5 (24.5) 362.7 21.3%
INSURANCE TAXES 0.1 4.6 (4.5) 257.7 242.7 15.0 244.2 5.5%
HIGHWAY SAFETY FEES 48.0 49.3 (1.3) 244.8 241.2 3.6 227.9 7.4%
SERVICE CHARGES 25.2 25.2 0.0 225.5 233.1 (7.5) 224.8 0.3%
INTANGIBLES TAXES 33.2 30.9 2.3 183.4 193.8 (10.4) 191.8 -4.4%
CORPORATE FILING FEES 7.3 7.6 (0.3) 64.1 60.2 3.9 64.4 -0.6%
BEVERAGE TAXES 21.0 18.3 2.7 131.2 132.7 (1.5) 147.7 -11.2%
COUNTIES' MEDICAID SHARE 20.4 24.1 (3.7) 143.1 147.5 (4.5) 147.5 -3.0%
INDIAN GAMING 19.5 19.5 0.0 163.4 159.0 4.4 67.7 141.3%
EARNINGS ON INVESTMENTS 10.6 15.4 (4.8) 70.8 85.3 (14.5) 68.4 3.6%
TOBACCO TAX 15.3 14.6 0.7 80.7 76.2 4.5 81.3 -0.8%
OTHER NONOPERATING REVENUES 9.3 11.7 (2.4) 76.7 79.2 (2.5) 106.0 -27.6%
ARTICLE V FEES AND TRANSFERS 7.1 8.4 (1.3) 51.4 55.4 (4.0) 62.6 -18.0%
OTHER TAXES LICENSES AND FEES 2.9 2.7 0.2 17.3 16.8 0.6 12.2 41.6%
PARIMUTUEL TAXES 4.7 0.6 4.1 9.9 9.5 0.3 9.7 2.0%
SEVERANCE TAXES 0.1 0.1 (0.0) 5.2 5.1 0.1 5.2 0.0%
TOTAL REVENUE 2,689.2 2,698.7 (9.6) 14,482.5 14,625.2 (142.6) 14,005.6 3.4%
LESS REFUNDS 64.9 35.1 29.8 191.0 201.5 (10.5) 178.7 6.9%
NET REVENUE 2,624.3 2,663.6 (39.3) 14,291.6 14,423.7 (132.2) 13,826.9 3.4%
(1) (2) (3) (4) (5) (6) (7) (8)
MONTH FISCAL YEAR TO DATE
ACTUAL ESTMATE OVER/ CURRENT CURRENT OVER/ PRIOR PERCENT
CURRENT CURRENT UNDER YEAR YEAR UNDER YEAR INCREASE/
MONTH MONTH ESTIMATE ACTUAL ESTIMATE ESTIMATE ACTUAL DECREASE
DOCUMENTARY STAMP TAX COLLECTIONS 206.5 199.1 7.4 1,193.9 1,243.1 (49.2) 1,189.5 0.4%
INSURANCE PREMIUM COLLECTIONS [1] 5.4 5.1 0.3 319.1 298.4 20.8 294.8 8.3%
TOBACCO SURCHARGE COLLECTIONS 74.0 81.6 (7.6) 439.6 444.2 (4.6) 457.0 -3.8%
[1] Insurance Premium Collections include both the 2% Premium Tax and Surplus Lines.
T O T A L C O L L E C T I O N S R E P O R TBased on Rapid Deposit Report / Preliminary values denoted by asterisk.
TABLE 1 - DECEMBER 2017 GENERAL REVENUE COLLECTIONS($ MILLIONS - BASED ON AUGUST 2017 REVENUE ESTIMATING CONFERENCE

Session BILL # Issue Cash Recur Nonrec. Cash Recur Nonrec. Cash Recur Nonrec. Cash Recur Nonrec. Cash Recur Nonrec. Cash Recur Nonrec.
Sales Tax
2013 H135 Expanded Spaceport Territory (0.1) (0.1) 0.0 #N/A #N/A #N/A #N/A #N/A #N/A #N/A #N/A #N/A #N/A #N/A #N/A #N/A #N/A #N/A
2013 S406 Brownfields Building Materials Refund 1.3 1.3 0.0 #N/A #N/A #N/A #N/A #N/A #N/A #N/A #N/A #N/A #N/A #N/A #N/A #N/A #N/A #N/A
2013 S406 Natural Gas for Fuel Cells (0.1) (0.1) 0.0 #N/A #N/A #N/A #N/A #N/A #N/A #N/A #N/A #N/A #N/A #N/A #N/A #N/A #N/A #N/A
2013 S406 Rotary Wing Aircraft (1.3) (1.3) 0.0 #N/A #N/A #N/A #N/A #N/A #N/A #N/A #N/A #N/A #N/A #N/A #N/A #N/A #N/A #N/A
2013 S406 Spring Training Distribution (3.0) (3.3) 0.3 #N/A #N/A #N/A #N/A #N/A #N/A #N/A #N/A #N/A #N/A #N/A #N/A #N/A #N/A #N/A
2013 H7007 Economic Development - Manufacturing Machinery & Equipment 0.0 0.0 0.0 #N/A #N/A #N/A #N/A #N/A #N/A #N/A #N/A #N/A #N/A #N/A #N/A #N/A #N/A #N/A
2013 H7007 Enterprise Zone Expansion, RACEC 0.0 0.0 0.0 0.0 0.0 0.0 #N/A #N/A #N/A #N/A #N/A #N/A #N/A #N/A #N/A #N/A #N/A #N/A
2014 S1030 Medical Use of Low-THC Cannabis 0.0 0.0 0.0 0.0 0.0 0.0 #N/A #N/A #N/A #N/A #N/A #N/A #N/A #N/A #N/A #N/A #N/A #N/A
2014 H5601 Community Contribution Tax Credits 0.0 0.0 0.0 0.0 0.0 0.0 #N/A #N/A #N/A #N/A #N/A #N/A #N/A #N/A #N/A #N/A #N/A #N/A
2014 H7095 Professional Sports Facilities - Spring Training (1.7) (1.7) 0.0 (1.7) (1.7) 0.0 #N/A #N/A #N/A #N/A #N/A #N/A #N/A #N/A #N/A #N/A #N/A #N/A
2014 H7095 Professional Sports Facilities - Spring Training (1.0) (3.0) 2.0 (1.0) (3.0) 2.0 #N/A #N/A #N/A #N/A #N/A #N/A #N/A #N/A #N/A #N/A #N/A #N/A
2014 H5601 Electricity Swap (183.5) (183.5) 0.0 (187.7) (187.7) 0.0 #N/A #N/A #N/A #N/A #N/A #N/A #N/A #N/A #N/A #N/A #N/A #N/A
2014 H5601 Private Label Cards (7.8) (7.8) 0.0 (8.1) (8.1) 0.0 #N/A #N/A #N/A #N/A #N/A #N/A #N/A #N/A #N/A #N/A #N/A #N/A
2014 H5601 College Meal Plans (12.4) (12.4) 0.0 (12.8) (12.8) 0.0 #N/A #N/A #N/A #N/A #N/A #N/A #N/A #N/A #N/A #N/A #N/A #N/A
2014 H5601 Cement Mixers 0.0 0.0 0.0 0.0 0.0 0.0 #N/A #N/A #N/A #N/A #N/A #N/A #N/A #N/A #N/A #N/A #N/A #N/A
2014 H5601 Exempt Child Car Seats (2.5) (2.5) 0.0 (2.6) (2.6) 0.0 #N/A #N/A #N/A #N/A #N/A #N/A #N/A #N/A #N/A #N/A #N/A #N/A
2014 H5601 Youth Bicycle Helmets Exemption (0.2) (0.2) 0.0 (0.2) (0.2) 0.0 #N/A #N/A #N/A #N/A #N/A #N/A #N/A #N/A #N/A #N/A #N/A #N/A
2014 H5601 Therapeutic Pet Foods (2.8) (2.8) 0.0 (2.9) (2.9) 0.0 #N/A #N/A #N/A #N/A #N/A #N/A #N/A #N/A #N/A #N/A #N/A #N/A
2014 H7023 Rural Electricity Exemption (0.1) (0.1) 0.0 (0.1) (0.1) 0.0 #N/A #N/A #N/A #N/A #N/A #N/A #N/A #N/A #N/A #N/A #N/A #N/A
2014 H5601 Prepaid Mobile Communications - Ongoing Activity/CST (0.4) (0.6) 0.2 (0.6) (0.6) 0.0 #N/A #N/A #N/A #N/A #N/A #N/A #N/A #N/A #N/A #N/A #N/A #N/A
2014 H5601 Prepaid Mobile Communications - Remedial & Retroactive/CST (0.6) (0.8) 0.2 (0.8) (0.8) 0.0 #N/A #N/A #N/A #N/A #N/A #N/A #N/A #N/A #N/A #N/A #N/A #N/A
2015 H7109 Nuclear Generating Asset Retirement Financing (0.4) (0.4) 0.0 (0.4) (0.4) 0.0 (0.4) (0.4) 0.0 #N/A #N/A #N/A #N/A #N/A #N/A #N/A #N/A #N/A
2015A H33A Agricultural Related Exemptions - Irrigation (2.7) (2.7) 0.0 (2.7) (2.7) 0.0 (2.8) (2.8) 0.0 #N/A #N/A #N/A #N/A #N/A #N/A #N/A #N/A #N/A
2015A H33A Agricultural Related Exemptions - Parts and Repairs (6.4) (6.4) 0.0 (6.6) (6.6) 0.0 (6.8) (6.8) 0.0 #N/A #N/A #N/A #N/A #N/A #N/A #N/A #N/A #N/A
2015A H33A Agricultural Related Exemptions - Power Farm Equipment (0.2) (0.2) 0.0 (0.2) (0.2) 0.0 (0.2) (0.2) 0.0 #N/A #N/A #N/A #N/A #N/A #N/A #N/A #N/A #N/A
2015A H33A Agricultural Related Exemptions - Stakes (0.6) (0.6) 0.0 (0.6) (0.6) 0.0 (0.7) (0.7) 0.0 #N/A #N/A #N/A #N/A #N/A #N/A #N/A #N/A #N/A
2015A H33A Agricultural Related Exemptions - Trailers (1.6) (1.6) 0.0 (1.6) (1.6) 0.0 (1.6) (1.6) 0.0 #N/A #N/A #N/A #N/A #N/A #N/A #N/A #N/A #N/A
2015A H33A Back to School Holiday - 10 days 0.0 0.0 0.0 0.0 0.0 0.0 0.0 0.0 0.0 #N/A #N/A #N/A #N/A #N/A #N/A #N/A #N/A #N/A
2015A H33A Boat Repairs (4.1) (4.1) 0.0 (4.3) (4.3) 0.0 (4.5) (4.5) 0.0 #N/A #N/A #N/A #N/A #N/A #N/A #N/A #N/A #N/A
2015A H33A College Textbooks Exemption - 1 Year 0.0 0.0 0.0 0.0 0.0 0.0 0.0 0.0 0.0 #N/A #N/A #N/A #N/A #N/A #N/A #N/A #N/A #N/A
2015A H33A Gun Club Memberships (1.0) (1.0) 0.0 (1.0) (1.0) 0.0 (1.0) (1.0) 0.0 #N/A #N/A #N/A #N/A #N/A #N/A #N/A #N/A #N/A
2015A H33A Overseas Deployed Military Member or Spouse (0.7) (0.7) 0.0 (0.7) (0.7) 0.0 (0.7) (0.7) 0.0 #N/A #N/A #N/A #N/A #N/A #N/A #N/A #N/A #N/A
2015A H33A Prepaid College Meal Plans 0.0 0.0 0.0 0.0 0.0 0.0 0.0 0.0 0.0 #N/A #N/A #N/A #N/A #N/A #N/A #N/A #N/A #N/A
2015A H33A School Concessions (1.6) (1.6) 0.0 (1.6) (1.6) 0.0 (1.7) (1.7) 0.0 #N/A #N/A #N/A #N/A #N/A #N/A #N/A #N/A #N/A
2015A H33A Community Contribution Tax Credits (18.8) 0.0 (18.8) 0.0 0.0 0.0 0.0 0.0 0.0 #N/A #N/A #N/A #N/A #N/A #N/A #N/A #N/A #N/A
2015A H33A Enterprise Zone Benefits Extension (1.2) 0.0 (1.2) (0.8) 0.0 (0.8) (0.3) 0.0 (0.3) #N/A #N/A #N/A #N/A #N/A #N/A #N/A #N/A #N/A
2015A H33A Higher Education Credit/Aviation Fuel Tax (0.2) (0.2) 0.0 (0.2) (0.2) 0.0 (0.2) (0.2) 0.0 #N/A #N/A #N/A #N/A #N/A #N/A #N/A #N/A #N/A
2015A H33A Rate Reduction/CST (231.1) (231.1) 0.0 (233.1) (233.1) 0.0 (235.5) (235.5) 0.0 #N/A #N/A #N/A #N/A #N/A #N/A #N/A #N/A #N/A
2016 H307 Medical Use of Cannabis 0.0 0.0 0.0 0.0 0.0 0.0 0.0 0.0 0.0 0.0 0.0 0.0 #N/A #N/A #N/A #N/A #N/A #N/A
2016 H7099 Asphalt Tax Phase-out (1.0) (1.5) 0.5 (1.5) (1.5) 0.0 (1.6) (1.6) 0.0 (1.6) (1.6) 0.0 #N/A #N/A #N/A #N/A #N/A #N/A
2016 H7099 Back to School Holiday 0.0 0.0 0.0 0.0 0.0 0.0 0.0 0.0 0.0 0.0 0.0 0.0 #N/A #N/A #N/A #N/A #N/A #N/A
2016 H7099 Metal Recyclers Machinery & Equipment (1.8) (1.8) 0.0 (1.9) (1.9) 0.0 (2.0) (2.0) 0.0 (2.1) (2.1) 0.0 #N/A #N/A #N/A #N/A #N/A #N/A
2016 H7099 Permanent Exemption on Manufacturing M&E (62.8) (62.8) 0.0 (66.0) (66.0) 0.0 (69.4) (69.4) 0.0 (73.0) (73.0) 0.0 #N/A #N/A #N/A #N/A #N/A #N/A
2016 H7099 Post-Harvest Activity Machinery & Equipment (0.9) (0.9) 0.0 (0.9) (0.9) 0.0 (0.9) (0.9) 0.0 (0.9) (0.9) 0.0 #N/A #N/A #N/A #N/A #N/A #N/A
2016 H7099 Veterans' Service Organizations (1.4) (1.4) 0.0 (1.4) (1.4) 0.0 (1.4) (1.4) 0.0 (1.4) (1.4) 0.0 #N/A #N/A #N/A #N/A #N/A #N/A
Const. Amend Medical Use of Cannabis 2.3 21.5 (19.2) 3.7 21.5 (17.8) 6.8 21.5 (14.7) 13.8 21.5 (7.7) 21.5 21.5 0.0 #N/A #N/A #N/A
2017 H7109 Admissions Resales (1.0) (2.4) 1.4 (2.5) (2.5) 0.0 (2.6) (2.6) 0.0 (2.7) (2.7) 0.0 (2.9) (2.9) 0.0 #N/A #N/A #N/A
2017 H7109 Animal Health Products and Retroactive Application (2.2) (2.1) (0.1) (2.1) (2.1) 0.0 (2.2) (2.2) 0.0 (2.2) (2.2) 0.0 (2.3) (2.3) 0.0 #N/A #N/A #N/A
2017 H7109 Back to School Holiday - 3 day + $750 or Less Computers (26.4) 0.0 (26.4) 0.0 0.0 0.0 0.0 0.0 0.0 0.0 0.0 0.0 0.0 0.0 0.0 #N/A #N/A #N/A
2017 H7109 Commercial Rents/0.2% Point Reduction (22.5) (54.0) 31.5 (56.6) (56.6) 0.0 (58.9) (58.9) 0.0 (61.1) (61.1) 0.0 (63.4) (63.4) 0.0 #N/A #N/A #N/A
2017 H7109 Continue and Revise Community Contribution Tax Credit 0.0 (10.5) 10.5 (10.5) (10.5) 0.0 (10.5) (10.5) 0.0 (10.5) (10.5) 0.0 (10.5) (10.5) 0.0 #N/A #N/A #N/A
2017 H7109 Disaster Preparedness Holiday - 3 Day (3.6) 0.0 (3.6) 0.0 0.0 0.0 0.0 0.0 0.0 0.0 0.0 0.0 0.0 0.0 0.0 #N/A #N/A #N/A
2017 H7109 Exempt New Construction Building Materials in RAOs (**) (1.3) 1.3 (4.5) (1.3) (3.2) (3.1) (1.3) (1.8) (3.2) (1.3) (1.9) (1.3) (1.3) 0.0 #N/A #N/A #N/A
2017 H7109 Feminine Hygiene Products (3.8) (8.9) 5.1 (9.0) (9.0) 0.0 (9.0) (9.0) 0.0 (9.1) (9.1) 0.0 (9.2) (9.2) 0.0 #N/A #N/A #N/A
2017 H7109 Governments/Golf Courses (0.2) (0.2) 0.0 (0.2) (0.2) 0.0 (0.2) (0.2) 0.0 (0.2) (0.2) 0.0 (0.2) (0.2) 0.0 #N/A #N/A #N/A
2017 H7109 Municipally Owned Golf Courses/Retroactive (0.1) 0.0 (0.1) 0.0 0.0 0.0 0.0 0.0 0.0 0.0 0.0 0.0 0.0 0.0 0.0 #N/A #N/A #N/A
2017 H7109 Data Centers (0.7) (2.1) 1.4 (1.1) (2.1) 1.0 (1.6) (2.1) 0.5 (1.6) (2.1) 0.5 (1.6) (2.1) 0.5 #N/A #N/A #N/A
2017A S8A Medical Marijuana (2.1) (21.5) 19.4 (3.7) (21.5) 17.8 (6.8) (21.5) 14.7 (13.8) (21.5) 7.7 (21.5) (21.5) 0.0 #N/A #N/A #N/A
2018 H7055 Florida Sales Tax Credit Program ($57.5 million) #N/A #N/A #N/A (43.1) (57.5) 14.4 (57.5) (57.5) 0.0 (57.5) (57.5) 0.0 (57.5) (57.5) 0.0 (57.5) (57.5) 0.0
2018 H7055 Hope Scholarship #N/A #N/A #N/A (27.9) (41.2) 13.3 (41.6) (41.6) 0.0 (41.8) (41.8) 0.0 (41.9) (41.9) 0.0 (42.3) (42.3) 0.0
2018 H7055 Various Tax Credit Scholarship Issues - Collection Allowance #N/A #N/A #N/A (0.1) (0.1) 0.0 (0.1) (0.1) 0.0 (0.1) (0.1) 0.0 (0.1) (0.1) 0.0 (0.1) (0.1) 0.0
2018 H7087 Back to School Sales Tax Holiday (No Computers) #N/A #N/A #N/A (26.0) 0.0 (26.0) 0.0 0.0 0.0 0.0 0.0 0.0 0.0 0.0 0.0 0.0 0.0 0.0
2018 H7087 Building Materials Refunds - Farm Buildings #N/A #N/A #N/A (7.0) 0.0 (7.0) 0.0 0.0 0.0 0.0 0.0 0.0 0.0 0.0 0.0 0.0 0.0 0.0
2018 H7087 Commercial Rent Tax Rate Reduction - 0.1% #N/A #N/A #N/A (11.4) (27.5) 16.1 (28.6) (28.6) 0.0 (29.8) (29.8) 0.0 (31.0) (31.0) 0.0 (32.0) (32.0) 0.0
2018 H7087 Community Contribution Tax Credit #N/A #N/A #N/A (1.5) 0.0 (1.5) (2.3) 0.0 (2.3) 0.0 0.0 0.0 0.0 0.0 0.0 0.0 0.0 0.0
2018 H7087 Disaster Preparedness Holiday - 1 Week #N/A #N/A #N/A (4.6) 0.0 (4.6) 0.0 0.0 0.0 0.0 0.0 0.0 0.0 0.0 0.0 0.0 0.0 0.0
2018 H7087 Fencing Materials Refund (Section 57) #N/A #N/A #N/A (2.1) 0.0 (2.1) 0.0 0.0 0.0 0.0 0.0 0.0 0.0 0.0 0.0 0.0 0.0 0.0
2018 H7087 Generators - 15K & 18 Months (Section 56) #N/A #N/A #N/A (5.3) 0.0 (5.3) 0.0 0.0 0.0 0.0 0.0 0.0 0.0 0.0 0.0 0.0 0.0 0.0
2018 H7087 Recyclers/Energy and Roll Off Containers (Section 36) #N/A #N/A #N/A (0.7) (0.7) 0.0 (0.7) (0.7) 0.0 (0.6) (0.6) 0.0 (0.6) (0.6) 0.0 (0.6) (0.6) 0.0
2018 H7087 Aquaculture Exemptions (Section 36) #N/A #N/A #N/A (0.2) (0.1) (0.1) (0.2) (0.1) (0.1) (0.2) (0.2) 0.0 (0.2) (0.2) 0.0 (0.2) (0.2) 0.0
Sales Tax Total (596.2) (619.4) 23.2 (747.9) (756.6) 8.7 (548.5) (546.8) (1.7) (299.6) (298.2) (1.4) (222.7) (223.2) 0.5 (132.7) (132.7) 0.0
Beverage Tax & Licenses
2016 H7099 Cruise Line Per Berth 0.0 0.0 0.0 0.0 0.0 0.0 0.0 0.0 0.0 0.0 0.0 0.0 #N/A #N/A #N/A #N/A #N/A #N/A
2016 H7099 Pear Cider (0.1) (0.1) 0.0 (0.1) (0.1) 0.0 (0.1) (0.1) 0.0 (0.1) (0.1) 0.0 #N/A #N/A #N/A #N/A #N/A #N/A
Beverage Tax & Licenses Total (0.1) (0.1) 0.0 (0.1) (0.1) 0.0 (0.1) (0.1) 0.0 (0.1) (0.1) 0.0
Corporate Income Tax
2013 S406 Economic Development - Enterprise Zones (0.8) (0.8) 0.0 0.0 0.0 0.0 #N/A #N/A #N/A #N/A #N/A #N/A #N/A #N/A #N/A #N/A #N/A #N/A
2014 H5601 Community Contribution Tax Credits 0.0 0.0 0.0 0.0 0.0 0.0 #N/A #N/A #N/A #N/A #N/A #N/A #N/A #N/A #N/A #N/A #N/A #N/A
2014 S850 Tax Scholarship Credit Caps (14.5) (14.8) 0.3 (14.8) (14.8) 0.0 #N/A #N/A #N/A #N/A #N/A #N/A #N/A #N/A #N/A #N/A #N/A #N/A
2015A H33A Brownfield Credits 0.0 0.0 0.0 0.0 0.0 0.0 0.0 0.0 0.0 #N/A #N/A #N/A #N/A #N/A #N/A #N/A #N/A #N/A
2015A H33A Research and Development Credits 0.0 0.0 0.0 0.0 0.0 0.0 0.0 0.0 0.0 #N/A #N/A #N/A #N/A #N/A #N/A #N/A #N/A #N/A
2015A H33A Community Contribution Tax Credits (3.7) 0.0 (3.7) 0.0 0.0 0.0 0.0 0.0 0.0 #N/A #N/A #N/A #N/A #N/A #N/A #N/A #N/A #N/A
2015A H33A Enterprise Zone Benefits Extension (1.0) 0.0 (1.0) (0.7) 0.0 (0.7) (0.5) 0.0 (0.5) #N/A #N/A #N/A #N/A #N/A #N/A #N/A #N/A #N/A
2016 H7099 Due Date Changes 0.0 0.0 0.0 0.0 0.0 0.0 0.0 0.0 0.0 0.0 0.0 0.0 #N/A #N/A #N/A #N/A #N/A #N/A
2016 H7099 Piggyback - Adopt 179 Expensing, Decouple from Bonus Depreciation (3.0) (1.5) (1.5) (2.4) (1.5) (0.9) (1.9) (1.5) (0.4) (1.5) (1.5) 0.0 #N/A #N/A #N/A #N/A #N/A #N/A
2017 H7099 June Filing Deadline 83.9 0.0 83.9 0.6 0.0 0.6 (84.5) 0.0 (84.5) 0.0 0.0 0.0 0.0 0.0 0.0 #N/A #N/A #N/A
2017 H7109 Brownfields (5.0) (5.0) 0.0 (5.0) (5.0) 0.0 (5.0) (5.0) 0.0 (5.0) (5.0) 0.0 (5.0) (5.0) 0.0 #N/A #N/A #N/A
2017 H7109 Continue and Revise Community Contribution Tax Credit 0.0 (2.1) 2.1 (2.1) (2.1) 0.0 (2.1) (2.1) 0.0 (2.1) (2.1) 0.0 (2.1) (2.1) 0.0 #N/A #N/A #N/A
2017 H7109 Research and Development Tax Credit (5.4) 0.0 (5.4) (2.1) 0.0 (2.1) 0.0 0.0 0.0 0.0 0.0 0.0 0.0 0.0 0.0 #N/A #N/A #N/A
2018 H7055 Tax Credit Scholarship - Additional Scholarships #N/A #N/A #N/A (8.2) (8.2) 0.0 (8.2) (8.2) 0.0 (8.2) (8.2) 0.0 (8.2) (8.2) 0.0 (8.2) (8.2) 0.0
2018 H7055 Tax Credit Scholarship - Penalty and Interest #N/A #N/A #N/A (1.8) (1.8) 0.0 (1.8) (1.8) 0.0 (1.8) (1.8) 0.0 (1.8) (1.8) 0.0 (1.8) (1.8) 0.0
2018 H7087 Community Contribution Tax Credit #N/A #N/A #N/A (0.1) 0.0 (0.1) 0.0 0.0 0.0 0.0 0.0 0.0 0.0 0.0 0.0 0.0 0.0 0.0
2018 H7087 Contaminated Site Rehabilitation Tax Credit #N/A #N/A #N/A (8.5) 0.0 (8.5) 0.0 0.0 0.0 0.0 0.0 0.0 0.0 0.0 0.0 0.0 0.0 0.0
Corporate Income Tax Total 50.5 (24.2) 74.7 (45.1) (33.4) (11.7) (104.0) (18.6) (85.4) (18.6) (18.6) 0.0 (17.1) (17.1) 0.0 (10.0) (10.0) 0.0
Documentary Stamp Tax
2014 H5001 Authorization for New Everglades Bonds (GAA) (2.6) (2.6) 0.0 (2.6) (2.6) 0.0 #N/A #N/A #N/A #N/A #N/A #N/A #N/A #N/A #N/A #N/A #N/A #N/A
2014 H5501 TF Transfer to GR for Debt Service Payment Office 4.3 4.3 0.0 4.3 4.3 0.0 #N/A #N/A #N/A #N/A #N/A #N/A #N/A #N/A #N/A #N/A #N/A #N/A
2015A S2516A Trust Fund Terminations 0.0 0.0 0.0 0.0 0.0 0.0 0.0 0.0 0.0 #N/A #N/A #N/A #N/A #N/A #N/A #N/A #N/A #N/A
2015A S2516A Redistribution of Doc Stamp Tax (239.2) (239.2) 0.0 (258.7) (258.7) 0.0 (276.9) (276.9) 0.0 #N/A #N/A #N/A #N/A #N/A #N/A #N/A #N/A #N/A
2017A 1A Doc Stamp redirect from SEED to GR 75.0 75.0 0.0 75.0 75.0 0.0 75.0 75.0 0.0 75.0 75.0 0.0 75.0 75.0 0.0 #N/A #N/A #N/A
2018 H7087 Housing Finance Authorities #N/A #N/A #N/A (0.1) (0.1) 0.0 (0.1) (0.1) 0.0 (0.1) (0.1) 0.0 (0.1) (0.1) 0.0 (0.1) (0.1) 0.0
2018 H7087 Spousal Transfers - Homestead Property - Mortgage Only Consideration #N/A #N/A #N/A (0.5) (0.5) 0.0 (0.5) (0.5) 0.0 (0.6) (0.6) 0.0 (0.6) (0.6) 0.0 (0.6) (0.6) 0.0
Documentary Stamp Tax Total (162.5) (162.5) 0.0 (182.6) (182.6) 0.0 (202.5) (202.5) 0.0 74.3 74.3 0.0 74.3 74.3 0.0 (0.7) (0.7) 0.0
Tobacco Taxes
2014 H5601 Moffit Distribution (5.0) (5.0) 0.0 (5.0) (5.0) 0.0 #N/A #N/A #N/A #N/A #N/A #N/A #N/A #N/A #N/A #N/A #N/A #N/A
2016 H7099 Wholesale Price 0.8 0.8 0.0 0.8 0.8 0.0 0.8 0.8 0.0 0.8 0.8 0.0 #N/A #N/A #N/A #N/A #N/A #N/A
Tobacco Taxes Total (4.2) (4.2) 0.0 (4.2) (4.2) 0.0 0.8 0.8 0.0 0.8 0.8 0.0
Insurance Premium Tax
2013 S406 Economic Development - New Markets (3.0) (3.0) 0.0 0.0 0.0 0.0 #N/A #N/A #N/A #N/A #N/A #N/A #N/A #N/A #N/A #N/A #N/A #N/A
2014 H805 Title Insurance (5.7) 0.0 (5.7) 3.0 0.0 3.0 #N/A #N/A #N/A #N/A #N/A #N/A #N/A #N/A #N/A #N/A #N/A #N/A
2014 S850 Tax Scholarship Credit Caps (2.7) (9.7) 7.0 (9.7) (9.7) 0.0 #N/A #N/A #N/A #N/A #N/A #N/A #N/A #N/A #N/A #N/A #N/A #N/A
2014 H5403 Surplus Lines 15.9 15.9 0.0 16.2 16.2 0.0 #N/A #N/A #N/A #N/A #N/A #N/A #N/A #N/A #N/A #N/A #N/A #N/A
2014 H5601 Bail Bonds (0.7) (0.7) 0.0 (0.7) (0.7) 0.0 #N/A #N/A #N/A #N/A #N/A #N/A #N/A #N/A #N/A #N/A #N/A #N/A
2014 H5601 New Markets (7.7) (7.7) 0.0 (7.7) (7.7) 0.0 #N/A #N/A #N/A #N/A #N/A #N/A #N/A #N/A #N/A #N/A #N/A #N/A
FY21-22 FY22-23
TABLE 2A- Measures Affecting Revenue and Tax Administration
Increase/(Decrease) in $ Millions
FY20-21FY19-20FY18-19FY17-18

Session BILL # Issue Cash Recur Nonrec. Cash Recur Nonrec. Cash Recur Nonrec. Cash Recur Nonrec. Cash Recur Nonrec. Cash Recur Nonrec.
FY21-22 FY22-23
TABLE 2A- Measures Affecting Revenue and Tax Administration
Increase/(Decrease) in $ Millions
FY20-21FY19-20FY18-19FY17-18
2015A H33A Title Insurance 0.0 (4.6) 4.6 (6.9) (4.6) (2.3) (4.8) (4.7) (0.1) #N/A #N/A #N/A #N/A #N/A #N/A #N/A #N/A #N/A
Insurance Premium Tax Total (3.9) (9.8) 5.9 (5.8) (6.5) 0.7 (4.8) (4.7) (0.1)
Highway Safety Licenses & Fees
2013 S62 Low-Speed Vehicles (0.1) (0.1) 0.0 0.0 0.0 0.0 #N/A #N/A #N/A #N/A #N/A #N/A #N/A #N/A #N/A #N/A #N/A #N/A
2013 H7125 Red Light Cameras - Timing - Hearings and Affidavits 0.0 0.0 0.0 0.0 0.0 0.0 #N/A #N/A #N/A #N/A #N/A #N/A #N/A #N/A #N/A #N/A #N/A #N/A
2013 H7125 Motor Vehicle Dealer Fees 0.2 0.0 0.2 0.0 0.0 0.0 #N/A #N/A #N/A #N/A #N/A #N/A #N/A #N/A #N/A #N/A #N/A #N/A
2014 H53 Inmate Reentry - Waiver of HSMV ID Fees and DOH Fees (0.3) (0.3) 0.0 (0.3) (0.3) 0.0 #N/A #N/A #N/A #N/A #N/A #N/A #N/A #N/A #N/A #N/A #N/A #N/A
2014 S156 Highway Safety Fees Reductions (425.6) (425.6) 0.0 (433.6) (433.6) 0.0 #N/A #N/A #N/A #N/A #N/A #N/A #N/A #N/A #N/A #N/A #N/A #N/A
2014 S754 Certificates of Titles (Salvage) 0.1 0.1 0.0 0.1 0.1 0.0 #N/A #N/A #N/A #N/A #N/A #N/A #N/A #N/A #N/A #N/A #N/A #N/A
2014 H7005 ID Cards for Homeless and Low Income Persons (1.5) (1.5) 0.0 (1.5) (1.5) 0.0 #N/A #N/A #N/A #N/A #N/A #N/A #N/A #N/A #N/A #N/A #N/A #N/A
2015A S2514A Initial Registration Distribution (103.4) (103.4) 0.0 (105.4) (105.4) 0.0 (107.3) (107.3) 0.0 #N/A #N/A #N/A #N/A #N/A #N/A #N/A #N/A #N/A
2016 S1046 Commercial Driver License Fees for Farm Vehicles (0.1) (0.1) 0.0 (0.1) (0.1) 0.0 (0.1) (0.1) 0.0 (0.1) (0.1) 0.0 #N/A #N/A #N/A #N/A #N/A #N/A
2017 H1021 Deceased Joint Owners (0.2) (0.2) 0.0 (0.2) (0.2) 0.0 (0.3) (0.3) 0.0 (0.3) (0.3) 0.0 (0.3) (0.3) 0.0 #N/A #N/A #N/A
Highway Safety Licenses & Fees Total (530.9) (531.1) 0.2 (541.0) (541.0) 0.0 (107.7) (107.7) 0.0 (0.4) (0.4) 0.0 (0.3) (0.3) 0.0
. . .
Service Charges
2013 H333 Vessel Registration Fees - CPI Adjustment (0.2) (0.2) 0.0 0.0 0.0 0.0 #N/A #N/A #N/A #N/A #N/A #N/A #N/A #N/A #N/A #N/A #N/A #N/A
2013 H579 Alternative Decal Fee/Natural Gas Fuel Tax (*) 0.1 (0.1) 0.0 0.0 0.0 #N/A #N/A #N/A #N/A #N/A #N/A #N/A #N/A #N/A #N/A #N/A #N/A
2013 H999 Department of Environmental Protection - Air Pollution Permits (0.1) (0.1) 0.0 0.0 0.0 0.0 #N/A #N/A #N/A #N/A #N/A #N/A #N/A #N/A #N/A #N/A #N/A #N/A
2013 H999 Department of Environmental Protection - Submerged Lands (0.1) (0.1) 0.0 0.0 0.0 0.0 #N/A #N/A #N/A #N/A #N/A #N/A #N/A #N/A #N/A #N/A #N/A #N/A
2013 S1512 Clerks of Courts (31.9) (31.9) 0.0 0.0 0.0 0.0 #N/A #N/A #N/A #N/A #N/A #N/A #N/A #N/A #N/A #N/A #N/A #N/A
2013 S1522 License Tax Surcharge Transfer 1.6 1.6 0.0 0.0 0.0 0.0 #N/A #N/A #N/A #N/A #N/A #N/A #N/A #N/A #N/A #N/A #N/A #N/A
2013 H7023 Department of Agriculture and Consumer Services - Weights and
Measures
0.2 0.2 0.0
0.0 0.0
0.0
#N/A #N/A
#N/A
#N/A #N/A #N/A #N/A #N/A #N/A #N/A #N/A #N/A
2013 H7065 Everglades Improvement and Management - Agriculture Privilege Tax 0.4 0.4 0.0 0.0 0.0 0.0 #N/A #N/A #N/A #N/A #N/A #N/A #N/A #N/A #N/A #N/A #N/A #N/A
2013 H7087 Department of Agriculture and Consumer Services - Babcock Ranch,
Livestock Haulers
0.1 0.1 0.0
0.0 0.0
0.0
#N/A #N/A
#N/A
#N/A #N/A #N/A #N/A #N/A #N/A #N/A #N/A #N/A
2014 H343 Car Sharing Services (0.1) (0.1) 0.0 (0.1) (0.1) 0.0 #N/A #N/A #N/A #N/A #N/A #N/A #N/A #N/A #N/A #N/A #N/A #N/A
2014 H5403 Surplus Lines (1.2) (1.2) 0.0 (1.3) (1.3) 0.0 #N/A #N/A #N/A #N/A #N/A #N/A #N/A #N/A #N/A #N/A #N/A #N/A
2015A S2502 Online Procurement System Fee 0.0 0.0 0.0 0.0 0.0 0.0 0.0 0.0 0.0 #N/A #N/A #N/A #N/A #N/A #N/A #N/A #N/A #N/A
2016 H303 Unlicensed Activity Fees (0.1) (0.1) 0.0 (0.1) (0.1) 0.0 (0.1) (0.1) 0.0 (0.1) (0.1) 0.0 #N/A #N/A #N/A #N/A #N/A #N/A
2016 H613 Workers' Compensation System Administration (0.1) (0.1) 0.0 (0.1) (0.1) 0.0 (0.1) (0.1) 0.0 (0.1) (0.1) 0.0 #N/A #N/A #N/A #N/A #N/A #N/A
2016 H772 Concealed Wespons License Fee Reduction (0.2) (0.2) 0.0 (0.2) (0.2) 0.0 (0.2) (0.2) 0.0 (0.2) (0.2) 0.0 #N/A #N/A #N/A #N/A #N/A #N/A
2016 H772 Fingerprint Retention 0.2 0.1 0.1 0.2 0.1 0.1 0.1 0.1 0.0 0.1 0.1 0.0 #N/A #N/A #N/A #N/A #N/A #N/A
2016 H772 License Fee Waivers for Veterans (0.1) (0.1) 0.0 (0.1) (0.1) 0.0 (0.1) (0.1) 0.0 (0.1) (0.1) 0.0 #N/A #N/A #N/A #N/A #N/A #N/A
2016 H7099 Wholesale Price 0.1 0.1 0.0 0.1 0.1 0.0 0.2 0.2 0.0 0.2 0.2 0.0 #N/A #N/A #N/A #N/A #N/A #N/A
2017 H467 Department of Agriculture and Consumer Services (0.2) (0.2) 0.0 (0.2) (0.2) 0.0 (0.2) (0.2) 0.0 (0.2) (0.2) 0.0 (0.2) (0.2) 0.0 #N/A #N/A #N/A
2017 H741 Various State Fees - Delinquency Fee Reduction (0.1) (0.1) 0.0 (0.1) (0.1) 0.0 (0.1) (0.1) 0.0 (0.1) (0.1) 0.0 (0.1) (0.1) 0.0 #N/A #N/A #N/A
2017 H741 Various State Fees - Surcharge Reduction on Building Permits (0.2) (0.2) 0.0 (0.2) (0.2) 0.0 (0.2) (0.2) 0.0 (0.2) (0.2) 0.0 (0.2) (0.2) 0.0 #N/A #N/A #N/A
2017 H5401 Agricultural Practices - Pesticide (0.2) (0.2) 0.0 (0.2) (0.2) 0.0 (0.2) (0.2) 0.0 (0.2) (0.2) 0.0 (0.2) (0.2) 0.0 #N/A #N/A #N/A
2017A 1A Reduction of Marriage License Fee (0.1) (0.1) 0.0 (0.1) (0.1) 0.0 (0.1) (0.1) 0.0 (0.1) (0.1) 0.0 (0.1) (0.1) 0.0 #N/A #N/A #N/A
2018 S622 Delete Licensure for Clinical Laboratories #N/A #N/A #N/A (0.1) (0.1) 0.0 (0.1) (0.1) 0.0 (0.1) (0.1) 0.0 (0.1) (0.1) 0.0 (0.1) (0.1) 0.0
2018 H29 DFS Fees #N/A #N/A #N/A (0.2) (0.2) 0.0 (0.2) (0.2) 0.0 (0.2) (0.2) 0.0 (0.2) (0.2) 0.0 (0.2) (0.2) 0.0
2018 H7087 Aviation Fuel Refunds (Section 28) #N/A #N/A #N/A 0.0 (1.1) 1.1 (0.8) (1.1) 0.3 (1.2) (1.2) 0.0 (1.2) (1.2) 0.0 (1.2) (1.3) 0.1
2018 H7087 Filing Fee Distribution Split #N/A #N/A #N/A * * 0.0 * * 0.0 * * 0.0 * * 0.0 * * 0.0
2018 H7087 Housing Finance Authorities #N/A #N/A #N/A (0.1) (0.1) 0.0 (0.1) (0.1) 0.0 (0.1) (0.1) 0.0 (0.1) (0.1) 0.0 (0.1) (0.1) 0.0
2018 H7087 Marriage License Fee Redirect #N/A #N/A #N/A 0.1 0.1 0.0 0.1 0.1 0.0 0.1 0.1 0.0 0.1 0.1 0.0 0.1 0.1 0.0
2018 H7087 Natural Gas Fuel Tax Delay #N/A #N/A #N/A (*) (0.1) 0.1 (0.1) (0.1) 0.0 (0.1) (0.1) 0.0 (0.1) (0.1) 0.0 (0.1) (0.1) 0.0
2018 H7087 Spousal Transfers - Homestead Property - Mortgage Only Consideration #N/A #N/A #N/A (0.1) (0.1) 0.0 (0.1) (0.1) 0.0 (0.1) (0.1) 0.0 (0.1) (0.1) 0.0 (0.1) (0.1) 0.0
2018 H7087 Traffic School Discount to Civil Penalty #N/A #N/A #N/A (0.1) (0.2) 0.1 (0.2) (0.2) 0.0 (0.2) (0.2) 0.0 (0.2) (0.2) 0.0 (0.2) (0.2) 0.0
2018 S740 Weights & Measures Repeal Extension #N/A #N/A #N/A 0.0 0.2 (0.2) 0.0 0.2 (0.2) 0.2 0.2 0.0 0.2 0.2 0.0 0.2 0.2 0.0
Service Charges Total (32.3) (32.3) 0.0 (2.9) (4.1) 1.2 (2.5) (2.6) 0.1 (2.7) (2.7) 0.0 (2.5) (2.5) 0.0 (1.7) (1.8) 0.1
Article V
2013 S1512 Clerks of Courts (33.6) (33.6) 0.0 0.0 0.0 0.0 #N/A #N/A #N/A #N/A #N/A #N/A #N/A #N/A #N/A #N/A #N/A #N/A
2013 H7125 Red Light Cameras - Timing - Hearings and Affidavits 0.0 0.0 0.0 0.0 0.0 0.0 #N/A #N/A #N/A #N/A #N/A #N/A #N/A #N/A #N/A #N/A #N/A #N/A
2013 H7125 RLC Affidavit, Violations in Lieu of Citations (0.1) (0.1) 0.0 0.0 0.0 0.0 #N/A #N/A #N/A #N/A #N/A #N/A #N/A #N/A #N/A #N/A #N/A #N/A
2017 S2506 Clerk of Court Fees (Sections 2 & 8) (9.6) (10.4) 0.8 (10.4) (10.4) 0.0 (10.4) (10.4) 0.0 (10.4) (10.4) 0.0 (10.4) (10.4) 0.0 #N/A #N/A #N/A
2017A H1A Shift Part Dissolution of Marriage Fee to GR 0.7 0.8 (0.1) 0.8 0.8 0.0 0.7 0.7 0.0 0.7 0.7 0.0 0.7 0.7 0.0 #N/A #N/A #N/A
2018 H7087 Filing Fee Distribution Split (Section 4) #N/A #N/A #N/A (*) (0.1) 0.1 (0.1) (0.1) 0.0 (0.1) (0.1) 0.0 (0.1) (0.1) 0.0 (0.1) (0.1) 0.0
2018 H7087 Marriage License Fee Redirect (Section 52) #N/A #N/A #N/A (0.8) (1.9) 1.1 (1.9) (1.9) 0.0 (1.9) (1.9) 0.0 (1.9) (1.9) 0.0 (1.9) (1.9) 0.0
2018 H7087 Secondary Distribution from GR to Miami-Dade Clerk (Section 3) #N/A #N/A #N/A (1.5) 0.0 (1.5) 0.0 0.0 0.0 0.0 0.0 0.0 0.0 0.0 0.0 0.0 0.0 0.0
2018 H7087 Traffic School Discount to Civil Penalty (Sections 46-47) #N/A #N/A #N/A 0.0 0.0 0.0 0.0 0.0 0.0 0.0 0.0 0.0 0.0 0.0 0.0 0.0 0.0 0.0
Article V Total (42.6) (43.3) 0.7 (11.9) (11.6) (0.3) (11.7) (11.7) 0.0 (11.7) (11.7) 0.0 (11.7) (11.7) 0.0
Other Taxes
2014 H773 Pugilistic Exhibtions (0.1) (0.1) 0.0 (0.1) (0.1) 0.0 #N/A #N/A #N/A #N/A #N/A #N/A #N/A #N/A #N/A #N/A #N/A #N/A
2017 H7109 Tax Administration (0.1) (0.2) 0.1 (0.2) (0.2) 0.0 (0.2) (0.2) 0.0 (0.2) (0.2) 0.0 (0.2) (0.2) 0.0 #N/A #N/A #N/A
Other Taxes Total (0.2) (0.3) 0.1 (0.3) (0.3) 0.0 (0.2) (0.2) 0.0 (0.2) (0.2) 0.0 (0.2) (0.2) 0.0
FCO Reversions
2010 H5505 Supplemental Filing Fee, Mandatory Late Fee 0.0 0.0 2.0 0.0 0.0 2.0 0.0 0.0 2.0 0.0 0.0 2.0 #N/A #N/A #N/A #N/A #N/A #N/A
FCO REVERSIONS TOTAL 0.0 0.0 2.0 0.0 0.0 2.0 0.0 0.0 2.0 0.0 0.0 2.0

FY17-18 FY18-19 FY19-20 FY20-21 FY21-22 FY22-23
Nonrec. Nonrec. Nonrec. Nonrec. Nonrec. Nonrec.
Sales Tax
Measures Affecting Revenue Non-Recurring Amount 23.2 8.7 (1.7) (1.4) 0.5 0.0
Adjustment for Enterprise Zone Sunset (0.6)
Hurricane Rebuilding Impact 125.1 117.8 0.0
Sales Tax Total 147.7 126.5 (1.7) (1.4) 0.5 0.0
Beverage Tax & Licenses
Measures Affecting Revenue Non-Recurring Amount 0.0 0.0 0.0 0.0 0.0 0.0
Beverage Tax & Licenses Total 0.0 0.0 0.0 0.0 0.0 0.0
Corporate Income Tax
Measures Affecting Revenue Non-Recurring Amount 74.7 (11.7) (85.4) 0.0 0.0 0.0
Adjustment for Enterprise Zone Sunset (1.5) 0.0
Weekend Due Date Adjustment (83.9) (0.6) 84.5
Corporate Income Tax Total (10.7) (12.3) (0.9) 0.0 0.0 0.0
Documentary Stamp Tax
Measures Affecting Revenue Non-Recurring Amount 0.0 0.0 0.0 0.0 0.0 0.0
Documentary Stamp Tax Total 0.0 0.0 0.0 0.0 0.0 0.0
Tobacco Taxes
Measures Affecting Revenue Non-Recurring Amount 0.0 0.0 0.0 0.0 0.0 0.0
Tobacco Taxes Total 0.0 0.0 0.0 0.0 0.0 0.0
Insurance Premium Tax
Measures Affecting Revenue Non-Recurring Amount 5.9 0.7 (0.1) 0.0 0.0 0.0
Insurance Premium Tax Total 5.9 0.7 (0.1) 0.0 0.0 0.0
Pari-Mutuels Tax
Measures Affecting Revenue Non-Recurring Amount 0.0 0.0 0.0 0.0 0.0 0.0
Pari-Mutuels Tax Total 0.0 0.0 0.0 0.0 0.0 0.0
Indian Gaming
Measures Affecting Revenue Non-Recurring Amount 0.0 0.0 0.0 0.0 0.0 0.0
Indian Gaming Conference Results 276.9 382.4 316.3 324.2 329.8 335.3
Indian Gaming Total 276.9 382.4 316.3 324.2 329.8 335.3
Highway Safety Licenses & Fees
Measures Affecting Revenue Non-Recurring Amount 0.2 0.0 0.0 0.0 0.0 0.0
Adjustment 0.0 0.0 0.0
Highway Safety Licenses & Fees Total 0.2 0.0 0.0 0.0 0.0 0.0
Counties' Medicaid Share
Measures Affecting Revenue Non-Recurring Amount 0.0 0.0 0.0 0.0 0.0 0.0
Adjust Non-Recurring to Equal Backlog Estimate 4.1 0.0 0.0
Counties' Medicaid Share Total 4.1 0.0 0.0 0.0 0.0 0.0
Severance Tax
Measures Affecting Revenue Non-Recurring Amount 0.0 0.0 0.0 0.0 0.0 0.0
Severance Tax Total 0.0 0.0 0.0 0.0 0.0 0.0
Service Charges
Measures Affecting Revenue Non-Recurring Amount 0.0 1.2 0.1 0.0 0.0 0.1
Service Charges Total 0.0 1.2 0.1 0.0 0.0 0.1
Corporate Filing Fees
Measures Affecting Revenue Non-Recurring Amount 0.0 0.0 0.0 0.0 0.0 0.0
Corporate Filing Fees Total 0.0 0.0 0.0 0.0 0.0 0.0
Article V
Measures Affecting Revenue Non-Recurring Amount 0.7 (0.3) 0.0 0.0 0.0 0.0
Article V Total 0.7 (0.3) 0.0 0.0 0.0 0.0
Other Taxes
Measures Affecting Revenue Non-Recurring Amount 0.1 0.0 0.0 0.0 0.0 0.0
Other Taxes Total 0.1 0.0 0.0 0.0 0.0 0.0
Grand Total 424.9 498.2 313.7 322.8 330.3 335.4
TABLE 2B- Adjustments to Measures Affecting Revenue and Tax Administration
Increase/(Decrease) in $ Millions

TABLE 3A 2017-18 GENERAL REVENUE ESTIMATES ($ Millions)
OLD EDR Diff. EOG Diff. DOR Diff. NEW Diff.
Estimates by EDR, EOG and DOR
Sales Tax 24,136.8 24,136.8 0.0 24,136.8 0.0 24,136.8 0.0 24,136.8 0.0
Corporate Income Tax 2,320.4 2,320.4 0.0 2,320.4 0.0 2,320.4 0.0 2,320.4 0.0
Documentary Stamp Tax 867.9 867.9 0.0 867.9 0.0 867.9 0.0 867.9 0.0
Insurance Premium Tax 769.6 769.6 0.0 769.6 0.0 769.6 0.0 769.6 0.0
Intangibles Taxes 382.2 382.2 0.0 382.2 0.0 382.2 0.0 382.2 0.0
Severance Taxes 11.1 11.1 0.0 11.1 0.0 11.1 0.0 11.1 0.0---------- ---------- ------- ---------- ------- ---------- ------- ---------- -------
SUBTOTAL GR 28,488.0 28,488.0 0.0 28,488.0 0.0 28,488.0 0.0 28,488.0 0.0
Less: Refunds 355.8 355.8 0.0 355.8 0.0 355.8 0.0 355.8 0.0======== ======== ===== ======== ===== ======== ===== ======== =====
SUBTOTAL NET GR 28,132.2 28,132.2 0.0 28,132.2 0.0 28,132.2 0.0 28,132.2 0.0
Estimates by EDR and EOG
Beverage Taxes & Licenses 283.1 283.1 0.0 283.1 0.0 #N/A #N/A 283.1 0.0
Pari-mutuel Taxes 22.4 22.4 0.0 22.4 0.0 #N/A #N/A 22.4 0.0
Earnings on Investments 169.5 169.5 0.0 169.5 0.0 #N/A #N/A 169.5 0.0
Counties' Medicaid Share 292.0 292.0 0.0 292.0 0.0 #N/A #N/A 292.0 0.0
Corporate Filing Fees 356.0 356.0 0.0 356.0 0.0 #N/A #N/A 356.0 0.0
Service Charges 473.3 473.3 0.0 473.3 0.0 #N/A #N/A 473.3 0.0
Other Taxes, Lic. & Fees 39.0 39.0 0.0 39.0 0.0 #N/A #N/A 39.0 0.0
Other Nonop. Revenue 151.7 151.7 0.0 151.7 0.0 #N/A #N/A 151.7 0.0---------- ---------- ------- ---------- ------- ---------- ------- ---------- -------
SUBTOTAL GR 1,787.0 1,787.0 0.0 1,787.0 0.0 #N/A #N/A 1,787.0 0.0
Estimates adopted at other Conferences
Tobacco Taxes 175.5 175.5 0.0 175.5 0.0 175.5 0.0 175.5 0.0
Indian Gaming Revenues 276.9 276.9 0.0 276.9 0.0 276.9 0.0 276.9 0.0
Highway Safety Lic. & Fees 533.0 533.0 0.0 533.0 0.0 533.0 0.0 533.0 0.0
Article V Fees 108.4 108.4 0.0 108.4 0.0 108.4 0.0 108.4 0.0---------- ---------- ------- ---------- ------- ---------- ------- ---------- -------
SUBTOTAL GR 1,093.8 1,093.8 0.0 1,093.8 0.0 1,093.8 0.0 1,093.8 0.0
Total All Estimates
TOTAL GR 31,368.8 31,368.8 0.0 31,368.8 0.0 #N/A #N/A 31,368.8 0.0
Less: Refunds 355.8 355.8 0.0 355.8 0.0 355.8 0.0 355.8 0.0======== ======== ===== ======== ===== ======== ===== ======== =====
TOTAL NET GR 31,013.0 31,013.0 0.0 31,013.0 0.0 #N/A #N/A 31,013.0 0.0
% change from prior year 4.8% 4.8% 4.8% #N/A 4.8%
Page 1

TABLE 3B2017-18 GENERAL REVENUE ESTIMATES ($ Millions) - RECURRING and NONRECURRING
**NONRECURRING** OLD EDR Diff. EOG Diff. DOR Diff. NEW Diff.
Estimates by EDR, EOG and DOR
Sales Tax 147.7 147.7 0.0 147.7 0.0 147.7 0.0 147.7 0.0
Corporate Income Tax (10.7) (10.7) 0.0 (10.7) 0.0 (10.7) 0.0 (10.7) 0.0
Documentary Stamp Tax 0.0 0.0 0.0 0.0 0.0 0.0 0.0 0.0 0.0
Insurance Premium Tax 5.9 5.9 0.0 5.9 0.0 5.9 0.0 5.9 0.0
Intangibles Taxes 0.0 0.0 0.0 0.0 0.0 0.0 0.0 0.0 0.0
Severance Taxes 0.0 0.0 0.0 0.0 0.0 0.0 0.0 0.0 0.0---------- ---------- ------- ---------- ------- ---------- ------- ---------- -------
SUBTOTAL GR 142.9 142.9 0.0 142.9 0.0 142.9 0.0 142.9 0.0
Less: Refunds 18.8 18.8 0.0 18.8 0.0 18.8 0.0 18.8 0.0======== ======== ===== ======== ===== ======== ===== ======== =====
SUBTOTAL NET GR 124.1 124.1 0.0 124.1 0.0 124.1 0.0 124.1 0.0
Estimates by EDR and EOG
Beverage Taxes & Licenses 0.0 0.0 0.0 0.0 0.0 #N/A #N/A 0.0 0.0
Pari-mutuel Taxes 0.0 0.0 0.0 0.0 0.0 #N/A #N/A 0.0 0.0
Earnings on Investments 0.0 0.0 0.0 0.0 0.0 #N/A #N/A 0.0 0.0
Counties' Medicaid Share 4.1 4.1 0.0 4.1 0.0 #N/A #N/A 4.1 0.0
Corporate Filing Fees 0.0 0.0 0.0 0.0 0.0 #N/A #N/A 0.0 0.0
Service Charges 0.0 0.0 0.0 0.0 0.0 #N/A #N/A 0.0 0.0
Other Taxes, Lic. & Fees 0.1 0.1 0.0 0.1 0.0 #N/A #N/A 0.1 0.0
Other Nonop. Revenue 0.0 0.0 0.0 0.0 0.0 #N/A #N/A 0.0 0.0---------- ---------- ------- ---------- ------- ---------- ------- ---------- -------
SUBTOTAL GR 4.2 4.2 0.0 4.2 0.0 #N/A #N/A 4.2 0.0
Estimates adopted at other Conferences
Tobacco Taxes 0.0 0.0 0.0 0.0 0.0 0.0 0.0 0.0 0.0
Indian Gaming Revenues 276.9 276.9 0.0 276.9 0.0 276.9 0.0 276.9 0.0
Highway Safety Lic. & Fees 0.2 0.2 0.0 0.2 0.0 0.2 0.0 0.2 0.0
Article V Fees 0.7 0.7 0.0 0.7 0.0 0.7 0.0 0.7 0.0---------- ---------- ------- ---------- ------- ---------- ------- ---------- -------
SUBTOTAL GR 277.8 277.8 0.0 277.8 0.0 277.8 0.0 277.8 0.0
Total All Estimates
TOTAL GR 424.9 424.9 0.0 424.9 0.0 #N/A #N/A 424.9 0.0
Less: Refunds 18.8 18.8 0.0 18.8 0.0 18.8 0.0 18.8 0.0======== ======== ===== ======== ===== ======== ===== ======== =====
TOTAL NET GR 406.1 406.1 0.0 406.1 0.0 #N/A #N/A 406.1 0.0
----- RECURRING -----
NET GENERAL REVENUE 30,606.9 30,606.9 0.0 30,606.9 0.0 #N/A #N/A 30,606.9 0.0
Page 2
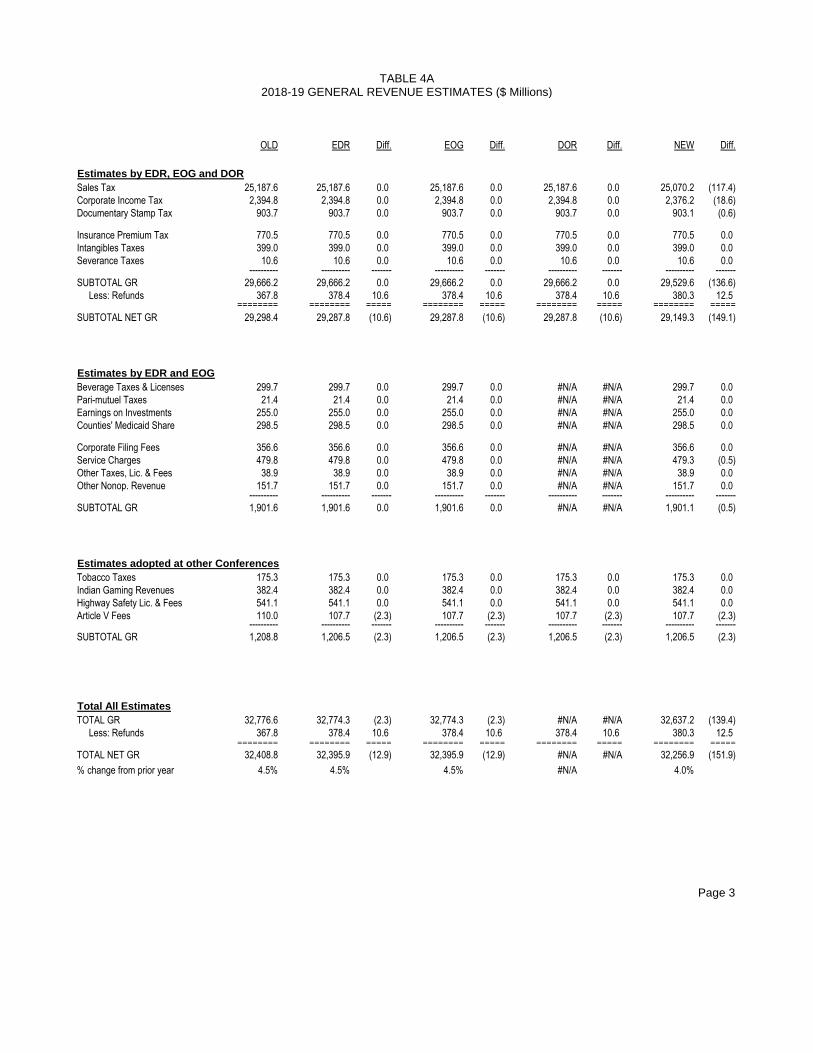
TABLE 4A2018-19 GENERAL REVENUE ESTIMATES ($ Millions)
OLD EDR Diff. EOG Diff. DOR Diff. NEW Diff.
Estimates by EDR, EOG and DOR
Sales Tax 25,187.6 25,187.6 0.0 25,187.6 0.0 25,187.6 0.0 25,070.2 (117.4)
Corporate Income Tax 2,394.8 2,394.8 0.0 2,394.8 0.0 2,394.8 0.0 2,376.2 (18.6)
Documentary Stamp Tax 903.7 903.7 0.0 903.7 0.0 903.7 0.0 903.1 (0.6)
Insurance Premium Tax 770.5 770.5 0.0 770.5 0.0 770.5 0.0 770.5 0.0
Intangibles Taxes 399.0 399.0 0.0 399.0 0.0 399.0 0.0 399.0 0.0
Severance Taxes 10.6 10.6 0.0 10.6 0.0 10.6 0.0 10.6 0.0---------- ---------- ------- ---------- ------- ---------- ------- ---------- -------
SUBTOTAL GR 29,666.2 29,666.2 0.0 29,666.2 0.0 29,666.2 0.0 29,529.6 (136.6)
Less: Refunds 367.8 378.4 10.6 378.4 10.6 378.4 10.6 380.3 12.5======== ======== ===== ======== ===== ======== ===== ======== =====
SUBTOTAL NET GR 29,298.4 29,287.8 (10.6) 29,287.8 (10.6) 29,287.8 (10.6) 29,149.3 (149.1)
Estimates by EDR and EOG
Beverage Taxes & Licenses 299.7 299.7 0.0 299.7 0.0 #N/A #N/A 299.7 0.0
Pari-mutuel Taxes 21.4 21.4 0.0 21.4 0.0 #N/A #N/A 21.4 0.0
Earnings on Investments 255.0 255.0 0.0 255.0 0.0 #N/A #N/A 255.0 0.0
Counties' Medicaid Share 298.5 298.5 0.0 298.5 0.0 #N/A #N/A 298.5 0.0
Corporate Filing Fees 356.6 356.6 0.0 356.6 0.0 #N/A #N/A 356.6 0.0
Service Charges 479.8 479.8 0.0 479.8 0.0 #N/A #N/A 479.3 (0.5)
Other Taxes, Lic. & Fees 38.9 38.9 0.0 38.9 0.0 #N/A #N/A 38.9 0.0
Other Nonop. Revenue 151.7 151.7 0.0 151.7 0.0 #N/A #N/A 151.7 0.0---------- ---------- ------- ---------- ------- ---------- ------- ---------- -------
SUBTOTAL GR 1,901.6 1,901.6 0.0 1,901.6 0.0 #N/A #N/A 1,901.1 (0.5)
Estimates adopted at other Conferences
Tobacco Taxes 175.3 175.3 0.0 175.3 0.0 175.3 0.0 175.3 0.0
Indian Gaming Revenues 382.4 382.4 0.0 382.4 0.0 382.4 0.0 382.4 0.0
Highway Safety Lic. & Fees 541.1 541.1 0.0 541.1 0.0 541.1 0.0 541.1 0.0
Article V Fees 110.0 107.7 (2.3) 107.7 (2.3) 107.7 (2.3) 107.7 (2.3)---------- ---------- ------- ---------- ------- ---------- ------- ---------- -------
SUBTOTAL GR 1,208.8 1,206.5 (2.3) 1,206.5 (2.3) 1,206.5 (2.3) 1,206.5 (2.3)
Total All Estimates
TOTAL GR 32,776.6 32,774.3 (2.3) 32,774.3 (2.3) #N/A #N/A 32,637.2 (139.4)
Less: Refunds 367.8 378.4 10.6 378.4 10.6 378.4 10.6 380.3 12.5======== ======== ===== ======== ===== ======== ===== ======== =====
TOTAL NET GR 32,408.8 32,395.9 (12.9) 32,395.9 (12.9) #N/A #N/A 32,256.9 (151.9)
% change from prior year 4.5% 4.5% 4.5% #N/A 4.0%
Page 3

TABLE 4B2018-19 GENERAL REVENUE ESTIMATES ($ Millions) - RECURRING and NONRECURRING
**NONRECURRING** OLD EDR Diff. EOG Diff. DOR Diff. NEW Diff.
Estimates by EDR, EOG and DOR
Sales Tax 116.8 116.8 0.0 116.8 0.0 116.8 0.0 126.5 9.7
Corporate Income Tax (3.7) (3.7) 0.0 (3.7) 0.0 (3.7) 0.0 (12.3) (8.6)
Documentary Stamp Tax 0.0 0.0 0.0 0.0 0.0 0.0 0.0 0.0 0.0
Insurance Premium Tax 0.7 0.7 0.0 0.7 0.0 0.7 0.0 0.7 0.0
Intangibles Taxes 0.0 0.0 0.0 0.0 0.0 0.0 0.0 0.0 0.0
Severance Taxes 0.0 0.0 0.0 0.0 0.0 0.0 0.0 0.0 0.0---------- ---------- ------- ---------- ------- ---------- ------- ---------- -------
SUBTOTAL GR 113.8 113.8 0.0 113.8 0.0 113.8 0.0 114.9 1.1
Less: Refunds 0.0 0.0 0.0 0.0 0.0 0.0 0.0 12.5 12.5======== ======== ===== ======== ===== ======== ===== ======== =====
SUBTOTAL NET GR 113.8 113.8 0.0 113.8 0.0 113.8 0.0 102.4 (11.4)
Estimates by EDR and EOG
Beverage Taxes & Licenses 0.0 0.0 0.0 0.0 0.0 #N/A #N/A 0.0 0.0
Pari-mutuel Taxes 0.0 0.0 0.0 0.0 0.0 #N/A #N/A 0.0 0.0
Earnings on Investments 0.0 0.0 0.0 0.0 0.0 #N/A #N/A 0.0 0.0
Counties' Medicaid Share 0.0 0.0 0.0 0.0 0.0 #N/A #N/A 0.0 0.0
Corporate Filing Fees 0.0 0.0 0.0 0.0 0.0 #N/A #N/A 0.0 0.0
Service Charges 0.1 0.1 0.0 0.1 0.0 #N/A #N/A 1.2 1.1
Other Taxes, Lic. & Fees 0.0 0.0 0.0 0.0 0.0 #N/A #N/A 0.0 0.0
Other Nonop. Revenue 0.0 0.0 0.0 0.0 0.0 #N/A #N/A 0.0 0.0---------- ---------- ------- ---------- ------- ---------- ------- ---------- -------
SUBTOTAL GR 0.1 0.1 0.0 0.1 0.0 #N/A #N/A 1.2 1.1
Estimates adopted at other Conferences
Tobacco Taxes 0.0 0.0 0.0 0.0 0.0 0.0 0.0 0.0 0.0
Indian Gaming Revenues 382.4 382.4 0.0 382.4 0.0 382.4 0.0 382.4 0.0
Highway Safety Lic. & Fees 0.0 0.0 0.0 0.0 0.0 0.0 0.0 0.0 0.0
Article V Fees 0.0 (0.3) (0.3) (0.3) (0.3) (0.3) (0.3) (0.3) (0.3)---------- ---------- ------- ---------- ------- ---------- ------- ---------- -------
SUBTOTAL GR 382.4 382.1 (0.3) 382.1 (0.3) 382.1 (0.3) 382.1 (0.3)
Total All Estimates
TOTAL GR 496.3 496.0 (0.3) 496.0 (0.3) #N/A #N/A 498.2 1.9
Less: Refunds 0.0 0.0 0.0 0.0 0.0 0.0 0.0 12.5 12.5======== ======== ===== ======== ===== ======== ===== ======== =====
TOTAL NET GR 496.3 496.0 (0.3) 496.0 (0.3) #N/A #N/A 485.7 (10.6)
----- RECURRING -----
NET GENERAL REVENUE 31,912.5 31,899.9 (12.6) 31,899.9 (12.6) #N/A #N/A 31,771.2 (141.3)
Page 4

TABLE 5A2019-20 GENERAL REVENUE ESTIMATES ($ Millions)
OLD EDR Diff. EOG Diff. DOR Diff. NEW Diff.
Estimates by EDR, EOG and DOR
Sales Tax 26,146.4 26,146.4 0.0 26,146.4 0.0 26,146.4 0.0 26,017.7 (128.7)
Corporate Income Tax 2,404.7 2,404.7 0.0 2,404.7 0.0 2,404.7 0.0 2,394.7 (10.0)
Documentary Stamp Tax 937.9 937.9 0.0 937.9 0.0 937.9 0.0 937.3 (0.6)
Insurance Premium Tax 811.6 811.6 0.0 811.6 0.0 811.6 0.0 811.6 0.0
Intangibles Taxes 414.5 414.5 0.0 414.5 0.0 414.5 0.0 414.5 0.0
Severance Taxes 10.5 10.5 0.0 10.5 0.0 10.5 0.0 10.5 0.0---------- ---------- ------- ---------- ------- ---------- ------- ---------- -------
SUBTOTAL GR 30,725.6 30,725.6 0.0 30,725.6 0.0 30,725.6 0.0 30,586.3 (139.3)
Less: Refunds 362.5 364.8 2.3 364.8 2.3 364.8 2.3 364.8 2.3======== ======== ===== ======== ===== ======== ===== ======== =====
SUBTOTAL NET GR 30,363.1 30,360.8 (2.3) 30,360.8 (2.3) 30,360.8 (2.3) 30,221.5 (141.6)
Estimates by EDR and EOG
Beverage Taxes & Licenses 312.5 312.5 0.0 312.5 0.0 #N/A #N/A 312.5 0.0
Pari-mutuel Taxes 21.3 21.3 0.0 21.3 0.0 #N/A #N/A 21.3 0.0
Earnings on Investments 311.9 311.9 0.0 311.9 0.0 #N/A #N/A 311.9 0.0
Counties' Medicaid Share 312.4 312.4 0.0 312.4 0.0 #N/A #N/A 312.4 0.0
Corporate Filing Fees 362.3 362.3 0.0 362.3 0.0 #N/A #N/A 362.3 0.0
Service Charges 483.8 483.8 0.0 483.8 0.0 #N/A #N/A 482.3 (1.5)
Other Taxes, Lic. & Fees 38.7 38.7 0.0 38.7 0.0 #N/A #N/A 38.7 0.0
Other Nonop. Revenue 151.5 151.5 0.0 151.5 0.0 #N/A #N/A 151.5 0.0---------- ---------- ------- ---------- ------- ---------- ------- ---------- -------
SUBTOTAL GR 1,994.4 1,994.4 0.0 1,994.4 0.0 #N/A #N/A 1,992.9 (1.5)
Estimates adopted at other Conferences
Tobacco Taxes 174.4 174.4 0.0 174.4 0.0 174.4 0.0 174.4 0.0
Indian Gaming Revenues 316.3 316.3 0.0 316.3 0.0 316.3 0.0 316.3 0.0
Highway Safety Lic. & Fees 546.0 546.0 0.0 546.0 0.0 546.0 0.0 546.0 0.0
Article V Fees 105.1 103.1 (2.0) 103.1 (2.0) 103.1 (2.0) 103.1 (2.0)---------- ---------- ------- ---------- ------- ---------- ------- ---------- -------
SUBTOTAL GR 1,141.8 1,139.8 (2.0) 1,139.8 (2.0) 1,139.8 (2.0) 1,139.8 (2.0)
Total All Estimates
TOTAL GR 33,861.8 33,859.8 (2.0) 33,859.8 (2.0) #N/A #N/A 33,719.0 (142.8)
Less: Refunds 362.5 364.8 2.3 364.8 2.3 364.8 2.3 364.8 2.3======== ======== ===== ======== ===== ======== ===== ======== =====
TOTAL NET GR 33,499.3 33,495.0 (4.3) 33,495.0 (4.3) #N/A #N/A 33,354.2 (145.1)
% change from prior year 3.4% 3.4% 3.4% #N/A 3.4%
Page 5

TABLE 5B2019-20 GENERAL REVENUE ESTIMATES ($ Millions) - RECURRING and NONRECURRING
**NONRECURRING** OLD EDR Diff. EOG Diff. DOR Diff. NEW Diff.
Estimates by EDR, EOG and DOR
Sales Tax (1.6) (1.6) 0.0 (1.6) 0.0 (1.6) 0.0 (1.7) (0.1)
Corporate Income Tax (0.9) (0.9) 0.0 (0.9) 0.0 (0.9) 0.0 (0.9) 0.0
Documentary Stamp Tax 0.0 0.0 0.0 0.0 0.0 0.0 0.0 0.0 0.0
Insurance Premium Tax (0.1) (0.1) 0.0 (0.1) 0.0 (0.1) 0.0 (0.1) 0.0
Intangibles Taxes 0.0 0.0 0.0 0.0 0.0 0.0 0.0 0.0 0.0
Severance Taxes 0.0 0.0 0.0 0.0 0.0 0.0 0.0 0.0 0.0---------- ---------- ------- ---------- ------- ---------- ------- ---------- -------
SUBTOTAL GR (2.6) (2.6) 0.0 (2.6) 0.0 (2.6) 0.0 (2.7) (0.1)
Less: Refunds 0.0 0.0 0.0 0.0 0.0 0.0 0.0 2.3 2.3======== ======== ===== ======== ===== ======== ===== ======== =====
SUBTOTAL NET GR (2.6) (2.6) 0.0 (2.6) 0.0 (2.6) 0.0 (5.0) (2.4)
Estimates by EDR and EOG
Beverage Taxes & Licenses 0.0 0.0 0.0 0.0 0.0 #N/A #N/A 0.0 0.0
Pari-mutuel Taxes 0.0 0.0 0.0 0.0 0.0 #N/A #N/A 0.0 0.0
Earnings on Investments 0.0 0.0 0.0 0.0 0.0 #N/A #N/A 0.0 0.0
Counties' Medicaid Share 0.0 0.0 0.0 0.0 0.0 #N/A #N/A 0.0 0.0
Corporate Filing Fees 0.0 0.0 0.0 0.0 0.0 #N/A #N/A 0.0 0.0
Service Charges 0.0 0.0 0.0 0.0 0.0 #N/A #N/A 0.1 0.1
Other Taxes, Lic. & Fees 0.0 0.0 0.0 0.0 0.0 #N/A #N/A 0.0 0.0
Other Nonop. Revenue 0.0 0.0 0.0 0.0 0.0 #N/A #N/A 0.0 0.0---------- ---------- ------- ---------- ------- ---------- ------- ---------- -------
SUBTOTAL GR 0.0 0.0 0.0 0.0 0.0 #N/A #N/A 0.1 0.1
Estimates adopted at other Conferences
Tobacco Taxes 0.0 0.0 0.0 0.0 0.0 0.0 0.0 0.0 0.0
Indian Gaming Revenues 316.3 316.3 0.0 316.3 0.0 316.3 0.0 316.3 0.0
Highway Safety Lic. & Fees 0.0 0.0 0.0 0.0 0.0 0.0 0.0 0.0 0.0
Article V Fees 0.0 0.0 0.0 0.0 0.0 0.0 0.0 0.0 0.0---------- ---------- ------- ---------- ------- ---------- ------- ---------- -------
SUBTOTAL GR 316.3 316.3 0.0 316.3 0.0 316.3 0.0 316.3 0.0
Total All Estimates
TOTAL GR 313.7 313.7 0.0 313.7 0.0 #N/A #N/A 313.7 0.0
Less: Refunds 0.0 0.0 0.0 0.0 0.0 0.0 0.0 2.3 2.3======== ======== ===== ======== ===== ======== ===== ======== =====
TOTAL NET GR 313.7 313.7 0.0 313.7 0.0 #N/A #N/A 311.4 (2.3)
----- RECURRING -----
NET GENERAL REVENUE 33,185.6 33,181.3 (4.3) 33,181.3 (4.3) #N/A #N/A 33,042.8 (142.8)
Page 6

TABLE 6A2020-21 GENERAL REVENUE ESTIMATES ($ Millions)
OLD EDR Diff. EOG Diff. DOR Diff. NEW Diff.
Estimates by EDR, EOG and DOR
Sales Tax 27,210.0 27,210.0 0.0 27,210.0 0.0 27,210.0 0.0 27,080.0 (130.0)
Corporate Income Tax 2,451.1 2,451.1 0.0 2,451.1 0.0 2,451.1 0.0 2,441.1 (10.0)
Documentary Stamp Tax 969.0 969.0 0.0 969.0 0.0 969.0 0.0 968.3 (0.7)
Insurance Premium Tax 830.7 830.7 0.0 830.7 0.0 830.7 0.0 830.7 0.0
Intangibles Taxes 429.9 429.9 0.0 429.9 0.0 429.9 0.0 429.9 0.0
Severance Taxes 10.9 10.9 0.0 10.9 0.0 10.9 0.0 10.9 0.0---------- ---------- ------- ---------- ------- ---------- ------- ---------- -------
SUBTOTAL GR 31,901.6 31,901.6 0.0 31,901.6 0.0 31,901.6 0.0 31,760.9 (140.7)
Less: Refunds 364.5 364.5 0.0 364.5 0.0 364.5 0.0 364.5 0.0======== ======== ===== ======== ===== ======== ===== ======== =====
SUBTOTAL NET GR 31,537.1 31,537.1 0.0 31,537.1 0.0 31,537.1 0.0 31,396.4 (140.7)
Estimates by EDR and EOG
Beverage Taxes & Licenses 324.5 324.5 0.0 324.5 0.0 #N/A #N/A 324.5 0.0
Pari-mutuel Taxes 21.4 21.4 0.0 21.4 0.0 #N/A #N/A 21.4 0.0
Earnings on Investments 330.1 330.1 0.0 330.1 0.0 #N/A #N/A 330.1 0.0
Counties' Medicaid Share 303.6 303.6 0.0 303.6 0.0 #N/A #N/A 303.6 0.0
Corporate Filing Fees 367.9 367.9 0.0 367.9 0.0 #N/A #N/A 367.9 0.0
Service Charges 492.8 492.8 0.0 492.8 0.0 #N/A #N/A 491.1 (1.7)
Other Taxes, Lic. & Fees 38.7 38.7 0.0 38.7 0.0 #N/A #N/A 38.7 0.0
Other Nonop. Revenue 151.4 151.4 0.0 151.4 0.0 #N/A #N/A 151.4 0.0---------- ---------- ------- ---------- ------- ---------- ------- ---------- -------
SUBTOTAL GR 2,030.3 2,030.3 0.0 2,030.3 0.0 #N/A #N/A 2,028.6 (1.7)
Estimates adopted at other Conferences
Tobacco Taxes 172.4 172.4 0.0 172.4 0.0 172.4 0.0 172.4 0.0
Indian Gaming Revenues 324.2 324.2 0.0 324.2 0.0 324.2 0.0 324.2 0.0
Highway Safety Lic. & Fees 543.8 543.8 0.0 543.8 0.0 543.8 0.0 543.8 0.0
Article V Fees 104.6 102.6 (2.0) 102.6 (2.0) 102.6 (2.0) 102.6 (2.0)---------- ---------- ------- ---------- ------- ---------- ------- ---------- -------
SUBTOTAL GR 1,145.0 1,143.0 (2.0) 1,143.0 (2.0) 1,143.0 (2.0) 1,143.0 (2.0)
Total All Estimates
TOTAL GR 35,077.0 35,075.0 (2.0) 35,075.0 (2.0) #N/A #N/A 34,932.6 (144.4)
Less: Refunds 364.5 364.5 0.0 364.5 0.0 364.5 0.0 364.5 0.0======== ======== ===== ======== ===== ======== ===== ======== =====
TOTAL NET GR 34,712.5 34,710.5 (2.0) 34,710.5 (2.0) #N/A #N/A 34,568.1 (144.4)
% change from prior year 3.6% 3.6% 3.6% #N/A 3.6%
Page 7

TABLE 6B2020-21 GENERAL REVENUE ESTIMATES ($ Millions) - RECURRING and NONRECURRING
**NONRECURRING** OLD EDR Diff. EOG Diff. DOR Diff. NEW Diff.
Estimates by EDR, EOG and DOR
Sales Tax (1.4) (1.4) 0.0 (1.4) 0.0 (1.4) 0.0 (1.4) 0.0
Corporate Income Tax 0.0 0.0 0.0 0.0 0.0 0.0 0.0 0.0 0.0
Documentary Stamp Tax 0.0 0.0 0.0 0.0 0.0 0.0 0.0 0.0 0.0
Insurance Premium Tax 0.0 0.0 0.0 0.0 0.0 0.0 0.0 0.0 0.0
Intangibles Taxes 0.0 0.0 0.0 0.0 0.0 0.0 0.0 0.0 0.0
Severance Taxes 0.0 0.0 0.0 0.0 0.0 0.0 0.0 0.0 0.0---------- ---------- ------- ---------- ------- ---------- ------- ---------- -------
SUBTOTAL GR (1.4) (1.4) 0.0 (1.4) 0.0 (1.4) 0.0 (1.4) 0.0
Less: Refunds 0.0 0.0 0.0 0.0 0.0 0.0 0.0 0.0 0.0======== ======== ===== ======== ===== ======== ===== ======== =====
SUBTOTAL NET GR (1.4) (1.4) 0.0 (1.4) 0.0 (1.4) 0.0 (1.4) 0.0
Estimates by EDR and EOG
Beverage Taxes & Licenses 0.0 0.0 0.0 0.0 0.0 #N/A #N/A 0.0 0.0
Pari-mutuel Taxes 0.0 0.0 0.0 0.0 0.0 #N/A #N/A 0.0 0.0
Earnings on Investments 0.0 0.0 0.0 0.0 0.0 #N/A #N/A 0.0 0.0
Counties' Medicaid Share 0.0 0.0 0.0 0.0 0.0 #N/A #N/A 0.0 0.0
Corporate Filing Fees 0.0 0.0 0.0 0.0 0.0 #N/A #N/A 0.0 0.0
Service Charges 0.0 0.0 0.0 0.0 0.0 #N/A #N/A 0.0 0.0
Other Taxes, Lic. & Fees 0.0 0.0 0.0 0.0 0.0 #N/A #N/A 0.0 0.0
Other Nonop. Revenue 0.0 0.0 0.0 0.0 0.0 #N/A #N/A 0.0 0.0---------- ---------- ------- ---------- ------- ---------- ------- ---------- -------
SUBTOTAL GR 0.0 0.0 0.0 0.0 0.0 #N/A #N/A 0.0 0.0
Estimates adopted at other Conferences
Tobacco Taxes 0.0 0.0 0.0 0.0 0.0 0.0 0.0 0.0 0.0
Indian Gaming Revenues 324.2 324.2 0.0 324.2 0.0 324.2 0.0 324.2 0.0
Highway Safety Lic. & Fees 0.0 0.0 0.0 0.0 0.0 0.0 0.0 0.0 0.0
Article V Fees 0.0 0.0 0.0 0.0 0.0 0.0 0.0 0.0 0.0---------- ---------- ------- ---------- ------- ---------- ------- ---------- -------
SUBTOTAL GR 324.2 324.2 0.0 324.2 0.0 324.2 0.0 324.2 0.0
Total All Estimates
TOTAL GR 322.8 322.8 0.0 322.8 0.0 #N/A #N/A 322.8 0.0
Less: Refunds 0.0 0.0 0.0 0.0 0.0 0.0 0.0 0.0 0.0======== ======== ===== ======== ===== ======== ===== ======== =====
TOTAL NET GR 322.8 322.8 0.0 322.8 0.0 #N/A #N/A 322.8 0.0
----- RECURRING -----
NET GENERAL REVENUE 34,389.7 34,387.7 (2.0) 34,387.7 (2.0) #N/A #N/A 34,245.3 (144.4)
Page 8

TABLE 7A2021-22 GENERAL REVENUE ESTIMATES ($ Millions)
OLD EDR Diff. EOG Diff. DOR Diff. NEW Diff.
Estimates by EDR, EOG and DOR
Sales Tax 28,281.6 28,281.6 0.0 28,281.6 0.0 28,281.6 0.0 28,150.3 (131.3)
Corporate Income Tax 2,507.5 2,507.5 0.0 2,507.5 0.0 2,507.5 0.0 2,497.5 (10.0)
Documentary Stamp Tax 1,001.4 1,001.4 0.0 1,001.4 0.0 1,001.4 0.0 1,000.7 (0.7)
Insurance Premium Tax 861.8 861.8 0.0 861.8 0.0 861.8 0.0 861.8 0.0
Intangibles Taxes 445.3 445.3 0.0 445.3 0.0 445.3 0.0 445.3 0.0
Severance Taxes 11.3 11.3 0.0 11.3 0.0 11.3 0.0 11.3 0.0---------- ---------- ------- ---------- ------- ---------- ------- ---------- -------
SUBTOTAL GR 33,108.9 33,108.9 0.0 33,108.9 0.0 33,108.9 0.0 32,966.9 (142.0)
Less: Refunds 369.8 369.8 0.0 369.8 0.0 369.8 0.0 369.8 0.0======== ======== ===== ======== ===== ======== ===== ======== =====
SUBTOTAL NET GR 32,739.1 32,739.1 0.0 32,739.1 0.0 32,739.1 0.0 32,597.1 (142.0)
Estimates by EDR and EOG
Beverage Taxes & Licenses 336.6 336.6 0.0 336.6 0.0 #N/A #N/A 336.6 0.0
Pari-mutuel Taxes 21.4 21.4 0.0 21.4 0.0 #N/A #N/A 21.4 0.0
Earnings on Investments 339.6 339.6 0.0 339.6 0.0 #N/A #N/A 339.6 0.0
Counties' Medicaid Share 322.2 322.2 0.0 322.2 0.0 #N/A #N/A 322.2 0.0
Corporate Filing Fees 372.6 372.6 0.0 372.6 0.0 #N/A #N/A 372.6 0.0
Service Charges 496.9 496.9 0.0 496.9 0.0 #N/A #N/A 495.2 (1.7)
Other Taxes, Lic. & Fees 38.7 38.7 0.0 38.7 0.0 #N/A #N/A 38.7 0.0
Other Nonop. Revenue 145.6 145.6 0.0 145.6 0.0 #N/A #N/A 145.6 0.0---------- ---------- ------- ---------- ------- ---------- ------- ---------- -------
SUBTOTAL GR 2,073.6 2,073.6 0.0 2,073.6 0.0 #N/A #N/A 2,071.9 (1.7)
Estimates adopted at other Conferences
Tobacco Taxes 174.3 174.3 0.0 174.3 0.0 174.3 0.0 174.3 0.0
Indian Gaming Revenues 329.8 329.8 0.0 329.8 0.0 329.8 0.0 329.8 0.0
Highway Safety Lic. & Fees 531.6 531.6 0.0 531.6 0.0 531.6 0.0 531.6 0.0
Article V Fees 103.7 101.7 (2.0) 101.7 (2.0) 101.7 (2.0) 101.7 (2.0)---------- ---------- ------- ---------- ------- ---------- ------- ---------- -------
SUBTOTAL GR 1,139.4 1,137.4 (2.0) 1,137.4 (2.0) 1,137.4 (2.0) 1,137.4 (2.0)
Total All Estimates
TOTAL GR 36,322.0 36,320.0 (2.0) 36,320.0 (2.0) #N/A #N/A 36,176.3 (145.7)
Less: Refunds 369.8 369.8 0.0 369.8 0.0 369.8 0.0 369.8 0.0======== ======== ===== ======== ===== ======== ===== ======== =====
TOTAL NET GR 35,952.2 35,950.2 (2.0) 35,950.2 (2.0) #N/A #N/A 35,806.5 (145.7)
% change from prior year 3.6% 3.6% 3.6% #N/A 3.6%
Page 9

TABLE 7B2021-22 GENERAL REVENUE ESTIMATES ($ Millions) - RECURRING and NONRECURRING
**NONRECURRING** OLD EDR Diff. EOG Diff. DOR Diff. NEW Diff.
Estimates by EDR, EOG and DOR
Sales Tax 0.5 0.5 0.0 0.5 0.0 0.5 0.0 0.5 0.0
Corporate Income Tax 0.0 0.0 0.0 0.0 0.0 0.0 0.0 0.0 0.0
Documentary Stamp Tax 0.0 0.0 0.0 0.0 0.0 0.0 0.0 0.0 0.0
Insurance Premium Tax 0.0 0.0 0.0 0.0 0.0 0.0 0.0 0.0 0.0
Intangibles Taxes 0.0 0.0 0.0 0.0 0.0 0.0 0.0 0.0 0.0
Severance Taxes 0.0 0.0 0.0 0.0 0.0 0.0 0.0 0.0 0.0---------- ---------- ------- ---------- ------- ---------- ------- ---------- -------
SUBTOTAL GR 0.5 0.5 0.0 0.5 0.0 0.5 0.0 0.5 0.0
Less: Refunds 0.0 0.0 0.0 0.0 0.0 0.0 0.0 0.0 0.0======== ======== ===== ======== ===== ======== ===== ======== =====
SUBTOTAL NET GR 0.5 0.5 0.0 0.5 0.0 0.5 0.0 0.5 0.0
Estimates by EDR and EOG
Beverage Taxes & Licenses 0.0 0.0 0.0 0.0 0.0 #N/A #N/A 0.0 0.0
Pari-mutuel Taxes 0.0 0.0 0.0 0.0 0.0 #N/A #N/A 0.0 0.0
Earnings on Investments 0.0 0.0 0.0 0.0 0.0 #N/A #N/A 0.0 0.0
Counties' Medicaid Share 0.0 0.0 0.0 0.0 0.0 #N/A #N/A 0.0 0.0
Corporate Filing Fees 0.0 0.0 0.0 0.0 0.0 #N/A #N/A 0.0 0.0
Service Charges 0.0 0.0 0.0 0.0 0.0 #N/A #N/A 0.0 0.0
Other Taxes, Lic. & Fees 0.0 0.0 0.0 0.0 0.0 #N/A #N/A 0.0 0.0
Other Nonop. Revenue 0.0 0.0 0.0 0.0 0.0 #N/A #N/A 0.0 0.0---------- ---------- ------- ---------- ------- ---------- ------- ---------- -------
SUBTOTAL GR 0.0 0.0 0.0 0.0 0.0 #N/A #N/A 0.0 0.0
Estimates adopted at other Conferences
Tobacco Taxes 0.0 0.0 0.0 0.0 0.0 0.0 0.0 0.0 0.0
Indian Gaming Revenues 329.8 329.8 0.0 329.8 0.0 329.8 0.0 329.8 0.0
Highway Safety Lic. & Fees 0.0 0.0 0.0 0.0 0.0 0.0 0.0 0.0 0.0
Article V Fees 0.0 0.0 0.0 0.0 0.0 0.0 0.0 0.0 0.0---------- ---------- ------- ---------- ------- ---------- ------- ---------- -------
SUBTOTAL GR 329.8 329.8 0.0 329.8 0.0 329.8 0.0 329.8 0.0
Total All Estimates
TOTAL GR 330.3 330.3 0.0 330.3 0.0 #N/A #N/A 330.3 0.0
Less: Refunds 0.0 0.0 0.0 0.0 0.0 0.0 0.0 0.0 0.0======== ======== ===== ======== ===== ======== ===== ======== =====
TOTAL NET GR 330.3 330.3 0.0 330.3 0.0 #N/A #N/A 330.3 0.0
----- RECURRING -----
NET GENERAL REVENUE 35,621.9 35,619.9 (2.0) 35,619.9 (2.0) #N/A #N/A 35,476.2 (145.7)
Page 10

TABLE 8A2022-23 GENERAL REVENUE ESTIMATES ($ Millions)
OLD EDR Diff. EOG Diff. DOR Diff. NEW Diff.
Estimates by EDR, EOG and DOR
Sales Tax 29,344.1 29,344.1 0.0 29,344.1 0.0 29,344.1 0.0 29,211.4 (132.7)
Corporate Income Tax 2,579.7 2,579.7 0.0 2,579.7 0.0 2,579.7 0.0 2,569.7 (10.0)
Documentary Stamp Tax 1,033.9 1,033.9 0.0 1,033.9 0.0 1,033.9 0.0 1,033.2 (0.7)
Insurance Premium Tax 895.9 895.9 0.0 895.9 0.0 895.9 0.0 895.9 0.0
Intangibles Taxes 461.4 461.4 0.0 461.4 0.0 461.4 0.0 461.4 0.0
Severance Taxes 11.5 11.5 0.0 11.5 0.0 11.5 0.0 11.5 0.0---------- ---------- ------- ---------- ------- ---------- ------- ---------- -------
SUBTOTAL GR 34,326.5 34,326.5 0.0 34,326.5 0.0 34,326.5 0.0 34,183.1 (143.4)
Less: Refunds 374.5 374.5 0.0 374.5 0.0 374.5 0.0 374.5 0.0======== ======== ===== ======== ===== ======== ===== ======== =====
SUBTOTAL NET GR 33,952.0 33,952.0 0.0 33,952.0 0.0 33,952.0 0.0 33,808.6 (143.4)
Estimates by EDR and EOG
Beverage Taxes & Licenses 347.6 347.6 0.0 347.6 0.0 #N/A #N/A 347.6 0.0
Pari-mutuel Taxes 21.5 21.5 0.0 21.5 0.0 #N/A #N/A 21.5 0.0
Earnings on Investments 346.1 346.1 0.0 346.1 0.0 #N/A #N/A 346.1 0.0
Counties' Medicaid Share 333.6 333.6 0.0 333.6 0.0 #N/A #N/A 333.6 0.0
Corporate Filing Fees 377.2 377.2 0.0 377.2 0.0 #N/A #N/A 377.2 0.0
Service Charges 505.8 505.8 0.0 505.8 0.0 #N/A #N/A 504.1 (1.7)
Other Taxes, Lic. & Fees 38.7 38.7 0.0 38.7 0.0 #N/A #N/A 38.7 0.0
Other Nonop. Revenue 139.5 139.5 0.0 139.5 0.0 #N/A #N/A 139.5 0.0---------- ---------- ------- ---------- ------- ---------- ------- ---------- -------
SUBTOTAL GR 2,110.0 2,110.0 0.0 2,110.0 0.0 #N/A #N/A 2,108.3 (1.7)
Estimates adopted at other Conferences
Tobacco Taxes 172.5 172.5 0.0 172.5 0.0 172.5 0.0 172.5 0.0
Indian Gaming Revenues 335.3 335.3 0.0 335.3 0.0 335.3 0.0 335.3 0.0
Highway Safety Lic. & Fees 505.5 505.5 0.0 505.5 0.0 505.5 0.0 505.5 0.0
Article V Fees 103.4 101.4 (2.0) 101.4 (2.0) 101.4 (2.0) 101.4 (2.0)---------- ---------- ------- ---------- ------- ---------- ------- ---------- -------
SUBTOTAL GR 1,116.7 1,114.7 (2.0) 1,114.7 (2.0) 1,114.7 (2.0) 1,114.7 (2.0)
Total All Estimates
TOTAL GR 37,553.2 37,551.2 (2.0) 37,551.2 (2.0) #N/A #N/A 37,406.1 (147.1)
Less: Refunds 374.5 374.5 0.0 374.5 0.0 374.5 0.0 374.5 0.0======== ======== ===== ======== ===== ======== ===== ======== =====
TOTAL NET GR 37,178.7 37,176.7 (2.0) 37,176.7 (2.0) #N/A #N/A 37,031.6 (147.1)
% change from prior year 3.4% 3.4% 3.4% #N/A 3.4%
Page 11
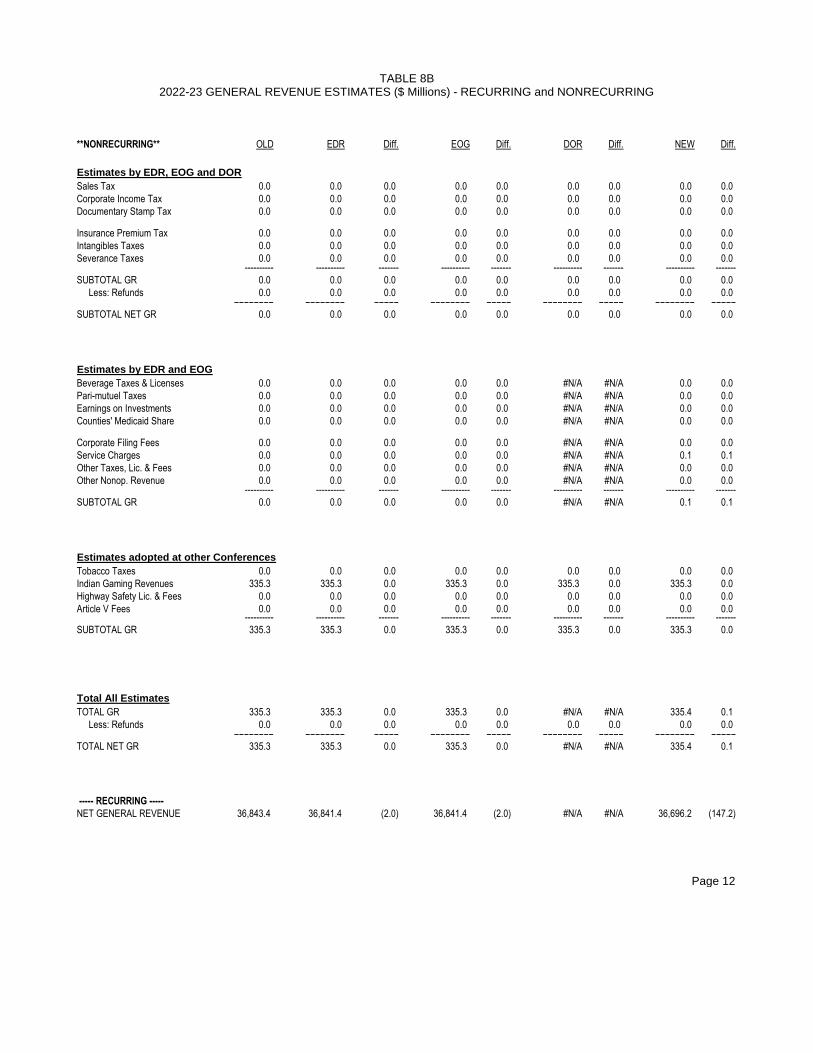
TABLE 8B
**NONRECURRING** OLD EDR Diff. EOG Diff. DOR Diff. NEW Diff.
Estimates by EDR, EOG and DOR
Sales Tax 0.0 0.0 0.0 0.0 0.0 0.0 0.0 0.0 0.0
Corporate Income Tax 0.0 0.0 0.0 0.0 0.0 0.0 0.0 0.0 0.0
Documentary Stamp Tax 0.0 0.0 0.0 0.0 0.0 0.0 0.0 0.0 0.0
Insurance Premium Tax 0.0 0.0 0.0 0.0 0.0 0.0 0.0 0.0 0.0
Intangibles Taxes 0.0 0.0 0.0 0.0 0.0 0.0 0.0 0.0 0.0
Severance Taxes 0.0 0.0 0.0 0.0 0.0 0.0 0.0 0.0 0.0---------- ---------- ------- ---------- ------- ---------- ------- ---------- -------
SUBTOTAL GR 0.0 0.0 0.0 0.0 0.0 0.0 0.0 0.0 0.0
Less: Refunds 0.0 0.0 0.0 0.0 0.0 0.0 0.0 0.0 0.0======== ======== ===== ======== ===== ======== ===== ======== =====
SUBTOTAL NET GR 0.0 0.0 0.0 0.0 0.0 0.0 0.0 0.0 0.0
Estimates by EDR and EOG
Beverage Taxes & Licenses 0.0 0.0 0.0 0.0 0.0 #N/A #N/A 0.0 0.0
Pari-mutuel Taxes 0.0 0.0 0.0 0.0 0.0 #N/A #N/A 0.0 0.0
Earnings on Investments 0.0 0.0 0.0 0.0 0.0 #N/A #N/A 0.0 0.0
Counties' Medicaid Share 0.0 0.0 0.0 0.0 0.0 #N/A #N/A 0.0 0.0
Corporate Filing Fees 0.0 0.0 0.0 0.0 0.0 #N/A #N/A 0.0 0.0
Service Charges 0.0 0.0 0.0 0.0 0.0 #N/A #N/A 0.1 0.1
Other Taxes, Lic. & Fees 0.0 0.0 0.0 0.0 0.0 #N/A #N/A 0.0 0.0
Other Nonop. Revenue 0.0 0.0 0.0 0.0 0.0 #N/A #N/A 0.0 0.0---------- ---------- ------- ---------- ------- ---------- ------- ---------- -------
SUBTOTAL GR 0.0 0.0 0.0 0.0 0.0 #N/A #N/A 0.1 0.1
Estimates adopted at other Conferences
Tobacco Taxes 0.0 0.0 0.0 0.0 0.0 0.0 0.0 0.0 0.0
Indian Gaming Revenues 335.3 335.3 0.0 335.3 0.0 335.3 0.0 335.3 0.0
Highway Safety Lic. & Fees 0.0 0.0 0.0 0.0 0.0 0.0 0.0 0.0 0.0
Article V Fees 0.0 0.0 0.0 0.0 0.0 0.0 0.0 0.0 0.0---------- ---------- ------- ---------- ------- ---------- ------- ---------- -------
SUBTOTAL GR 335.3 335.3 0.0 335.3 0.0 335.3 0.0 335.3 0.0
Total All Estimates
TOTAL GR 335.3 335.3 0.0 335.3 0.0 #N/A #N/A 335.4 0.1
Less: Refunds 0.0 0.0 0.0 0.0 0.0 0.0 0.0 0.0 0.0======== ======== ===== ======== ===== ======== ===== ======== =====
TOTAL NET GR 335.3 335.3 0.0 335.3 0.0 #N/A #N/A 335.4 0.1
----- RECURRING -----
NET GENERAL REVENUE 36,843.4 36,841.4 (2.0) 36,841.4 (2.0) #N/A #N/A 36,696.2 (147.2)
Page 12
2022-23 GENERAL REVENUE ESTIMATES ($ Millions) - RECURRING and NONRECURRING

TABLE 9
2017-18 SALES TAX COLLECTIONS ($ Millions)
OLD EDR Diff. EOG Diff. DOR Diff. NEW Diff.
Nondurables 7,621.5 7,621.5 0.0 7,621.5 0.0 7,621.5 0.0 7,621.5 0.0
Tourism & Recreation 5,824.6 5,824.6 0.0 5,824.6 0.0 5,824.6 0.0 5,824.6 0.0
Autos & Accessories 4,541.0 4,541.0 0.0 4,541.0 0.0 4,541.0 0.0 4,541.0 0.0
Other Durables 1,647.0 1,647.0 0.0 1,647.0 0.0 1,647.0 0.0 1,647.0 0.0
Building Investment 1,630.1 1,630.1 0.0 1,630.1 0.0 1,630.1 0.0 1,630.1 0.0
Business Investment 5,009.9 5,009.9 0.0 5,009.9 0.0 5,009.9 0.0 5,009.9 0.0----------- ----------- ------- ----------- ------- ----------- ------- ----------- -------
TOTAL FINAL LIABILITY 26,274.1 26,274.1 0.0 26,274.1 0.0 26,274.1 0.0 26,274.1 0.0
Hurricane Rebuilding Impact 140.1 140.1 0.0 140.1 0.0 140.1 0.0 140.1 0.0
Net Estimated Payments 51.1 51.1 0.0 51.1 0.0 51.1 0.0 51.1 0.0
----------- ----------- ------- ----------- ------- ----------- ------- ----------- -------
TOTAL COLLECTIONS FROM 26,465.3 26,465.3 0.0 26,465.3 0.0 26,465.3 0.0 26,465.3 0.0
FINAL LIABILITY
Recovery of Unpaid Taxes 62.8 62.8 0.0 62.8 0.0 62.8 0.0 62.8 0.0
Other Adjustments (85.5) (85.5) 0.0 (85.5) 0.0 (85.5) 0.0 (85.5) 0.0
Transfers from CST 661.1 661.1 0.0 661.1 0.0 661.1 0.0 661.1 0.0======== ======== ===== ======== ===== ======== ===== ======== =====
TOTAL COLLECTIONS 27,103.7 27,103.7 0.0 27,103.7 0.0 27,103.7 0.0 27,103.7 0.0
DISTRIBUTIONS TO LOCAL GOVERNMENT
Local Government Half Cent 2,071.5 2,071.5 0.0 2,071.5 0.0 2,071.5 0.0 2,071.5 0.0
County Revenue Sharing 491.1 491.1 0.0 491.1 0.0 491.1 0.0 491.1 0.0
Municipal Revenue Sharing 322.2 322.2 0.0 322.2 0.0 322.2 0.0 322.2 0.0
Fixed Distribution to Counties 29.9 29.9 0.0 29.9 0.0 29.9 0.0 29.9 0.0
DISTRIBUTIONS TO STATE
General Revenue 24,136.8 24,136.8 0.0 24,136.8 0.0 24,136.8 0.0 24,136.8 0.0
Small County Emergency Dist. 22.9 22.9 0.0 22.9 0.0 22.9 0.0 22.9 0.0
State Transportation TF 0.2 0.2 0.0 0.2 0.0 0.2 0.0 0.2 0.0
Sports Facilities Distribution 27.1 27.1 0.0 27.1 0.0 27.1 0.0 27.1 0.0
PERC TF 2.0 2.0 0.0 2.0 0.0 2.0 0.0 2.0 0.0======== ======== ===== ======== ===== ======== ===== ======== =====
TOTAL DISTRIBUTIONS 27,103.7 27,103.7 0.0 27,103.7 0.0 27,103.7 0.0 27,103.7 0.0
General Revenue Refunds 97.8 97.8 0.0 97.8 0.0 97.8 0.0 97.8 0.0
Additional information related to sales tax collections
Scholarship Credits 14.0 14.0 0.0 14.0 0.0 14.0 0.0 14.0 0.0
Page 13

TABLE 10
2018-19 SALES TAX COLLECTIONS ($ Millions)
OLD EDR Diff. EOG Diff. DOR Diff. NEW Diff.
Nondurables 7,978.9 7,978.9 0.0 7,978.9 0.0 7,978.9 0.0 7,946.0 (32.9)
Tourism & Recreation 6,091.2 6,091.2 0.0 6,091.2 0.0 6,091.2 0.0 6,091.2 0.0
Autos & Accessories 4,726.1 4,726.1 0.0 4,726.1 0.0 4,726.1 0.0 4,698.2 (27.9)
Other Durables 1,699.5 1,699.5 0.0 1,699.5 0.0 1,699.5 0.0 1,692.9 (6.6)
Building Investment 1,735.8 1,735.8 0.0 1,735.8 0.0 1,735.8 0.0 1,735.8 0.0
Business Investment 5,226.7 5,226.7 0.0 5,226.7 0.0 5,226.7 0.0 5,170.6 (56.1)----------- ----------- ------- ----------- ------- ----------- ------- ----------- -------
TOTAL FINAL LIABILITY 27,458.2 27,458.2 0.0 27,458.2 0.0 27,458.2 0.0 27,334.7 (123.5)
Hurricane Rebuilding Impact 131.9 131.9 0.0 131.9 0.0 131.9 0.0 131.9 0.0
Net Estimated Payments 52.2 52.2 0.0 52.2 0.0 52.2 0.0 52.2 0.0
----------- ----------- ------- ----------- ------- ----------- ------- ----------- -------
TOTAL COLLECTIONS FROM 27,642.3 27,642.3 0.0 27,642.3 0.0 27,642.3 0.0 27,518.8 (123.5)
FINAL LIABILITY
Recovery of Unpaid Taxes 83.6 83.6 0.0 83.6 0.0 83.6 0.0 83.6 0.0
Other Adjustments (87.5) (87.5) 0.0 (87.5) 0.0 (87.5) 0.0 (87.5) 0.0
Transfers from CST 642.6 642.6 0.0 642.6 0.0 642.6 0.0 642.6 0.0======== ======== ===== ======== ===== ======== ===== ======== =====
TOTAL COLLECTIONS 28,281.0 28,281.0 0.0 28,281.0 0.0 28,281.0 0.0 28,157.5 (123.5)
DISTRIBUTIONS TO LOCAL GOVERNMENT
Local Government Half Cent 2,161.1 2,161.1 0.0 2,161.1 0.0 2,161.1 0.0 2,156.6 (4.5)
County Revenue Sharing 512.5 512.5 0.0 512.5 0.0 512.5 0.0 511.5 (1.0)
Municipal Revenue Sharing 336.2 336.2 0.0 336.2 0.0 336.2 0.0 335.6 (0.6)
Fixed Distribution to Counties 29.9 29.9 0.0 29.9 0.0 29.9 0.0 29.9 0.0
DISTRIBUTIONS TO STATE
General Revenue 25,187.6 25,187.6 0.0 25,187.6 0.0 25,187.6 0.0 25,070.2 (117.4)
Small County Emergency Dist. 23.9 23.9 0.0 23.9 0.0 23.9 0.0 23.9 0.0
State Transportation TF 0.2 0.2 0.0 0.2 0.0 0.2 0.0 0.2 0.0
Sports Facilities Distribution 27.5 27.5 0.0 27.5 0.0 27.5 0.0 27.5 0.0
PERC TF 2.1 2.1 0.0 2.1 0.0 2.1 0.0 2.1 0.0======== ======== ===== ======== ===== ======== ===== ======== =====
TOTAL DISTRIBUTIONS 28,281.0 28,281.0 0.0 28,281.0 0.0 28,281.0 0.0 28,157.5 (123.5)
General Revenue Refunds 115.6 126.2 10.6 126.2 10.6 126.2 10.6 128.1 12.5
Additional information related to sales tax collections
Scholarship Credits - Direct Pay 15.0 15.1 0.1 15.1 0.1 15.1 0.1 15.1 0.1
Scholarship Credits - Commercial Leases 0.0 43.1 43.1 43.1 43.1 43.1 43.1 43.1 43.1
Hope Scholarship 0.0 27.9 27.9 27.9 27.9 27.9 27.9 27.9 27.9
Page 14
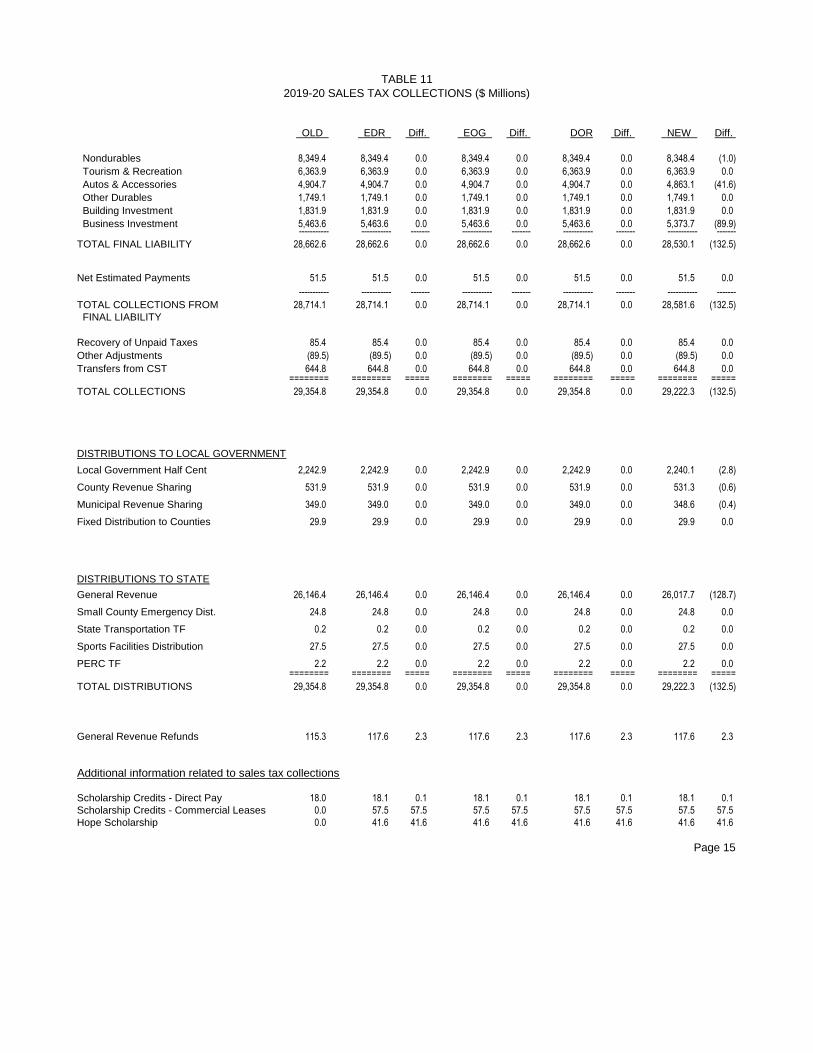
TABLE 11
2019-20 SALES TAX COLLECTIONS ($ Millions)
OLD EDR Diff. EOG Diff. DOR Diff. NEW Diff.
Nondurables 8,349.4 8,349.4 0.0 8,349.4 0.0 8,349.4 0.0 8,348.4 (1.0)
Tourism & Recreation 6,363.9 6,363.9 0.0 6,363.9 0.0 6,363.9 0.0 6,363.9 0.0
Autos & Accessories 4,904.7 4,904.7 0.0 4,904.7 0.0 4,904.7 0.0 4,863.1 (41.6)
Other Durables 1,749.1 1,749.1 0.0 1,749.1 0.0 1,749.1 0.0 1,749.1 0.0
Building Investment 1,831.9 1,831.9 0.0 1,831.9 0.0 1,831.9 0.0 1,831.9 0.0
Business Investment 5,463.6 5,463.6 0.0 5,463.6 0.0 5,463.6 0.0 5,373.7 (89.9)----------- ----------- ------- ----------- ------- ----------- ------- ----------- -------
TOTAL FINAL LIABILITY 28,662.6 28,662.6 0.0 28,662.6 0.0 28,662.6 0.0 28,530.1 (132.5)
Net Estimated Payments 51.5 51.5 0.0 51.5 0.0 51.5 0.0 51.5 0.0
----------- ----------- ------- ----------- ------- ----------- ------- ----------- -------
TOTAL COLLECTIONS FROM 28,714.1 28,714.1 0.0 28,714.1 0.0 28,714.1 0.0 28,581.6 (132.5)
FINAL LIABILITY
Recovery of Unpaid Taxes 85.4 85.4 0.0 85.4 0.0 85.4 0.0 85.4 0.0
Other Adjustments (89.5) (89.5) 0.0 (89.5) 0.0 (89.5) 0.0 (89.5) 0.0
Transfers from CST 644.8 644.8 0.0 644.8 0.0 644.8 0.0 644.8 0.0======== ======== ===== ======== ===== ======== ===== ======== =====
TOTAL COLLECTIONS 29,354.8 29,354.8 0.0 29,354.8 0.0 29,354.8 0.0 29,222.3 (132.5)
DISTRIBUTIONS TO LOCAL GOVERNMENT
Local Government Half Cent 2,242.9 2,242.9 0.0 2,242.9 0.0 2,242.9 0.0 2,240.1 (2.8)
County Revenue Sharing 531.9 531.9 0.0 531.9 0.0 531.9 0.0 531.3 (0.6)
Municipal Revenue Sharing 349.0 349.0 0.0 349.0 0.0 349.0 0.0 348.6 (0.4)
Fixed Distribution to Counties 29.9 29.9 0.0 29.9 0.0 29.9 0.0 29.9 0.0
DISTRIBUTIONS TO STATE
General Revenue 26,146.4 26,146.4 0.0 26,146.4 0.0 26,146.4 0.0 26,017.7 (128.7)
Small County Emergency Dist. 24.8 24.8 0.0 24.8 0.0 24.8 0.0 24.8 0.0
State Transportation TF 0.2 0.2 0.0 0.2 0.0 0.2 0.0 0.2 0.0
Sports Facilities Distribution 27.5 27.5 0.0 27.5 0.0 27.5 0.0 27.5 0.0
PERC TF 2.2 2.2 0.0 2.2 0.0 2.2 0.0 2.2 0.0======== ======== ===== ======== ===== ======== ===== ======== =====
TOTAL DISTRIBUTIONS 29,354.8 29,354.8 0.0 29,354.8 0.0 29,354.8 0.0 29,222.3 (132.5)
General Revenue Refunds 115.3 117.6 2.3 117.6 2.3 117.6 2.3 117.6 2.3
Additional information related to sales tax collections
Scholarship Credits - Direct Pay 18.0 18.1 0.1 18.1 0.1 18.1 0.1 18.1 0.1
Scholarship Credits - Commercial Leases 0.0 57.5 57.5 57.5 57.5 57.5 57.5 57.5 57.5
Hope Scholarship 0.0 41.6 41.6 41.6 41.6 41.6 41.6 41.6 41.6
Page 15

TABLE 12
2020-21 SALES TAX COLLECTIONS ($ Millions)
OLD EDR Diff. EOG Diff. DOR Diff. NEW Diff.
Nondurables 8,725.4 8,725.4 0.0 8,725.4 0.0 8,725.4 0.0 8,724.5 (0.9)
Tourism & Recreation 6,640.0 6,640.0 0.0 6,640.0 0.0 6,640.0 0.0 6,640.0 0.0
Autos & Accessories 5,071.3 5,071.3 0.0 5,071.3 0.0 5,071.3 0.0 5,029.5 (41.8)
Other Durables 1,798.4 1,798.4 0.0 1,798.4 0.0 1,798.4 0.0 1,798.4 0.0
Building Investment 1,933.6 1,933.6 0.0 1,933.6 0.0 1,933.6 0.0 1,933.6 0.0
Business Investment 5,682.9 5,682.9 0.0 5,682.9 0.0 5,682.9 0.0 5,591.6 (91.3)----------- ----------- ------- ----------- ------- ----------- ------- ----------- -------
TOTAL FINAL LIABILITY 29,851.6 29,851.6 0.0 29,851.6 0.0 29,851.6 0.0 29,717.6 (134.0)
Net Estimated Payments 51.7 51.7 0.0 51.7 0.0 51.7 0.0 51.7 0.0
----------- ----------- ------- ----------- ------- ----------- ------- ----------- -------
TOTAL COLLECTIONS FROM 29,903.3 29,903.3 0.0 29,903.3 0.0 29,903.3 0.0 29,769.3 (134.0)
FINAL LIABILITY
Recovery of Unpaid Taxes 87.2 87.2 0.0 87.2 0.0 87.2 0.0 87.2 0.0
Other Adjustments (91.4) (91.4) 0.0 (91.4) 0.0 (91.4) 0.0 (91.4) 0.0
Transfers from CST 646.9 646.9 0.0 646.9 0.0 646.9 0.0 646.9 0.0======== ======== ===== ======== ===== ======== ===== ======== =====
TOTAL COLLECTIONS 30,546.0 30,546.0 0.0 30,546.0 0.0 30,546.0 0.0 30,412.0 (134.0)
DISTRIBUTIONS TO LOCAL GOVERNMENT
Local Government Half Cent 2,333.7 2,333.7 0.0 2,333.7 0.0 2,333.7 0.0 2,330.7 (3.0)
County Revenue Sharing 553.5 553.5 0.0 553.5 0.0 553.5 0.0 552.9 (0.6)
Municipal Revenue Sharing 363.1 363.1 0.0 363.1 0.0 363.1 0.0 362.7 (0.4)
Fixed Distribution to Counties 29.9 29.9 0.0 29.9 0.0 29.9 0.0 29.9 0.0
DISTRIBUTIONS TO STATE
General Revenue 27,210.0 27,210.0 0.0 27,210.0 0.0 27,210.0 0.0 27,080.0 (130.0)
Small County Emergency Dist. 25.8 25.8 0.0 25.8 0.0 25.8 0.0 25.8 0.0
State Transportation TF 0.2 0.2 0.0 0.2 0.0 0.2 0.0 0.2 0.0
Sports Facilities Distribution 27.5 27.5 0.0 27.5 0.0 27.5 0.0 27.5 0.0
PERC TF 2.3 2.3 0.0 2.3 0.0 2.3 0.0 2.3 0.0======== ======== ===== ======== ===== ======== ===== ======== =====
TOTAL DISTRIBUTIONS 30,546.0 30,546.0 0.0 30,546.0 0.0 30,546.0 0.0 30,412.0 (134.0)
General Revenue Refunds 119.8 119.8 0.0 119.8 0.0 119.8 0.0 119.8 0.0
Additional information related to sales tax collections
Scholarship Credits - Direct Pay 21.1 21.2 0.1 21.2 0.1 21.2 0.1 21.2 0.1
Scholarship Credits - Commercial Leases 0.0 57.5 57.5 57.5 57.5 57.5 57.5 57.5 57.5
Hope Scholarship 0.0 41.8 41.8 41.8 41.8 41.8 41.8 41.8 41.8
Page 16

TABLE 13
2021-22 SALES TAX COLLECTIONS ($ Millions)
OLD EDR Diff. EOG Diff. DOR Diff. NEW Diff.
Nondurables 9,106.3 9,106.3 0.0 9,106.3 0.0 9,106.3 0.0 9,105.4 (0.9)
Tourism & Recreation 6,924.5 6,924.5 0.0 6,924.5 0.0 6,924.5 0.0 6,924.5 0.0
Autos & Accessories 5,238.4 5,238.4 0.0 5,238.4 0.0 5,238.4 0.0 5,196.5 (41.9)
Other Durables 1,849.2 1,849.2 0.0 1,849.2 0.0 1,849.2 0.0 1,849.2 0.0
Building Investment 2,036.0 2,036.0 0.0 2,036.0 0.0 2,036.0 0.0 2,036.0 0.0
Business Investment 5,893.8 5,893.8 0.0 5,893.8 0.0 5,893.8 0.0 5,801.2 (92.6)----------- ----------- ------- ----------- ------- ----------- ------- ----------- -------
TOTAL FINAL LIABILITY 31,048.2 31,048.2 0.0 31,048.2 0.0 31,048.2 0.0 30,912.8 (135.4)
Net Estimated Payments 52.2 52.2 0.0 52.2 0.0 52.2 0.0 52.2 0.0
----------- ----------- ------- ----------- ------- ----------- ------- ----------- -------
TOTAL COLLECTIONS FROM 31,100.4 31,100.4 0.0 31,100.4 0.0 31,100.4 0.0 30,965.0 (135.4)
FINAL LIABILITY
Recovery of Unpaid Taxes 89.0 89.0 0.0 89.0 0.0 89.0 0.0 89.0 0.0
Other Adjustments (93.2) (93.2) 0.0 (93.2) 0.0 (93.2) 0.0 (93.2) 0.0
Transfers from CST 650.2 650.2 0.0 650.2 0.0 650.2 0.0 650.2 0.0======== ======== ===== ======== ===== ======== ===== ======== =====
TOTAL COLLECTIONS 31,746.4 31,746.4 0.0 31,746.4 0.0 31,746.4 0.0 31,611.0 (135.4)
DISTRIBUTIONS TO LOCAL GOVERNMENT
Local Government Half Cent 2,425.3 2,425.3 0.0 2,425.3 0.0 2,425.3 0.0 2,422.2 (3.1)
County Revenue Sharing 575.3 575.3 0.0 575.3 0.0 575.3 0.0 574.7 (0.6)
Municipal Revenue Sharing 377.4 377.4 0.0 377.4 0.0 377.4 0.0 377.0 (0.4)
Fixed Distribution to Counties 29.9 29.9 0.0 29.9 0.0 29.9 0.0 29.9 0.0
DISTRIBUTIONS TO STATE
General Revenue 28,281.6 28,281.6 0.0 28,281.6 0.0 28,281.6 0.0 28,150.3 (131.3)
Small County Emergency Dist. 26.8 26.8 0.0 26.8 0.0 26.8 0.0 26.8 0.0
State Transportation TF 0.2 0.2 0.0 0.2 0.0 0.2 0.0 0.2 0.0
Sports Facilities Distribution 27.5 27.5 0.0 27.5 0.0 27.5 0.0 27.5 0.0
PERC TF 2.4 2.4 0.0 2.4 0.0 2.4 0.0 2.4 0.0======== ======== ===== ======== ===== ======== ===== ======== =====
TOTAL DISTRIBUTIONS 31,746.4 31,746.4 0.0 31,746.4 0.0 31,746.4 0.0 31,611.0 (135.4)
General Revenue Refunds 122.3 122.3 0.0 122.3 0.0 122.3 0.0 122.3 0.0
Additional information related to sales tax collections
Scholarship Credits - Direct Pay 21.1 21.2 0.1 21.2 0.1 21.2 0.1 21.2 0.1
Scholarship Credits - Commercial Leases 0.0 57.5 57.5 57.5 57.5 57.5 57.5 57.5 57.5
Hope Scholarship 0.0 41.9 41.9 41.9 41.9 41.9 41.9 41.9 41.9
Page 17

TABLE 14
2022-23 SALES TAX COLLECTIONS ($ Millions)
OLD EDR Diff. EOG Diff. DOR Diff. NEW Diff.
Nondurables 9,496.7 9,496.7 0.0 9,496.7 0.0 9,496.7 0.0 9,495.8 (0.9)
Tourism & Recreation 7,216.8 7,216.8 0.0 7,216.8 0.0 7,216.8 0.0 7,216.8 0.0
Autos & Accessories 5,413.4 5,413.4 0.0 5,413.4 0.0 5,413.4 0.0 5,371.1 (42.3)
Other Durables 1,895.3 1,895.3 0.0 1,895.3 0.0 1,895.3 0.0 1,895.3 0.0
Building Investment 2,131.0 2,131.0 0.0 2,131.0 0.0 2,131.0 0.0 2,131.0 0.0
Business Investment 6,080.0 6,080.0 0.0 6,080.0 0.0 6,080.0 0.0 5,986.2 (93.8)----------- ----------- ------- ----------- ------- ----------- ------- ----------- -------
TOTAL FINAL LIABILITY 32,233.2 32,233.2 0.0 32,233.2 0.0 32,233.2 0.0 32,096.2 (137.0)
Net Estimated Payments 52.9 52.9 0.0 52.9 0.0 52.9 0.0 52.9 0.0
----------- ----------- ------- ----------- ------- ----------- ------- ----------- -------
TOTAL COLLECTIONS FROM 32,286.1 32,286.1 0.0 32,286.1 0.0 32,286.1 0.0 32,149.1 (137.0)
FINAL LIABILITY
Recovery of Unpaid Taxes 90.7 90.7 0.0 90.7 0.0 90.7 0.0 90.7 0.0
Other Adjustments (95.0) (95.0) 0.0 (95.0) 0.0 (95.0) 0.0 (95.0) 0.0
Transfers from CST 654.1 654.1 0.0 654.1 0.0 654.1 0.0 654.1 0.0======== ======== ===== ======== ===== ======== ===== ======== =====
TOTAL COLLECTIONS 32,935.9 32,935.9 0.0 32,935.9 0.0 32,935.9 0.0 32,798.9 (137.0)
DISTRIBUTIONS TO LOCAL GOVERNMENT
Local Government Half Cent 2,516.0 2,516.0 0.0 2,516.0 0.0 2,516.0 0.0 2,512.8 (3.2)
County Revenue Sharing 596.8 596.8 0.0 596.8 0.0 596.8 0.0 596.1 (0.7)
Municipal Revenue Sharing 391.6 391.6 0.0 391.6 0.0 391.6 0.0 391.2 (0.4)
Fixed Distribution to Counties 29.9 29.9 0.0 29.9 0.0 29.9 0.0 29.9 0.0
DISTRIBUTIONS TO STATE
General Revenue 29,344.1 29,344.1 0.0 29,344.1 0.0 29,344.1 0.0 29,211.4 (132.7)
Small County Emergency Dist. 27.8 27.8 0.0 27.8 0.0 27.8 0.0 27.8 0.0
State Transportation TF 0.2 0.2 0.0 0.2 0.0 0.2 0.0 0.2 0.0
Sports Facilities Distribution 27.0 27.0 0.0 27.0 0.0 27.0 0.0 27.0 0.0
PERC TF 2.5 2.5 0.0 2.5 0.0 2.5 0.0 2.5 0.0======== ======== ===== ======== ===== ======== ===== ======== =====
TOTAL DISTRIBUTIONS 32,935.9 32,935.9 0.0 32,935.9 0.0 32,935.9 0.0 32,798.9 (137.0)
General Revenue Refunds 126.3 126.3 0.0 126.3 0.0 126.3 0.0 126.3 0.0
Additional information related to sales tax collections
Scholarship Credits - Direct Pay 21.1 21.2 0.1 21.2 0.1 21.2 0.1 21.2 0.1
Scholarship Credits - Commercial Leases 0.0 57.5 57.5 57.5 57.5 57.5 57.5 57.5 57.5
Hope Scholarship 0.0 42.3 42.3 42.3 42.3 42.3 42.3 42.3 42.3
Page 18

TABLE 15
SALES TAX/SALES TAX LIABILITY BY CATEGORY
TOTAL NONDURABLES TOURISM & REC. AUTOS & ACC. OTH. DURABLES BUILDING INV. BUSINESS INV.
$ mill. % chg $ mill. % chg $ mill. % chg $ mill. % chg $ mill. % chg $ mill. % chg $ mill. % chg______ _____ ______ _____ ______ _____ ______ _____ ______ _____ ______ _____ ______ _____
1998-99 13,767.1 7.6 4,219.4 4.6 2,673.2 6.6 2,520.1 8.6 1,100.2 16.9 838.5 12.5 2,415.7 7.5
1999-00 14,949.2 8.6 4,515.3 7.0 2,910.6 8.9 2,778.5 10.3 1,218.9 10.8 926.2 10.5 2,599.7 7.6
2000-01 15,717.2 5.1 4,853.9 7.5 3,050.3 4.8 2,890.3 4.0 1,270.2 4.2 961.7 3.8 2,690.8 3.5
Begin Communications Service Tax (see note)
2001-02 15,473.5 -1.6 4,434.7 -8.6 2,971.0 -2.6 3,118.4 7.9 1,236.7 -2.6 952.2 -1.0 2,760.6 2.6
2002-03 15,534.5 0.4 4,287.3 -3.3 2,995.8 0.8 3,133.9 0.5 1,245.8 0.7 1,048.9 10.2 2,822.9 2.3
2003-04 16,952.8 9.1 4,675.7 9.1 3,224.5 7.6 3,349.6 6.9 1,375.5 10.4 1,103.5 5.2 3,223.9 14.2
2004-05 18,863.6 11.3 5,099.0 9.1 3,517.3 9.1 3,607.6 7.7 1,538.9 11.9 1,367.4 23.9 3,733.4 15.8
2005-06 20,786.4 10.2 5,616.7 10.2 3,781.9 7.5 3,879.8 7.5 1,716.4 11.6 1,586.1 16.0 4,205.6 12.6
2006-07 20,865.0 0.4 5,909.6 5.3 3,887.9 2.8 3,737.9 -3.6 1,664.2 -3.0 1,419.8 -10.5 4,245.5 1.0
2007-08 19,715.0 -5.6 5,925.7 0.0 3,932.9 1.1 3,281.9 -12.2 1,456.8 -12.5 1,215.0 -14.4 3,902.7 -8.1
2008-09 17,585.6 -10.8 5,604.6 -5.4 3,693.4 -6.0 2,603.9 -20.7 1,192.2 -18.2 978.4 -19.4 3,513.0 -10.0
2009-10 16,950.8 -3.5 5,515.3 -1.1 3,610.5 -2.3 2,608.7 0.2 1,094.1 -8.2 888.2 -9.3 3,233.9 -8.0
2010-11 17,671.2 4.2 5,724.3 3.6 3,816.1 5.6 2,744.0 5.2 1,152.3 5.3 904.6 1.8 3,329.9 3.0
2011-12 18,567.9 5.1 5,974.4 4.4 4,076.2 6.8 2,918.2 6.4 1,221.7 6.0 947.5 4.8 3,429.9 3.0
2012-13 19,701.0 6.1 6,204.5 3.9 4,307.3 5.7 3,224.2 10.5 1,298.1 6.3 1,069.8 12.9 3,597.0 4.9
2013-14 21,120.9 7.2 6,515.1 5.0 4,606.9 7.0 3,568.2 10.7 1,386.9 6.8 1,199.5 12.1 3,844.3 6.9
2014-15 22,749.0 7.7 6,883.2 5.6 5,000.0 8.5 3,910.1 9.6 1,497.5 8.0 1,317.8 9.9 4,140.3 7.7
2015-16 23,989.2 5.5 7,002.8 1.7 5,299.1 6.0 4,213.3 7.8 1,576.1 5.2 1,431.8 8.6 4,466.0 7.9
2016-17 25,107.9 4.7 7,301.1 4.3 5,528.6 4.3 4,415.6 4.8 1,592.5 1.0 1,524.4 6.5 4,745.7 6.3
2017-18 OLD 26,274.1 4.6 7,621.5 4.4 5,824.6 5.4 4,541.0 2.8 1,647.0 3.4 1,630.1 6.9 5,009.9 5.6
2017-18 EDR 26,274.1 4.6 7,621.5 4.4 5,824.6 5.4 4,541.0 2.8 1,647.0 3.4 1,630.1 6.9 5,009.9 5.6
2017-18 EOG 26,274.1 4.6 7,621.5 4.4 5,824.6 5.4 4,541.0 2.8 1,647.0 3.4 1,630.1 6.9 5,009.9 5.6
2017-18 DOR 26,274.1 4.6 7,621.5 4.4 5,824.6 5.4 4,541.0 2.8 1,647.0 3.4 1,630.1 6.9 5,009.9 5.6
2017-18 NEW 26,274.1 4.6 7,621.5 4.4 5,824.6 5.4 4,541.0 2.8 1,647.0 3.4 1,630.1 6.9 5,009.9 5.6
2018-19 OLD 27,458.2 4.5 7,978.9 4.7 6,091.2 4.6 4,726.1 4.1 1,699.5 3.2 1,735.8 6.5 5,226.7 4.3
2018-19 EDR 27,458.2 4.5 7,978.9 4.7 6,091.2 4.6 4,726.1 4.1 1,699.5 3.2 1,735.8 6.5 5,226.7 4.3
2018-19 EOG 27,458.2 4.5 7,978.9 4.7 6,091.2 4.6 4,726.1 4.1 1,699.5 3.2 1,735.8 6.5 5,226.7 4.3
2018-19 DOR 27,458.2 4.5 7,978.9 4.7 6,091.2 4.6 4,726.1 4.1 1,699.5 3.2 1,735.8 6.5 5,226.7 4.3
2018-19 NEW 27,334.7 4.0 7,946.0 4.3 6,091.2 4.6 4,698.2 3.5 1,692.9 2.8 1,735.8 6.5 5,170.6 3.2
2019-20 OLD 28,662.6 4.4 8,349.4 4.6 6,363.9 4.5 4,904.7 3.8 1,749.1 2.9 1,831.9 5.5 5,463.6 4.5
2019-20 EDR 28,662.6 4.4 8,349.4 4.6 6,363.9 4.5 4,904.7 3.8 1,749.1 2.9 1,831.9 5.5 5,463.6 4.5
2019-20 EOG 28,662.6 4.4 8,349.4 4.6 6,363.9 4.5 4,904.7 3.8 1,749.1 2.9 1,831.9 5.5 5,463.6 4.5
2019-20 DOR 28,662.6 4.4 8,349.4 4.6 6,363.9 4.5 4,904.7 3.8 1,749.1 2.9 1,831.9 5.5 5,463.6 4.5
2019-20 NEW 28,530.1 4.4 8,348.4 5.1 6,363.9 4.5 4,863.1 3.5 1,749.1 3.3 1,831.9 5.5 5,373.7 3.9
2020-21 OLD 29,851.6 4.1 8,725.4 4.5 6,640.0 4.3 5,071.3 3.4 1,798.4 2.8 1,933.6 5.6 5,682.9 4.0
2020-21 EDR 29,851.6 4.1 8,725.4 4.5 6,640.0 4.3 5,071.3 3.4 1,798.4 2.8 1,933.6 5.6 5,682.9 4.0
2020-21 EOG 29,851.6 4.1 8,725.4 4.5 6,640.0 4.3 5,071.3 3.4 1,798.4 2.8 1,933.6 5.6 5,682.9 4.0
2020-21 DOR 29,851.6 4.1 8,725.4 4.5 6,640.0 4.3 5,071.3 3.4 1,798.4 2.8 1,933.6 5.6 5,682.9 4.0
2020-21 NEW 29,717.6 4.2 8,724.5 4.5 6,640.0 4.3 5,029.5 3.4 1,798.4 2.8 1,933.6 5.6 5,591.6 4.1
2021-22 OLD 31,048.2 4.0 9,106.3 4.4 6,924.5 4.3 5,238.4 3.3 1,849.2 2.8 2,036.0 5.3 5,893.8 3.7
2021-22 EDR 31,048.2 4.0 9,106.3 4.4 6,924.5 4.3 5,238.4 3.3 1,849.2 2.8 2,036.0 5.3 5,893.8 3.7
2021-22 EOG 31,048.2 4.0 9,106.3 4.4 6,924.5 4.3 5,238.4 3.3 1,849.2 2.8 2,036.0 5.3 5,893.8 3.7
2021-22 DOR 31,048.2 4.0 9,106.3 4.4 6,924.5 4.3 5,238.4 3.3 1,849.2 2.8 2,036.0 5.3 5,893.8 3.7
2021-22 NEW 30,912.8 4.0 9,105.4 4.4 6,924.5 4.3 5,196.5 3.3 1,849.2 2.8 2,036.0 5.3 5,801.2 3.7
2022-23 OLD 32,233.2 3.8 9,496.7 4.3 7,216.8 4.2 5,413.4 3.3 1,895.3 2.5 2,131.0 4.7 6,080.0 3.2
2022-23 EDR 32,233.2 3.8 9,496.7 4.3 7,216.8 4.2 5,413.4 3.3 1,895.3 2.5 2,131.0 4.7 6,080.0 3.2
2022-23 EOG 32,233.2 3.8 9,496.7 4.3 7,216.8 4.2 5,413.4 3.3 1,895.3 2.5 2,131.0 4.7 6,080.0 3.2
2022-23 DOR 32,233.2 3.8 9,496.7 4.3 7,216.8 4.2 5,413.4 3.3 1,895.3 2.5 2,131.0 4.7 6,080.0 3.2
2022-23 NEW 32,096.2 3.8 9,495.8 4.3 7,216.8 4.2 5,371.1 3.4 1,895.3 2.5 2,131.0 4.7 5,986.2 3.2
Beginning in October 2001, telecommunications services became taxable under Communications Services Tax.
Prior to the implementation of the Communications Services Tax, these sales were included in the nondurables category.
Page 19

TABLE 16A- SALES TAX LIABILITY - SEASONALLY ADJUSTED QUARTERLY LEVELSTOTAL LIABILITY
annual annual annual annual annual
Date OLD % chg EDR % chg EOG % chg DOR % chg NEW % chg
2015Q3 5,856.9 0.3% 5,856.9 0.9% 5,856.9 0.9% 5,856.9 0.7% 5,856.9 0.7%
2015Q4 5,994.1 9.7% 5,994.1 9.7% 5,994.1 9.7% 5,994.1 9.7% 5,994.1 9.7%
2016Q1 5,994.0 0.0% 5,994.0 0.0% 5,994.0 0.0% 5,994.0 0.0% 5,994.0 0.0%
2016Q2 6,069.9 5.2% 6,069.9 5.2% 6,069.9 5.2% 6,069.9 5.2% 6,069.9 5.2%
FY14-15 23,914.9 5.1% 23,914.9 5.1% 23,914.9 5.1% 23,914.9 5.1% 23,914.9 13.1%
2016Q3 6,193.0 8.4% 6,193.0 8.4% 6,193.0 8.4% 6,193.0 8.4% 6,193.0 8.4%
2016Q4 6,239.7 3.1% 6,239.7 3.1% 6,239.7 3.1% 6,239.7 3.1% 6,239.7 3.1%
2017Q1 6,320.1 5.3% 6,320.1 5.3% 6,320.1 5.3% 6,320.1 5.3% 6,320.1 5.3%
2017Q2 6,363.8 2.8% 6,363.8 2.8% 6,363.8 2.8% 6,363.8 2.8% 6,363.8 2.8%
FY16-17 25,116.6 5.0% 25,116.6 5.0% 25,116.6 5.0% 25,116.6 5.0% 25,116.6 5.0%
2017Q3 6,422.0 3.7% 6,422.0 3.7% 6,422.0 3.7% 6,422.0 3.7% 6,422.0 3.7%
2017Q4 6,549.1 8.2% 6,549.1 8.2% 6,549.1 8.2% 6,549.1 8.2% 6,549.1 8.2%
2018Q1 6,618.2 4.3% 6,618.2 4.3% 6,618.2 4.3% 6,618.2 4.3% 6,618.2 4.3%
2018Q2 6,687.3 4.2% 6,687.3 4.2% 6,687.3 4.2% 6,687.3 4.2% 6,687.3 4.2%
FY17-18 26,276.6 4.6% 26,276.6 4.6% 26,276.6 4.6% 26,276.6 4.6% 26,276.6 4.6%
2018Q3 6,750.3 3.8% 6,750.3 3.8% 6,750.3 3.8% 6,750.3 3.8% 6,750.3 3.8%
2018Q4 6,829.4 4.8% 6,829.4 4.8% 6,829.4 4.8% 6,829.4 4.8% 6,829.4 4.8%
2019Q1 6,906.8 4.6% 6,906.8 4.6% 6,906.8 4.6% 6,906.8 4.6% 6,906.8 4.6%
2019Q2 6,978.9 4.2% 6,978.9 4.2% 6,978.9 4.2% 6,978.9 4.2% 6,978.9 4.2%
FY18-19 27,465.4 4.5% 27,465.4 4.5% 27,465.4 4.5% 27,465.4 4.5% 27,465.4 4.5%
2019Q3 7,050.4 4.2% 7,050.4 4.2% 7,050.4 4.2% 7,050.4 4.2% 7,050.4 4.2%
2019Q4 7,126.1 4.4% 7,126.1 4.4% 7,126.1 4.4% 7,126.1 4.4% 7,126.1 4.4%
2020Q1 7,205.0 4.5% 7,205.0 4.5% 7,205.0 4.5% 7,205.0 4.5% 7,205.0 4.5%
2020Q2 7,289.6 4.8% 7,289.6 4.8% 7,289.6 4.8% 7,289.6 4.8% 7,289.6 4.8%
FY19-20 28,671.1 4.4% 28,671.1 4.4% 28,671.1 4.4% 28,671.1 4.4% 28,671.1 4.4%
2020Q3 7,353.1 3.5% 7,353.1 3.5% 7,353.1 3.5% 7,353.1 3.5% 7,353.1 3.5%
2020Q4 7,424.5 3.9% 7,424.5 3.9% 7,424.5 3.9% 7,424.5 3.9% 7,424.5 3.9%
2021Q1 7,505.1 4.4% 7,505.1 4.4% 7,505.1 4.4% 7,505.1 4.4% 7,505.1 4.4%
2021Q2 7,577.9 3.9% 7,577.9 3.9% 7,577.9 3.9% 7,577.9 3.9% 7,577.9 3.9%
FY20-21 29,860.6 4.1% 29,860.6 4.1% 29,860.6 4.1% 29,860.6 4.1% 29,860.6 4.1%
2021Q3 7,646.5 3.7% 7,646.5 3.7% 7,646.5 3.7% 7,646.5 3.7% 7,646.5 3.7%
2021Q4 7,723.1 4.1% 7,723.1 4.1% 7,723.1 4.1% 7,723.1 4.1% 7,723.1 4.1%
2022Q1 7,805.5 4.3% 7,805.5 4.3% 7,805.5 4.3% 7,805.5 4.3% 7,805.5 4.3%
2022Q2 7,882.7 4.0% 7,882.7 4.0% 7,882.7 4.0% 7,882.7 4.0% 7,882.7 4.0%
FY21-22 31,057.8 4.0% 31,057.8 4.0% 31,057.8 4.0% 31,057.8 4.0% 31,057.8 4.0%
2022Q3 7,951.1 3.5% 7,951.1 3.5% 7,951.1 3.5% 7,951.1 3.5% 7,951.1 3.5%
2022Q4 8,021.1 3.6% 8,021.1 3.6% 8,021.1 3.6% 8,021.1 3.6% 8,021.1 3.6%
2023Q1 8,095.9 3.8% 8,095.9 3.8% 8,095.9 3.8% 8,095.9 3.8% 8,095.9 3.8%
2023Q2 8,175.4 4.0% 8,175.4 4.0% 8,175.4 4.0% 8,175.4 4.0% 8,175.4 4.0%
FY22-23 32,243.5 3.8% 32,243.5 3.8% 32,243.5 3.8% 32,243.5 3.8% 32,243.5 3.8%
Page 20

TABLE 16B- SALES TAX LIABILITY - SEASONALLY ADJUSTED QUARTERLY LEVELSCONSUMER NON-DURABLES
annual annual annual annual annual
Date OLD % chg EDR % chg EOG % chg DOR % chg NEW % chg
2015Q3 1,700.0 8.7% 1,700.0 -10.9% 1,700.0 -10.9% 1,700.0 -10.9% 1,700.0 8.9%
2015Q4 1,763.6 15.8% 1,763.6 15.8% 1,763.6 15.8% 1,763.6 15.8% 1,763.6 15.8%
2016Q1 1,739.7 -5.3% 1,739.7 -5.3% 1,739.7 -5.3% 1,739.7 -5.3% 1,739.7 -5.3%
2016Q2 1,776.7 8.8% 1,776.7 8.8% 1,776.7 8.8% 1,776.7 8.8% 1,776.7 8.8%
FY14-15 6,980.0 5.5% 6,980.0 1.4% 6,980.0 1.4% 6,980.0 1.4% 6,980.0 7.0%
2016Q3 1,816.1 9.2% 1,816.1 9.2% 1,816.1 9.2% 1,816.1 9.2% 1,816.1 9.2%
2016Q4 1,820.2 0.9% 1,820.2 0.9% 1,820.2 0.9% 1,820.2 0.9% 1,820.2 0.9%
2017Q1 1,822.1 0.4% 1,822.1 0.4% 1,822.1 0.4% 1,822.1 0.4% 1,822.1 0.4%
2017Q2 1,846.5 5.5% 1,846.5 5.5% 1,846.5 5.5% 1,846.5 5.5% 1,846.5 5.5%
FY16-17 7,304.9 4.7% 7,304.9 4.7% 7,304.9 4.7% 7,304.9 4.7% 7,304.9 4.7%
2017Q3 1,865.4 4.2% 1,865.4 4.2% 1,865.4 4.2% 1,865.4 4.2% 1,865.4 4.2%
2017Q4 1,890.4 5.5% 1,890.4 5.5% 1,890.4 5.5% 1,890.4 5.5% 1,890.4 5.5%
2018Q1 1,920.8 6.6% 1,920.8 6.6% 1,920.8 6.6% 1,920.8 6.6% 1,920.8 6.6%
2018Q2 1,945.6 5.3% 1,945.6 5.3% 1,945.6 5.3% 1,945.6 5.3% 1,945.6 5.3%
FY17-18 7,622.2 4.3% 7,622.2 4.3% 7,622.2 4.3% 7,622.2 4.3% 7,622.2 4.3%
2018Q3 1,965.8 4.2% 1,965.8 4.2% 1,965.8 4.2% 1,965.8 4.2% 1,965.8 4.2%
2018Q4 1,985.9 4.2% 1,985.9 4.2% 1,985.9 4.2% 1,985.9 4.2% 1,985.9 4.2%
2019Q1 2,006.3 4.2% 2,006.3 4.2% 2,006.3 4.2% 2,006.3 4.2% 2,006.3 4.2%
2019Q2 2,025.3 3.8% 2,025.3 3.8% 2,025.3 3.8% 2,025.3 3.8% 2,025.3 3.8%
FY18-19 7,983.3 4.7% 7,983.3 4.7% 7,983.3 4.7% 7,983.3 4.7% 7,983.3 4.7%
2019Q3 2,049.2 4.8% 2,049.2 4.8% 2,049.2 4.8% 2,049.2 4.8% 2,049.2 4.8%
2019Q4 2,075.2 5.2% 2,075.2 5.2% 2,075.2 5.2% 2,075.2 5.2% 2,075.2 5.2%
2020Q1 2,101.0 5.1% 2,101.0 5.1% 2,101.0 5.1% 2,101.0 5.1% 2,101.0 5.1%
2020Q2 2,127.8 5.2% 2,127.8 5.2% 2,127.8 5.2% 2,127.8 5.2% 2,127.8 5.2%
FY19-20 8,353.2 4.6% 8,353.2 4.6% 8,353.2 4.6% 8,353.2 4.6% 8,353.2 4.6%
2020Q3 2,149.6 4.2% 2,149.6 4.2% 2,149.6 4.2% 2,149.6 4.2% 2,149.6 4.2%
2020Q4 2,170.6 4.0% 2,170.6 4.0% 2,170.6 4.0% 2,170.6 4.0% 2,170.6 4.0%
2021Q1 2,193.7 4.3% 2,193.7 4.3% 2,193.7 4.3% 2,193.7 4.3% 2,193.7 4.3%
2021Q2 2,216.3 4.2% 2,216.3 4.2% 2,216.3 4.2% 2,216.3 4.2% 2,216.3 4.2%
FY20-21 8,730.2 4.5% 8,730.2 4.5% 8,730.2 4.5% 8,730.2 4.5% 8,730.2 4.5%
2021Q3 2,239.9 4.3% 2,239.9 4.3% 2,239.9 4.3% 2,239.9 4.3% 2,239.9 4.3%
2021Q4 2,264.4 4.4% 2,264.4 4.4% 2,264.4 4.4% 2,264.4 4.4% 2,264.4 4.4%
2022Q1 2,290.3 4.7% 2,290.3 4.7% 2,290.3 4.7% 2,290.3 4.7% 2,290.3 4.7%
2022Q2 2,316.3 4.6% 2,316.3 4.6% 2,316.3 4.6% 2,316.3 4.6% 2,316.3 4.6%
FY21-22 9,110.9 4.4% 9,110.9 4.4% 9,110.9 4.4% 9,110.9 4.4% 9,110.9 4.4%
2022Q3 2,339.6 4.1% 2,339.6 4.1% 2,339.6 4.1% 2,339.6 4.1% 2,339.6 4.1%
2022Q4 2,363.4 4.1% 2,363.4 4.1% 2,363.4 4.1% 2,363.4 4.1% 2,363.4 4.1%
2023Q1 2,387.5 4.1% 2,387.5 4.1% 2,387.5 4.1% 2,387.5 4.1% 2,387.5 4.1%
2023Q2 2,411.4 4.1% 2,411.4 4.1% 2,411.4 4.1% 2,411.4 4.1% 2,411.4 4.1%
FY22-23 9,501.9 4.3% 9,501.9 4.3% 9,501.9 4.3% 9,501.9 4.3% 9,501.9 4.3%
Page 21

TABLE 16C- SALES TAX LIABILITY - SEASONALLY ADJUSTED QUARTERLY LEVELSTOURISM & RECREATION NON-DURABLES
annual annual annual annual annual
Date OLD % chg EDR % chg EOG % chg DOR % chg NEW % chg
2015Q3 1,293.0 42.5% 1,293.0 3.6% 1,293.0 3.6% 1,293.0 3.6% 1,293.0 42.7%
2015Q4 1,321.6 9.1% 1,321.6 9.1% 1,321.6 9.1% 1,321.6 9.1% 1,321.6 9.1%
2016Q1 1,338.7 5.3% 1,338.7 5.3% 1,338.7 5.3% 1,338.7 5.3% 1,338.7 5.3%
2016Q2 1,330.6 -2.4% 1,330.6 -2.4% 1,330.6 -2.4% 1,330.6 -2.4% 1,330.6 -2.4%
FY14-15 5,283.9 14.7% 5,283.9 5.7% 5,283.9 5.7% 5,283.9 5.7% 5,283.9 14.7%
2016Q3 1,348.8 5.6% 1,348.8 5.6% 1,348.8 5.6% 1,348.8 5.6% 1,348.8 5.6%
2016Q4 1,384.2 10.9% 1,384.2 10.9% 1,384.2 10.9% 1,384.2 10.9% 1,384.2 10.9%
2017Q1 1,384.8 0.2% 1,384.8 0.2% 1,384.8 0.2% 1,384.8 0.2% 1,384.8 0.2%
2017Q2 1,412.8 8.3% 1,412.8 8.3% 1,412.8 8.3% 1,412.8 8.3% 1,412.8 8.3%
FY16-17 5,530.6 4.7% 5,530.6 4.7% 5,530.6 4.7% 5,530.6 4.7% 5,530.6 4.7%
2017Q3 1,436.9 7.0% 1,436.9 7.0% 1,436.9 7.0% 1,436.9 7.0% 1,436.9 7.0%
2017Q4 1,445.5 2.4% 1,445.5 2.4% 1,445.5 2.4% 1,445.5 2.4% 1,445.5 2.4%
2018Q1 1,463.2 5.0% 1,463.2 5.0% 1,463.2 5.0% 1,463.2 5.0% 1,463.2 5.0%
2018Q2 1,478.3 4.2% 1,478.3 4.2% 1,478.3 4.2% 1,478.3 4.2% 1,478.3 4.2%
FY17-18 5,823.9 5.3% 5,823.9 5.3% 5,823.9 5.3% 5,823.9 5.3% 5,823.9 5.3%
2018Q3 1,495.6 4.8% 1,495.6 4.8% 1,495.6 4.8% 1,495.6 4.8% 1,495.6 4.8%
2018Q4 1,513.6 4.9% 1,513.6 4.9% 1,513.6 4.9% 1,513.6 4.9% 1,513.6 4.9%
2019Q1 1,532.7 5.1% 1,532.7 5.1% 1,532.7 5.1% 1,532.7 5.1% 1,532.7 5.1%
2019Q2 1,550.1 4.6% 1,550.1 4.6% 1,550.1 4.6% 1,550.1 4.6% 1,550.1 4.6%
FY18-19 6,092.0 4.6% 6,092.0 4.6% 6,092.0 4.6% 6,092.0 4.6% 6,092.0 4.6%
2019Q3 1,565.9 4.1% 1,565.9 4.1% 1,565.9 4.1% 1,565.9 4.1% 1,565.9 4.1%
2019Q4 1,582.0 4.2% 1,582.0 4.2% 1,582.0 4.2% 1,582.0 4.2% 1,582.0 4.2%
2020Q1 1,599.9 4.6% 1,599.9 4.6% 1,599.9 4.6% 1,599.9 4.6% 1,599.9 4.6%
2020Q2 1,617.3 4.4% 1,617.3 4.4% 1,617.3 4.4% 1,617.3 4.4% 1,617.3 4.4%
FY19-20 6,365.1 4.5% 6,365.1 4.5% 6,365.1 4.5% 6,365.1 4.5% 6,365.1 4.5%
2020Q3 1,632.2 3.7% 1,632.2 3.7% 1,632.2 3.7% 1,632.2 3.7% 1,632.2 3.7%
2020Q4 1,648.8 4.1% 1,648.8 4.1% 1,648.8 4.1% 1,648.8 4.1% 1,648.8 4.1%
2021Q1 1,671.5 5.6% 1,671.5 5.6% 1,671.5 5.6% 1,671.5 5.6% 1,671.5 5.6%
2021Q2 1,688.3 4.1% 1,688.3 4.1% 1,688.3 4.1% 1,688.3 4.1% 1,688.3 4.1%
FY20-21 6,640.8 4.3% 6,640.8 4.3% 6,640.8 4.3% 6,640.8 4.3% 6,640.8 4.3%
2021Q3 1,703.9 3.7% 1,703.9 3.7% 1,703.9 3.7% 1,703.9 3.7% 1,703.9 3.7%
2021Q4 1,721.1 4.1% 1,721.1 4.1% 1,721.1 4.1% 1,721.1 4.1% 1,721.1 4.1%
2022Q1 1,741.9 4.9% 1,741.9 4.9% 1,741.9 4.9% 1,741.9 4.9% 1,741.9 4.9%
2022Q2 1,758.9 4.0% 1,758.9 4.0% 1,758.9 4.0% 1,758.9 4.0% 1,758.9 4.0%
FY21-22 6,925.8 4.3% 6,925.8 4.3% 6,925.8 4.3% 6,925.8 4.3% 6,925.8 4.3%
2022Q3 1,775.1 3.7% 1,775.1 3.7% 1,775.1 3.7% 1,775.1 3.7% 1,775.1 3.7%
2022Q4 1,793.3 4.2% 1,793.3 4.2% 1,793.3 4.2% 1,793.3 4.2% 1,793.3 4.2%
2023Q1 1,815.9 5.1% 1,815.9 5.1% 1,815.9 5.1% 1,815.9 5.1% 1,815.9 5.1%
2023Q2 1,833.7 4.0% 1,833.7 4.0% 1,833.7 4.0% 1,833.7 4.0% 1,833.7 4.0%
FY22-23 7,218.0 4.2% 7,218.0 4.2% 7,218.0 4.2% 7,218.0 4.2% 7,218.0 4.2%
Page 22

TABLE 16D- SALES TAX LIABILITY - SEASONALLY ADJUSTED QUARTERLY LEVELSAUTOMOBILE RELATED CONSUMER DURABLES
annual annual annual annual annual
Date OLD % chg EDR % chg EOG % chg DOR % chg NEW % chg
2015Q3 1,034.8 54.2% 1,034.8 5.7% 1,034.8 5.7% 1,034.8 5.7% 1,034.8 54.5%
2015Q4 1,056.5 8.7% 1,056.5 8.7% 1,056.5 8.7% 1,056.5 8.7% 1,056.5 8.7%
2016Q1 1,050.5 -2.3% 1,050.5 -2.3% 1,050.5 -2.3% 1,050.5 -2.3% 1,050.5 -2.3%
2016Q2 1,059.9 3.6% 1,059.9 3.6% 1,059.9 3.6% 1,059.9 3.6% 1,059.9 3.6%
FY14-15 4,201.7 17.7% 4,201.7 7.4% 4,201.7 7.4% 4,201.7 7.4% 4,201.7 17.7%
2016Q3 1,094.2 13.6% 1,094.2 13.6% 1,094.2 13.6% 1,094.2 13.6% 1,094.2 13.6%
2016Q4 1,095.2 0.4% 1,095.2 0.4% 1,095.2 0.4% 1,095.2 0.4% 1,095.2 0.4%
2017Q1 1,113.9 7.0% 1,113.9 7.0% 1,113.9 7.0% 1,113.9 7.0% 1,113.9 7.0%
2017Q2 1,113.1 -0.3% 1,113.1 -0.3% 1,113.1 -0.3% 1,113.1 -0.3% 1,113.1 -0.3%
FY16-17 4,416.4 5.1% 4,416.4 5.1% 4,416.4 5.1% 4,416.4 5.1% 4,416.4 5.1%
2017Q3 1,107.6 -2.0% 1,107.6 -2.0% 1,107.6 -2.0% 1,107.6 -2.0% 1,107.6 -2.0%
2017Q4 1,149.1 15.9% 1,149.1 15.9% 1,149.1 15.9% 1,149.1 15.9% 1,149.1 15.9%
2018Q1 1,143.1 -2.1% 1,143.1 -2.1% 1,143.1 -2.1% 1,143.1 -2.1% 1,143.1 -2.1%
2018Q2 1,141.8 -0.5% 1,141.8 -0.5% 1,141.8 -0.5% 1,141.8 -0.5% 1,141.8 -0.5%
FY17-18 4,541.6 2.8% 4,541.6 2.8% 4,541.6 2.8% 4,541.6 2.8% 4,541.6 2.8%
2018Q3 1,150.5 3.1% 1,150.5 3.1% 1,150.5 3.1% 1,150.5 3.1% 1,150.5 3.1%
2018Q4 1,172.3 7.8% 1,172.3 7.8% 1,172.3 7.8% 1,172.3 7.8% 1,172.3 7.8%
2019Q1 1,192.0 6.9% 1,192.0 6.9% 1,192.0 6.9% 1,192.0 6.9% 1,192.0 6.9%
2019Q2 1,210.1 6.2% 1,210.1 6.2% 1,210.1 6.2% 1,210.1 6.2% 1,210.1 6.2%
FY18-19 4,724.9 4.0% 4,724.9 4.0% 4,724.9 4.0% 4,724.9 4.0% 4,724.9 4.0%
2019Q3 1,215.1 1.7% 1,215.1 1.7% 1,215.1 1.7% 1,215.1 1.7% 1,215.1 1.7%
2019Q4 1,222.6 2.5% 1,222.6 2.5% 1,222.6 2.5% 1,222.6 2.5% 1,222.6 2.5%
2020Q1 1,229.8 2.4% 1,229.8 2.4% 1,229.8 2.4% 1,229.8 2.4% 1,229.8 2.4%
2020Q2 1,237.8 2.6% 1,237.8 2.6% 1,237.8 2.6% 1,237.8 2.6% 1,237.8 2.6%
FY19-20 4,905.3 3.8% 4,905.3 3.8% 4,905.3 3.8% 4,905.3 3.8% 4,905.3 3.8%
2020Q3 1,247.8 3.3% 1,247.8 3.3% 1,247.8 3.3% 1,247.8 3.3% 1,247.8 3.3%
2020Q4 1,262.1 4.7% 1,262.1 4.7% 1,262.1 4.7% 1,262.1 4.7% 1,262.1 4.7%
2021Q1 1,274.8 4.1% 1,274.8 4.1% 1,274.8 4.1% 1,274.8 4.1% 1,274.8 4.1%
2021Q2 1,286.5 3.7% 1,286.5 3.7% 1,286.5 3.7% 1,286.5 3.7% 1,286.5 3.7%
FY20-21 5,071.2 3.4% 5,071.2 3.4% 5,071.2 3.4% 5,071.2 3.4% 5,071.2 3.4%
2021Q3 1,292.4 1.8% 1,292.4 1.8% 1,292.4 1.8% 1,292.4 1.8% 1,292.4 1.8%
2021Q4 1,303.7 3.5% 1,303.7 3.5% 1,303.7 3.5% 1,303.7 3.5% 1,303.7 3.5%
2022Q1 1,316.0 3.8% 1,316.0 3.8% 1,316.0 3.8% 1,316.0 3.8% 1,316.0 3.8%
2022Q2 1,326.6 3.3% 1,326.6 3.3% 1,326.6 3.3% 1,326.6 3.3% 1,326.6 3.3%
FY21-22 5,238.7 3.3% 5,238.7 3.3% 5,238.7 3.3% 5,238.7 3.3% 5,238.7 3.3%
2022Q3 1,336.5 3.0% 1,336.5 3.0% 1,336.5 3.0% 1,336.5 3.0% 1,336.5 3.0%
2022Q4 1,346.2 2.9% 1,346.2 2.9% 1,346.2 2.9% 1,346.2 2.9% 1,346.2 2.9%
2023Q1 1,355.6 2.8% 1,355.6 2.8% 1,355.6 2.8% 1,355.6 2.8% 1,355.6 2.8%
2023Q2 1,375.1 5.9% 1,375.1 5.9% 1,375.1 5.9% 1,375.1 5.9% 1,375.1 5.9%
FY22-23 5,413.4 3.3% 5,413.4 3.3% 5,413.4 3.3% 5,413.4 3.3% 5,413.4 3.3%
Page 23

TABLE 16E- SALES TAX LIABILITY - SEASONALLY ADJUSTED QUARTERLY LEVELSOTHER CONSUMER DURABLES
annual annual annual annual annual
Date OLD % chg EDR % chg EOG % chg DOR % chg NEW % chg
2015Q3 402.1 59.6% 402.1 21.8% 402.1 21.8% 402.1 21.8% 402.1 60.0%
2015Q4 392.6 -9.1% 392.6 -9.1% 392.6 -9.1% 392.6 -9.1% 392.6 -9.1%
2016Q1 381.4 -10.9% 381.4 -10.9% 381.4 -10.9% 381.4 -10.9% 381.4 -10.9%
2016Q2 396.2 16.4% 396.2 16.4% 396.2 16.4% 396.2 16.4% 396.2 16.4%
FY14-15 1,572.3 13.2% 1,572.3 4.8% 1,572.3 4.8% 1,572.3 4.8% 1,572.3 13.2%
2016Q3 400.0 3.9% 400.0 3.9% 400.0 3.9% 400.0 3.9% 400.0 3.9%
2016Q4 394.9 -5.0% 394.9 -5.0% 394.9 -5.0% 394.9 -5.0% 394.9 -5.0%
2017Q1 397.2 2.4% 397.2 2.4% 397.2 2.4% 397.2 2.4% 397.2 2.4%
2017Q2 402.2 5.1% 402.2 5.1% 402.2 5.1% 402.2 5.1% 402.2 5.1%
FY16-17 1,594.3 1.4% 1,594.3 1.4% 1,594.3 1.4% 1,594.3 1.4% 1,594.3 1.4%
2017Q3 401.7 -0.5% 401.7 -0.5% 401.7 -0.5% 401.7 -0.5% 401.7 -0.5%
2017Q4 406.6 5.0% 406.6 5.0% 406.6 5.0% 406.6 5.0% 406.6 5.0%
2018Q1 414.9 8.4% 414.9 8.4% 414.9 8.4% 414.9 8.4% 414.9 8.4%
2018Q2 423.2 8.2% 423.2 8.2% 423.2 8.2% 423.2 8.2% 423.2 8.2%
FY17-18 1,646.4 3.3% 1,646.4 3.3% 1,646.4 3.3% 1,646.4 3.3% 1,646.4 3.3%
2018Q3 423.6 0.4% 423.6 0.4% 423.6 0.4% 423.6 0.4% 423.6 0.4%
2018Q4 424.8 1.1% 424.8 1.1% 424.8 1.1% 424.8 1.1% 424.8 1.1%
2019Q1 425.5 0.7% 425.5 0.7% 425.5 0.7% 425.5 0.7% 425.5 0.7%
2019Q2 426.4 0.8% 426.4 0.8% 426.4 0.8% 426.4 0.8% 426.4 0.8%
FY18-19 1,700.3 3.3% 1,700.3 3.3% 1,700.3 3.3% 1,700.3 3.3% 1,700.3 3.3%
2019Q3 430.5 3.9% 430.5 3.9% 430.5 3.9% 430.5 3.9% 430.5 3.9%
2019Q4 435.1 4.3% 435.1 4.3% 435.1 4.3% 435.1 4.3% 435.1 4.3%
2020Q1 439.6 4.2% 439.6 4.2% 439.6 4.2% 439.6 4.2% 439.6 4.2%
2020Q2 444.5 4.5% 444.5 4.5% 444.5 4.5% 444.5 4.5% 444.5 4.5%
FY19-20 1,749.7 2.9% 1,749.7 2.9% 1,749.7 2.9% 1,749.7 2.9% 1,749.7 2.9%
2020Q3 446.6 1.9% 446.6 1.9% 446.6 1.9% 446.6 1.9% 446.6 1.9%
2020Q4 448.7 1.9% 448.7 1.9% 448.7 1.9% 448.7 1.9% 448.7 1.9%
2021Q1 450.9 2.0% 450.9 2.0% 450.9 2.0% 450.9 2.0% 450.9 2.0%
2021Q2 453.1 2.0% 453.1 2.0% 453.1 2.0% 453.1 2.0% 453.1 2.0%
FY20-21 1,799.3 2.8% 1,799.3 2.8% 1,799.3 2.8% 1,799.3 2.8% 1,799.3 2.8%
2021Q3 456.9 3.4% 456.9 3.4% 456.9 3.4% 456.9 3.4% 456.9 3.4%
2021Q4 460.6 3.3% 460.6 3.3% 460.6 3.3% 460.6 3.3% 460.6 3.3%
2022Q1 464.4 3.3% 464.4 3.3% 464.4 3.3% 464.4 3.3% 464.4 3.3%
2022Q2 468.1 3.2% 468.1 3.2% 468.1 3.2% 468.1 3.2% 468.1 3.2%
FY21-22 1,850.0 2.8% 1,850.0 2.8% 1,850.0 2.8% 1,850.0 2.8% 1,850.0 2.8%
2022Q3 470.5 2.1% 470.5 2.1% 470.5 2.1% 470.5 2.1% 470.5 2.1%
2022Q4 472.8 2.0% 472.8 2.0% 472.8 2.0% 472.8 2.0% 472.8 2.0%
2023Q1 475.2 2.0% 475.2 2.0% 475.2 2.0% 475.2 2.0% 475.2 2.0%
2023Q2 477.7 2.1% 477.7 2.1% 477.7 2.1% 477.7 2.1% 477.7 2.1%
FY22-23 1,896.2 2.5% 1,896.2 2.5% 1,896.2 2.5% 1,896.2 2.5% 1,896.2 2.5%
Page 24

TABLE16F- SALES TAX LIABILITY - SEASONALLY ADJUSTED QUARTERLY LEVELSCONSTRUCTION
annual annual annual annual annual
Date OLD % chg EDR % chg EOG % chg DOR % chg NEW % chg
2015Q3 347.7 55.1% 347.7 3.7% 347.7 3.7% 347.7 3.7% 347.7 57.2%
2015Q4 353.2 6.5% 353.2 6.5% 353.2 6.5% 353.2 6.5% 353.2 6.5%
2016Q1 365.6 14.8% 365.6 14.8% 365.6 14.8% 365.6 14.8% 365.6 14.8%
2016Q2 359.6 -6.4% 359.6 -6.4% 359.6 -6.4% 359.6 -6.4% 359.6 -6.4%
FY14-15 1,426.1 18.7% 1,426.1 8.1% 1,426.1 8.1% 1,426.1 18.7% 1,426.1 18.7%
2016Q3 369.8 11.8% 369.8 11.8% 369.8 11.8% 369.8 11.8% 369.8 11.8%
2016Q4 377.5 8.6% 377.5 8.6% 377.5 8.6% 377.5 8.6% 377.5 8.6%
2017Q1 388.9 12.6% 388.9 12.6% 388.9 12.6% 388.9 12.6% 388.9 12.6%
2017Q2 388.1 -0.8% 388.1 -0.8% 388.1 -0.8% 388.1 -0.8% 388.1 -0.8%
FY16-17 1,524.3 6.9% 1,524.3 6.9% 1,524.3 6.9% 1,524.3 6.9% 1,524.3 6.9%
2017Q3 388.9 0.8% 388.9 0.8% 388.9 0.8% 388.9 0.8% 388.9 0.8%
2017Q4 406.0 18.8% 406.0 18.8% 406.0 18.8% 406.0 18.8% 406.0 18.8%
2018Q1 413.8 7.9% 413.8 7.9% 413.8 7.9% 413.8 7.9% 413.8 7.9%
2018Q2 421.5 7.7% 421.5 7.7% 421.5 7.7% 421.5 7.7% 421.5 7.7%
FY17-18 1,630.2 6.9% 1,630.2 6.9% 1,630.2 6.9% 1,630.2 6.9% 1,630.2 6.9%
2018Q3 425.8 4.1% 425.8 4.1% 425.8 4.1% 425.8 4.1% 425.8 4.1%
2018Q4 431.6 5.6% 431.6 5.6% 431.6 5.6% 431.6 5.6% 431.6 5.6%
2019Q1 436.9 5.0% 436.9 5.0% 436.9 5.0% 436.9 5.0% 436.9 5.0%
2019Q2 442.1 4.8% 442.1 4.8% 442.1 4.8% 442.1 4.8% 442.1 4.8%
FY18-19 1,736.4 6.5% 1,736.4 6.5% 1,736.4 6.5% 1,736.4 6.5% 1,736.4 6.5%
2019Q3 448.2 5.6% 448.2 5.6% 448.2 5.6% 448.2 5.6% 448.2 5.6%
2019Q4 454.7 5.9% 454.7 5.9% 454.7 5.9% 454.7 5.9% 454.7 5.9%
2020Q1 461.3 5.9% 461.3 5.9% 461.3 5.9% 461.3 5.9% 461.3 5.9%
2020Q2 468.2 6.1% 468.2 6.1% 468.2 6.1% 468.2 6.1% 468.2 6.1%
FY19-20 1,832.4 5.5% 1,832.4 5.5% 1,832.4 5.5% 1,832.4 5.5% 1,832.4 5.5%
2020Q3 474.3 5.3% 474.3 5.3% 474.3 5.3% 474.3 5.3% 474.3 5.3%
2020Q4 480.3 5.2% 480.3 5.2% 480.3 5.2% 480.3 5.2% 480.3 5.2%
2021Q1 486.5 5.3% 486.5 5.3% 486.5 5.3% 486.5 5.3% 486.5 5.3%
2021Q2 493.1 5.5% 493.1 5.5% 493.1 5.5% 493.1 5.5% 493.1 5.5%
FY20-21 1,934.2 5.6% 1,934.2 5.6% 1,934.2 5.6% 1,934.2 5.6% 1,934.2 5.6%
2021Q3 499.7 5.5% 499.7 5.5% 499.7 5.5% 499.7 5.5% 499.7 5.5%
2021Q4 506.0 5.1% 506.0 5.1% 506.0 5.1% 506.0 5.1% 506.0 5.1%
2022Q1 512.3 5.1% 512.3 5.1% 512.3 5.1% 512.3 5.1% 512.3 5.1%
2022Q2 518.6 5.0% 518.6 5.0% 518.6 5.0% 518.6 5.0% 518.6 5.0%
FY21-22 2,036.6 5.3% 2,036.6 5.3% 2,036.6 5.3% 2,036.6 5.3% 2,036.6 5.3%
2022Q3 524.4 4.5% 524.4 4.5% 524.4 4.5% 524.4 4.5% 524.4 4.5%
2022Q4 530.0 4.3% 530.0 4.3% 530.0 4.3% 530.0 4.3% 530.0 4.3%
2023Q1 535.7 4.4% 535.7 4.4% 535.7 4.4% 535.7 4.4% 535.7 4.4%
2023Q2 541.7 4.6% 541.7 4.6% 541.7 4.6% 541.7 4.6% 541.7 4.6%
FY22-23 2,131.8 4.7% 2,131.8 4.7% 2,131.8 4.7% 2,131.8 4.7% 2,131.8 4.7%
Page 25
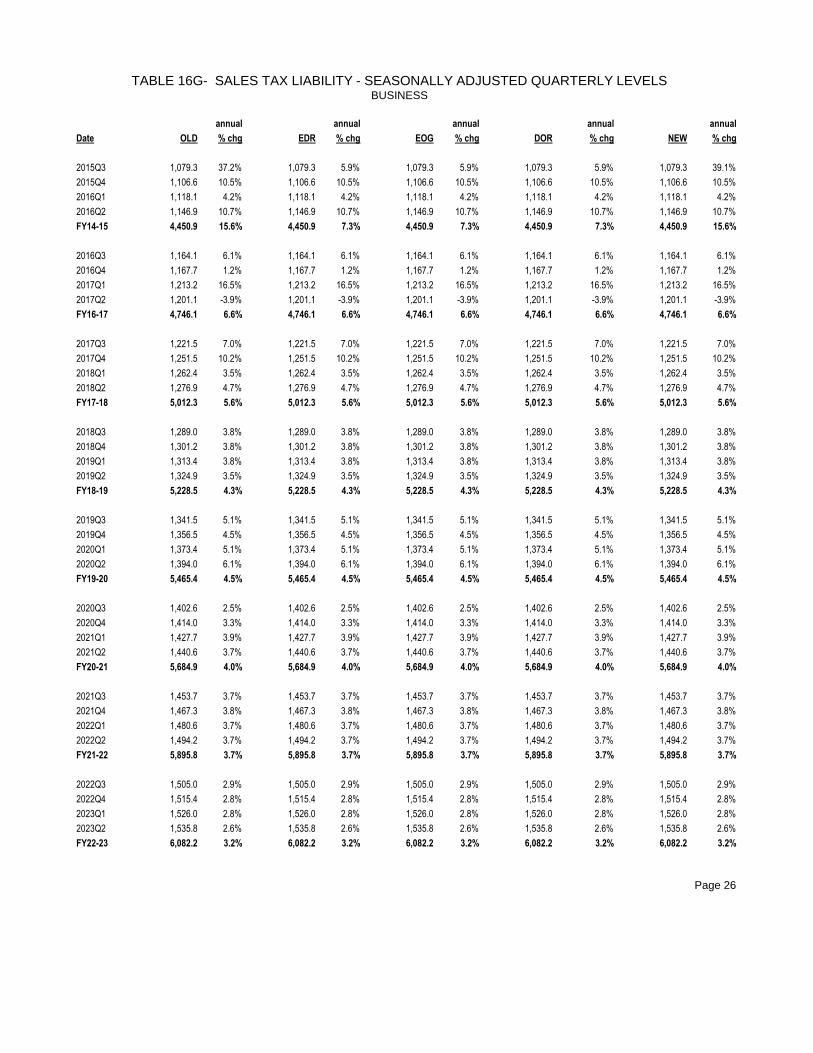
TABLE 16G- SALES TAX LIABILITY - SEASONALLY ADJUSTED QUARTERLY LEVELSBUSINESS
annual annual annual annual annual
Date OLD % chg EDR % chg EOG % chg DOR % chg NEW % chg
2015Q3 1,079.3 37.2% 1,079.3 5.9% 1,079.3 5.9% 1,079.3 5.9% 1,079.3 39.1%
2015Q4 1,106.6 10.5% 1,106.6 10.5% 1,106.6 10.5% 1,106.6 10.5% 1,106.6 10.5%
2016Q1 1,118.1 4.2% 1,118.1 4.2% 1,118.1 4.2% 1,118.1 4.2% 1,118.1 4.2%
2016Q2 1,146.9 10.7% 1,146.9 10.7% 1,146.9 10.7% 1,146.9 10.7% 1,146.9 10.7%
FY14-15 4,450.9 15.6% 4,450.9 7.3% 4,450.9 7.3% 4,450.9 7.3% 4,450.9 15.6%
2016Q3 1,164.1 6.1% 1,164.1 6.1% 1,164.1 6.1% 1,164.1 6.1% 1,164.1 6.1%
2016Q4 1,167.7 1.2% 1,167.7 1.2% 1,167.7 1.2% 1,167.7 1.2% 1,167.7 1.2%
2017Q1 1,213.2 16.5% 1,213.2 16.5% 1,213.2 16.5% 1,213.2 16.5% 1,213.2 16.5%
2017Q2 1,201.1 -3.9% 1,201.1 -3.9% 1,201.1 -3.9% 1,201.1 -3.9% 1,201.1 -3.9%
FY16-17 4,746.1 6.6% 4,746.1 6.6% 4,746.1 6.6% 4,746.1 6.6% 4,746.1 6.6%
2017Q3 1,221.5 7.0% 1,221.5 7.0% 1,221.5 7.0% 1,221.5 7.0% 1,221.5 7.0%
2017Q4 1,251.5 10.2% 1,251.5 10.2% 1,251.5 10.2% 1,251.5 10.2% 1,251.5 10.2%
2018Q1 1,262.4 3.5% 1,262.4 3.5% 1,262.4 3.5% 1,262.4 3.5% 1,262.4 3.5%
2018Q2 1,276.9 4.7% 1,276.9 4.7% 1,276.9 4.7% 1,276.9 4.7% 1,276.9 4.7%
FY17-18 5,012.3 5.6% 5,012.3 5.6% 5,012.3 5.6% 5,012.3 5.6% 5,012.3 5.6%
2018Q3 1,289.0 3.8% 1,289.0 3.8% 1,289.0 3.8% 1,289.0 3.8% 1,289.0 3.8%
2018Q4 1,301.2 3.8% 1,301.2 3.8% 1,301.2 3.8% 1,301.2 3.8% 1,301.2 3.8%
2019Q1 1,313.4 3.8% 1,313.4 3.8% 1,313.4 3.8% 1,313.4 3.8% 1,313.4 3.8%
2019Q2 1,324.9 3.5% 1,324.9 3.5% 1,324.9 3.5% 1,324.9 3.5% 1,324.9 3.5%
FY18-19 5,228.5 4.3% 5,228.5 4.3% 5,228.5 4.3% 5,228.5 4.3% 5,228.5 4.3%
2019Q3 1,341.5 5.1% 1,341.5 5.1% 1,341.5 5.1% 1,341.5 5.1% 1,341.5 5.1%
2019Q4 1,356.5 4.5% 1,356.5 4.5% 1,356.5 4.5% 1,356.5 4.5% 1,356.5 4.5%
2020Q1 1,373.4 5.1% 1,373.4 5.1% 1,373.4 5.1% 1,373.4 5.1% 1,373.4 5.1%
2020Q2 1,394.0 6.1% 1,394.0 6.1% 1,394.0 6.1% 1,394.0 6.1% 1,394.0 6.1%
FY19-20 5,465.4 4.5% 5,465.4 4.5% 5,465.4 4.5% 5,465.4 4.5% 5,465.4 4.5%
2020Q3 1,402.6 2.5% 1,402.6 2.5% 1,402.6 2.5% 1,402.6 2.5% 1,402.6 2.5%
2020Q4 1,414.0 3.3% 1,414.0 3.3% 1,414.0 3.3% 1,414.0 3.3% 1,414.0 3.3%
2021Q1 1,427.7 3.9% 1,427.7 3.9% 1,427.7 3.9% 1,427.7 3.9% 1,427.7 3.9%
2021Q2 1,440.6 3.7% 1,440.6 3.7% 1,440.6 3.7% 1,440.6 3.7% 1,440.6 3.7%
FY20-21 5,684.9 4.0% 5,684.9 4.0% 5,684.9 4.0% 5,684.9 4.0% 5,684.9 4.0%
2021Q3 1,453.7 3.7% 1,453.7 3.7% 1,453.7 3.7% 1,453.7 3.7% 1,453.7 3.7%
2021Q4 1,467.3 3.8% 1,467.3 3.8% 1,467.3 3.8% 1,467.3 3.8% 1,467.3 3.8%
2022Q1 1,480.6 3.7% 1,480.6 3.7% 1,480.6 3.7% 1,480.6 3.7% 1,480.6 3.7%
2022Q2 1,494.2 3.7% 1,494.2 3.7% 1,494.2 3.7% 1,494.2 3.7% 1,494.2 3.7%
FY21-22 5,895.8 3.7% 5,895.8 3.7% 5,895.8 3.7% 5,895.8 3.7% 5,895.8 3.7%
2022Q3 1,505.0 2.9% 1,505.0 2.9% 1,505.0 2.9% 1,505.0 2.9% 1,505.0 2.9%
2022Q4 1,515.4 2.8% 1,515.4 2.8% 1,515.4 2.8% 1,515.4 2.8% 1,515.4 2.8%
2023Q1 1,526.0 2.8% 1,526.0 2.8% 1,526.0 2.8% 1,526.0 2.8% 1,526.0 2.8%
2023Q2 1,535.8 2.6% 1,535.8 2.6% 1,535.8 2.6% 1,535.8 2.6% 1,535.8 2.6%
FY22-23 6,082.2 3.2% 6,082.2 3.2% 6,082.2 3.2% 6,082.2 3.2% 6,082.2 3.2%
Page 26

*Revision to the February 9, 2018 General Revenue Conference EstimateNet
Receipts Refunds % of Collections
($ Millions) % chg ($ Millions) receipts ($ Millions) % chg________ _____ ________ _____ ________ _____
1997-98 1,395.7 2.4 124.4 8.9 1,271.3 3.1
1998-99 1,472.2 5.5 205.2 13.9 1,267.0 -0.3
1999-00 1,406.5 -4.5 217.2 15.4 1,189.3 -6.1
2000-01 1,344.8 -4.4 206.3 15.3 1,138.5 -4.3
2001-02 1,218.5 -9.4 255.2 20.9 963.3 -15.4
2002-03 1,228.1 0.8 267.2 21.8 960.9 -21.1
2003-04 1,344.8 9.5 210.1 15.6 1,134.7 18.1
2004-05 1,729.7 28.6 156.6 9.1 1,573.1 38.6
2005-06 2,405.4 39.1 174.2 7.2 2,231.2 41.8
2006-07 2,443.7 1.6 195.2 8.0 2,248.5 0.8
2007-08 2,216.8 -9.3 295.8 13.3 1,921.0 -14.6
2008-09 1,833.4 -17.3 415.0 22.6 1,418.4 -26.2
2009-10 1,790.0 -2.4 329.9 18.4 1,460.1 2.9
2010-11 1,874.5 4.7 201.9 10.8 1,672.6 14.6
2011-12 2,010.8 7.3 193.4 9.6 1,817.4 8.7
2012-13 2,081.0 3.5 168.2 8.1 1,912.8 5.3
2013-14** 2,042.5 -1.9 261.6 12.8 1,780.9 -6.9
2014-15 2,236.3 9.5 245.7 11.0 1,990.6 11.8
2015-16 2,272.1 1.6 301.2 13.3 1,970.9 -1.0
2016-17 2,366.4 4.2 193.9 8.2 2,172.5 10.2
2017-18 OLD 2,320.4 -1.9 223.0 9.6 2,097.4 -3.5
2017-18 EDR 2,320.4 -1.9 223.0 9.6 2,097.4 -3.5
2017-18 EOG 2,320.4 -1.9 223.0 9.6 2,097.4 -3.5
2017-18 DOR 2,320.4 -1.9 223.0 9.6 2,097.4 -3.5
2017-18 NEW* 2,320.4 -1.9 223.0 9.6 2,097.4 -3.5
2018-19 OLD 2,394.8 3.2 221.2 9.2 2,173.6 3.6
2018-19 EDR 2,394.8 3.2 221.2 9.2 2,173.6 3.6
2018-19 EOG 2,394.8 3.2 221.2 9.2 2,173.6 3.6
2018-19 DOR 2,394.8 3.2 221.2 9.2 2,173.6 3.6
2018-19 NEW* 2,376.2 2.4 221.2 9.3 2,155.0 2.7
2019-20 OLD 2,404.7 0.4 219.2 9.1 2,185.5 0.5
2019-20 EDR 2,404.7 0.4 219.2 9.1 2,185.5 0.5
2019-20 EOG 2,404.7 0.4 219.2 9.1 2,185.5 0.5
2019-20 DOR 2,404.7 0.4 219.2 9.1 2,185.5 0.5
2019-20 NEW* 2,394.7 0.8 219.2 9.2 2,175.5 1.0
2020-21 OLD 2,451.1 1.9 216.7 8.8 2,234.4 2.2
2020-21 EDR 2,451.1 1.9 216.7 8.8 2,234.4 2.2
2020-21 EOG 2,451.1 1.9 216.7 8.8 2,234.4 2.2
2020-21 DOR 2,451.1 1.9 216.7 8.8 2,234.4 2.2
2020-21 NEW* 2,441.1 1.9 216.7 8.9 2,224.4 2.2
2021-22 OLD 2,507.5 2.3 219.5 8.8 2,288.0 2.4
2021-22 EDR 2,507.5 2.3 219.5 8.8 2,288.0 2.4
2021-22 EOG 2,507.5 2.3 219.5 8.8 2,288.0 2.4
2021-22 DOR 2,507.5 2.3 219.5 8.8 2,288.0 2.4
2021-22 NEW* 2,497.5 2.3 219.5 8.8 2,278.0 2.4
2022-23 OLD 2,579.7 2.9 220.2 8.5 2,359.5 3.1
2022-23 EDR 2,579.7 2.9 220.2 8.5 2,359.5 3.1
2022-23 EOG 2,579.7 2.9 220.2 8.5 2,359.5 3.1
2022-23 DOR 2,579.7 2.9 220.2 8.5 2,359.5 3.1
2022-23 NEW* 2,569.7 2.9 220.2 8.6 2,349.5 3.1
** For 2013-14, both collections and refunds are artificially high by a like amount due to unusual and atypical payment and
refund activity that is not expected to occur again in the forecast period.
Page 27
TABLE 17
CORPORATE INCOME TAX

TABLE 18A
DOCUMENTARY STAMP TAX COLLECTIONS ($ Millions)
Documents relating to real property - $.70 per $100
Corporate shares, bonds, certificates of indebtedness, promissory notes, retail charge accounts - $0.35 per $100.
OLD % chg EDR % chg EOG % chg DOR % chg NEW % chg______ ____ ______ ____ ______ ____ ______ ____ ______ ____
1997-98 1,045.4 23.8
1998-99 1,185.1 13.4
1999-00 1,223.5 3.2
2000-01 1,313.2 7.3
2001-02 1,572.5 19.7
2002-03 2,001.5 27.3
2003-04 2,632.1 31.5
2004-05 3,365.2 27.9
2005-06 4,058.3 20.6
2006-07 3,032.8 -25.3
2007-08 1,954.9 -35.5
2008-09 1,122.8 -42.6
2009-10 1,078.6 -3.9
2010-11 1,156.5 7.2
2011-12 1,261.6 9.1
2012-13 1,643.4 30.3
2013-14 1,812.5 10.3
2014-15 2,120.8 17.0
2015-16 2,276.9 7.4
2016-17 2,417.8 6.2
2017-18 2,509.6 3.8 2,509.6 3.8 2,509.6 3.8 2,509.6 3.8 2,509.6 3.8
2018-19 2,622.6 4.5 2,622.6 4.5 2,622.6 4.5 2,622.6 4.5 2,620.6 4.4
2019-20 2,730.1 4.1 2,730.1 4.1 2,730.1 4.1 2,730.1 4.1 2,728.0 4.1
2020-21 2,828.4 3.6 2,828.4 3.6 2,828.4 3.6 2,828.4 3.6 2,826.2 3.6
2021-22 2,930.2 3.6 2,930.2 3.6 2,930.2 3.6 2,930.2 3.6 2,928.0 3.6
2022-23 3,032.8 3.5 3,032.8 3.5 3,032.8 3.5 3,032.8 3.5 3,030.5 3.5
2023-24 3,135.9 3.4 3,135.9 3.4 3,135.9 3.4 3,135.9 3.4 3,135.9 3.5
2024-25 3,239.4 3.3 3,239.4 3.3 3,239.4 3.3 3,239.4 3.3 3,239.4 3.3
2025-26 3,339.8 3.1 3,339.8 3.1 3,339.8 3.1 3,339.8 3.1 3,339.8 3.1
2026-27 3,443.3 3.1 3,443.3 3.1 3,443.3 3.1 3,443.3 3.1 3,443.3 3.1
2027-28 3,550.0 3.1 3,550.0 3.1 3,550.0 3.1 3,550.0 3.1 3,550.0 3.1
Page 28

TABLE 18B
DOCUMENTARY STAMP TAX DISTRIBUTIONS ($ Millions)
Total DOR Admin Service General
Receipts Costs Charge Revenue________ ________ ________ ________
1997-98 1,045.4 6.8 72.2 429.6
1998-99 1,185.1 6.1 82.6 479.9
1999-00 1,223.5 5.8 84.7 453.8
2000-01 1,313.2 7.8 91.9 479.2
2001-02 1,572.5 7.2 109.3 602.9
2002-03 2,001.5 8.1 140.1 840.9
2003-04 2,632.1 8.3 183.9 1,181.0
2004-05 3,365.2 8.7 235.2 1,601.2
2005-06 4,058.3 9.3 283.7 1,241.8
2006-07 3,032.8 8.8 212.1 625.5
2007-08 1,954.9 10.3 136.7 203.4
2008-09 1,122.8 8.9 78.8 130.2
2009-10 1,078.6 9.4 86.3 143.3
2010-11 1,156.5 9.1 92.5 167.2
2011-12 1,261.6 7.7 101.0 208.6
2012-13 1,643.4 9.8 131.4 381.0
2013-14 1,812.5 9.8 144.8 603.7
2014-15 2,120.8 9.8 169.5 756.3
2015-16 2,276.9 9.8 122.1 744.1
2016-17 2,417.8 9.8 129.6 762.2
2017-18 OLD 2,509.6 9.8 134.8 867.9
2017-18 EDR 2,509.6 9.8 134.8 867.9
2017-18 EOG 2,509.6 9.8 134.8 867.9
2017-18 DOR 2,509.6 9.8 134.8 867.9
2017-18 NEW 2,509.6 9.8 134.8 867.9
2018-19 OLD 2,622.6 9.8 140.8 903.7
2018-19 EDR 2,622.6 9.8 140.8 903.7
2018-19 EOG 2,622.6 9.8 140.8 903.7
2018-19 DOR 2,622.6 9.8 140.8 903.7
2018-19 NEW 2,620.6 9.8 140.6 903.1
2019-20 OLD 2,730.1 9.8 146.6 937.9
2019-20 EDR 2,730.1 9.8 146.6 937.9
2019-20 EOG 2,730.1 9.8 146.6 937.9
2019-20 DOR 2,730.1 9.8 146.6 937.9
2019-20 NEW 2,728.0 9.8 146.4 937.3
2020-21 OLD 2,828.4 9.8 151.9 969.0
2020-21 EDR 2,828.4 9.8 151.9 969.0
2020-21 EOG 2,828.4 9.8 151.9 969.0
2020-21 DOR 2,828.4 9.8 151.9 969.0
2020-21 NEW 2,826.2 9.8 151.7 968.3
2021-22 OLD 2,930.2 9.8 157.3 1,001.4
2021-22 EDR 2,930.2 9.8 157.3 1,001.4
2021-22 EOG 2,930.2 9.8 157.3 1,001.4
2021-22 DOR 2,930.2 9.8 157.3 1,001.4
2021-22 NEW 2,928.0 9.8 157.1 1,000.7
2022-23 OLD 3,032.8 9.8 162.8 1,033.9
2022-23 EDR 3,032.8 9.8 162.8 1,033.9
2022-23 EOG 3,032.8 9.8 162.8 1,033.9
2022-23 DOR 3,032.8 9.8 162.8 1,033.9
2022-23 NEW 3,030.5 9.8 162.6 1,033.2
Page 29
Additional detail regarding the distributions of revenues can be found on the Economic & Demographic website at "edr.state.fl.us"
under the "Consensus Estimating Conferences" link.

Types "B" & "D" - Increase exemption to first $250,000/$500,000 of taxable assets for returns due beginning in 2004.
Tax repealed effective January 1, 2007.
Types "B" & "D" Type "C" Less: refunds & County Revenue General
Collections % chg Collections % chg other cash adj. Sharing Distribution Revenue________ ____ ________ ____ ____________ ____________ ________
2001-02 450.5 -6.0 332.8 39.9 56.5 726.8
2002-03 366.3 -18.7 460.5 38.4 61.4 765.4
2003-04 275.1 -24.9 582.0 26.4 62.1 795.0
2004-05 303.0 10.1 678.1 16.5 981.1
2005-06 194.5 -35.8 890.5 31.3 1085.0
2006-07 45.9 -76.4 726.7 -18.4 772.6
2007-08 436.3 -40.0 436.3
2008-09 200.0 -54.2 200.0
2009-10 158.7 -20.7 158.7
2010-11 162.5 2.4 162.5
2011-12 184.6 13.6 184.6
2012-13 276.5 49.8 276.5
2013-14 256.1 -7.4 256.1
2014-15 303.9 18.7 303.9
2015-16 338.7 11.5 338.7
2016-17 372.9 10.1 372.9
2017-18 OLD 382.2 2.5 382.2
2017-18 EDR 382.2 2.5 382.2
2017-18 EOG 382.2 2.5 382.2
2017-18 DOR 382.2 2.5 382.2
2017-18 NEW 382.2 2.5 382.2
2018-19 OLD 399.0 4.4 399.0
2018-19 EDR 399.0 4.4 399.0
2018-19 EOG 399.0 4.4 399.0
2018-19 DOR 399.0 4.4 399.0
2018-19 NEW 399.0 4.4 399.0
2019-20 OLD 414.5 3.9 414.5
2019-20 EDR 414.5 3.9 414.5
2019-20 EOG 414.5 3.9 414.5
2019-20 DOR 414.5 3.9 414.5
2019-20 NEW 414.5 3.9 414.5
2020-21 OLD 429.9 3.7 429.9
2020-21 EDR 429.9 3.7 429.9
2020-21 EOG 429.9 3.7 429.9
2020-21 DOR 429.9 3.7 429.9
2020-21 NEW 429.9 3.7 429.9
2021-22 OLD 445.3 3.6 445.3
2021-22 EDR 445.3 3.6 445.3
2021-22 EOG 445.3 3.6 445.3
2021-22 DOR 445.3 3.6 445.3
2021-22 NEW 445.3 3.6 445.3
2022-23 OLD 461.4 3.6 461.4
2022-23 EDR 461.4 3.6 461.4
2022-23 EOG 461.4 3.6 461.4
2022-23 DOR 461.4 3.6 461.4
2022-23 NEW 461.4 3.6 461.4
Page 30
TABLE 19
INTANGIBLES TAX
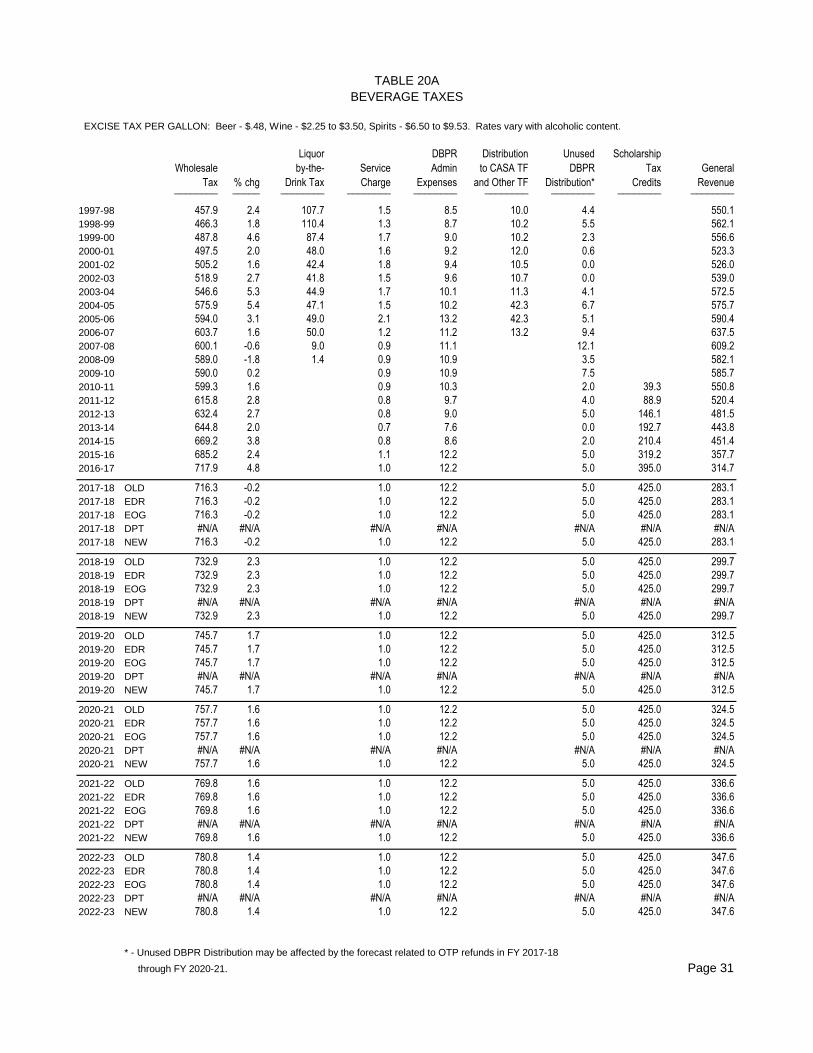
TABLE 20A
BEVERAGE TAXES
EXCISE TAX PER GALLON: Beer - $.48, Wine - $2.25 to $3.50, Spirits - $6.50 to $9.53. Rates vary with alcoholic content.
Liquor DBPR Distribution Unused Scholarship
Wholesale by-the- Service Admin to CASA TF DBPR Tax General
Tax % chg Drink Tax Charge Expenses and Other TF Distribution* Credits Revenue________ _____ ________ ________ ________ ________ ________ ________ ________
1997-98 457.9 2.4 107.7 1.5 8.5 10.0 4.4 550.1
1998-99 466.3 1.8 110.4 1.3 8.7 10.2 5.5 562.1
1999-00 487.8 4.6 87.4 1.7 9.0 10.2 2.3 556.6
2000-01 497.5 2.0 48.0 1.6 9.2 12.0 0.6 523.3
2001-02 505.2 1.6 42.4 1.8 9.4 10.5 0.0 526.0
2002-03 518.9 2.7 41.8 1.5 9.6 10.7 0.0 539.0
2003-04 546.6 5.3 44.9 1.7 10.1 11.3 4.1 572.5
2004-05 575.9 5.4 47.1 1.5 10.2 42.3 6.7 575.7
2005-06 594.0 3.1 49.0 2.1 13.2 42.3 5.1 590.4
2006-07 603.7 1.6 50.0 1.2 11.2 13.2 9.4 637.5
2007-08 600.1 -0.6 9.0 0.9 11.1 12.1 609.2
2008-09 589.0 -1.8 1.4 0.9 10.9 3.5 582.1
2009-10 590.0 0.2 0.9 10.9 7.5 585.7
2010-11 599.3 1.6 0.9 10.3 2.0 39.3 550.8
2011-12 615.8 2.8 0.8 9.7 4.0 88.9 520.4
2012-13 632.4 2.7 0.8 9.0 5.0 146.1 481.5
2013-14 644.8 2.0 0.7 7.6 0.0 192.7 443.8
2014-15 669.2 3.8 0.8 8.6 2.0 210.4 451.4
2015-16 685.2 2.4 1.1 12.2 5.0 319.2 357.7
2016-17 717.9 4.8 1.0 12.2 5.0 395.0 314.7
2017-18 OLD 716.3 -0.2 1.0 12.2 5.0 425.0 283.1
2017-18 EDR 716.3 -0.2 1.0 12.2 5.0 425.0 283.1
2017-18 EOG 716.3 -0.2 1.0 12.2 5.0 425.0 283.1
2017-18 DPT #N/A #N/A #N/A #N/A #N/A #N/A #N/A
2017-18 NEW 716.3 -0.2 1.0 12.2 5.0 425.0 283.1
2018-19 OLD 732.9 2.3 1.0 12.2 5.0 425.0 299.7
2018-19 EDR 732.9 2.3 1.0 12.2 5.0 425.0 299.7
2018-19 EOG 732.9 2.3 1.0 12.2 5.0 425.0 299.7
2018-19 DPT #N/A #N/A #N/A #N/A #N/A #N/A #N/A
2018-19 NEW 732.9 2.3 1.0 12.2 5.0 425.0 299.7
2019-20 OLD 745.7 1.7 1.0 12.2 5.0 425.0 312.5
2019-20 EDR 745.7 1.7 1.0 12.2 5.0 425.0 312.5
2019-20 EOG 745.7 1.7 1.0 12.2 5.0 425.0 312.5
2019-20 DPT #N/A #N/A #N/A #N/A #N/A #N/A #N/A
2019-20 NEW 745.7 1.7 1.0 12.2 5.0 425.0 312.5
2020-21 OLD 757.7 1.6 1.0 12.2 5.0 425.0 324.5
2020-21 EDR 757.7 1.6 1.0 12.2 5.0 425.0 324.5
2020-21 EOG 757.7 1.6 1.0 12.2 5.0 425.0 324.5
2020-21 DPT #N/A #N/A #N/A #N/A #N/A #N/A #N/A
2020-21 NEW 757.7 1.6 1.0 12.2 5.0 425.0 324.5
2021-22 OLD 769.8 1.6 1.0 12.2 5.0 425.0 336.6
2021-22 EDR 769.8 1.6 1.0 12.2 5.0 425.0 336.6
2021-22 EOG 769.8 1.6 1.0 12.2 5.0 425.0 336.6
2021-22 DPT #N/A #N/A #N/A #N/A #N/A #N/A #N/A
2021-22 NEW 769.8 1.6 1.0 12.2 5.0 425.0 336.6
2022-23 OLD 780.8 1.4 1.0 12.2 5.0 425.0 347.6
2022-23 EDR 780.8 1.4 1.0 12.2 5.0 425.0 347.6
2022-23 EOG 780.8 1.4 1.0 12.2 5.0 425.0 347.6
2022-23 DPT #N/A #N/A #N/A #N/A #N/A #N/A #N/A
2022-23 NEW 780.8 1.4 1.0 12.2 5.0 425.0 347.6
* - Unused DBPR Distribution may be affected by the forecast related to OTP refunds in FY 2017-18
through FY 2020-21. Page 31

TABLE 20B
BEVERAGE TAXES - CONSUMPTION IN GALLONS
Quarts Kegs Pints Total % chg Millions % chg Millions % chg________ ________ ________ ________ _____ ________ _____ ________ _____
1997-98 19.9 39.2 312.3 371.4 0.8 36.9 4.9 24.3 1.9
1998-99 18.4 38.4 323.3 380.4 2.4 38.1 1.2 24.6 1.2
1999-00 17.5 39.0 331.2 387.6 1.9 41.4 8.7 26.1 6.2
2000-01 16.5 39.3 337.0 392.8 1.3 42.6 2.9 26.9 3.0
2001-02 20.8 39.6 340.3 400.7 2.0 43.5 2.1 27.1 0.7
2002-03 24.2 40.3 339.8 404.3 0.9 46.2 6.2 28.1 3.7
2003-04 25.2 41.0 349.6 415.8 2.9 49.8 7.8 29.9 6.4
2004-05 25.3 41.3 362.3 428.9 3.1 50.1 0.6 32.2 7.6
2005-06 24.0 42.2 376.6 442.8 3.2 54.9 9.6 33.1 2.8
2006-07 23.6 43.5 373.9 441.0 -0.4 57.2 4.2 34.0 2.7
2007-08 22.3 45.0 365.6 432.9 -1.8 58.3 1.9 33.9 -0.3
2008-09 20.7 44.9 353.0 418.6 -3.3 57.8 -0.9 33.8 -0.3
2009-10 23.2 49.2 337.2 409.6 -2.1 59.5 2.9 34.4 1.8
2010-11 22.6 45.6 329.9 398.1 -1.5 62.3 4.7 35.5 3.2
2011-12 23.2 47.1 333.4 403.7 1.4 65.6 5.3 37.2 4.8
2012-13 23.8 47.9 330.7 402.3 -0.3 66.8 1.8 37.4 0.5
2013-14 24.9 47.7 334.7 407.2 1.2 71.1 6.4 38.6 3.2
2014-15 26.4 49.1 338.2 413.7 1.6 75.7 6.5 40.8 5.7
2015-16 29.3 47.8 345.9 422.9 2.3 77.4 2.2 41.7 2.2
2016-17 29.2 46.5 347.5 423.0 0.0 80.1 3.5 44.4 6.5
2017-18 OLD 29.8 45.1 349.1 424.0 0.2 81.7 2.0 45.3 2.1
2017-18 EDR 29.8 45.1 349.1 424.0 0.2 81.7 2.0 45.3 2.1
2017-18 EOG 29.8 45.1 349.1 424.0 0.2 81.7 2.0 45.3 2.1
2017-18 DPT #N/A #N/A #N/A #N/A #N/A #N/A #N/A #N/A #N/A
2017-18 NEW 29.8 45.1 349.1 424.0 0.2 81.7 2.0 45.3 2.1
2018-19 OLD 30.2 45.5 350.8 426.6 0.6 83.7 2.4 47.0 3.8
2018-19 EDR 30.2 45.5 350.8 426.6 0.6 83.7 2.4 47.0 3.8
2018-19 EOG 30.2 45.5 350.8 426.6 0.6 83.7 2.4 47.0 3.8
2018-19 DPT #N/A #N/A #N/A #N/A #N/A #N/A #N/A #N/A #N/A
2018-19 NEW 30.2 45.5 350.8 426.6 0.6 83.7 2.4 47.0 3.8
2019-20 OLD 30.6 46.0 352.6 429.2 0.6 85.3 2.0 48.3 2.6
2019-20 EDR 30.6 46.0 352.6 429.2 0.6 85.3 2.0 48.3 2.6
2019-20 EOG 30.6 46.0 352.6 429.2 0.6 85.3 2.0 48.3 2.6
2019-20 DPT #N/A #N/A #N/A #N/A #N/A #N/A #N/A #N/A #N/A
2019-20 NEW 30.6 46.0 352.6 429.2 0.6 85.3 2.0 48.3 2.6
2020-21 OLD 31.0 46.4 354.3 431.8 0.6 87.0 1.9 49.4 2.3
2020-21 EDR 31.0 46.4 354.3 431.8 0.6 87.0 1.9 49.4 2.3
2020-21 EOG 31.0 46.4 354.3 431.8 0.6 87.0 1.9 49.4 2.3
2020-21 DPT #N/A #N/A #N/A #N/A #N/A #N/A #N/A #N/A #N/A
2020-21 NEW 31.0 46.4 354.3 431.8 0.6 87.0 1.9 49.4 2.3
2021-22 OLD 31.4 46.9 356.1 434.4 0.6 88.7 2.0 50.5 2.2
2021-22 EDR 31.4 46.9 356.1 434.4 0.6 88.7 2.0 50.5 2.2
2021-22 EOG 31.4 46.9 356.1 434.4 0.6 88.7 2.0 50.5 2.2
2021-22 DPT #N/A #N/A #N/A #N/A #N/A #N/A #N/A #N/A #N/A
2021-22 NEW 31.4 46.9 356.1 434.4 0.6 88.7 2.0 50.5 2.2
2022-23 OLD 31.8 47.4 357.9 437.1 0.6 90.4 1.9 51.4 1.8
2022-23 EDR 31.8 47.4 357.9 437.1 0.6 90.4 1.9 51.4 1.8
2022-23 EOG 31.8 47.4 357.9 437.1 0.6 90.4 1.9 51.4 1.8
2022-23 DPT #N/A #N/A #N/A #N/A #N/A #N/A #N/A #N/A #N/A
2022-23 NEW 31.8 47.4 357.9 437.1 0.6 90.4 1.9 51.4 1.8
Page 32
SPIRITSWINEBEER (Millions)

Includes taxes on handle, attendance, license fees, cardrooms, intertrack wagering, and slot machine licenses.
Total General
Collections % chg Revenue % chg________ _____ ________ _____
1997-98 69.1 -6.3 25.6 -19.5
1998-99 59.7 -13.6 14.0 -45.3
1999-00 57.5 -3.7 13.0 -7.1
2000-01 34.7 -39.7 16.6 27.7
2001-02 35.1 1.2 18.6 12.0
2002-03 32.4 -7.7 17.1 -7.9
2003-04 32.0 -1.2 23.7 38.5
2004-05 33.6 5.0 18.4 -22.5
2005-06 31.4 -6.5 16.0 -13.0
2006-07 33.9 8.0 32.0 100.0
2007-08 33.8 -0.3 26.9 -15.9
2008-09 29.2 -13.6 20.0 -25.7
2009-10 26.6 -8.9 27.7 38.5
2010-11 26.0 -2.3 30.8 11.2
2011-12 26.9 3.5 24.5 -20.5
2012-13 25.1 -6.7 23.4 -4.5
2013-14 27.1 8.0 25.3 8.1
2014-15 26.1 -3.7 26.8 5.9
2015-16 25.9 -0.8 23.8 -11.2
2016-17 25.6 -1.2 22.8 -4.2
2017-18 OLD 25.6 0.0 22.4 -1.8
2017-18 EDR 25.6 0.0 22.4 -1.8
2017-18 EOG 25.6 0.0 22.4 -1.8
2017-18 DPT #N/A #N/A #N/A #N/A
2017-18 NEW 25.6 0.0 22.4 -1.8
2018-19 OLD 25.0 -2.3 21.4 -4.5
2018-19 EDR 25.0 -2.3 21.4 -4.5
2018-19 EOG 25.0 -2.3 21.4 -4.5
2018-19 DPT #N/A #N/A #N/A #N/A
2018-19 NEW 25.0 -2.3 21.4 -4.5
2019-20 OLD 24.9 -0.4 21.3 -0.5
2019-20 EDR 24.9 -0.4 21.3 -0.5
2019-20 EOG 24.9 -0.4 21.3 -0.5
2019-20 DPT #N/A #N/A #N/A #N/A
2019-20 NEW 24.9 -0.4 21.3 -0.5
2020-21 OLD 25.0 0.4 21.4 0.5
2020-21 EDR 25.0 0.4 21.4 0.5
2020-21 EOG 25.0 0.4 21.4 0.5
2020-21 DPT #N/A #N/A #N/A #N/A
2020-21 NEW 25.0 0.4 21.4 0.5
2021-22 OLD 25.0 0.0 21.4 0.0
2021-22 EDR 25.0 0.0 21.4 0.0
2021-22 EOG 25.0 0.0 21.4 0.0
2021-22 DPT #N/A #N/A #N/A #N/A
2021-22 NEW 25.0 0.0 21.4 0.0
2022-23 OLD 25.2 0.8 21.5 0.5
2022-23 EDR 25.2 0.8 21.5 0.5
2022-23 EOG 25.2 0.8 21.5 0.5
2022-23 DPT #N/A #N/A #N/A #N/A
2022-23 NEW 25.2 0.8 21.5 0.5
Page 33
TABLE 21
PARI-MUTUEL TAXES ($ Millions)

Chapter 624, Florida Statutes
Emergency
Cash Collections Available to Management Distribution Distribution Distribution
Adjustments After Credits % chg Distribute Surcharge to DMS to DFS TF to GR________ ________ ________ ________ ________ ________ ________
1997-98 3.0 385.0 2.6 388.0 13.0 80.4 18.4 276.3
1998-99 -6.9 359.3 -6.7 352.4 12.5 83.8 18.0 238.1
1999-00 10.3 370.7 3.2 381.0 13.1 85.7 19.2 263.0
2000-01 -8.9 383.4 3.4 374.5 11.2 87.4 18.6 257.3
2001-02 3.0 426.1 11.1 429.1 13.3 98.8 21.2 295.8
2002-03 -2.6 515.4 21.0 512.8 14.2 113.7 24.9 360.0
2003-04 -20.8 577.8 12.1 557.0 13.3 127.5 24.1 392.0
2004-05 -10.3 621.6 7.6 611.3 15.2 133.6 27.5 435.0
2005-06 -14.5 678.3 9.1 663.8 14.0 146.1 29.3 474.4
2006-07 -26.0 774.0 14.1 748.0 13.9 168.1 40.1 525.9
2007-08 22.2 718.3 -7.2 740.5 14.5 175.1 43.9 507.0
2008-09 5.8 654.1 -8.9 659.9 14.1 156.3 35.4 454.0
2009-10 -0.7 667.4 2.0 666.7 14.1 156.4 36.3 460.0
2010-11 -7.1 696.6 4.4 689.5 14.3 154.9 37.9 482.5
2011-12 4.0 703.3 1.0 707.3 14.0 162.6 38.8 492.3
2012-13 -6.6 701.8 -0.2 695.2 13.6 165.9 38.3 477.0
2013-14 -15.0 711.9 1.4 696.9 13.6 173.1 39.7 470.5
2014-15 -2.1 688.9 -3.2 686.8 13.9 169.7 36.7 466.5
2015-16 -4.5 703.9 2.2 699.4 14.5 175.9 37.5 471.5
2016-17 1.7 719.1 2.2 720.8 15.0 172.3 36.5 497.0
2017-18 OLD -0.1 782.3 8.8 782.2 14.8 180.8 37.7 548.9
2017-18 EDR -0.1 782.3 8.8 782.2 14.8 180.8 37.7 548.9
2017-18 EOG -0.1 782.3 8.8 782.2 14.8 180.8 37.7 548.9
2017-18 DOR -0.1 782.3 8.8 782.2 14.8 180.8 37.7 548.9
2017-18 NEW -0.1 782.3 8.8 782.2 14.8 180.8 37.7 548.9
2018-19 OLD 2.0 785.5 0.4 787.5 15.0 189.1 39.1 544.2
2018-19 EDR 2.0 785.5 0.4 787.5 15.0 189.1 39.1 544.2
2018-19 EOG 2.0 785.5 0.4 787.5 15.0 189.1 39.1 544.2
2018-19 DOR 2.0 785.5 0.4 787.5 15.0 189.1 39.1 544.2
2018-19 NEW 2.0 785.5 0.4 787.5 15.0 189.1 39.1 544.2
2019-20 OLD 1.3 830.8 5.8 832.1 15.2 197.0 40.4 579.6
2019-20 EDR 1.3 830.8 5.8 832.1 15.2 197.0 40.4 579.6
2019-20 EOG 1.3 830.8 5.8 832.1 15.2 197.0 40.4 579.6
2019-20 DOR 1.3 830.8 5.8 832.1 15.2 197.0 40.4 579.6
2019-20 NEW 1.3 830.8 5.8 832.1 15.2 197.0 40.4 579.6
2020-21 OLD -0.8 855.7 3.0 854.9 15.2 204.9 41.7 593.1
2020-21 EDR -0.8 855.7 3.0 854.9 15.2 204.9 41.7 593.1
2020-21 EOG -0.8 855.7 3.0 854.9 15.2 204.9 41.7 593.1
2020-21 DOR -0.8 855.7 3.0 854.9 15.2 204.9 41.7 593.1
2020-21 NEW -0.8 855.7 3.0 854.9 15.2 204.9 41.7 593.1
2021-22 OLD -2.8 891.9 4.2 889.1 15.2 212.8 43.0 618.2
2021-22 EDR -2.8 891.9 4.2 889.1 15.2 212.8 43.0 618.2
2021-22 EOG -2.8 891.9 4.2 889.1 15.2 212.8 43.0 618.2
2021-22 DOR -2.8 891.9 4.2 889.1 15.2 212.8 43.0 618.2
2021-22 NEW -2.8 891.9 4.2 889.1 15.2 212.8 43.0 618.2
2022-23 OLD 5.5 921.1 3.3 926.6 15.2 221.0 44.3 646.2
2022-23 EDR 5.5 921.1 3.3 926.6 15.2 221.0 44.3 646.2
2022-23 EOG 5.5 921.1 3.3 926.6 15.2 221.0 44.3 646.2
2022-23 DOR 5.5 921.1 3.3 926.6 15.2 221.0 44.3 646.2
2022-23 NEW 5.5 921.1 3.3 926.6 15.2 221.0 44.3 646.2
Page 34
TABLE 22
INSURANCE PREMIUM TAX ($ Millions)

Chapter 624, Florida Statutes
Total Surplus Lines Total
Distribution Surplus Lines Distribution Distribution
to GR Collections % chg to GR to GR % chg Refunds________ ________ ________ ________ ________
1997-98 276.3 42.7 3.4 19.2 295.5 4.2 30.6
1998-99 238.1 44.0 3.0 19.8 257.9 -12.7 45.4
1999-00 263.0 49.3 12.0 22.2 285.2 10.6 31.0
2000-01 257.3 57.3 16.2 25.8 283.1 -0.7 34.5
2001-02 295.8 78.2 36.5 35.2 331.0 16.9 25.1
2002-03 360.0 113.6 45.3 51.1 411.1 24.2 23.5
2003-04 392.0 132.2 16.4 100.1 492.1 19.7 24.3
2004-05 435.0 146.2 10.6 110.7 545.7 10.9 23.5
2005-06 474.4 181.4 24.1 137.3 611.7 12.1 23.9
2006-07 525.9 226.6 24.9 171.5 697.4 14.0 39.0
2007-08 507.0 218.1 -3.8 165.1 672.1 -3.6 29.5
2008-09 454.0 190.7 -12.6 160.7 614.7 -8.5 47.2
2009-10 460.0 189.2 -0.8 189.2 649.2 5.6 42.0
2010-11 482.5 178.0 -5.9 178.0 660.5 1.7 39.5
2011-12 492.3 170.3 -4.3 170.3 662.6 0.3 38.0
2012-13 477.0 198.9 16.8 198.9 675.9 2.0 33.4
2013-14 470.5 205.1 3.1 205.1 675.6 0.0 46.0
2014-15 466.5 219.7 7.1 200.4 666.9 -1.3 37.2
2015-16 471.5 231.7 5.4 211.3 682.8 2.4 53.1
2016-17 497.0 231.8 0.0 211.4 708.4 3.7 22.5
2017-18 OLD 548.9 242.0 4.4 220.7 769.6 8.6 32.0
2017-18 EDR 548.9 242.0 4.4 220.7 769.6 8.6 32.0
2017-18 EOG 548.9 242.0 4.4 220.7 769.6 8.6 32.0
2017-18 DOR 548.9 242.0 4.4 220.7 769.6 8.6 32.0
2017-18 NEW 548.9 242.0 4.4 220.7 769.6 8.6 32.0
2018-19 OLD 544.2 248.1 2.5 226.3 770.5 0.1 28.0
2018-19 EDR 544.2 248.1 2.5 226.3 770.5 0.1 28.0
2018-19 EOG 544.2 248.1 2.5 226.3 770.5 0.1 28.0
2018-19 DOR 544.2 248.1 2.5 226.3 770.5 0.1 28.0
2018-19 NEW 544.2 248.1 2.5 226.3 770.5 0.1 28.0
2019-20 OLD 579.6 254.4 2.5 232.0 811.6 5.3 25.0
2019-20 EDR 579.6 254.4 2.5 232.0 811.6 5.3 25.0
2019-20 EOG 579.6 254.4 2.5 232.0 811.6 5.3 25.0
2019-20 DOR 579.6 254.4 2.5 232.0 811.6 5.3 25.0
2019-20 NEW 579.6 254.4 2.5 232.0 811.6 5.3 25.0
2020-21 OLD 593.1 260.5 2.4 237.6 830.7 2.4 25.0
2020-21 EDR 593.1 260.5 2.4 237.6 830.7 2.4 25.0
2020-21 EOG 593.1 260.5 2.4 237.6 830.7 2.4 25.0
2020-21 DOR 593.1 260.5 2.4 237.6 830.7 2.4 25.0
2020-21 NEW 593.1 260.5 2.4 237.6 830.7 2.4 25.0
2021-22 OLD 618.2 267.1 2.5 243.6 861.8 3.7 25.0
2021-22 EDR 618.2 267.1 2.5 243.6 861.8 3.7 25.0
2021-22 EOG 618.2 267.1 2.5 243.6 861.8 3.7 25.0
2021-22 DOR 618.2 267.1 2.5 243.6 861.8 3.7 25.0
2021-22 NEW 618.2 267.1 2.5 243.6 861.8 3.7 25.0
2022-23 OLD 646.2 273.8 2.5 249.7 895.9 4.0 25.0
2022-23 EDR 646.2 273.8 2.5 249.7 895.9 4.0 25.0
2022-23 EOG 646.2 273.8 2.5 249.7 895.9 4.0 25.0
2022-23 DOR 646.2 273.8 2.5 249.7 895.9 4.0 25.0
2022-23 NEW 646.2 273.8 2.5 249.7 895.9 4.0 25.0
Page 35
TABLE 22, continued
INSURANCE PREMIUM TAX ($ Millions)

TABLE 23
EARNINGS ON INVESTMENTS
Receipts % chg________ _____
1997-98 217.9 37.2
1998-99 216.5 -1.4
1999-00 230.8 7.4
2000-01 300.6 30.2
2001-02 227.0 -24.5
2002-03 272.0 19.8
2003-04 194.3 -28.6
2004-05 261.9 34.8
2005-06 320.8 22.5
2006-07 473.1 47.5
2007-08 446.3 -5.7
2008-09 126.8 -71.6
2009-10 118.1 -6.9
2010-11 135.6 14.8
2011-12 117.3 -13.5
2012-13 107.3 -8.5
2013-14 75.6 -29.5
2014-15 106.5 40.9
2015-16 115.8 8.7
2016-17 131.0 13.1
2017-18 OLD 169.5 29.4
2017-18 EDR 169.5 29.4
2017-18 EOG 169.5 29.4
2017-18 DOR #N/A #N/A
2017-18 NEW 169.5 29.4
2018-19 OLD 255.0 50.4
2018-19 EDR 255.0 50.4
2018-19 EOG 255.0 50.4
2018-19 DOR #N/A #N/A
2018-19 NEW 255.0 50.4
2019-20 OLD 311.9 22.3
2019-20 EDR 311.9 22.3
2019-20 EOG 311.9 22.3
2019-20 DOR #N/A #N/A
2019-20 NEW 311.9 22.3
2020-21 OLD 330.1 5.8
2020-21 EDR 330.1 5.8
2020-21 EOG 330.1 5.8
2020-21 DOR #N/A #N/A
2020-21 NEW 330.1 5.8
2021-22 OLD 339.6 2.9
2021-22 EDR 339.6 2.9
2021-22 EOG 339.6 2.9
2021-22 DOR #N/A #N/A
2021-22 NEW 339.6 2.9
2022-23 OLD 346.1 1.9
2022-23 EDR 346.1 1.9
2022-23 EOG 346.1 1.9
2022-23 DOR #N/A #N/A
2022-23 NEW 346.1 1.9
Page 36

TABLE 24
COUNTIES' MEDICAID SHARE
Receipts % chg________ _____
1997-98 99.8 -23.0
1998-99 104.5 4.7
1999-00 118.9 13.8
2000-01 127.4 7.2
2001-02 134.5 5.6
2002-03 140.9 4.7
2003-04 165.9 17.8
2004-05 181.2 9.2
2005-06 181.0 -0.1
2006-07 172.6 -4.7
2007-08 165.9 -3.9
2008-09 138.1 -16.8
2009-10 210.2 52.2
2010-11 208.6 -0.8
2011-12 235.3 12.8
2012-13 332.1 41.1
2013-14 296.1 -10.8
2014-15 289.6 -2.2
2015-16 301.6 4.1
2016-17 301.5 0.0
2017-18 OLD 292.0 -3.2
2017-18 EDR 292.0 -3.2
2017-18 EOG 292.0 -3.2
2017-18 DOR #N/A #N/A
2017-18 NEW 292.0 -3.2
2018-19 OLD 298.5 2.2
2018-19 EDR 298.5 2.2
2018-19 EOG 298.5 2.2
2018-19 DOR #N/A #N/A
2018-19 NEW 298.5 2.2
2019-20 OLD 312.4 4.7
2019-20 EDR 312.4 4.7
2019-20 EOG 312.4 4.7
2019-20 DOR #N/A #N/A
2019-20 NEW 312.4 4.7
2020-21 OLD 303.6 -2.8
2020-21 EDR 303.6 -2.8
2020-21 EOG 303.6 -2.8
2020-21 DOR #N/A #N/A
2020-21 NEW 303.6 -2.8
2021-22 OLD 322.2 6.1
2021-22 EDR 322.2 6.1
2021-22 EOG 322.2 6.1
2021-22 DOR #N/A #N/A
2021-22 NEW 322.2 6.1
2022-23 OLD 333.6 3.5
2022-23 EDR 333.6 3.5
2022-23 EOG 333.6 3.5
2022-23 DOR #N/A #N/A
2022-23 NEW 333.6 3.5
Page 37

Variable rates as a percent of value at point of severance for phosphate and gas extraction (see Chapter 211, Florida Statutes),
Solid General State Park
Oil & Gas Minerals Revenue TF* Counties NMLR TF FIPR TF MTF________ ________ ________ ________ ________ ________ ________ ________
1997-98 7.2 62.3 35.4 10.0 6.1 6.9 4.8 5.3
1998-99 4.0 63.1 33.2 10.0 5.7 7.3 5.0 5.1
1999-00 6.3 50.6 28.9 10.0 5.2 6.0 4.1 3.6
2000-01 8.3 39.0 20.6 10.0 5.3 0.0 3.2 5.7
2001-02 5.2 34.9 17.7 10.0 5.4 0.0 2.4 4.8
2002-03 5.3 41.4 20.8 10.0 6.1 0.0 3.4 5.5
2003-04 6.3 36.5 4.8 10.0 8.1 11.6 3.2 4.7
2004-05 8.3 50.6 20.7 10.0 12.6 3.4 2.8 5.4
2005-06 9.6 46.0 22.5 10.0 12.9 3.2 3.0 5.5
2006-07 9.3 36.5 17.4 10.0 9.4 2.2 2.0 4.2
2007-08 13.3 43.2 21.4 10.0 10.1 2.7 2.4 5.0
2008-09 7.9 73.5 18.0 10.0 9.4 24.3 2.7 4.5
2009-10 3.9 58.6 13.0 10.0 7.4 28.9 2.1 3.4
2010-11 10.1 48.9 18.6 7.2 8.7 21.5 1.7 4.1
2011-12 13.5 34.5 21.3 8.6 11.3 1.9 1.9 3.1
2012-13 11.2 35.9 21.2 9.3 10.3 2.0 2.0 3.5
2013-14 10.9 36.6 19.9 9.1 9.9 2.0 2.0 3.2
2014-15 5.5 31.4 14.7 7.3 8.0 2.3 1.6 2.6
2015-16 1.6 33.8 11.8 7.4 7.1 4.9 1.7 2.0
2016-17 1.8 32.0 11.5 7.2 6.8 4.8 1.7 1.8
2017-18 OLD 1.6 32.3 11.1 7.2 6.8 5.1 1.8 2.0
2017-18 EDR 1.6 32.3 11.1 7.2 6.8 5.1 1.8 2.0
2017-18 EOG 1.6 32.3 11.1 7.2 6.8 5.1 1.8 2.0
2017-18 DOR 1.6 32.3 11.1 7.2 6.8 5.1 1.8 2.0
2017-18 NEW 1.6 32.3 11.1 7.2 6.8 5.1 1.8 2.0
2018-19 OLD 1.1 32.2 10.6 7.1 6.8 5.0 1.7 2.0
2018-19 EDR 1.1 32.2 10.6 7.1 6.8 5.0 1.7 2.0
2018-19 EOG 1.1 32.2 10.6 7.1 6.8 5.0 1.7 2.0
2018-19 DOR 1.1 32.2 10.6 7.1 6.8 5.0 1.7 2.0
2018-19 NEW 1.1 32.2 10.6 7.1 6.8 5.0 1.7 2.0
2019-20 OLD 1.2 32.0 10.5 7.1 6.8 5.0 1.7 2.0
2019-20 EDR 1.2 32.0 10.5 7.1 6.8 5.0 1.7 2.0
2019-20 EOG 1.2 32.0 10.5 7.1 6.8 5.0 1.7 2.0
2019-20 DOR 1.2 32.0 10.5 7.1 6.8 5.0 1.7 2.0
2019-20 NEW 1.2 32.0 10.5 7.1 6.8 5.0 1.7 2.0
2020-21 OLD 2.0 31.8 10.9 7.0 7.0 5.0 1.7 2.1
2020-21 EDR 2.0 31.8 10.9 7.0 7.0 5.0 1.7 2.1
2020-21 EOG 2.0 31.8 10.9 7.0 7.0 5.0 1.7 2.1
2020-21 DOR 2.0 31.8 10.9 7.0 7.0 5.0 1.7 2.1
2020-21 NEW 2.0 31.8 10.9 7.0 7.0 5.0 1.7 2.1
2021-22 OLD 2.7 31.6 11.3 7.0 7.0 5.0 1.7 2.2
2021-22 EDR 2.7 31.6 11.3 7.0 7.0 5.0 1.7 2.2
2021-22 EOG 2.7 31.6 11.3 7.0 7.0 5.0 1.7 2.2
2021-22 DOR 2.7 31.6 11.3 7.0 7.0 5.0 1.7 2.2
2021-22 NEW 2.7 31.6 11.3 7.0 7.0 5.0 1.7 2.2
2022-23 OLD 3.5 29.0 11.5 6.8 7.0 3.1 1.7 2.3
2022-23 EDR 3.5 29.0 11.5 6.8 7.0 3.1 1.7 2.3
2022-23 EOG 3.5 29.0 11.5 6.8 7.0 3.1 1.7 2.3
2022-23 DOR 3.5 29.0 11.5 6.8 7.0 3.1 1.7 2.3
2022-23 NEW 3.5 29.0 11.5 6.8 7.0 3.1 1.7 2.3
*Beginning in FY 2016-17, funds previously distributed to the CARL TF will be distributed to the State Park Trust Fund.
Page 38
DISTRIBUTIONSRECEIPTS
TABLE 25
SEVERANCE TAX ($ Millions)

TABLE 26
SERVICE CHARGES ($ Millions)
Pari-mutuel CIG TF & Documentary
DFS TF TF ABT TF Motor Fuel TF All Others Stamp Tax TOTAL________ ________ ________ ________ ________ ________ ________
1997-98
1998-99
1999-00
2000-01
2001-02
2002-03
2003-04 433.1
2004-05 494.0
2005-06 532.1
2006-07 440.5
2007-08 37.2 2.2 32.5 18.4 135.6 136.7 362.6
2008-09 30.3 2.6 32.7 28.9 131.4 78.8 304.7
2009-10 29.6 3.1 109.2 33.3 173.7 86.3 435.2
2010-11 25.1 3.1 108.8 33.7 199.3 92.5 462.5
2011-12 22.0 2.9 100.5 31.0 191.6 101.0 449.0
2012-13 26.5 2.9 99.9 33.1 192.5 131.4 486.2
2013-14 26.5 3.1 96.0 34.1 162.3 144.8 466.8
2014-15 28.1 2.8 97.6 36.3 165.8 169.5 500.1
2015-16 28.3 3.1 99.1 38.5 164.2 122.1 455.2
2016-17 28.7 3.0 97.9 40.7 165.0 129.6 464.9
2017-18 OLD 30.9 3.2 96.8 41.2 166.4 134.8 473.3
2017-18 EDR 30.9 3.2 96.8 41.2 166.4 134.8 473.3
2017-18 EOG 30.9 3.2 96.8 41.2 166.4 134.8 473.3
2017-18 DOR #N/A #N/A #N/A #N/A #N/A 134.8 #N/A
2017-18 NEW 30.9 3.2 96.8 41.2 166.4 134.8 473.3
2018-19 OLD 29.3 3.2 95.3 41.9 169.3 140.8 479.8
2018-19 EDR 29.3 3.2 95.3 41.9 169.3 140.8 479.8
2018-19 EOG 29.3 3.2 95.3 41.9 169.3 140.8 479.8
2018-19 DOR #N/A #N/A #N/A #N/A #N/A 140.8 #N/A
2018-19 NEW 29.1 3.2 95.3 41.9 169.2 140.6 479.3
2019-20 OLD 29.5 3.2 94.1 42.0 168.4 146.6 483.8
2019-20 EDR 29.5 3.2 94.1 42.0 168.4 146.6 483.8
2019-20 EOG 29.5 3.2 94.1 42.0 168.4 146.6 483.8
2019-20 DOR #N/A #N/A #N/A #N/A #N/A 146.6 #N/A
2019-20 NEW 29.3 3.2 94.1 41.1 168.2 146.4 482.3
2020-21 OLD 29.7 3.2 92.9 42.5 172.6 151.9 492.8
2020-21 EDR 29.7 3.2 92.9 42.5 172.6 151.9 492.8
2020-21 EOG 29.7 3.2 92.9 42.5 172.6 151.9 492.8
2020-21 DOR #N/A #N/A #N/A #N/A #N/A 151.9 #N/A
2020-21 NEW 29.5 3.2 92.9 41.2 172.6 151.7 491.1
2021-22 OLD 29.9 3.2 91.8 43.1 171.6 157.3 496.9
2021-22 EDR 29.9 3.2 91.8 43.1 171.6 157.3 496.9
2021-22 EOG 29.9 3.2 91.8 43.1 171.6 157.3 496.9
2021-22 DOR #N/A #N/A #N/A #N/A #N/A 157.3 #N/A
2021-22 NEW 29.7 3.2 91.8 41.8 171.6 157.1 495.2
2022-23 OLD 30.1 3.2 90.5 43.6 175.6 162.8 505.8
2022-23 EDR 30.1 3.2 90.5 43.6 175.6 162.8 505.8
2022-23 EOG 30.1 3.2 90.5 43.6 175.6 162.8 505.8
2022-23 DOR #N/A #N/A #N/A #N/A #N/A 162.8 #N/A
2022-23 NEW 29.9 3.2 90.5 42.3 175.6 162.6 504.1
Page 39

TABLE 27
CORPORATE FILING FEES
General
Revenue % chg________ ________
1997-98 101.8 2.8
1998-99 95.4 -6.3
1999-00 99.9 4.7
2000-01 107.5 7.6
2001-02 113.7 5.8
2002-03 120.8 6.2
2003-04 184.8 53.0
2004-05 199.2 7.8
2005-06 214.3 7.6
2006-07 218.8 2.1
2007-08 242.9 11.0
2008-09 239.9 -1.2
2009-10 238.1 -0.7
2010-11 273.6 14.9
2011-12 275.8 0.8
2012-13 284.1 3.0
2013-14 298.6 5.1
2014-15 309.8 3.8
2015-16 317.4 2.5
2016-17 352.9 11.2
2017-18 OLD 356.0 0.9
2017-18 EDR 356.0 0.9
2017-18 EOG 356.0 0.9
2017-18 DOR #N/A #N/A
2017-18 NEW 356.0 0.9
2018-19 OLD 356.6 0.2
2018-19 EDR 356.6 0.2
2018-19 EOG 356.6 0.2
2018-19 DOR #N/A #N/A
2018-19 NEW 356.6 0.2
2019-20 OLD 362.3 1.6
2019-20 EDR 362.3 1.6
2019-20 EOG 362.3 1.6
2019-20 DOR #N/A #N/A
2019-20 NEW 362.3 1.6
2020-21 OLD 367.9 1.5
2020-21 EDR 367.9 1.5
2020-21 EOG 367.9 1.5
2020-21 DOR #N/A #N/A
2020-21 NEW 367.9 1.5
2021-22 OLD 372.6 1.3
2021-22 EDR 372.6 1.3
2021-22 EOG 372.6 1.3
2021-22 DOR #N/A #N/A
2021-22 NEW 372.6 1.3
2022-23 OLD 377.2 1.2
2022-23 EDR 377.2 1.2
2022-23 EOG 377.2 1.2
2022-23 DOR #N/A #N/A
2022-23 NEW 377.2 1.2
Page 40

Includes various taxes, licenses, and fees not forecasted separately.
Receipts % chg________ _____
1997-98
1998-99
1999-00
2000-01
2001-02
2002-03
2003-04
2004-05 64.9
2005-06 61.9 -4.6
2006-07 52.9 -14.5
2007-08 69.1 30.6
2008-09 50.1 -27.5
2009-10 47.1 -6.0
2010-11 36.6 -22.3
2011-12 33.6 -8.2
2012-13 34.2 1.8
2013-14 36.2 5.8
2014-15 36.7 1.4
2015-16 33.5 -8.7
2016-17 39.1 16.7
2017-18 OLD 39.0 -0.3
2017-18 EDR 39.0 -0.3
2017-18 EOG 39.0 -0.3
2017-18 DOR #N/A #N/A
2017-18 NEW 39.0 -0.3
2018-19 OLD 38.9 -0.3
2018-19 EDR 38.9 -0.3
2018-19 EOG 38.9 -0.3
2018-19 DOR #N/A #N/A
2018-19 NEW 38.9 -0.3
2019-20 OLD 38.7 -0.5
2019-20 EDR 38.7 -0.5
2019-20 EOG 38.7 -0.5
2019-20 DOR #N/A #N/A
2019-20 NEW 38.7 -0.5
2020-21 OLD 38.7 0.0
2020-21 EDR 38.7 0.0
2020-21 EOG 38.7 0.0
2020-21 DOR #N/A #N/A
2020-21 NEW 38.7 0.0
2021-22 OLD 38.7 0.0
2021-22 EDR 38.7 0.0
2021-22 EOG 38.7 0.0
2021-22 DOR #N/A #N/A
2021-22 NEW 38.7 0.0
2022-23 OLD 38.7 0.0
2022-23 EDR 38.7 0.0
2022-23 EOG 38.7 0.0
2022-23 DOR #N/A #N/A
2022-23 NEW 38.7 0.0
Page 41
TABLE 28
OTHER TAXES, LICENSES, AND FEES

TABLE 29
OTHER NONOPERATING REVENUES
Includes receipts from various governmental activities such as-- fines, forfeitures, and
penalties; child support enforcement recoveries; loan repayments; transfers required by law;
reimbursements of state expenditures; et al.
Receipts % chg________ _____
1997-98
1998-99
1999-00
2000-01
2001-02
2002-03
2003-04
2004-05 186.3
2005-06 136.8 -26.6
2006-07 171.9 25.7
2007-08 143.9 -16.3
2008-09 171.3 19.0
2009-10 197.8 15.5
2010-11 171.6 -13.2
2011-12 219.5 27.9
2012-13 426.2 94.2
2013-14 170.0 -60.1
2014-15 144.8 -14.8
2016-17 181.1 25.1
2016-17 171.6 -5.2
2017-18 OLD 151.7 -11.6
2017-18 EDR 151.7 -11.6
2017-18 EOG 151.7 -11.6
2017-18 DOR #N/A #N/A
2017-18 NEW 151.7 -11.6
2018-19 OLD 151.7 0.0
2018-19 EDR 151.7 0.0
2018-19 EOG 151.7 0.0
2018-19 DOR #N/A #N/A
2018-19 NEW 151.7 0.0
2019-20 OLD 151.5 -0.1
2019-20 EDR 151.5 -0.1
2019-20 EOG 151.5 -0.1
2019-20 DOR #N/A #N/A
2019-20 NEW 151.5 -0.1
2020-21 OLD 151.4 -0.1
2020-21 EDR 151.4 -0.1
2020-21 EOG 151.4 -0.1
2020-21 DOR #N/A #N/A
2020-21 NEW 151.4 -0.1
2021-22 OLD 145.6 -3.8
2021-22 EDR 145.6 -3.8
2021-22 EOG 145.6 -3.8
2021-22 DOR #N/A #N/A
2021-22 NEW 145.6 -3.8
2022-23 OLD 139.5 -4.2
2022-23 EDR 139.5 -4.2
2022-23 EOG 139.5 -4.2
2022-23 DOR #N/A #N/A
2022-23 NEW 139.5 -4.2
Page 42

TABLE 30
REFUND OF OVERPAYMENT OF TAXES ($ Millions)
Insurance
Corporate Sales Tax Estate Other Premium Total________ ________ ________ ________ ________ ________
1997-98 124.4 30.3 17.5 1.8 30.6 204.6
1998-99 205.2 45.4 24.5 1.3 45.4 321.9
1999-00 217.2 72.9 39.2 1.9 31.0 362.2
2000-01 206.3 62.1 34.8 2.2 34.5 339.9
2001-02 255.2 82.8 24.0 4.5 25.1 391.6
2002-03 267.2 74.3 25.0 3.5 23.5 393.5
2003-04 210.1 100.9 31.7 4.3 24.3 371.3
2004-05 156.6 82.7 21.5 9.3 23.5 293.6
2005-06 174.2 84.7 25.7 8.8 23.9 317.3
2006-07 195.2 113.3 10.6 8.8 39.0 366.9
2007-08 295.8 130.3 10.2 29.5 465.8
2008-09 415.0 129.2 6.7 47.3 598.2
2009-10 329.9 160.7 5.2 42.0 537.8
2010-11 201.9 72.5 12.2 39.5 326.1
2011-12 193.4 72.1 2.7 38.0 306.2
2012-13 168.2 84.9 3.8 33.4 290.3
2013-14 261.6 62.9 9.0 46.0 379.5
2014-15 245.7 104.8 5.0 37.2 392.7
2015-16 301.2 84.7 2.6 53.1 441.7
2016-17 193.9 109.0 2.8 22.5 328.2
2017-18 OLD 223.0 97.8 3.0 32.0 355.8
2017-18 EDR 223.0 97.8 3.0 32.0 355.8
2017-18 EOG 223.0 97.8 3.0 32.0 355.8
2017-18 DOR 223.0 97.8 3.0 32.0 355.8
2017-18 NEW 223.0 97.8 3.0 32.0 355.8
2018-19 OLD 221.2 115.6 3.0 28.0 367.8
2018-19 EDR 221.2 126.2 3.0 28.0 378.4
2018-19 EOG 221.2 126.2 3.0 28.0 378.4
2018-19 DOR 221.2 126.2 3.0 28.0 378.4
2018-19 NEW 221.2 128.1 3.0 28.0 380.3
2019-20 OLD 219.2 115.3 3.0 25.0 362.5
2019-20 EDR 219.2 117.6 3.0 25.0 364.8
2019-20 EOG 219.2 117.6 3.0 25.0 364.8
2019-20 DOR 219.2 117.6 3.0 25.0 364.8
2019-20 NEW 219.2 117.6 3.0 25.0 364.8
2020-21 OLD 216.7 119.8 3.0 25.0 364.5
2020-21 EDR 216.7 119.8 3.0 25.0 364.5
2020-21 EOG 216.7 119.8 3.0 25.0 364.5
2020-21 DOR 216.7 119.8 3.0 25.0 364.5
2020-21 NEW 216.7 119.8 3.0 25.0 364.5
2021-22 OLD 219.5 122.3 3.0 25.0 369.8
2021-22 EDR 219.5 122.3 3.0 25.0 369.8
2021-22 EOG 219.5 122.3 3.0 25.0 369.8
2021-22 DOR 219.5 122.3 3.0 25.0 369.8
2021-22 NEW 219.5 122.3 3.0 25.0 369.8
2022-23 OLD 220.2 126.3 3.0 25.0 374.5
2022-23 EDR 220.2 126.3 3.0 25.0 374.5
2022-23 EOG 220.2 126.3 3.0 25.0 374.5
2022-23 DOR 220.2 126.3 3.0 25.0 374.5
2022-23 NEW 220.2 126.3 3.0 25.0 374.5
Page 43

Conference on Conference on
Tobacco Tax Conference on Highway Safety Conference on
and Surcharge Indian Gaming Fees & Licenses Article V Revenues_______________ _______________ _______________ _______________
1997-98 142.1
1998-99 132.6
1999-00 125.3
2000-01 273.5
2001-02 275.5
2002-03 272.8
2003-04 276.2
2004-05 287.4
2005-06 277.6 119.0
2006-07 279.2 134.8
2007-08 271.1 144.1
2008-09 278.9 124.7 260.2
2009-10 205.8 287.5 746.0 192.5
2010-11 213.4 139.7 965.5 167.3
2011-12 199.8 146.2 1028.2 165.4
2012-13 202.1 221.6 868.7 284.3
2013-14 178.2 230.3 877.3 173.7
2014-15 181.2 248.5 586.4 151.1
2015-16 187.5 207.7 399.5 138.8
2016-17 183.0 116.0 489.8 126.6
2017-18 OLD 175.5 276.9 533.0 108.4
2017-18 NEW 175.5 276.9 533.0 108.4
2018-19 OLD 175.3 382.4 541.1 110.0
2018-19 NEW 175.3 382.4 541.1 107.7
2019-20 OLD 174.4 316.3 546.0 105.1
2019-20 NEW 174.4 316.3 546.0 103.1
2020-21 OLD 172.4 324.2 543.8 104.6
2020-21 NEW 172.4 324.2 543.8 102.6
2021-22 OLD 174.3 329.8 531.6 103.7
2021-22 NEW 174.3 329.8 531.6 101.7
2022-23 OLD 172.5 335.3 505.5 103.4
2022-23 NEW 172.5 335.3 505.5 101.4
Page 44
TABLE 31
GENERAL REVENUE FROM OTHER REVENUE ESTIMATING CONFERENCES
Additional detail regarding these estimates can be found in the respective Revenue Estimating Conference results. Conference results can be
found on the Economic & Demographic website at "edr.state.fl.us" under the "Consensus Estimating Conferences" link. Please refer to the
respective conference results for non-General Revenue distributions.

TABLE 32
REVERSIONS OF APPROPRIATIONS ($ Millions)
OLD EDR Diff. EOG Diff. DOR Diff. NEW Diff.-------- ------- ----- ------- ----- ------- ----- ------- -----
2017-18
FCO REVERSIONS 2.0 2.0 0.0 2.0 0.0 #N/A #N/A 2.0 0.0
UNUSED APPROPRIATIONS/
REVERSIONS #N/A #N/A #N/A #N/A #N/A #N/A #N/A #N/A #N/A
2018-19
FCO REVERSIONS 2.0 2.0 0.0 2.0 0.0 #N/A #N/A 2.0 0.0
UNUSED APPROPRIATIONS/
REVERSIONS 96.3 97.9 1.6 97.9 1.6 #N/A #N/A 97.9 1.6
2019-20
FCO REVERSIONS 2.0 2.0 0.0 2.0 0.0 #N/A #N/A 2.0 0.0
UNUSED APPROPRIATIONS/
REVERSIONS 96.3 97.9 1.6 97.9 1.6 #N/A #N/A 97.9 1.6
2020-21
FCO REVERSIONS 2.0 2.0 0.0 2.0 0.0 #N/A #N/A 2.0 0.0
UNUSED APPROPRIATIONS/
REVERSIONS 96.3 97.9 1.6 97.9 1.6 #N/A #N/A 97.9 1.6
2021-22
FCO REVERSIONS 2.0 2.0 0.0 2.0 0.0 #N/A #N/A 2.0 0.0
UNUSED APPROPRIATIONS/
REVERSIONS 96.3 97.9 1.6 97.9 1.6 #N/A #N/A 97.9 1.6
2022-23
FCO REVERSIONS 2.0 2.0 0.0 2.0 0.0 #N/A #N/A 2.0 0.0
UNUSED APPROPRIATIONS/
REVERSIONS 96.3 97.9 1.6 97.9 1.6 #N/A #N/A 97.9 1.6
Page 45