general regionalization heuristic to map spatial ... · general regionalization heuristic to map...
TRANSCRIPT

General Regionalization Heuristic to Map Spatial Heterogeneity of Macroeconomic Impacts: The Case of the Green Energy Transition and the Manufacturing Sector in NRW
Daniel Höwer, Christian A. Oberst and Reinhard Madlener
The case of the green energy transition and the manufacturing
sector in NRW
15th IAEE European Conference 2017Vienna, Austria, September 3-6, 2017

General Regionalization Heuristic to Map Spatial Heterogeneity of Macroeconomic Impacts |
D. Höwer, C.A. Oberst, R. Madlener | Future Energy Needs and Behavior | Sep 6, 2017
2
Presentation Outline
1. Introduction
2. Method: regionalization heuristic
3. Application: sustainable energy transition and the manufacturing sector in NRW
4. Selected Results
5. Conclusion and Outlook

General Regionalization Heuristic to Map Spatial Heterogeneity of Macroeconomic Impacts |
D. Höwer, C.A. Oberst, R. Madlener | Future Energy Needs and Behavior | Sep 6, 2017
3
Introduction Industrial Transformation in NRW in Light of the Energiewende
2-year research project (2015-2017)
6 partners (Virtual Institute „Transformation – Energiewende NRW“)
Economic Effects of the Energiewende in NRW
- I-O Analysis of expanding renewables
- Regional distribution
- Real options analysis on flexibilization of
fossil-fueled power plants
Success Factors for Transformation Processes
Design of Transformation Processes
www.vi-transformation.de
General Regionalization Heuristic to Map Spatial Heterogeneity of Macroeconomic Impacts |
D. Höwer, C.A. Oberst, R. Madlener | Future Energy Needs and Behavior | Sep 6, 2017
4
IntroductionResearch Motivation
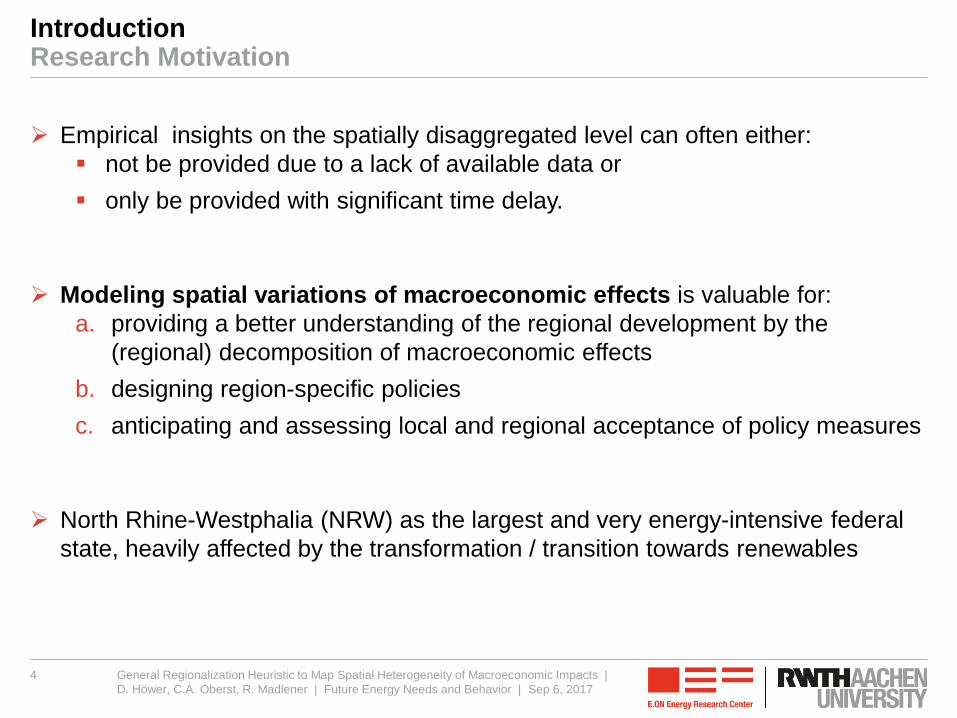
Empirical insights on the spatially disaggregated level can often either:
not be provided due to a lack of available data or
only be provided with significant time delay.
Modeling spatial variations of macroeconomic effects is valuable for:
a. providing a better understanding of the regional development by the
(regional) decomposition of macroeconomic effects
b. designing region-specific policies
c. anticipating and assessing local and regional acceptance of policy measures
North Rhine-Westphalia (NRW) as the largest and very energy-intensive federal
state, heavily affected by the transformation / transition towards renewables

General Regionalization Heuristic to Map Spatial Heterogeneity of Macroeconomic Impacts |
D. Höwer, C.A. Oberst, R. Madlener | Future Energy Needs and Behavior | Sep 6, 2017
5
IntroductionAim
Development of a relatively simple regionalization heuristic with a consistent
mathematical framework to:
Regionalization of macroeconomic impacts
Investigation of macroeconomic effects with high spatial heterogeneity and
relatively small overall net impact on the macroeconomic development
Efficient mapping of spatial variation / heterogeneity of macroeconomic effects
/ impacts and developments
Fig. 1. Exemplary spatial distribution of some quantity 𝜿
General Regionalization Heuristic to Map Spatial Heterogeneity of Macroeconomic Impacts |
D. Höwer, C.A. Oberst, R. Madlener | Future Energy Needs and Behavior | Sep 6, 2017
6
IntroductionInput 1: IO Analysis – Többen & Kuckshinrichs (2016)
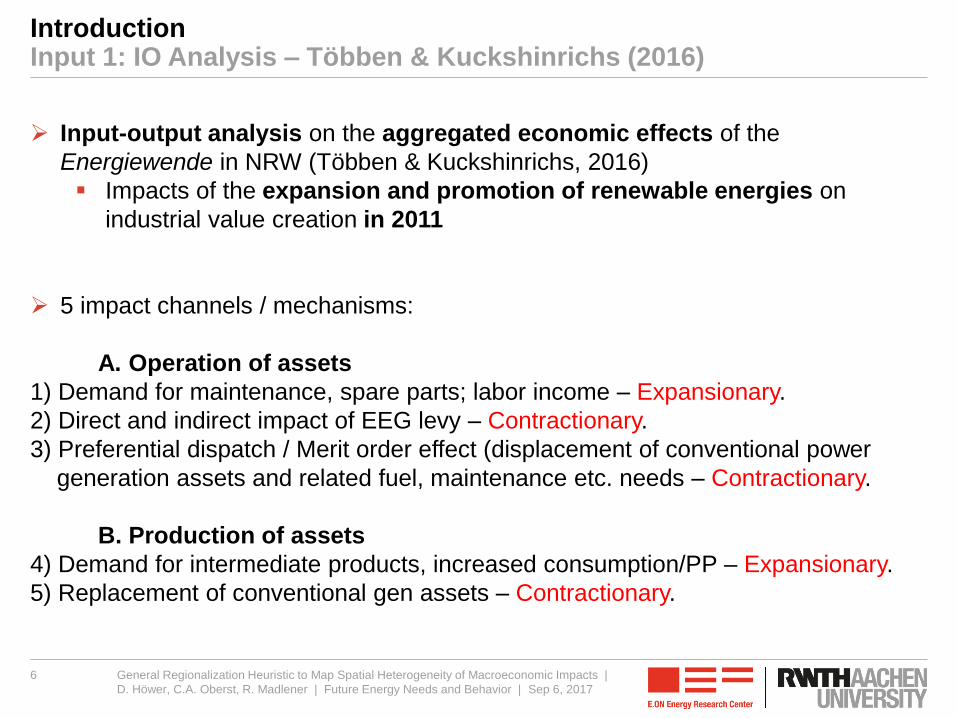
Input-output analysis on the aggregated economic effects of the
Energiewende in NRW (Többen & Kuckshinrichs, 2016)
Impacts of the expansion and promotion of renewable energies on
industrial value creation in 2011
5 impact channels / mechanisms:
A. Operation of assets
1) Demand for maintenance, spare parts; labor income – Expansionary.
2) Direct and indirect impact of EEG levy – Contractionary.
3) Preferential dispatch / Merit order effect (displacement of conventional power
generation assets and related fuel, maintenance etc. needs – Contractionary.
B. Production of assets
4) Demand for intermediate products, increased consumption/PP – Expansionary.
5) Replacement of conventional gen assets – Contractionary.

General Regionalization Heuristic to Map Spatial Heterogeneity of Macroeconomic Impacts |
D. Höwer, C.A. Oberst, R. Madlener | Future Energy Needs and Behavior | Sep 6, 2017
7
Main results:
The operation and construction of renewable energies in 2011 resulted in a
positive overall industrial value creation
Measured by the size of NRW (21% of German population and GDP) the
value created is low compared to the rest of the country

General Regionalization Heuristic to Map Spatial Heterogeneity of Macroeconomic Impacts |
D. Höwer, C.A. Oberst, R. Madlener | Future Energy Needs and Behavior | Sep 6, 2017
8
Introduction Distribution of Total Effects from Producing and Operating Renewable Energy Assets Among 35 Sectors in NRW

General Regionalization Heuristic to Map Spatial Heterogeneity of Macroeconomic Impacts |
D. Höwer, C.A. Oberst, R. Madlener | Future Energy Needs and Behavior | Sep 6, 2017
9
IntroductionInput 2: Meta Analysis – Kobiela & Vallentin (2016)
3 industry branches identified (Kobiela & Vallentin, 2016):
Machinery
Chemicals
Fabricated metals
These branches are particularly important for the Energiewende in NRW:
Include a broad range of companies and employees
Very energy- and CO2-intensive
Produce relevant equipment for the Energiewende
Particularly affected by structural change in the energy sector

General Regionalization Heuristic to Map Spatial Heterogeneity of Macroeconomic Impacts |
D. Höwer, C.A. Oberst, R. Madlener | Future Energy Needs and Behavior | Sep 6, 2017
10
Method
The regionalization heuristic is applied to results from the I-O analysis
undertaken by Kobiela & Vallentin (2016)
Detailed regional economic investigation in North Rhine-Westphalia (NRW) of:
Industrial value creation
Private consumption
Changes in economic structure
Regionalization procedure
- by 53 labor market districts
- by commuter classes (Oberst 2011)
- by labor market regions (Kropp & Schwengler 2011)

General Regionalization Heuristic to Map Spatial Heterogeneity of Macroeconomic Impacts |
D. Höwer, C.A. Oberst, R. Madlener | Future Energy Needs and Behavior | Sep 6, 2017
11
Method
1. Delineation of Functional Regions Contemplation of two well comparable delineation approaches
Labor markets by Eckey et al. (2006)
Commuting areas by Oberst (2011)
2. Regional Assignment Modeling of macroeconomic effects with a simplified heuristic
fitting macroeconomic effects with high regional differences
but no central influence on the assessed Developments
3. Computation of Regionalization Vector r (see FCN Working Paper for details) Assuming that value added is distributed uniformly among all
employees in a given branch

General Regionalization Heuristic to Map Spatial Heterogeneity of Macroeconomic Impacts |
D. Höwer, C.A. Oberst, R. Madlener | Future Energy Needs and Behavior | Sep 6, 2017
12
Selected Results 1/3
Regionalized macroeconomic net effects for the Machinery branch
Largest industry branch in
NRW
Benefit the most from the
expansion of renewable
energies
Highest estimated individual
effect occurs on the rural
district in the north of the
state (Warendorf), where over
1/3 of the employees (9,843)
work
Broad regional spread of the
effects in the branch
Big chance for widespread
positive economic effects by
expansion of know-how in
renewable energy plant
production

General Regionalization Heuristic to Map Spatial Heterogeneity of Macroeconomic Impacts |
D. Höwer, C.A. Oberst, R. Madlener | Future Energy Needs and Behavior | Sep 6, 2017
13
Selected Results 2/3
Regionalized macroeconomic net effects Fabricated metals branch
Highest absolute and
relative value added effects
of the branches analyzed
High regional concen-
tration of the value added
effects (eastern and
southeastern Ruhr-Region,
Bergisches Land)
Chance of further increased
value added effects by use
of tailored political
instruments
Risk of strong negative
economic effects by
changing market conditions

General Regionalization Heuristic to Map Spatial Heterogeneity of Macroeconomic Impacts |
D. Höwer, C.A. Oberst, R. Madlener | Future Energy Needs and Behavior | Sep 6, 2017
14
Selected Results 3/3
Regionalized macroeconomic net effects for the Chemicals branch
Lower absolute value added
effects than for the
Machinery branch, but
comparable relative effects
Highest effects in Cologne/
Bonn and Dusseldorf (incl.
Leverkusen)
Low benefits in the western
regions of NRW
High concentration of the
value added effects on a few
regions suggests strongly
site-specific policy
measures to stimulate value
added effects

General Regionalization Heuristic to Map Spatial Heterogeneity of Macroeconomic Impacts |
D. Höwer, C.A. Oberst, R. Madlener | Future Energy Needs and Behavior | Sep 6, 2017
15
Conclusion and Outlook
We introduce a general regionalization heuristic for mapping the spatial
heterogeneity of macroeconomic impacts – applied to the case of the sustainable
energy transition in North Rhine-Westphalia, Germany
We develop and apply several new metrics which: can be used to assess regional heterogeneities in a variety of contexts
illustrate the potential variance across regions
enable the discussion of economic effects separately from the net
macroeconomic impact in a standardized, mathematically well-defined
framework
Each regionalization vector can be used to regionalize a certain class of
effects Once a vector is established, it can easily be transferred to another problem
containing effects of the same class
The framework is particularly useful if effects with high regional heterogeneity
and small overall impact are to be discussed
Future research ideas: To what degree do the assumptions hold for the
considered sectors? What are the dynamics of the effects (trends)?

E.ON Energy Research Center
Institute for Future Energy Consumer Needs and
Behavior (FCN)
Mathieustraße 10, 52074 Aachen
Germany
Prof. Dr. Reinhard Madlener, Dr. Christian Oberst
T +49 241 80 49820, F +49 241 80 49829
http://www.eonerc.rwth-aachen.de/fcn
Contact
Thank you for
your kind attention! Questions?

Appendix
General Regionalization Heuristic to Map Spatial Heterogeneity of Macroeconomic Impacts |
D. Höwer, C.A. Oberst, R. Madlener | Future Energy Needs and Behavior | Sep 6, 2017
18

General Regionalization Heuristic to Map Spatial Heterogeneity of Macroeconomic Impacts |
D. Höwer, C.A. Oberst, R. Madlener | Future Energy Needs and Behavior | Sep 6, 2017
19

General Regionalization Heuristic to Map Spatial Heterogeneity of Macroeconomic Impacts |
D. Höwer, C.A. Oberst, R. Madlener | Future Energy Needs and Behavior | Sep 6, 2017
20
Regionalization metrics: Machinery Branch
Metric 53 Districts 6 Labor Market Regions
16 Functional
Economic
Regions
𝜅𝑚𝑎𝑐ℎ [𝑚. 𝐸𝑢𝑟𝑜] 117
max 𝒓𝑚𝑎𝑐ℎ [𝑚. 𝐸𝑢𝑟𝑜] 6 ∗ 53 18
min 𝒓𝑚𝑎𝑐ℎ [𝑚. 𝐸𝑢𝑟𝑜] 0 4.5 0.3
spread [m. Euro] 6.2 48.8 17.5
var 𝒓𝑚𝑎𝑐ℎ [𝑚. 𝐸𝑢𝑟𝑜] 12.5 ∗ 106 2.6 ∗ 108 2.9 ∗ 107
σ 𝒓𝑚𝑎𝑐ℎ [𝑚. 𝐸𝑢𝑟𝑜] 1.6 1. 6 5.4
var 𝒍𝑚𝑎𝑐ℎ [−] 1.7824 ∗ 10−4 1.8596 ∗ 10−2 2.1307 ∗ 10−3
σ 𝒍𝑚𝑎𝑐ℎ [−] 1.3351 ∗ 10−2 1.3637 ∗ 10−1 4.6159 ∗ 10−2
spread ratio [−] - 9.5848 0.35354
σ-ratio [−] - 0.0979 0.289239
𝜅𝑚𝑎𝑐ℎ [𝐸𝑢𝑟𝑜
𝑝𝑒𝑟𝑠] 102.63
max ො𝒓𝑚𝑎𝑐ℎ [𝐸𝑢𝑟𝑜
𝑝𝑒𝑟𝑠] 219 277 297
min ො𝒓𝑚𝑎𝑐ℎ [𝐸𝑢𝑟𝑜
𝑝𝑒𝑟𝑠] 0 161 59
spread [𝐸𝑢𝑟𝑜
𝑝𝑒𝑟𝑠] 219.37 115.57 237.49
var ො𝒓𝑚𝑎𝑐ℎ [𝐸𝑢𝑟𝑜] 2152.3 1896.3 4338
σ ො𝒓𝑚𝑎𝑐ℎ [𝐸𝑢𝑟𝑜] 46.393 43.546 65.864
var 𝒍𝑚𝑎𝑐ℎ [−] 0.156243 0.13765 0.3149
σ 𝒍𝑚𝑎𝑐ℎ [−] 0.39527 0.37102 0.56116
spread ratio [−] - 1.8981 0.9237
σ-ratio [−] - 1.27401 0.70425
Table 3: Summary of regionalization metrics machinery branch

General Regionalization Heuristic to Map Spatial Heterogeneity of Macroeconomic Impacts |
D. Höwer, C.A. Oberst, R. Madlener | Future Energy Needs and Behavior | Sep 6, 2017
21
Regionalization metrics: Chemicals BranchTable 3: Summary of regionalization metrics chemicals branch
Metric 53 Districts6 Labor Market
Regions
16 Functional
Economic Regions
𝜅𝑐ℎ𝑒𝑚 94.85 ∗ 106 94.85 ∗ 106 94.85 ∗ 106
max 𝒓𝑐ℎ𝑒𝑚 [𝐸𝑢𝑟𝑜] 8.732 ∗ 106 54.391 ∗ 106 25.34 ∗ 106
min 𝒓𝑐ℎ𝑒𝑚 [𝐸𝑢𝑟𝑜] 0.0 0.36126 ∗ 106 0.0
spread [Euro] 8.732 ∗ 106 54.029 ∗ 106 25.34 ∗ 106
Var 𝒓𝑐ℎ𝑒𝑚 [𝐸𝑢𝑟𝑜] 4.827 ∗ 1012 3.619 ∗ 1014 5.622 ∗ 1013
⋅ σ 𝒓𝑐ℎ𝑒𝑚 [𝐸𝑢𝑟𝑜] 2.197 ∗ 106 1.902 ∗ 106 7.499 ∗ 106
Var 𝒍𝑐ℎ𝑒𝑚 [−] 5.366 ∗ 10−4 4.023 ∗ 10−2 6.250 ∗ 10−3
σ 𝒍𝑐ℎ𝑒𝑚 [−] 2.315 ∗ 10−2 2.005 ∗ 10−1 7.906 ∗ 10−2
spread ratio [−] - 0.16161 0.34459
σ-ratio [−] - 0.116 0.293
𝜅𝑐ℎ𝑒𝑚 [𝐸𝑢𝑟𝑜
𝑝𝑒𝑟𝑠] 102.19 102.19 102.19
max ො𝒓𝑐ℎ𝑒𝑚 [𝐸𝑢𝑟𝑜
𝑝𝑒𝑟𝑠] 687.92 366.8 389.04
min ො𝒓𝑐ℎ𝑒𝑚 [𝐸𝑢𝑟𝑜
𝑝𝑒𝑟𝑠] 0.0 12.208 0.0
spread [𝐸𝑢𝑟𝑜
𝑝𝑒𝑟𝑠] 687.92 354.59 389.04
Var ො𝒓𝑐ℎ𝑒𝑚 [𝐸𝑢𝑟𝑜] 14370 14135 15915
⋅ σ ො𝒓𝑐ℎ𝑒𝑚 [𝐸𝑢𝑟𝑜] 119.88 118.89 126.16
Var 𝒍𝑐ℎ𝑒𝑚 [−] 1.5973 1.5712 1.769
σ 𝒍𝑐ℎ𝑒𝑚 [−] 1.2638 1.2535 1.33
spread ratio [−] - 1.9400 1.7682
σ-ratio [−] - 1.0083 0.95023
General Regionalization Heuristic to Map Spatial Heterogeneity of Macroeconomic Impacts |
D. Höwer, C.A. Oberst, R. Madlener | Future Energy Needs and Behavior | Sep 6, 2017
22
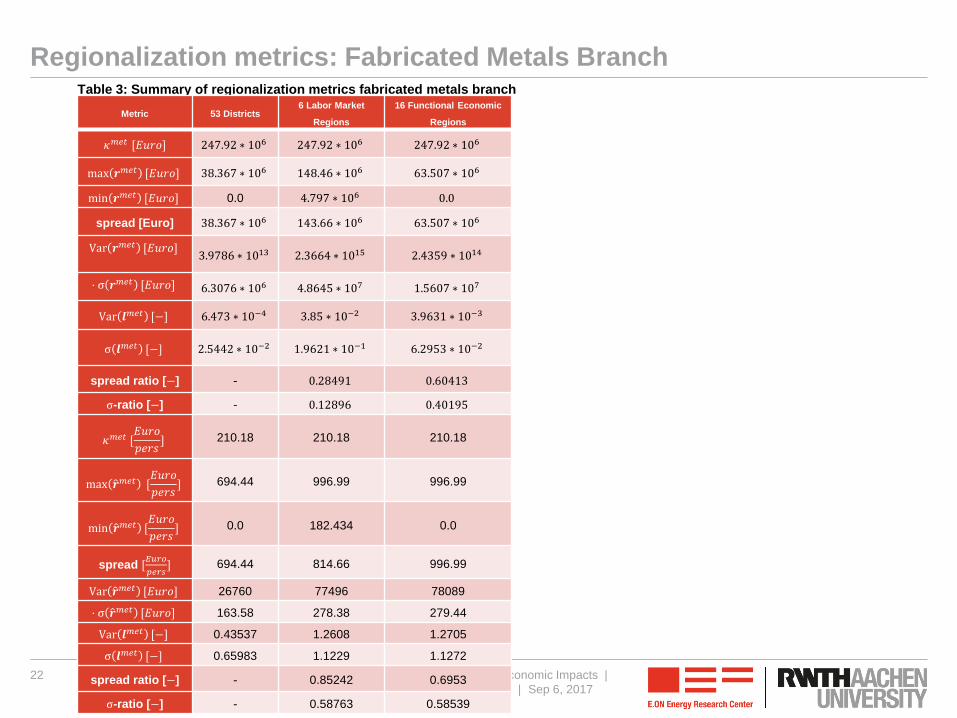
Regionalization metrics: Fabricated Metals BranchTable 3: Summary of regionalization metrics fabricated metals branch
Metric 53 Districts6 Labor Market
Regions
16 Functional Economic
Regions
𝜅𝑚𝑒𝑡 [𝐸𝑢𝑟𝑜] 247.92 ∗ 106 247.92 ∗ 106 247.92 ∗ 106
max 𝒓𝑚𝑒𝑡 [𝐸𝑢𝑟𝑜] 38.367 ∗ 106 148.46 ∗ 106 63.507 ∗ 106
min 𝒓𝑚𝑒𝑡 [𝐸𝑢𝑟𝑜] 0.0 4.797 ∗ 106 0.0
spread [Euro] 38.367 ∗ 106 143.66 ∗ 106 63.507 ∗ 106
Var 𝒓𝑚𝑒𝑡 [𝐸𝑢𝑟𝑜]3.9786 ∗ 1013 2.3664 ∗ 1015 2.4359 ∗ 1014
⋅ σ 𝒓𝑚𝑒𝑡 [𝐸𝑢𝑟𝑜] 6.3076 ∗ 106 4.8645 ∗ 107 1.5607 ∗ 107
Var 𝒍𝑚𝑒𝑡 [−] 6.473 ∗ 10−4 3.85 ∗ 10−2 3.9631 ∗ 10−3
σ 𝒍𝑚𝑒𝑡 [−] 2.5442 ∗ 10−2 1.9621 ∗ 10−1 6.2953 ∗ 10−2
spread ratio [−] - 0.28491 0.60413
σ-ratio [−] - 0.12896 0.40195
𝜅𝑚𝑒𝑡 [𝐸𝑢𝑟𝑜
𝑝𝑒𝑟𝑠] 210.18 210.18 210.18
max ො𝒓𝑚𝑒𝑡 [𝐸𝑢𝑟𝑜
𝑝𝑒𝑟𝑠] 694.44 996.99 996.99
min ො𝒓𝑚𝑒𝑡 [𝐸𝑢𝑟𝑜
𝑝𝑒𝑟𝑠] 0.0 182.434 0.0
spread [𝐸𝑢𝑟𝑜
𝑝𝑒𝑟𝑠] 694.44 814.66 996.99
Var ො𝒓𝑚𝑒𝑡 [𝐸𝑢𝑟𝑜] 26760 77496 78089
⋅ σ ො𝒓𝑚𝑒𝑡 [𝐸𝑢𝑟𝑜] 163.58 278.38 279.44
Var 𝒍𝑚𝑒𝑡 [−] 0.43537 1.2608 1.2705
σ 𝒍𝑚𝑒𝑡 [−] 0.65983 1.1229 1.1272
spread ratio [−] - 0.85242 0.6953
σ-ratio [−] - 0.58763 0.58539