general motors company - frontlineanalysts.com · 40% equity interest in saic-gmac in china in for...
TRANSCRIPT


2
GENERAL MOTORS COMPANY (MAY-2016)
Key Credit Metrics 2014 2015 2016E Total Revenues 155,929 152,356 155,559 Adj. EBITDA 10,924 14,747 13,650 Adj. EBITDA Margin 7.0% 9.7% 11.4% Adj. Gross Debt 30,602 27,634 31,733 Adj. Gross Debt/EBITDA 2.8x 1.9x 2.0x Adj. FFO/Gross Debt 32% 50% 37% Adj. EBITDA/Net Interest 35.8x 40.3x 42.8x
Rating Agencies/Mkt Cap. S&P Moody’
s Fitch
Sr. Unsecured. Rating BBB- Ba1 BBB-
Agency Outlook Stable Positive Stable
Ticker GM US Equity Industry Auto Mkt. Cap $47bn Country United States
Credit Positives
x Competitive North America Product Portfolio: New products, successful marketing and solid quality ratings have enabled GM to maintain and grow market share in the currently strong US auto market.
x Well Established Market Share in China: GM has built and maintained market share in China which, despite a recent slowdown, should deliver solid long term growth.
x Improving Automotive Margins and Free Cash Flow: GM has steadily improved adjusted EBIT and margins in its key North America operations over the last two years, and is expected to deliver further improvement in 2016, with company guidance for adjusted automotive free cash flow of ~$6bn (2015: $2.2bn, 2014: $3.1bn)
Credit Negatives
x Highly competitive sector and cyclical demand: GM has to compete a range of domestic and global competitors in all its markets, which requires continued investment in new products and marketing, which has be sustained through the business cycle.
x Lack of Profitability in Europe and South America: GM will have to make substantial investments of capital and management time to rebuild profitability in these operations.
x Low Cost Overseas Competitors: A strong US dollar is giving a significant cost advantage to foreign auto producers, particularly the Japanese.
x Shareholder Distributions: GM has stepped up its planned share repurchase program and dividend policy, which could reduce the group’s surplus cash position.
The Company Detroit, Michigan-based General Motors Company (GM) is a leading global auto producer with a 10.6% share of worldwide wholesale vehicle sales in Q116, and a 16.4% market share in the US (Source: Q116 Company Earnings Presentation). Principal brands comprise Buick, Cadillac, Chevrolet, and GMC, which are marketed and sold globally, and Holden, Opel and Vauxhall which are marketed and sold outside North America. Approximately 48% of 2015 GM wholesale vehicle unit sales were outside the US. The company operates with five business segments: GM North America (GMNA, 71% of Q116 revenues), GM Europe (GME, 13%), GM International Operations (GMIO, 7%), GM South America (GMSA, 4%), GM Financial (captive automotive finance, 6%). As of December 31, 2015, GM had ~215,000 employees worldwide and operations in 59 countries.
GM and US peer Ford were downgraded to sub-investment grade ratings in 2005 due to eroding market shares, high US healthcare liabilities, recessions in the US and Western Europe, and rising fuel costs. Market pressures on GM continued with the subsequent global financial crisis, which caused a slump in auto sales and a ~$31bn loss for the company in 2008, and resulted in GM filing for bankruptcy protection under Chapter 11 on June 1, 2009 with assets of $82bn and $173bn in liabilities. GM subsequently received ~$59bn in funding from the US and Canadian governments, and, 10 days after the bankruptcy filing, “Old-General Motors” sold substantially all its assets to a new entity: General Motors Company in a prepackaged reorganization. GM regained

3
an investment grade rating in September 2014 (upgrade to BBB- from BB+).
GM is a calendar reporter. Long term performance and profitability are driven by GM’s ability to develop and produce new vehicle models which meet changing consumer demands, and can successfully compete with rival products. Operating results are impacted by global and regional retail sales of cars and light trucks, which are cyclical, and by GM”s success in maintaining market share, meeting competitor pricing pressures, and absorbing commodity price and currency volatility. Profitability is particularly dependent on the US market (69% of 2015 GM auto revenues) and on GM’s success in maintaining volume and market share in the full-size pick- up truck and SUV segment, which has the highest margins.
GM’s 2015 regional market shares, reflecting ~10 million GM brand global retail vehicle sales (includes JV retail vehicle sales) were: North America (16.8%), China (#1, 14.9%), Asia/Pacific, Middle East & Africa (#2, 10.3%), Europe (#7 6.1%). (Source: 2015 10K). Wholesale vehicle sales, which represent GM sales directly to dealers and others (excludes vehicles produced by JVs) and correlate to auto revenues reported by the company, were ~5.9 million in 2015 (2014 ~6.0 million). GM estimates its global breakeven point at ~4.5 million annual wholesale vehicle sales.
2015 group revenues fell 2% yoy to $152bn (automotive revenues down 3% to $146bn) primarily due to a $9.3bn negative currency impact. Excluding FX, revenues increased 4% yoy, reflecting strong SUV sales in China partly offset by the impact of a change in the Russia business model, a planned reduction in US fleet sales, and a lower market share in Brazil due to vehicle price increases. 2015 consolidated Adjusted-EBIT (EBIT-Adj.) was $10.8bn (2014 $6.6bn), with a 2015 consolidated margin of 7.1%, up 110bp compared to 2014 adjusted for the impact of recalls, reflecting volume growth, favorable product mix, and lower costs.
Q116 consolidated revenues increased 4% yoy to $37.3bn (automotive revenues up 2% to $35.2bn), reflecting strong SUV and luxury vehicle sales in China, higher
Cadillac and Opel/Vauxhall sales in Europe, and higher US retail sales (+7% yoy) driven by growth in Chevrolet and Buick volumes. EBIT-Adj. increased 28% yoy to $2.7bn. Management 2016 guidance includes Adjusted EPS of $5.25-$5.75 (2015: $5.02).
Business Segments
x GMNA – Q116 Revenues $26.5bn (+7% yoy), EBIT-
Adj. $2.3bn (+5%): Q116 GM North America wholesale vehicle sales were 874 thousand (+5% yoy), reflecting increased retail demand for full size pick-ups and SUVS, and midsize cars. Market share was 15.9% market share, down 50bp from Q115, primarily due to a reduction in daily rental deliveries. Q116 operating results benefited from growth in wholesale sales volume (+$1.2bn revenue benefit), favorable product mix (+$0.4bn) and improved pricing (+$0.3bn), partly offset by a negative currency impact (-$0.3bn).
x GME- Q116 Revenues $4.7bn (+5% yoy), EBIT-Adj. loss -$6m (Q115: -$239m): GM’s core brands in Western and Central Europe are Opel and Vauxhall, and its largest markets are the United Kingdom (Q116 market share: 9.6%) and Germany (7.1%). In 2015, GM restructured its operations in Russia, ending manufacturing and distribution of Opel brand vehicles, and scaling back distribution of Chevrolet brand vehicles. Q116 revenues benefited from growth in wholesale sales volume, primarily due to strong demand for the next generation Opel Astra, and from improved pricing, partly offset by a negative currency impact. The yoy improvement in operating losses reflects a reduction in fixed costs and growth in wholesale sales.
x GMIO- Q116 Revenues $2.7bn (-14% yoy), EBIT-Adj. $379m (+2%): GMIO comprises all GM’s international vehicle businesses not reported in GME or GMSA, and include its Chinese operations which are held in three equity accounted JVs. Principal brands are: Buick, Cadillac, Chevrolet, Baojun, Jiefang, Wuling. GM Q116 operating results reflect lower wholesale volumes, primarily due to weaker demand in Egypt and South Africa, and termination of Chevrolet Spin and Sonic production in Southeast

4
Asia. GM Q116 wholesale market share in China was 14.6% (-20bps yoy), with volumes up slightly. GM China JV equity income was flat yoy at $0.5bn. GMIO Adjusted EBIT benefited from cost savings.
x GMSA- Q116 Revenues $1.3bn (-36% yoy), EBIT-Adj. loss -$67m (Q115: -$214m): GM’s principal brand in South America is Chevrolet. Management indicated in the Q116 results presentation that operating results were impacted by weak economic conditions in the region, particularly Brazil, putting pressure on wholesale volumes which fell 37 thousand yoy to 114 thousand. Q116 market share was 15.6% (Q115: 16.7%).
x GM Financial- Q116 Revenues $2.1bn (+53% yoy), Adj. Income before Taxes $225m (+5%): GM operates in its captive finance operations through General Motors Financial Company Inc., which provides vehicle inventory financing, insurance, capital improvement loans and storage center financing to dealer customers. In 2013, GM Financial acquired Ally Financial’s auto finance operations in Europe and Latin America for $3.3bn, and, in 2015, a 40% equity interest in SAIC-GMAC in China in for $1.0. Q116 yoy revenue growth reflects a larger lease portfolio.
Ownership structure General Motors is NYSE-listed. Major shareholders are UAW Retiree Medical Benefits Trust (9.1%), Vanguard (5.4%), Harris Associates (5.3%), BlackRock (4.9%) and JP Morgan Chase (4.2%). The UAW Trust provides health care benefits for retired UAW members of General Motors, Ford and Chrysler. (Source: Bloomberg).
History of acquisitions No major acquisitions or disposals were made in 2012-2015. In March 2016, General Motors announced plans to acquire Cruise Automation. The transaction closed on May 13, 2016. In January 2016, General Motors purchased a 9% equity interest in Lyft for $0.5bn. Non-core divestments in the last 5 years include: 2013 - a 7% interest in Peugeot S.A. for $339m, 2011 - Class A membership interests in Delphi Automotive for $3.8bn.
Management Mary T. Barra (55) has been CEO since January 2014. She was appointed Chairman in January 2016. Barra, who joined General Motors as a co-op student in 1980, holds an MBA from Stanford.
Charles K. Stevens (55) has been GM CFO since January 2014. He was previously CFO of General Motors North America Inc., starting in 2010. Stevens joined the Buick Motor division in 1983. He holds an MBA from the University of Michigan.
Financial Strategy General Motors is focused on maintaining an investment grade balance sheet (Source: 2015 10K). Financial targets include: Consolidated EBIT-adjusted margin of 9%-10% by early next decade, Annual operational and functional cost savings of $5.5bn by 2018; Average adjusted annual automotive FCF of $6bn-$7bn in 2016 to 2018; Combined cash and marketable securities of $20bn; Average consolidated ROIC > 20% (four-quarters ended March 31, 2016 ROIC: 28.5%). (Source: Q116 Earnings Call).
In January 2016, the Board of Directors increased GM’s total share repurchase authorization through 2017 to $9bn (was $5bn). At April 19, 2016, the remaining share buyback authorization was $5.2bn.
Net capex has averaged $7.5bn annually in 2013-2015. Management 2016 guidance for capex is ~$9bn.
Total year-end Automotive debt was $7.8bn in 2013, $10.0bn in 2014 and $9.2bn in 2015.
Litigation/Social/Environment Litigation relates primarily to product liability. In 2014, GM recalled 2.6 million vehicles as a result of faulty ignition switches (the Ignition Switch Recall) . At January 29, 2016, the company had paid $554m to 345 claimants who accepted offers under the compensation program created by GM in Q214 for victims who died or suffered injuries due to faulty ignition switches. Several lawsuits are pending, including claims for personal injury and economic

5
loss. 2015 legal and settlement charges related to the Ignition Switch Recall were $1.6bn.
GM’s automotive operations are subject to environmental regulations and actions in its ordinary course of business. At December 31, 2015, GM estimated remediation losses were in the range $100m-$210m. Litigation reserves at December 31, 2015 included: litigation-related liability and tax matters $1.3bn, product liability $688m, Ignition Switch Recall compensation program $33m.
Rating Agencies Adjusted Gross Debt/EBITDA is calculated at 1.9x for 2015, and is estimated at 2.0x for 2016, based on BBG consensus.
S&P On February 18, 2016, S&P assigned a BBB- rating to GM’s newly issued $2 billion senior secured debt. S&P expected GM’s plans to increase shareholder returns would be counterbalanced by the company’s strong liquidity and positive free cash flows. Positives included strong credit metrics which had been better than S&P’s benchmarks for an “intermediate” financial risk profile, and strong industry conditions in the core North American market. S&P expected GM to sustain Debt/EBITDA of 2x-3x and Free Operating Cash Flow/Debt of 15%-25% despite industry volatility.
Moody’s On February 16, 2016, Moody’s affirmed GM’s Ba1 senior note rating, and revised its outlook to positive from stable, expecting the company to maintain its strong position in China, strengthen its performance in North America and Europe, and build an operating structure that can compete with the risks inherent in the automotive sector. Key challenges are high cyclicality, excess capacity, and intense competition. Moody’s calculated 2015 Debt/EBITDA of 3.0x (downgrade trigger: >3x), EBITA Margin of 3.8% (below 5%) and EBITA/Interest Expense of 2.6x (below 3x). Rating upgrade is possible if EBITA margin >8%, Debt/EBITDA near 2x and EBITA/Interest approaches 6x.
Liquidity Information At March 31, 2016, GM’s automotive operations had $12.0bn cash, $6.5bn marketable securities, and $12.1bn RCF availability, against $1.7bn short term obligations. 2017-2019 debt maturities are $1.8bn. GM’s $12.5bn RCF comprises: a $5.0bn three-year RCF (GM Financial sub limit $2.0bn, LC sub-facility $1.6b, Brazilian Real sub-facility $305m), a $7.5bn five year RCF ($2bn, $500m and $195m). The RCF includes covenants requiring global liquidity ≥$4bn and US liquidity ≥$2bn. Adjusted automotive free annual cash flow was $3.7bn in 2013, $3.0bn in 2014, $2.1bn in 2015. Management 2016 guidance for automotive FCF is $6.0bn.
Off Balance Sheet data 2015 debt adjustments were discounted operating leases $1.2bn, post-tax pension liability $13.8bn, post-tax retirement liability $3.9bn. Moody’s 2015 adjustments include operating leases $1.1bn and pension obligations $21.3bn. S&P’s adjustments are not available.
6
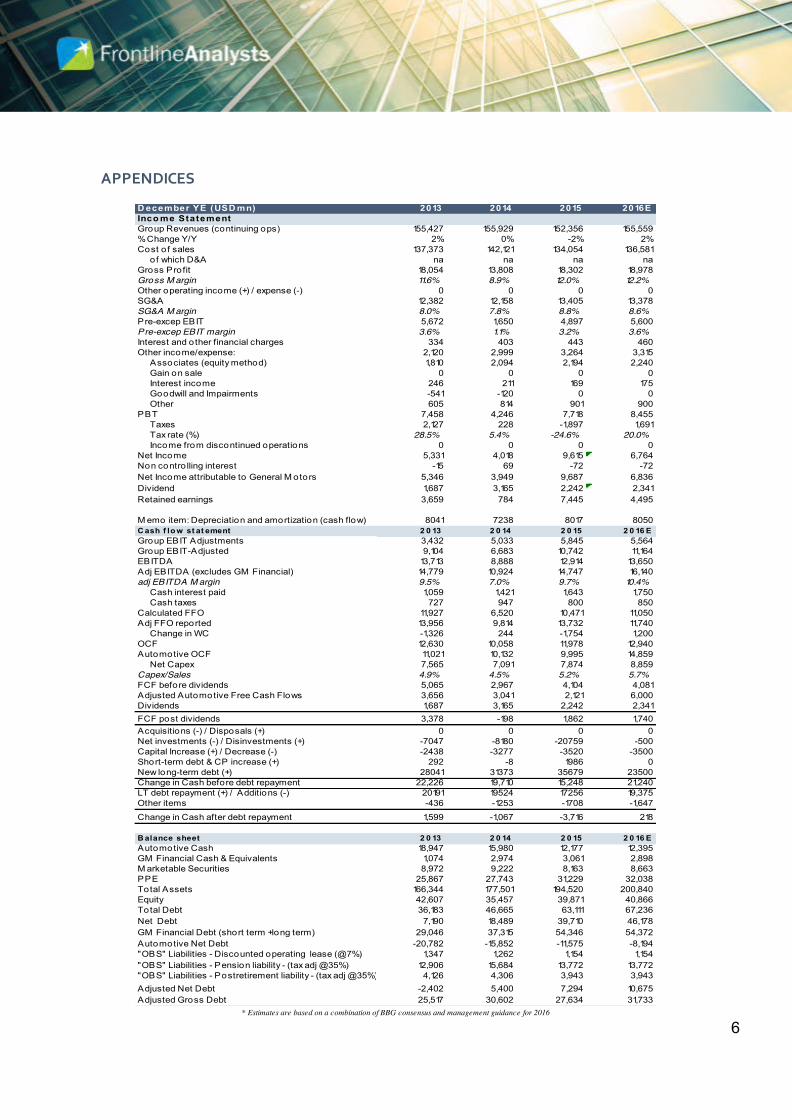
APPENDICES
* Estimates are based on a combination of BBG consensus and management guidance for 2016
D ecember YE (USD mn) 2013 2014 2015 2016EInco me StatementGroup Revenues (continuing ops) 155,427 155,929 152,356 155,559% Change Y/Y 2% 0% -2% 2%Cost o f sales 137,373 142,121 134,054 136,581
of which D&A na na na naGross Profit 18,054 13,808 18,302 18,978Gross M argin 11.6% 8.9% 12.0% 12.2%Other operating income (+) / expense (-) 0 0 0 0SG&A 12,382 12,158 13,405 13,378SG&A M argin 8.0% 7.8% 8.8% 8.6%Pre-excep EBIT 5,672 1,650 4,897 5,600Pre-excep EBIT margin 3.6% 1.1% 3.2% 3.6%Interest and other financial charges 334 403 443 460Other income/expense: 2,120 2,999 3,264 3,315
Associates (equity method) 1,810 2,094 2,194 2,240Gain on sale 0 0 0 0Interest income 246 211 169 175Goodwill and Impairments -541 -120 0 0Other 605 814 901 900
PBT 7,458 4,246 7,718 8,455Taxes 2,127 228 -1,897 1,691Tax rate (%) 28.5% 5.4% -24.6% 20.0%Income from discontinued operations 0 0 0 0
Net Income 5,331 4,018 9,615 6,764Non contro lling interest -15 69 -72 -72Net Income attributable to General M otors 5,346 3,949 9,687 6,836Dividend 1,687 3,165 2,242 2,341Retained earnings 3,659 784 7,445 4,495
M emo item: Depreciation and amortization (cash flow) 8041 7238 8017 8050C ash f low st at ement 2 0 13 2 0 14 2 0 15 2 0 16 EGroup EBIT Adjustments 3,432 5,033 5,845 5,564Group EBIT-Adjusted 9,104 6,683 10,742 11,164EBITDA 13,713 8,888 12,914 13,650Adj EBITDA (excludes GM Financial) 14,779 10,924 14,747 16,140adj EBITDA M argin 9.5% 7.0% 9.7% 10.4%
Cash interest paid 1,059 1,421 1,643 1,750Cash taxes 727 947 800 850
Calculated FFO 11,927 6,520 10,471 11,050Adj FFO reported 13,956 9,814 13,732 11,740
Change in WC -1,326 244 -1,754 1,200OCF 12,630 10,058 11,978 12,940Automotive OCF 11,021 10,132 9,995 14,859
Net Capex 7,565 7,091 7,874 8,859Capex/Sales 4.9% 4.5% 5.2% 5.7%FCF before dividends 5,065 2,967 4,104 4,081Adjusted Automotive Free Cash Flows 3,656 3,041 2,121 6,000Dividends 1,687 3,165 2,242 2,341FCF post dividends 3,378 -198 1,862 1,740Acquisitions (-) / Disposals (+) 0 0 0 0Net investments (-) / Disinvestments (+) -7047 -8180 -20759 -500Capital Increase (+) / Decrease (-) -2438 -3277 -3520 -3500Short-term debt & CP increase (+) 292 -8 1986 0New long-term debt (+) 28041 31373 35679 23500Change in Cash before debt repayment 22,226 19,710 15,248 21,240LT debt repayment (+) / Additions (-) 20191 19524 17256 19,375Other items -436 -1253 -1708 -1,647
Change in Cash after debt repayment 1,599 -1,067 -3,716 218
B alance sheet 2 0 13 2 0 14 2 0 15 2 0 16 EAutomotive Cash 18,947 15,980 12,177 12,395GM Financial Cash & Equivalents 1,074 2,974 3,061 2,898M arketable Securities 8,972 9,222 8,163 8,663PPE 25,867 27,743 31,229 32,038Total Assets 166,344 177,501 194,520 200,840Equity 42,607 35,457 39,871 40,866Total Debt 36,183 46,665 63,111 67,236Net Debt 7,190 18,489 39,710 46,178GM Financial Debt (short term +long term) 29,046 37,315 54,346 54,372Automotive Net Debt -20,782 -15,852 -11,575 -8,194"OBS" Liabilities - Discounted operating lease (@7%) 1,347 1,262 1,154 1,154"OBS" Liabilities - Pension liability - (tax adj @35%) 12,906 15,684 13,772 13,772"OBS" Liabilities - Postretirement liability - (tax adj @35%) 4,126 4,306 3,943 3,943Adjusted Net Debt -2,402 5,400 7,294 10,675Adjusted Gross Debt 25,517 30,602 27,634 31,733

7
Q116 Revenues by Operating Segment 2015 Revenues by Geography
Adjusted Gross Debt/EBITDA Adjusted FFO/Gross Debt
Key Ratios
2013 2014 2015 2016E Gross Debt / EBITDA 2.6x 5.3x 4.9x 4.9x Adj. Gross Debt / EBITDA 1.7x 2.8x 1.9x 2.0x Adj. Net Debt / EBITDA 0.0x 0.5x 0.5x 0.7x Adj. EBITDA / Net Interest 71.3x 35.8x 40.3x 42.8x Adj. EBIT / Net Interest 44.1x 22.1x 29.4x 29.7x Adj. FFO / Gross Debt 55% 32% 50% 37% Adj. FFO / Net Debt -581% 182% 188% 110%
FCF / Net Debt 47% -1% 5% 4% Cash / Adj. Total Debt 74% 52% 44% 39% Net Financial Leverage (ND / ND + Equity) 14% 34% 50% 53%
GMNA71%
GME12%
GMIO7%
GMSA4%
GM Financial
6%
GMNA73%
GME13%
GMIO9%
GMSA5%
1.7x
2.8x
1.9x2.0x
0x
1x
2x
2x
3x
2013 2014 2015 2016E
55%
32%
50%
37%
0%
15%
30%
45%
60%
2013 2014 2015 2016E