general motors collision avoidance features · ulletin vol. 34, no. 6 : april 2017 highway loss...
TRANSCRIPT

Bulletin Vol. 34, No. 6 : April 2017
Highway Loss Data Institute
General Motors collision avoidance featuresIn 2011 and 2016, the Highway Loss Data Institute (HLDI, 2011 and 2016) evaluated parking alerts and a blind spot with lane departure warning system on 2008–09 Buick Lucerne vehicles. This study evaluates a more recent and diverse group of General Motors (GM) vehicles, including both sedans and very large SUVs. In addition, a much broader range of collision avoidance features was available on these vehicles. Some of the features available included forward collision warning and automatic emergency braking with lane departure warning or lane keep assist, side blind zone alert with rear cross-traffic alert, advanced headlight technologies and parking assist systems.
Claim frequency results for GM’s collision avoidance features are shown in the table below. (Note: Since claims data do not provide de-tailed crash information, this analysis addresses “overall” claim reduction effects rather than feature effectiveness for a targeted crash type.) Statistically significant results are bolded. Many of GM’s systems are associated with significant reductions to both physical dam-age and injury claim frequencies. The forward alerts/automatic braking package, which includes front automatic braking with forward collision alert, lane departure warning or lane keep assist (which includes lane departure warning), and regular or full-speed adaptive cruise control, is associated with statistically significant reductions to almost all coverage types. Although rear-vision cameras only are not associated with reductions in physical damage claim frequencies, parking alerts show statistically significant reductions. The larg-est claim frequency benefits, however, occur when both parking alerts and rear-vision cameras are together on the vehicle. The effect from both systems together exceeds the sum of the effects from the individual systems. This is one of the first studies in which HLDI has evaluated a rear automatic braking system. This system is associated with large reductions to physical damage claim frequencies.
In addition to the strong claim frequency benefits, many of GM’s systems are also reducing claim severities and overall losses. Both of GM’s front crash prevention packages are associated with reductions to claim severities for both collision and property damage liability (PDL) coverages. Consequently, overall losses for both coverage types are reduced as well. Although HID and steerable HID lights are associated with increased collision severities and overall losses, this is offset by reductions to PDL overall losses. The parking alerts and rear-vision cameras, as well as the rear automatic braking system, are associated with large and significant increases to collision and PDL severi-ties. However, this is a result of a shift in the severity distribution due to the systems primarily preventing low cost claims. As a result, overall losses were reduced for both collision and PDL for parking alerts and rear-vision cameras, and PDL for rear automatic braking.
Summary of claim frequency estimates for GM’s collision avoidance systems
Vehicle damage coverage typeForward Alerts
Package
Forward Alerts/ Automatic Brak-
ing PackageSide Alerts Package HID Headlights
Steerable HID Headlights
IntelliBeam Headlights
Collision -4.1% -5.4% 0.5% -2.0% -1.7% 3.6%
Property damage liability -1.7% -9.2% -4.1% -6.0% -6.8% 0.6%
Injury coverage type
Bodily injury liability -11.1% -19.6% -2.8% -4.5% -9.5% 14.5%
Medical payment -9.2% -18.0% -2.1% -4.4% -10.3% 11.4%
Personal injury protection -16.3% -23.0% -7.0% -8.2% -4.7% 6.5%
Vehicle damage coverage typeParking Alerts
onlyRear-vision Camera only
Parking Alerts and Rear-Vision
CameraAutomatic Park-
ing AssistRear Automatic
Braking
Collision -4.3% -2.0% -7.1% -2.6% -13.1%
Property damage liability -7.5% 0.4% -16.6% 0.8% -26.3%
Injury coverage type
Bodily injury liability -2.0% -2.7% -14.2% 5.2% -8.9%
Medical payment -5.9% -18.4% -12.6% -4.8% -1.5%
Personal injury protection 10.3% 5.1% -4.6% -3.0% -1.8%

HLDI Bulletin | Vol 34, No. 6 : April 2017 2
IntroductionThis HLDI bulletin provides a first look at the effect of several of GM collision avoidance features on insurance losses. The features included in this study are:
Front crash prevention technologyForward Collision Alert (FCA) uses either a camera, a radar sensor or both and can detect a preceding vehicle with-in distances of 60 m (197 ft) and operates at speeds above 40 km/h (25 mph). If the vehicle has adaptive cruise control, it can detect vehicles to distances of approximately 110 m (360 ft) and operates at all speeds. FCA timing can be set to far, medium, or near-alert timing, and FCA can be turned off. The chosen setting will remain until it is changed and the alert timing will affect the Collision Alert and the Tailgating Alert timing, as well as the adaptive cruise control gap setting. When a vehicle is detected ahead, FCA provides a green indicator, which turns amber if following an-other detected vehicle much too closely. If the system detects that a front-end collision situation is imminent while following a detected vehicle, the system alerts the driver to a potential crash. A red indicator display appears (which on most vehicles flashes on the windshield), and either eight beeps will sound, or both sides of the Safety Alert Seat (which provides haptic seat vibration pulses) will pulse five times.
Front Automatic Braking (FAB) with FCA uses FCA sensors to automatically apply the brakes to help reduce the collision’s severity if the system detects that a front-end collision situation is imminent while following a detected vehicle, and the driver has not already applied the brakes. The system may even help avoid the collision at very low speeds. FAB may slow the vehicle to a complete stop, and the electric parking brake will engage to hold the vehicle at a stop. A firm press of the accelerator pedal will release the brake. Automatic Braking can be disabled or reduced through the vehicle personalization menu.
Adaptive Cruise Control (ACC) uses FCA sensors to enhance regular cruise control to allow the vehicle to auto-matically follow a detected vehicle ahead at the driver-selected following gap and cruise speed while the driver steers, reducing the need for the driver to frequently brake and accelerate. ACC is not available at a speed less than 25 km/h (16 mph). Changing the ACC gap automatically changes the FCA alert timing (far, medium, or near). Some vehicles are equipped with full-speed range ACC, which is capable of operating at lower speeds in stop-and-go traffic.
Side assist systemsSide Blind Zone Alert (SBZA) uses radar sensors to provide side mirror alerts to help the driver avoid crashing into a moving vehicle detected in its side blind spot (or zone) during a lane-change maneuver. If a vehicle has been detected in the blind spot, the SBZA icon will light up in the corresponding outside side mirror. The SBZA sensor covers a zone of approximately one lane over from both sides of the vehicle, or 3.5m (11 ft). This zone starts at each side mirror and goes back approximately 5m (16 ft). The height of the zone is between approximately 0.5 m (1.5 ft) and 2m (6 ft) off the ground. SBZA can be disabled through the vehicle personalization menu.
Lane Change Alert (LCA) with SBZA is an enhancement to SBZA and uses radar sensors to provide side-mirror alerts to help the driver avoid crashing into a moving vehicle detected in its side blind spot (or zone) or a vehicle that is rapidly approaching the side blind spot during a lane-change maneuver. The LCA icon will light up in the corre-sponding side mirror and will flash if the turn signal is on. The LCA sensor covers a zone of approximately one lane over from both sides of the vehicle, or 3.5 m (11 ft). The height of the zone is between approximately 0.5 m (1.5 ft) and 2 m (6 ft) off the ground. Drivers are also warned of vehicles rapidly approaching from beyond the side blind zone areas behind the vehicle. This feature can be disabled through the vehicle personalization menu.
Lane Departure Warning (LDW) uses a camera located behind the windshield to identify traffic lane markings and provides alerts to help drivers avoid crashes due to unintentionally drifting out of their lane when their turn signal is not activated. The LDW indicator appears green if a lane marking is detected. When the vehicle crosses a detected lane marking, the LDW indicator will turn amber and flash and either three beeps will sound from the left or right, or three Safety Alert Seat pulses will occur on the left or right side of the seat. LDW is functional at speeds of 56 km/h (35 mph) or greater. The system may be deactivated by the driver.
HLDI Bulletin | Vol 34, No. 6 : April 2017 3
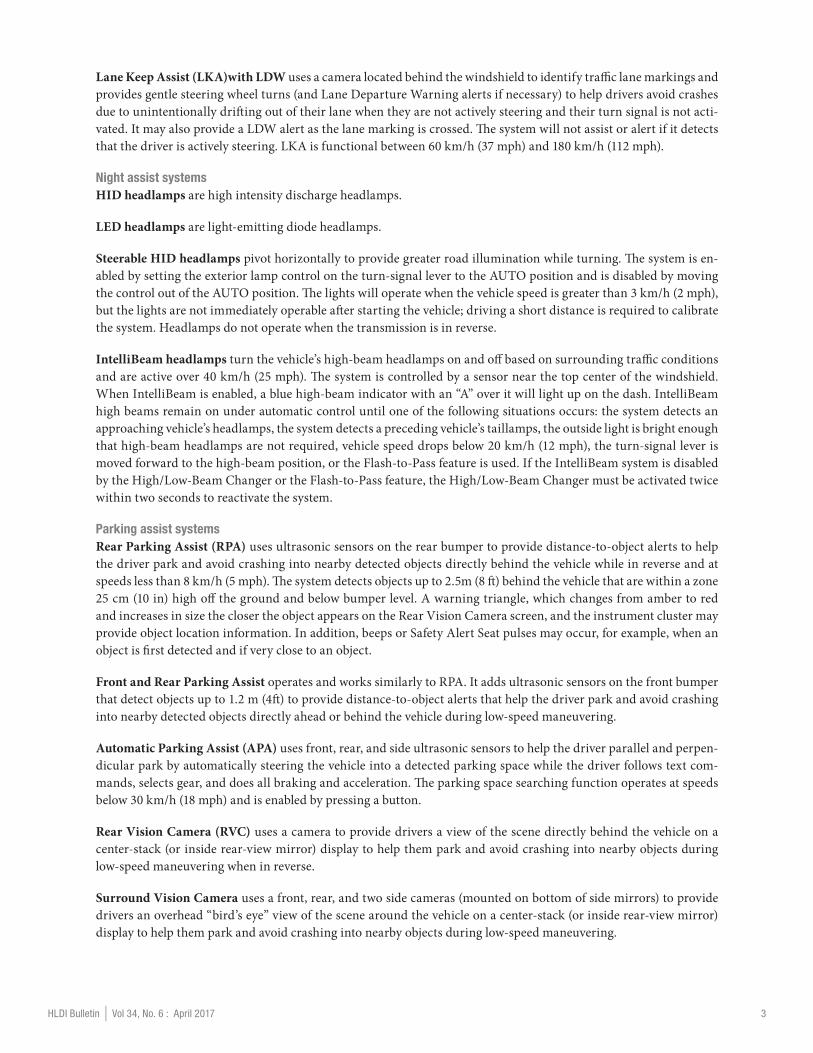
Lane Keep Assist (LKA)with LDW uses a camera located behind the windshield to identify traffic lane markings and provides gentle steering wheel turns (and Lane Departure Warning alerts if necessary) to help drivers avoid crashes due to unintentionally drifting out of their lane when they are not actively steering and their turn signal is not acti-vated. It may also provide a LDW alert as the lane marking is crossed. The system will not assist or alert if it detects that the driver is actively steering. LKA is functional between 60 km/h (37 mph) and 180 km/h (112 mph).
Night assist systemsHID headlamps are high intensity discharge headlamps.
LED headlamps are light-emitting diode headlamps.
Steerable HID headlamps pivot horizontally to provide greater road illumination while turning. The system is en-abled by setting the exterior lamp control on the turn-signal lever to the AUTO position and is disabled by moving the control out of the AUTO position. The lights will operate when the vehicle speed is greater than 3 km/h (2 mph), but the lights are not immediately operable after starting the vehicle; driving a short distance is required to calibrate the system. Headlamps do not operate when the transmission is in reverse.
IntelliBeam headlamps turn the vehicle’s high-beam headlamps on and off based on surrounding traffic conditions and are active over 40 km/h (25 mph). The system is controlled by a sensor near the top center of the windshield. When IntelliBeam is enabled, a blue high-beam indicator with an “A” over it will light up on the dash. IntelliBeam high beams remain on under automatic control until one of the following situations occurs: the system detects an approaching vehicle’s headlamps, the system detects a preceding vehicle’s taillamps, the outside light is bright enough that high-beam headlamps are not required, vehicle speed drops below 20 km/h (12 mph), the turn-signal lever is moved forward to the high-beam position, or the Flash-to-Pass feature is used. If the IntelliBeam system is disabled by the High/Low-Beam Changer or the Flash-to-Pass feature, the High/Low-Beam Changer must be activated twice within two seconds to reactivate the system.
Parking assist systemsRear Parking Assist (RPA) uses ultrasonic sensors on the rear bumper to provide distance-to-object alerts to help the driver park and avoid crashing into nearby detected objects directly behind the vehicle while in reverse and at speeds less than 8 km/h (5 mph). The system detects objects up to 2.5m (8 ft) behind the vehicle that are within a zone 25 cm (10 in) high off the ground and below bumper level. A warning triangle, which changes from amber to red and increases in size the closer the object appears on the Rear Vision Camera screen, and the instrument cluster may provide object location information. In addition, beeps or Safety Alert Seat pulses may occur, for example, when an object is first detected and if very close to an object.
Front and Rear Parking Assist operates and works similarly to RPA. It adds ultrasonic sensors on the front bumper that detect objects up to 1.2 m (4ft) to provide distance-to-object alerts that help the driver park and avoid crashing into nearby detected objects directly ahead or behind the vehicle during low-speed maneuvering.
Automatic Parking Assist (APA) uses front, rear, and side ultrasonic sensors to help the driver parallel and perpen-dicular park by automatically steering the vehicle into a detected parking space while the driver follows text com-mands, selects gear, and does all braking and acceleration. The parking space searching function operates at speeds below 30 km/h (18 mph) and is enabled by pressing a button.
Rear Vision Camera (RVC) uses a camera to provide drivers a view of the scene directly behind the vehicle on a center-stack (or inside rear-view mirror) display to help them park and avoid crashing into nearby objects during low-speed maneuvering when in reverse.
Surround Vision Camera uses a front, rear, and two side cameras (mounted on bottom of side mirrors) to provide drivers an overhead “bird’s eye” view of the scene around the vehicle on a center-stack (or inside rear-view mirror) display to help them park and avoid crashing into nearby objects during low-speed maneuvering.

HLDI Bulletin | Vol 34, No. 6 : April 2017 4
Rear Cross Traffic Alert (RCTA) uses radar sensors to provide alerts to help drivers avoid crashing into approaching detected left- or right-cross traffic (e.g., out of a crowded parking space or driveway with side obstructions) when in reverse. The system detects objects coming from up to 20 m (65 ft) on either side. When an object is detected, a red tri-angle with a left or right pointing arrow appears on the RVC screen, and three beeps will sound from the left or right, or three Safety Alert Seat pulses will occur on the left or right side of the seat. RCTA can be disabled by the driver.
Rear Automatic Braking uses radar technology when in reverse to help the driver avoid crashing (or mitigates impacts) into detected objects directly behind the vehicle by providing alerts and automatically applying hard emer-gency braking, under certain conditions, if necessary. When the system detects a potential imminent crash, beeps will be heard from the rear, or five pulses will occur from both sides of the Safety Alert Seat. There may also be a brief, sharp application of the brakes. If the system detects the vehicle is backing too fast to avoid a crash with a detected object, it may automatically brake hard to a stop. The system operates at speeds greater than 0.8 km/h (0.5 mph).
Feature dependencies
As collision avoidance technology has evolved, many of the sensor systems provide functionality for more than one collision avoidance feature. For example, the radar sensors used for blind spot detection can also be used for rear cross-traffic alert. Similarly, the camera system used for forward collision warning can also be used to identify lane markings for lane departure warning and lane keep assist systems. Furthermore, even when different sensor sys-tems are used, manufacturers may choose to bundle different collision avoidance technologies together as part of an options package or on different trim levels. Consequently, some collision avoidance features are never available independently from other features. As the insurance data provided to HLDI do not contain information on the type of crash that led to a claim, it is not possible to separate out the individual effect on insurance losses for collision avoidance features that are only available with other features. In these circumstances HLDI evaluates the effect of the combined group of features.
Other features, such as LED headlights, were only available as standard equipment on the Cadillac Escalades, and therefore their effect could not be separated from the Escalade series-level effect. Similarly, GM’s cornering lamps were similarly confounded and could not be estimated separately as they were standard on the Premium and Plati-num trim levels of the Escalade. HLDI also grouped together several other features with similar functionality, such as side blind zone alert and lane change alert with side blind zone alert. When additional data are available, future studies may try to separate out the effects of these systems. Table 1 shows the way in which HLDI grouped together certain collision avoidance features for the purposes of statistical analysis. For some model year, make and series combinations there may be additional features that are linked to the HLDI defined groupings.
Table 1: HLDI grouping of collision avoidance features
HLDI assignment Included features Excluded features
Forward Alerts Package forward collision alert - camera front automatic brakinglane departure warning orlane keep assist with lane departure warning
Forward Alerts/Automatic Braking Package front automatic braking
forward collision alert - camera and radarlane departure warning orlane keep assist with lane departure warningadaptive cruise control orfull-speed range adaptive cruise control
Side Alerts Package side blind zone alert orlane change alert with side blind zone alert
rear cross-traffic alertParking Alerts only rear park assist or
front and rear park assistrear-vision camera orsurround view camera
Rear-Vision Camera only rear-vision camera orsurround view camera
rear park assist orfront and rear park assist
Parking Alerts and Rear-Vision Camera rear park assist orfront and rear park assistrear-vision camera orsurround view camera
HLDI Bulletin | Vol 34, No. 6 : April 2017 5
� Method
Vehicles
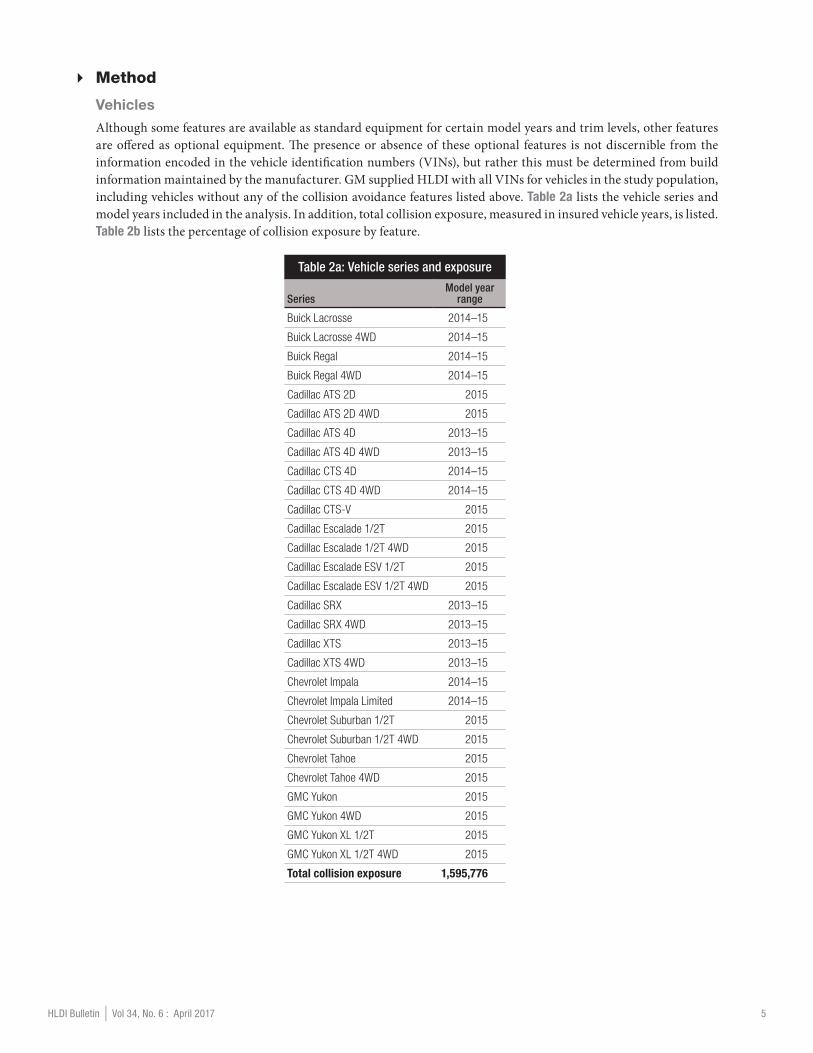
Although some features are available as standard equipment for certain model years and trim levels, other features are offered as optional equipment. The presence or absence of these optional features is not discernible from the information encoded in the vehicle identification numbers (VINs), but rather this must be determined from build information maintained by the manufacturer. GM supplied HLDI with all VINs for vehicles in the study population, including vehicles without any of the collision avoidance features listed above. Table 2a lists the vehicle series and model years included in the analysis. In addition, total collision exposure, measured in insured vehicle years, is listed. Table 2b lists the percentage of collision exposure by feature.
Table 2a: Vehicle series and exposure
SeriesModel year
range
Buick Lacrosse 2014–15
Buick Lacrosse 4WD 2014–15
Buick Regal 2014–15
Buick Regal 4WD 2014–15
Cadillac ATS 2D 2015
Cadillac ATS 2D 4WD 2015
Cadillac ATS 4D 2013–15
Cadillac ATS 4D 4WD 2013–15
Cadillac CTS 4D 2014–15
Cadillac CTS 4D 4WD 2014–15
Cadillac CTS-V 2015
Cadillac Escalade 1/2T 2015
Cadillac Escalade 1/2T 4WD 2015
Cadillac Escalade ESV 1/2T 2015
Cadillac Escalade ESV 1/2T 4WD 2015
Cadillac SRX 2013–15
Cadillac SRX 4WD 2013–15
Cadillac XTS 2013–15
Cadillac XTS 4WD 2013–15
Chevrolet Impala 2014–15
Chevrolet Impala Limited 2014–15
Chevrolet Suburban 1/2T 2015
Chevrolet Suburban 1/2T 4WD 2015
Chevrolet Tahoe 2015
Chevrolet Tahoe 4WD 2015
GMC Yukon 2015
GMC Yukon 4WD 2015
GMC Yukon XL 1/2T 2015
GMC Yukon XL 1/2T 4WD 2015
Total collision exposure 1,595,776

HLDI Bulletin | Vol 34, No. 6 : April 2017 6
Table 2b: Percent collision exposure with feature
Feature Collision exposure with feature
Forward Alerts Package 51%
Forward Alerts/Automatic Braking Package 9%
Side Alerts Package 58%
High Intensity Discharge Lights 21%
Steerable High Intensity Discharge Lights 18%
IntelliBeam Headlights 15%
Parking Alerts only 3%
Rear-vision Camera only 4%
Parking Alerts and Rear-vision Camera 81%
Automatic Parking Assist 3%
Rear Automatic Braking 4%
Insurance data
Automobile insurance covers damages to vehicles and property, as well as injuries to people involved in crashes. Different insurance coverages pay for vehicle damage versus injuries, and different coverages may apply depending on who is at fault. The current study is based on property damage liability, collision, bodily injury liability, personal injury protection, and medical payment coverages. Exposure is measured in insured vehicle years. An insured vehicle year is one vehicle insured for one year, two vehicles for six months, etc.
Because different crash avoidance features may affect different types of insurance coverage, it is important to un-derstand how coverages vary among the states and how this affects inclusion in the analyses. Collision coverage insures against vehicle damage to an at-fault driver’s vehicle sustained in a crash with an object or another vehicle; this coverage is common to all 50 states. Property damage liability (PDL) coverage insures against vehicle damage that at-fault drivers cause to other people’s vehicles and property in crashes. This coverage exists in all states except Michigan, where vehicle damage is covered on a no-fault basis (each insured vehicle pays for its own damage in a crash, regardless of who is at fault). Coverage of injuries is more complex. Bodily injury (BI) liability coverage insures against medical, hospital, and other expenses for injuries that at-fault drivers inflict on occupants of other vehicles or others on the road. Although motorists in most states may have BI coverage, this information is analyzed only in states where the at-fault driver has first obligation to pay for injuries (33 states with traditional tort insurance sys-tems). Medical payment coverage (MedPay), also sold in the 33 states with traditional tort insurance systems, covers injuries to insured drivers and the passengers in their vehicles but not injuries to people in other vehicles involved in the crash. Seventeen other states employ no-fault injury systems (Personal Injury Protection (PIP) coverage) that pay up to a specified amount for injuries to occupants of involved-insured vehicles, regardless of who is at fault in a col-lision. The District of Columbia has a hybrid insurance system for injuries and is excluded from the injury analysis.
Statistical methods
Regression analysis was used to quantify the effect of each vehicle feature while controlling for the other features and several covariates. The covariates included calendar year, model year, garaging state, vehicle density (number of registered vehicles per square mile), rated driver age group, rated driver gender, rated driver marital status, deduct-ible range (collision coverage only), and risk. Based on the model year and vehicle series, a single variable called SERIESMY was created for inclusion in the regression model. Effectively, this variable controlled for the variation caused by vehicle design changes that occur from model year to model year. For each safety feature grouping shown in Table 1, a binary variable was included to indicate the presence of that feature set.
HLDI Bulletin | Vol 34, No. 6 : April 2017 7
Claim frequency was modeled using a Poisson distribution, whereas claim severity (average loss payment per claim) was modeled using a Gamma distribution. Both models used a logarithmic link function. Estimates for overall losses were derived from the claim frequency and claim severity models. Estimates for frequency, severity, and overall losses are presented for collision and property damage liability. For PIP, BI, and MedPay three frequency estimates are pre-sented. The first frequency is the frequency for all claims, including those that already have been paid and those for which money has been set aside for possible payment in the future, known as claims with reserves. The other two fre-quencies include only paid claims separated into low- and high-severity ranges. Note that the percentage of all injury claims that were paid by the date of analysis varies by coverage: 70 percent for PIP, 61 percent for BI, and 60 percent for MedPay. The low-severity range was <$1,000 for PIP and MedPay, and <$5,000 for BI; high severity covered all loss payments greater than that.
A separate regression was performed for each insurance loss measure for a total of 15 regressions (5 coverages x 3 loss measures each). For space reasons, only the estimates for the individual crash avoidance features are shown on the following pages. To illustrate the analyses, however, Appendix A contains full model results for collision claim frequencies. To further simplify the presentation here, the exponent of the parameter estimate was calculated, 1 was subtracted, and the resultant multiplied by 100. The resulting number corresponds to the effect of the feature on that loss measure. For example, the estimate of the effect of steerable HID lights on collision claim frequency was -0.0176; thus, vehicles with the feature had 1.7 percent fewer collision claims than those with halogen lamps ((exp(-0.0176)-1)*100=-1.7).
� Results
Results for GM’s collision avoidance features are summarized in the following tables. For all tables, the lower and upper bounds represent the 95 percent confidence limits for the estimates. Estimates that are statistically significant at the 95 percent confidence level are bolded.
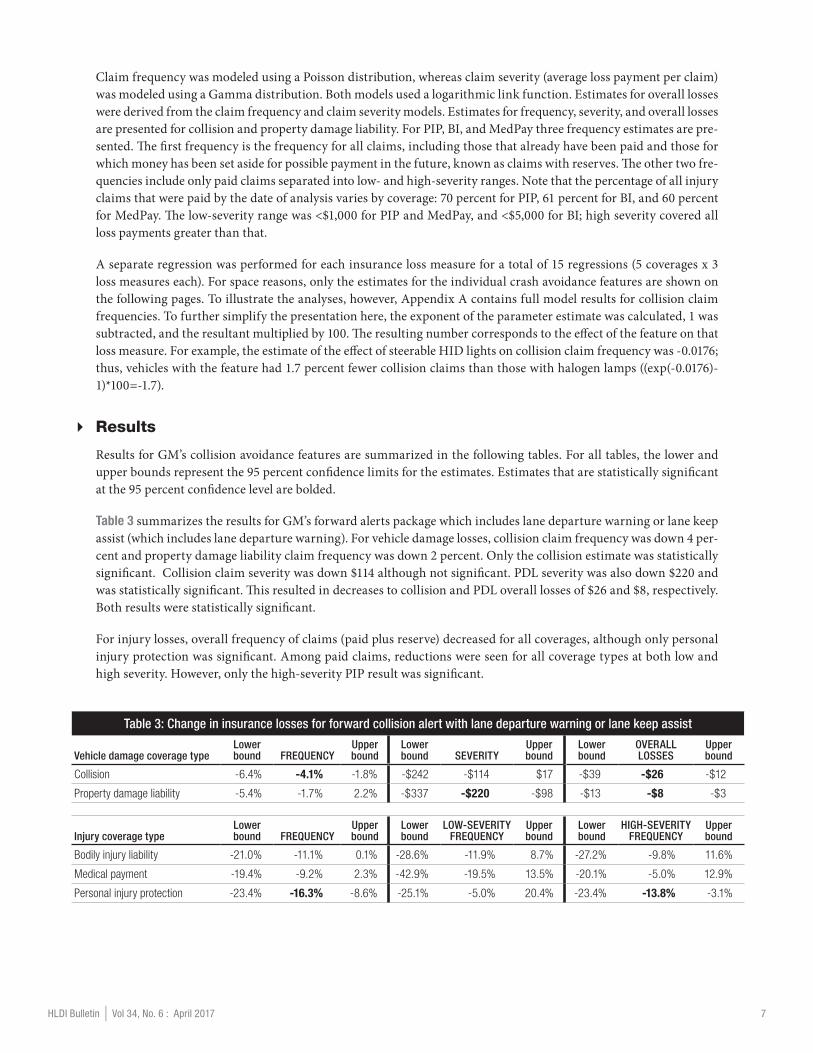
Table 3 summarizes the results for GM’s forward alerts package which includes lane departure warning or lane keep assist (which includes lane departure warning). For vehicle damage losses, collision claim frequency was down 4 per-cent and property damage liability claim frequency was down 2 percent. Only the collision estimate was statistically significant. Collision claim severity was down $114 although not significant. PDL severity was also down $220 and was statistically significant. This resulted in decreases to collision and PDL overall losses of $26 and $8, respectively. Both results were statistically significant.
For injury losses, overall frequency of claims (paid plus reserve) decreased for all coverages, although only personal injury protection was significant. Among paid claims, reductions were seen for all coverage types at both low and high severity. However, only the high-severity PIP result was significant.
Table 3: Change in insurance losses for forward collision alert with lane departure warning or lane keep assist
Vehicle damage coverage typeLower bound FREQUENCY
Upper bound
Lower bound SEVERITY
Upper bound
Lower bound
OVERALL LOSSES
Upper bound
Collision -6.4% -4.1% -1.8% -$242 -$114 $17 -$39 -$26 -$12
Property damage liability -5.4% -1.7% 2.2% -$337 -$220 -$98 -$13 -$8 -$3
Injury coverage typeLower bound FREQUENCY
Upper bound
Lower bound
LOW-SEVERITY FREQUENCY
Upper bound
Lower bound
HIGH-SEVERITY FREQUENCY
Upper bound
Bodily injury liability -21.0% -11.1% 0.1% -28.6% -11.9% 8.7% -27.2% -9.8% 11.6%
Medical payment -19.4% -9.2% 2.3% -42.9% -19.5% 13.5% -20.1% -5.0% 12.9%
Personal injury protection -23.4% -16.3% -8.6% -25.1% -5.0% 20.4% -23.4% -13.8% -3.1%
HLDI Bulletin | Vol 34, No. 6 : April 2017 8
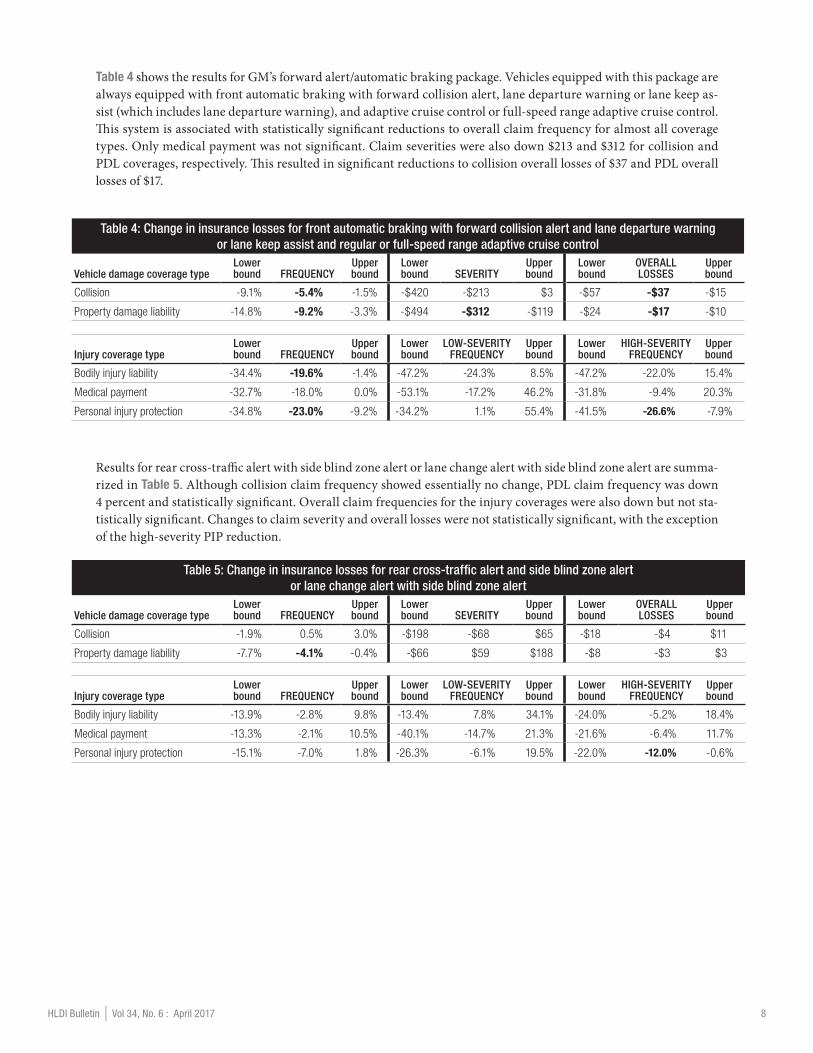
Table 4 shows the results for GM’s forward alert/automatic braking package. Vehicles equipped with this package are always equipped with front automatic braking with forward collision alert, lane departure warning or lane keep as-sist (which includes lane departure warning), and adaptive cruise control or full-speed range adaptive cruise control. This system is associated with statistically significant reductions to overall claim frequency for almost all coverage types. Only medical payment was not significant. Claim severities were also down $213 and $312 for collision and PDL coverages, respectively. This resulted in significant reductions to collision overall losses of $37 and PDL overall losses of $17.
Table 4: Change in insurance losses for front automatic braking with forward collision alert and lane departure warning or lane keep assist and regular or full-speed range adaptive cruise control
Vehicle damage coverage typeLower bound FREQUENCY
Upper bound
Lower bound SEVERITY
Upper bound
Lower bound
OVERALL LOSSES
Upper bound
Collision -9.1% -5.4% -1.5% -$420 -$213 $3 -$57 -$37 -$15
Property damage liability -14.8% -9.2% -3.3% -$494 -$312 -$119 -$24 -$17 -$10
Injury coverage typeLower bound FREQUENCY
Upper bound
Lower bound
LOW-SEVERITY FREQUENCY
Upper bound
Lower bound
HIGH-SEVERITY FREQUENCY
Upper bound
Bodily injury liability -34.4% -19.6% -1.4% -47.2% -24.3% 8.5% -47.2% -22.0% 15.4%
Medical payment -32.7% -18.0% 0.0% -53.1% -17.2% 46.2% -31.8% -9.4% 20.3%
Personal injury protection -34.8% -23.0% -9.2% -34.2% 1.1% 55.4% -41.5% -26.6% -7.9%
Results for rear cross-traffic alert with side blind zone alert or lane change alert with side blind zone alert are summa-rized in Table 5. Although collision claim frequency showed essentially no change, PDL claim frequency was down 4 percent and statistically significant. Overall claim frequencies for the injury coverages were also down but not sta-tistically significant. Changes to claim severity and overall losses were not statistically significant, with the exception of the high-severity PIP reduction.
Table 5: Change in insurance losses for rear cross-traffic alert and side blind zone alert or lane change alert with side blind zone alert
Vehicle damage coverage typeLower bound FREQUENCY
Upper bound
Lower bound SEVERITY
Upper bound
Lower bound
OVERALL LOSSES
Upper bound
Collision -1.9% 0.5% 3.0% -$198 -$68 $65 -$18 -$4 $11
Property damage liability -7.7% -4.1% -0.4% -$66 $59 $188 -$8 -$3 $3
Injury coverage typeLower bound FREQUENCY
Upper bound
Lower bound
LOW-SEVERITY FREQUENCY
Upper bound
Lower bound
HIGH-SEVERITY FREQUENCY
Upper bound
Bodily injury liability -13.9% -2.8% 9.8% -13.4% 7.8% 34.1% -24.0% -5.2% 18.4%
Medical payment -13.3% -2.1% 10.5% -40.1% -14.7% 21.3% -21.6% -6.4% 11.7%
Personal injury protection -15.1% -7.0% 1.8% -26.3% -6.1% 19.5% -22.0% -12.0% -0.6%

HLDI Bulletin | Vol 34, No. 6 : April 2017 9
Table 6 summarizes the loss results for GM’s high intensity discharge (HID) headlights. This system was associated with reductions in claim frequency for all coverage types, although not all were significant. Claim frequency reduc-tions to PDL (6 percent) and PIP (8 percent) were statistically significant. Claim frequency reductions for the other coverages were not significant. Collision claim severity increased by a significant $280, which resulted in an increase in collision overall losses of $14 (though PDL overall losses were down $4).
Table 6: Change in insurance losses for high intensity discharge lights
Vehicle damage coverage typeLower bound FREQUENCY
Upper bound
Lower bound SEVERITY
Upper bound
Lower bound
OVERALL LOSSES
Upper bound
Collision -3.9% -2.0% 0.0% $162 $280 $401 $2 $14 $26
Property damage liability -9.0% -6.0% -2.9% -$49 $60 $173 -$9 -$4 $0
Injury coverage typeLower bound FREQUENCY
Upper bound
Lower bound
LOW-SEVERITY FREQUENCY
Upper bound
Lower bound
HIGH-SEVERITY FREQUENCY
Upper bound
Bodily injury liability -13.7% -4.5% 5.6% -17.8% -1.4% 18.1% -24.5% -9.1% 9.3%
Medical payment -13.2% -4.4% 5.2% -27.0% -2.9% 29.3% -16.0% -3.4% 11.0%
Personal injury protection -15.3% -8.2% -0.5% -33.5% -17.8% 1.6% -17.0% -7.5% 3.0%
Results for the Steerable HID headlights are summarized in Table 7. Similar to the nonsteerable HID results, there was a significant 7 percent reduction in PDL claim frequency, as well as a $273 increase in collision claim severity. Overall losses were up $14 for collision but down $7 for PDL. While the other coverage types were associated with reductions in claim frequency, these estimates were not statistically significant.
Table 7: Change in insurance losses for steerable high intensity discharge lights
Vehicle damage coverage typeLower bound FREQUENCY
Upper bound
Lower bound SEVERITY
Upper bound
Lower bound
OVERALL LOSSES
Upper bound
Collision -3.9% -1.7% 0.4% $146 $273 $403 $1 $14 $28
Property damage liability -10.2% -6.8% -3.3% -$129 -$10 $114 -$12 -$7 -$2
Injury coverage typeLower bound FREQUENCY
Upper bound
Lower bound
LOW-SEVERITY FREQUENCY
Upper bound
Lower bound
HIGH-SEVERITY FREQUENCY
Upper bound
Bodily injury liability -19.1% -9.5% 1.2% -29.6% -14.0% 5.2% -28.1% -12.1% 7.5%
Medical payment -19.5% -10.3% 0.0% -28.8% -1.7% 35.6% -20.7% -7.6% 7.7%
Personal injury protection -12.5% -4.7% 3.9% -28.6% -10.1% 13.2% -14.6% -4.2% 7.4%
Results for the IntelliBeam headlights, summarized in Table 8, indicate no reductions in claim frequencies. Collision claim frequency increased by a statistically significant 4 percent, which, along with a non-significant increase to col-lision claim severity of $115, resulted in an increase to overall losses of $23.
Table 8: Change in insurance losses for IntelliBeam headlights
Vehicle damage coverage typeLower bound FREQUENCY
Upper bound
Lower bound SEVERITY
Upper bound
Lower bound
OVERALL LOSSES
Upper bound
Collision 0.3% 3.6% 6.9% -$60 $115 $297 $4 $23 $42
Property damage liability -4.7% 0.6% 6.1% -$208 -$40 $138 -$8 -$1 $7
Injury coverage typeLower bound FREQUENCY
Upper bound
Lower bound
LOW-SEVERITY FREQUENCY
Upper bound
Lower bound
HIGH-SEVERITY FREQUENCY
Upper bound
Bodily injury liability -3.4% 14.5% 35.7% -19.2% 10.2% 50.2% -15.0% 16.3% 59.1%
Medical payment -5.4% 11.4% 31.2% -36.7% 1.6% 63.1% -9.7% 14.4% 44.9%
Personal injury protection -5.3% 6.5% 19.7% -35.0% -10.6% 23.0% -12.1% 2.8% 20.3%

HLDI Bulletin | Vol 34, No. 6 : April 2017 10
Table 9 summarizes the results for vehicles equipped with parking alerts but no rear-vision camera. Collision and PDL claim frequencies were down by 4 and 8 percent, respectively. No other results were statistically significant.
Table 9: Change in insurance losses for parking alerts only
Vehicle damage coverage typeLower bound FREQUENCY
Upper bound
Lower bound SEVERITY
Upper bound
Lower bound
OVERALL LOSSES
Upper bound
Collision -8.3% -4.3% -0.2% -$166 $68 $314 -$35 -$12 $13
Property damage liability -13.9% -7.5% -0.6% -$211 $21 $270 -$15 -$7 $3
Injury coverage typeLower bound FREQUENCY
Upper bound
Lower bound
LOW-SEVERITY FREQUENCY
Upper bound
Lower bound
HIGH-SEVERITY FREQUENCY
Upper bound
Bodily injury liability -19.6% -2.0% 19.4% -33.6% -3.1% 41.2% -15.4% 18.9% 67.2%
Medical payment -22.8% -5.9% 14.7% -38.1% 4.1% 75.2% -21.1% 4.7% 38.9%
Personal injury protection -4.2% 10.3% 27.0% -32.0% 1.2% 50.5% -4.8% 14.3% 37.2%
Table 10 summarizes the results for vehicles equipped with a rear-vision parking camera but without parking alerts. Although collision claim frequency was down 2 percent, the result was not significant. MedPay claim frequency was down by a significant 18 percent. No other results were statistically significant.
Table 10: Change in insurance losses for rear-vision camera only
Vehicle damage coverage typeLower bound FREQUENCY
Upper bound
Lower bound SEVERITY
Upper bound
Lower bound
OVERALL LOSSES
Upper bound
Collision -5.3% -2.0% 1.4% -$107 $85 $285 -$20 -$1 $19
Property damage liability -5.4% 0.4% 6.5% -$338 -$157 $35 -$11 -$4 $4
Injury coverage typeLower bound FREQUENCY
Upper bound
Lower bound
LOW-SEVERITY FREQUENCY
Upper bound
Lower bound
HIGH-SEVERITY FREQUENCY
Upper bound
Bodily injury liability -18.5% -2.7% 16.0% -22.0% 6.6% 45.8% -24.2% 4.5% 44.0%
Medical payment -31.8% -18.4% -2.3% -46.3% -10.0% 51.0% -15.4% 8.6% 39.5%
Personal injury protection -6.2% 5.1% 17.7% -23.5% 2.9% 38.5% -7.6% 7.4% 25.0%
Results for vehicles that were equipped with both a rear-vision parking camera and parking alerts are contained in Table 11. Vehicles with both camera and alerts combined showed large reductions in claim frequency across all cover-age types. For physical damage, collision frequency was down 7 percent, with PDL down 17 percent. However, both collision claim severity and PDL claim severity increased by $283 and $139, respectively. Despite the severity increase, overall losses were still down by $7 for collision and $15 for PDL, although the collision result was not significant.
Overall frequency of claims (paid plus reserve) for bodily injury liability was down 14 percent, and MedPay was down 12 percent. Both results were significant. PIP claim frequency was also down by 5 percent, but this result was not sig-nificant. Among paid claims, non-significant reductions are seen for all coverage types at both low and high severity.
Table 11: Change in insurance losses for parking alerts and rear-vision cameras
Vehicle damage coverage typeLower bound FREQUENCY
Upper bound
Lower bound SEVERITY
Upper bound
Lower bound
OVERALL LOSSES
Upper bound
Collision -9.3% -7.1% -4.8% $151 $283 $418 -$21 -$7 $9
Property damage liability -19.9% -16.6% -13.2% $7 $139 $277 -$20 -$15 -$9
Injury coverage typeLower bound FREQUENCY
Upper bound
Lower bound
LOW-SEVERITY FREQUENCY
Upper bound
Lower bound
HIGH-SEVERITY FREQUENCY
Upper bound
Bodily injury liability -23.3% -14.2% -4.0% -28.2% -11.7% 8.6% -21.5% -3.7% 18.2%
Medical payment -21.5% -12.6% -2.7% -31.9% -7.9% 24.6% -23.6% -10.6% 4.7%
Personal injury protection -12.1% -4.6% 3.5% -29.4% -12.3% 9.1% -16.3% -6.7% 4.0%
HLDI Bulletin | Vol 34, No. 6 : April 2017 11
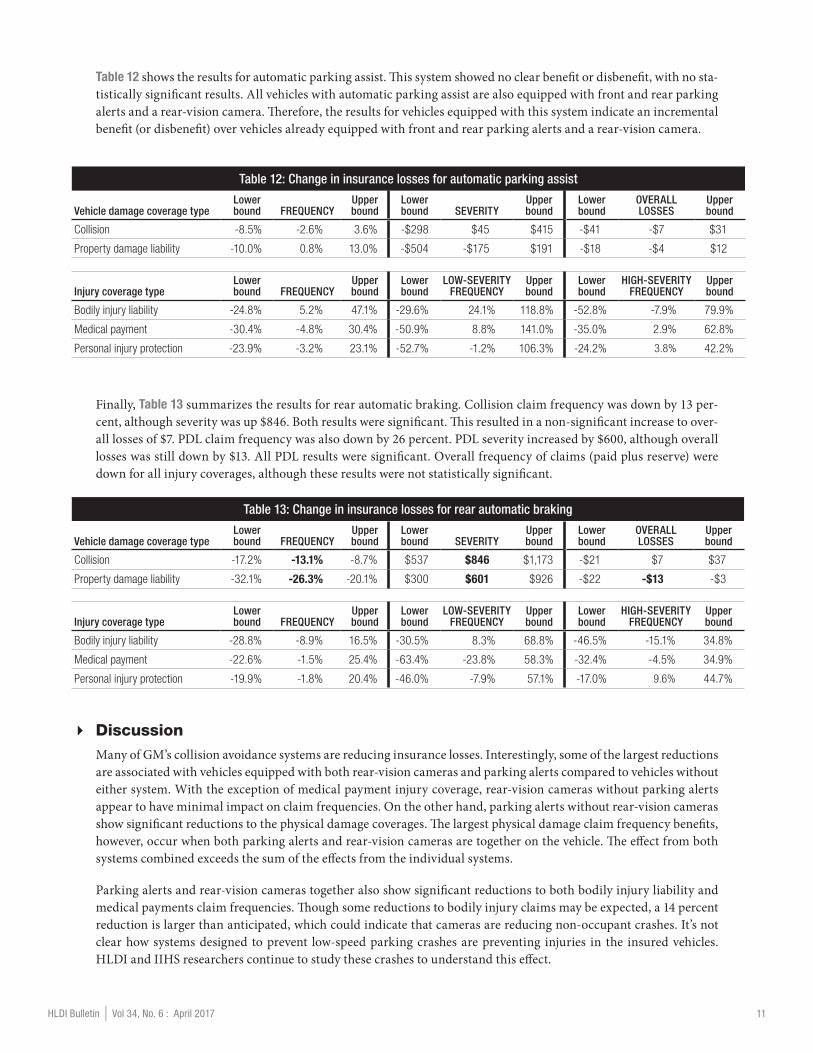
Table 12 shows the results for automatic parking assist. This system showed no clear benefit or disbenefit, with no sta-tistically significant results. All vehicles with automatic parking assist are also equipped with front and rear parking alerts and a rear-vision camera. Therefore, the results for vehicles equipped with this system indicate an incremental benefit (or disbenefit) over vehicles already equipped with front and rear parking alerts and a rear-vision camera.
Table 12: Change in insurance losses for automatic parking assist
Vehicle damage coverage typeLower bound FREQUENCY
Upper bound
Lower bound SEVERITY
Upper bound
Lower bound
OVERALL LOSSES
Upper bound
Collision -8.5% -2.6% 3.6% -$298 $45 $415 -$41 -$7 $31
Property damage liability -10.0% 0.8% 13.0% -$504 -$175 $191 -$18 -$4 $12
Injury coverage typeLower bound FREQUENCY
Upper bound
Lower bound
LOW-SEVERITY FREQUENCY
Upper bound
Lower bound
HIGH-SEVERITY FREQUENCY
Upper bound
Bodily injury liability -24.8% 5.2% 47.1% -29.6% 24.1% 118.8% -52.8% -7.9% 79.9%
Medical payment -30.4% -4.8% 30.4% -50.9% 8.8% 141.0% -35.0% 2.9% 62.8%
Personal injury protection -23.9% -3.2% 23.1% -52.7% -1.2% 106.3% -24.2% 3.8% 42.2%
Finally, Table 13 summarizes the results for rear automatic braking. Collision claim frequency was down by 13 per-cent, although severity was up $846. Both results were significant. This resulted in a non-significant increase to over-all losses of $7. PDL claim frequency was also down by 26 percent. PDL severity increased by $600, although overall losses was still down by $13. All PDL results were significant. Overall frequency of claims (paid plus reserve) were down for all injury coverages, although these results were not statistically significant.
Table 13: Change in insurance losses for rear automatic braking
Vehicle damage coverage typeLower bound FREQUENCY
Upper bound
Lower bound SEVERITY
Upper bound
Lower bound
OVERALL LOSSES
Upper bound
Collision -17.2% -13.1% -8.7% $537 $846 $1,173 -$21 $7 $37
Property damage liability -32.1% -26.3% -20.1% $300 $601 $926 -$22 -$13 -$3
Injury coverage typeLower bound FREQUENCY
Upper bound
Lower bound
LOW-SEVERITY FREQUENCY
Upper bound
Lower bound
HIGH-SEVERITY FREQUENCY
Upper bound
Bodily injury liability -28.8% -8.9% 16.5% -30.5% 8.3% 68.8% -46.5% -15.1% 34.8%
Medical payment -22.6% -1.5% 25.4% -63.4% -23.8% 58.3% -32.4% -4.5% 34.9%
Personal injury protection -19.9% -1.8% 20.4% -46.0% -7.9% 57.1% -17.0% 9.6% 44.7%
� DiscussionMany of GM’s collision avoidance systems are reducing insurance losses. Interestingly, some of the largest reductions are associated with vehicles equipped with both rear-vision cameras and parking alerts compared to vehicles without either system. With the exception of medical payment injury coverage, rear-vision cameras without parking alerts appear to have minimal impact on claim frequencies. On the other hand, parking alerts without rear-vision cameras show significant reductions to the physical damage coverages. The largest physical damage claim frequency benefits, however, occur when both parking alerts and rear-vision cameras are together on the vehicle. The effect from both systems combined exceeds the sum of the effects from the individual systems.
Parking alerts and rear-vision cameras together also show significant reductions to both bodily injury liability and medical payments claim frequencies. Though some reductions to bodily injury claims may be expected, a 14 percent reduction is larger than anticipated, which could indicate that cameras are reducing non-occupant crashes. It’s not clear how systems designed to prevent low-speed parking crashes are preventing injuries in the insured vehicles. HLDI and IIHS researchers continue to study these crashes to understand this effect.

HLDI Bulletin | Vol 34, No. 6 : April 2017 12
Rear automatic braking is another feature that is associated with large reductions to claim frequency for both colli-sion and PDL. This is one of the first times that HLDI has evaluated a system that provides automatic braking when in reverse. However, this system was only available on Cadillac vehicles also equipped with the forward alerts/automatic braking package. Consequently, the effects on insurance losses for rear automatic braking are based on differences between the same model year and series Cadillac vehicles with both front and rear automatic braking and those without either system. To separate the contribution of rear automatic braking, the statistical models derive the effect based on estimates of the forward alerts/automatic braking package from non-Cadillac vehicles without rear auto-matic braking. This inherently assumes that the effect of the forward alerts/automatic braking package is the same across all vehicles, which may not be the case. However, it should be noted, these rear automatic braking results are consistent with the strong benefits observed by IIHS for GM’s rear automatic braking system (IIHS, in press), as well as comparable reductions in both collision and PDL claim frequencies (HLDI, 2017) observed in similar analysis of Subaru’s rear automatic braking system.
Vehicles with both parking alerts and a rear-vision camera, as well as vehicles with rear automatic braking, were also associated with statistically significant increases to collision and PDL claim severity (however, with no increase in corresponding overall losses). However, such systems would primarily be expected to reduce lower severity parking crashes. The increase in average severity could be due to a shift in the severity distribution resulting from the removal of the lowest cost claims. An examination of collision and PDL claim frequency by severity range confirmed this. As shown in Figures 1 and 2, the PDL and collision claim frequency for low and mid-severity claims was much lower for vehicles with rear automatic braking and vehicles with both parking alerts and rear-vision cameras. Interestingly, high-severity PDL claim frequency also showed reductions for the alerts and camera, but the result was not signifi-cant and the size of the effect was less than half that of the low-severity PDL claim frequency.
Figure 1: Change in PDL claim frequency by severity range
Figure 2: Change in collision claim frequency by severity range
-60%
-40%
-20%
0%
20%
40%
high-severity($12,000+)
mid-severity($2,000–$11,999)
low-severity(<$2,000)
parking alerts and rear-view camera rear automatic braking
-60%-50%-40%-30%-20%-10%
0%10%20%30%40%
high-severity($7,000+)
mid-severity($1,500–$6,999)
low-severity(<$1,500)
parking alerts and rear-view camera rear automatic braking

HLDI Bulletin | Vol 34, No. 6 : April 2017 13
GM’s front crash prevention systems are also showing benefits. Somewhat puzzling, however, is that the forward alerts package (which includes forward collision alert, as well as lane departure warning or lane keep assist with lane departure warning) is not associated with a significant reduction to PDL claim frequency but is associated with reductions to injury claim frequencies. One possible explanation for these results could be the operational speed of the system. GM’s camera-based forward collision alert system activates at speeds above 25 mph. The data indicate the system appears to be mitigating higher speed crashes, if not always completely avoiding them. Consequently, a crash may still occur, generating a PDL claim but with a reduced chance of generating injury claims. An analysis of PDL claim frequency by severity range seems to support this hypothesis. Figure 3 shows that the forward alerts package is reducing the frequency of both high- and mid-severity PDL claims by 11 and 6 percent, respectively. Low-severity PDL claims frequency, however, increased by 8 percent. This may be a result of the system shifting the distribution of claims from higher to lower severities. In other words, the crashes are still occurring but at reduced speeds, lessen-ing the damage done and potential for injuries. The reductions to PDL claim severity and overall losses support this hypothesis as well.
Figure 3: Change in PDL claim frequency by severity range for forward collision alert with lane departure warning or lane keep assist
GM’s forward alerts/automatic braking package is associated with benefits across the board with statistically signifi-cant benefits found for nearly all coverages. Unlike the camera-based forward collision alert system, front automatic braking adds a radar sensor and is active at all speeds and detects the lead vehicles from a greater distance (up to 60m vs 110m). Although the front automatic braking system incorporates a front grille-mounted radar unit, there are significant reductions to collision claim severity and overall losses. The system is also associated with significant reductions to PDL claim severity and overall losses.
Consistent with evaluations of other advanced headlight systems, vehicles equipped with either HID or steerable HID lights are associated with PDL frequency reductions compared to halogen lamps. The frequency reductions are comparable for both the steerable and non-steerable HID headlights, which may be an indication that the benefit is primarily from the HID lights as opposed to steerability of the lights. This suggests that the observed benefits of HIDs are primarily restricted to straight rather than curved roads. As with HID lighting systems from other manu-facturers, these are associated with increases to collision severity and overall losses. This is likely due to the expensive nature of the HID lights, which on some vehicles can cost $400 more per lamp. The increased collision costs, however, are offset by reductions in PDL overall losses.
Results for GM’s side blind zone alert with rear cross-traffic alert system are consistent with expectations. A blind spot alert system is designed to prevent incursion into occupied adjacent lanes that would result in a multi-vehicle crashes. Likewise, a rear cross-traffic alert system is intended to prevent reversing into oncoming crossing traffic. Both scenarios would result in property damage claims against the encroaching driver, and GM’s system is associ-ated with significant reductions to PDL claim frequency. GM’s version of blind spot warning does differ from other manufacturers in a few key ways. GM’s system does not provide an audible warning, to encourage mirror usage dur-ing lane change planning and reduce driver annoyance during commonly experienced advanced signaling scenarios. Another key difference is that many systems have a minimum speed the vehicle must be traveling before the system is active. GM’s system remains active at all speeds. Further research is needed to determine how these different ap-proaches to the systems affect crashes and insurance losses.
-25%
-20%
-15%
-10%
-5%
0%
5%
10%
15%
20%
high-severity($7,000+)
mid-severity($1,500–$6,999)
low-severity(<$1,500)

HLDI Bulletin | Vol 34, No. 6 : April 2017 14
Both GM’s IntelliBeam and automatic parking assist systems were not associated with any significant benefits. How-ever, it is unclear how often people may be using these systems and if the relevant crash situations produce enough claims for any potential benefit due to these systems to currently be detectable with the available exposure.
� Next Steps
This is HLDI’s first collision avoidance analysis involving large SUVs, such as the Suburban and Yukon XL. It is possible that the effectiveness of a collision avoidance technology may be different for a sedan than for a large SUV. Based on the available data and series-level feature dependencies, the current analysis is limited to assuming a com-mon effect for the collision avoidance features. However, as the data continue to mature, future research may be able to provide more detailed estimates on whether the effectiveness of these systems varies by vehicle type or series.
� Limitations
There are limitations to the data used in this analysis. At the time of a crash, the status of a feature is not known. The features in this study can be deactivated by the driver, and there is no way to know how many of the drivers in these vehicles turned off a system prior to the crash. However, surveys conducted by the Insurance Institute for Highway Safety (Reagan et al., 2017) indicate that large majorities of drivers with these types of systems leave them on, with the notable exception of lane assist systems (also see Flannagan et al., 2016). If a significant number of drivers do turn these features off, any reported reductions may actually be underestimates of the true effectiveness of these systems.
Additionally, the data supplied to HLDI do not include detailed crash information, such as that available in police reports. Information on point of impact and the vehicle’s transmission status is not available. The technologies in this report target certain crash types. For example, the backup camera is designed to prevent collisions when a vehicle is backing up. All collisions, regardless of the ability of a feature to mitigate or prevent the crash, are included in the analysis.
Many of these features are optional or tied to higher trim levels and are associated with increased costs. The type of person who selects these options or trim levels may be different from the person who declines them. While the analysis controls for several driver characteristics, there may be other uncontrolled attributes among people who select these features.
References
Flannagan, C., LeBlanc, D., Bogard, S., Kazutoshi, N., Narayanaswamy, P., Leslie, A, Kiefer, R., Marchione, M., Beck, C., and Lobes, K. 2016. Large-scale field test of forward collision alert and lane departure warning systems (Publication No. DOT HS 812 247). Washington, DC: National Highway Traffic Safety Administration.
Highway Loss Data Institute. 2011. Buick collision avoidance features: initial results. Loss Bulletin Vol. 28. No. 22. Arlington, VA.
Highway Loss Data Institute. 2016. Buick collision avoidance features: an update. Loss Bulletin Vol. 33, No. 18. Arlington, VA.
Highway Loss Data Institute. 2017. 2013-16 Subaru collision avoidance features. Loss Bulletin Vol. 34, No. 10. Ar-lington, VA.
Reagan, I.J., Cicchino, J.B., Kerfoot, L.B., and Weast, R.A. 2017. Crash avoidance and driver assistance technologies - are they used? Arlington, VA: Insurance Institute for Highway Safety.

HLDI Bulletin | Vol 34, No. 6 : April 2017 15
� Appendix A
Appendix A: Illustrative regression results — collision frequency
Parameter
Degrees of
freedom Estimate EffectStandard
errorWald 95%
confidence limitsChi-
square P-value
Intercept 1 -8.1936 0.0263 -8.2453 -8.1420 96697.30 <0.0001
Calendar year 2012 1 -0.4366 -35.4% 0.0665 -0.5670 -0.3062 43.08 <0.0001
2013 1 -0.0995 -9.5% 0.0157 -0.1302 -0.0687 40.24 <0.0001
2014 1 -0.0445 -4.4% 0.0088 -0.0617 -0.0273 25.66 <0.0001
2016 1 -0.0523 -5.1% 0.0065 -0.0651 -0.0395 64.29 <0.0001
2015 0 0 0 0 0 0Vehicle model year and series 2015 Cadillac ATS 2D 1 -0.2600 -22.9% 0.0755 -0.4080 -0.1121 11.87 0.0006
2015 Cadillac ATS 2D 4WD 1 -0.0090 -0.9% 0.0753 -0.1566 0.1386 0.01 0.9050
2013 Cadillac ATS 1 -0.0282 -2.8% 0.0259 -0.0790 0.0227 1.18 0.2778
2014 Cadillac ATS 1 -0.0142 -1.4% 0.0278 -0.0687 0.0402 0.26 0.6086
2015 Cadillac ATS 1 0.0600 6.2% 0.0389 -0.0162 0.1362 2.38 0.1225
2013 Cadillac ATS 4WD 1 0.0484 5.0% 0.0291 -0.0086 0.1055 2.77 0.0961
2014 Cadillac ATS 4WD 1 -0.0456 -4.5% 0.0308 -0.1060 0.0149 2.18 0.1396
2015 Cadillac ATS 4WD 1 -0.0067 -0.7% 0.0468 -0.0985 0.0851 0.02 0.8856
2014 Cadillac CTS 1 -0.0595 -5.8% 0.0351 -0.1283 0.0093 2.87 0.0902
2015 Cadillac CTS 1 -0.0244 -2.4% 0.0537 -0.1296 0.0808 0.21 0.6497
2014 Cadillac CTS 4WD 1 0.0371 3.8% 0.0352 -0.0319 0.1060 1.11 0.2920
2015 Cadillac CTS 4WD 1 0.0529 5.4% 0.0550 -0.0550 0.1608 0.92 0.3365
2015 Cadillac CTS-V 1 0.0027 0.3% 0.1352 -0.2623 0.2678 0.00 0.9839
2015 Cadillac Escalade 1/2T 1 -0.1644 -15.2% 0.0496 -0.2616 -0.0672 10.98 0.00092015 Cadillac Escalade 1/2T 4WD 1 -0.2084 -18.8% 0.0383 -0.2835 -0.1334 29.62 <0.0001
2015 Cadillac Escalade ESV 1/2T 1 -0.1883 -17.2% 0.0717 -0.3288 -0.0479 6.91 0.00862015 Cadillac Escalade ESV 1/2T 4WD 1 -0.0793 -7.6% 0.0439 -0.1653 0.0068 3.26 0.0710
2014 Chevy Impala 1 -0.0432 -4.2% 0.0223 -0.0868 0.0005 3.76 0.0526
2015 Chevy Impala 1 -0.0226 -2.2% 0.0244 -0.0705 0.0252 0.86 0.3540
2014 Chevy Impala Limited 1 -0.0828 -7.9% 0.0275 -0.1367 -0.0289 9.06 0.0026
2015 Chevy Impala Limited 1 -0.0851 -8.2% 0.0450 -0.1733 0.0031 3.58 0.0585
2014 Buick Lacrosse 1 -0.0323 -3.2% 0.0254 -0.0819 0.0174 1.62 0.2033
2015 Buick Lacrosse 1 -0.0563 -5.5% 0.0289 -0.1129 0.0004 3.79 0.0515
2014 Buick Lacrosse 4WD 1 -0.0281 -2.8% 0.0568 -0.1394 0.0832 0.24 0.6209
2015 Buick Lacrosse 4WD 1 -0.0829 -8.0% 0.0796 -0.2389 0.0731 1.08 0.2978
2014 Buick Regal 4WD 1 -0.1066 -10.1% 0.0556 -0.2155 0.0023 3.68 0.0551
2015 Buick Regal 4WD 1 -0.1763 -16.2% 0.0843 -0.3415 -0.0112 4.38 0.0364
2014 Buick Regal 1 -0.1578 -14.6% 0.0314 -0.2193 -0.0964 25.33 <0.0001
2015 Buick Regal 1 -0.1896 -17.3% 0.0369 -0.2619 -0.1172 26.38 <0.0001
2013 Cadillac SRX 1 -0.0762 -7.3% 0.0253 -0.1259 -0.0266 9.05 0.0026
2014 Cadillac SRX 1 -0.0993 -9.5% 0.0279 -0.1540 -0.0446 12.65 0.0004
2015 Cadillac SRX 1 -0.0825 -7.9% 0.0296 -0.1406 -0.0243 7.74 0.0054
2013 Cadillac SRX 4WD 1 -0.0687 -6.6% 0.0290 -0.1256 -0.0118 5.60 0.0179
2014 Cadillac SRX 4WD 1 -0.0754 -7.3% 0.0318 -0.1378 -0.0130 5.61 0.0179

HLDI Bulletin | Vol 34, No. 6 : April 2017 16
Appendix A: Illustrative regression results — collision frequency
Parameter
Degrees of
freedom Estimate EffectStandard
errorWald 95%
confidence limitsChi-
square P-value
2015 Cadillac SRX 4WD 1 -0.0592 -5.7% 0.0350 -0.1278 0.0095 2.86 0.0910
2015 Chevy Suburban 1/2T 1 -0.0770 -7.4% 0.0316 -0.1389 -0.0150 5.93 0.0149
2015 Chevy Suburban 1/2T 4WD 1 -0.0272 -2.7% 0.0267 -0.0796 0.0252 1.04 0.3088
2015 Chevy Tahoe 1 -0.2563 -22.6% 0.0263 -0.3078 -0.2049 95.22 <0.0001
2015 Chevy Tahoe 4WD 1 -0.1846 -16.9% 0.0247 -0.2329 -0.1363 56.03 <0.0001
2013 Cadillac XTS 1 -0.0103 -1.0% 0.0259 -0.0611 0.0405 0.16 0.6910
2014 Cadillac XTS 1 0.0067 0.7% 0.0405 -0.0727 0.0860 0.03 0.8689
2015 Cadillac XTS 1 -0.0029 -0.3% 0.0543 -0.1094 0.1036 0.00 0.9575
2013 Cadillac XTS 4WD 1 0.0048 0.5% 0.0308 -0.0556 0.0652 0.02 0.8767
2014 Cadillac XTS 4WD 1 0.0087 0.9% 0.0393 -0.0684 0.0857 0.05 0.8258
2015 Cadillac XTS 4WD 1 -0.1255 -11.8% 0.0742 -0.2710 0.0199 2.86 0.0908
2015 GMC Yukon 1 -0.2476 -21.9% 0.0317 -0.3096 -0.1855 61.15 <0.0001
2015 GMC Yukon 4WD 1 -0.2428 -21.6% 0.0273 -0.2962 -0.1893 79.21 <0.0001
2015 GMC Yukon XL 1/2T 1 -0.0921 -8.8% 0.0374 -0.1654 -0.0187 6.05 0.0139
2015 GMC Yukon XL 1/2T 4WD 0 0 0 0 0 0
Rated driver age group 14–24 1 0.1350 14.5% 0.0176 0.1005 0.1695 58.88 <0.0001
25–29 1 0.1958 21.6% 0.0149 0.1666 0.2249 173.07 <0.0001
30–39 1 0.0754 7.8% 0.0105 0.0548 0.0960 51.43 <0.0001
50–59 1 -0.1384 -12.9% 0.0105 -0.1590 -0.1178 174.09 <0.0001
60–64 1 -0.1371 -12.8% 0.0126 -0.1618 -0.1125 118.91 <0.0001
65–69 1 -0.1055 -10.0% 0.0122 -0.1293 -0.0816 75.15 <0.0001
70+ 1 0.0403 4.1% 0.0101 0.0205 0.0601 15.91 <0.0001
Unknown 1 -0.0944 -9.0% 0.0147 -0.1231 -0.0657 41.50 <0.0001
40–49 0 0 0 0 0 0
Rated driver gender Male 1 -0.0281 -2.8% 0.0064 -0.0406 -0.0156 19.56 <0.0001
Unknown 1 -0.0151 -1.5% 0.0259 -0.0658 0.0357 0.34 0.5608
Female 0 0 0 0 0 0Rated driver marital status Single 1 0.2150 24.0% 0.0071 0.2011 0.2289 917.92 <0.0001
Unknown 1 0.0413 4.2% 0.0249 -0.0075 0.0900 2.75 0.0973
Married 0 0 0 0 0 0
Risk Nonstandard 1 0.2953 34.4% 0.0138 0.2683 0.3223 458.42 <0.0001
Standard 0 0 0 0 0 0
State Alabama 1 0.0204 2.1% 0.0259 -0.0303 0.0711 0.62 0.4308
Alaska 1 0.1123 11.9% 0.0935 -0.0710 0.2955 1.44 0.2298
Arizona 1 0.0937 9.8% 0.023 0.0485 0.1388 16.54 <0.0001
Arkansas 1 0.0861 9.0% 0.0307 0.0260 0.1462 7.88 0.0050
California 1 0.2366 26.7% 0.0138 0.2095 0.2637 293.07 <0.0001
Colorado 1 0.0839 8.8% 0.0285 0.0280 0.1398 8.66 0.0032
Connecticut 1 -0.1035 -9.8% 0.0338 -0.1698 -0.0373 9.38 0.0022
Delaware 1 -0.0518 -5.0% 0.0489 -0.1476 0.0441 1.12 0.2900
Dist of Columbia 1 0.5988 82.0% 0.0598 0.4816 0.7160 100.28 <0.0001
Florida 1 -0.1058 -10.0% 0.0128 -0.1308 -0.0807 68.22 <0.0001
Georgia 1 -0.0433 -4.2% 0.019 -0.0806 -0.0061 5.19 0.0227

HLDI Bulletin | Vol 34, No. 6 : April 2017 17
Appendix A: Illustrative regression results — collision frequency
Parameter
Degrees of
freedom Estimate EffectStandard
errorWald 95%
confidence limitsChi-
square P-value
Hawaii 1 0.3341 39.7% 0.0713 0.1944 0.4738 21.97 <0.0001
Idaho 1 -0.0826 -7.9% 0.0637 -0.2075 0.0423 1.68 0.1952
Illinois 1 -0.0159 -1.6% 0.0152 -0.0458 0.0139 1.09 0.2957
Indiana 1 -0.0764 -7.4% 0.023 -0.1215 -0.0314 11.04 0.0009
Iowa 1 -0.1805 -16.5% 0.0325 -0.2442 -0.1167 30.80 <0.0001
Kansas 1 -0.0606 -5.9% 0.0342 -0.1277 0.0065 3.13 0.0769
Kentucky 1 -0.1127 -10.7% 0.031 -0.1734 -0.0519 13.21 0.0003
Louisiana 1 0.1835 20.1% 0.0193 0.1456 0.2213 90.18 <0.0001
Maine 1 -0.0031 -0.3% 0.0765 -0.1531 0.1469 0.00 0.9681
Maryland 1 0.1125 11.9% 0.0227 0.0681 0.1570 24.61 <0.0001
Massachusetts 1 -0.0666 -6.4% 0.0318 -0.1289 -0.0044 4.40 0.0360
Michigan 1 0.2756 31.7% 0.0139 0.2484 0.3029 392.49 <0.0001
Minnesota 1 -0.2115 -19.1% 0.0252 -0.2609 -0.1621 70.49 <0.0001
Mississippi 1 0.0674 7.0% 0.0314 0.0058 0.1290 4.60 0.0319
Missouri 1 -0.0627 -6.1% 0.023 -0.1078 -0.0176 7.43 0.0064
Montana 1 0.0021 0.2% 0.0638 -0.1229 0.1271 0.00 0.9741
Nebraska 1 -0.1469 -13.7% 0.0407 -0.2266 -0.0672 13.06 0.0003
Nevada 1 0.0566 5.8% 0.0335 -0.0092 0.1223 2.85 0.0916
New Hampshire 1 0.1835 20.1% 0.0533 0.0791 0.2880 11.86 0.0006
New Jersey 1 -0.0981 -9.3% 0.0187 -0.1348 -0.0614 27.43 <0.0001
New Mexico 1 -0.0181 -1.8% 0.0436 -0.1036 0.0674 0.17 0.6783
New York 1 0.0218 2.2% 0.0147 -0.0070 0.0506 2.20 0.1381
North Carolina 1 -0.2165 -19.5% 0.0216 -0.2588 -0.1742 100.64 <0.0001
North Dakota 1 0.0434 4.4% 0.0566 -0.0676 0.1544 0.59 0.4434
Ohio 1 -0.1486 -13.8% 0.0173 -0.1824 -0.1147 73.82 <0.0001
Oklahoma 1 -0.0240 -2.4% 0.0276 -0.0780 0.0300 0.76 0.3834
Oregon 1 -0.0748 -7.2% 0.0439 -0.1608 0.0111 2.91 0.0880
Pennsylvania 1 0.1084 11.4% 0.0159 0.0773 0.1395 46.56 <0.0001
Rhode Island 1 0.0814 8.5% 0.0578 -0.0320 0.1947 1.98 0.1594
South Carolina 1 -0.0932 -8.9% 0.0262 -0.1447 -0.0418 12.62 0.0004
South Dakota 1 -0.1552 -14.4% 0.0619 -0.2765 -0.0340 6.30 0.0121
Tennessee 1 0.0057 0.6% 0.0229 -0.0391 0.0506 0.06 0.8019
Utah 1 -0.1767 -16.2% 0.0462 -0.2672 -0.0862 14.64 0.0001
Vermont 1 0.1024 10.8% 0.0927 -0.0794 0.2841 1.22 0.2696
Virginia 1 -0.0153 -1.5% 0.0218 -0.0581 0.0275 0.49 0.4837
Washington 1 -0.0313 -3.1% 0.03 -0.0901 0.0275 1.09 0.2961
West Virginia 1 -0.2426 -21.5% 0.0462 -0.3332 -0.152 27.54 <0.0001
Wisconsin 1 -0.0726 -7.0% 0.0245 -0.1206 -0.0245 8.75 0.0031
Wyoming 1 -0.0288 -2.8% 0.0718 -0.1695 0.1118 0.16 0.6878
Texas 0 0 0 0 0 0
Deductible range 0–250 1 0.1516 16.4% 0.007 0.1379 0.1653 472.27 <0.0001
501–1,000 1 -0.2773 -24.2% 0.0088 -0.2945 -0.2602 999.78 <0.0001
1,001+ 1 -0.7442 -52.5% 0.0524 -0.8469 -0.6415 201.75 <0.0001
251–500 0 0 0 0 0 0

The Highway Loss Data Institute is a nonprofit public service organization that gathers, processes, and publishes insurance data on the human and economic losses associated with owning and operating motor vehicles.DW201704 NB RUN 534
COPYRIGHTED DOCUMENT, DISTRIBUTION RESTRICTED © 2017 by the Highway Loss Data Institute. All rights reserved. Distribu-tion of this report is restricted. No part of this publication may be reproduced, or stored in a retrieval system, or transmitted, in any form or by any means, electronic, mechanical, photocopying, recording, or otherwise, without the prior written permission of the copyright owner. Possession of this publication does not confer the right to print, reprint, publish, copy, sell, file, or use this material in any manner without the written permission of the copyright owner. Permission is hereby granted to companies that are supporters of the Highway Loss Data Institute to reprint, copy, or otherwise use this material for their own business purposes, provided that the copyright notice is clearly visible on the material.
1005 N. Glebe Road, Suite 700
Arlington, VA 22201
+1 703 247 1600
iihs-hldi.org
Highway Loss Data Institute
Appendix A: Illustrative regression results — collision frequency
Parameter
Degrees of
freedom Estimate EffectStandard
errorWald 95%
confidence limitsChi-
square P-valueRegistered vehicle density 0–99 1 -0.3255 -27.8% 0.0094 -0.3440 -0.3071 1198.38 <0.0001
100–499 1 -0.1925 -17.5% 0.0071 -0.2064 -0.1786 737.52 <0.0001
500+ 0 0 0 0 0 0
Rear-vision Camera only 1 -0.0201 -2.0% 0.0176 -0.0545 0.0144 1.30 0.2534
Parking Alerts and Rear-vision Camera 1 -0.0734 -7.1% 0.0121 -0.0971 -0.0497 36.84 <0.0001
Parking Alerts only 1 -0.0443 -4.3% 0.0216 -0.0866 -0.0021 4.22 0.0399
Automatic Park Assist 1 -0.0268 -2.6% 0.0317 -0.0889 0.0352 0.72 0.3968
Side Alerts Package 1 0.0048 0.5% 0.0124 -0.0194 0.0291 0.15 0.6962
Rear Automatic Braking 1 -0.1399 -13.1% 0.0249 -0.1887 -0.0910 31.51 <0.0001
Forward Alerts Package 1 -0.0423 -4.1% 0.0122 -0.0661 -0.0184 12.09 0.0005
IntelliBeam Headlights 1 0.0350 3.6% 0.0162 0.0033 0.0668 4.68 0.0306
Front Automatic Braking 1 -0.0553 -5.4% 0.0204 -0.0953 -0.0152 7.32 0.0068
HID Headlights 1 -0.0197 -2.0% 0.0103 -0.0400 0.0005 3.66 0.0557
Steerable HID Headlights 1 -0.0176 -1.7% 0.0112 -0.0396 0.0043 2.47 0.1160