general journal of experimental psychology · jennifer e. dannals and dale t. miller, ... this...
TRANSCRIPT

Journal of Experimental Psychology:GeneralSocial Norm Perception in Groups With OutliersJennifer E. Dannals and Dale T. MillerOnline First Publication, July 6, 2017. http://dx.doi.org/10.1037/xge0000336
CITATIONDannals, J. E., & Miller, D. T. (2017, July 6). Social Norm Perception in Groups With Outliers. Journalof Experimental Psychology: General. Advance online publication.http://dx.doi.org/10.1037/xge0000336

Social Norm Perception in Groups With Outliers
Jennifer E. Dannals and Dale T. MillerStanford University: Graduate School of Business
Social outliers draw a lot of attention from those inside and outside their group and yet little is knownabout their impact on perceptions of their group as a whole. The present studies examine how outliersinfluence observers’ summary perceptions of a group’s behavior and inferences about the group’sdescriptive and prescriptive norms. Across 4 studies (N � 1,718) we examine how observers perceivedescriptive and prescriptive social norms in groups containing outliers of varying degrees. We findconsistent evidence that observers overweight outlying behavior when judging the descriptive andprescriptive norms, but overweight outliers less as they become more extreme, especially in perceptionsof the prescriptive norm. We find this pattern across norms pertaining to punctuality (Studies 1–2 and 4)and clothing formality (Study 3) and for outliers who are both prescriptively and descriptively deviant(e.g., late arrivers), as well as for outliers who are only descriptive deviants (e.g., early arrivers). Wefurther demonstrate that observers’ perceptions of the group shift in the direction of moderate outliers.This occurs because observers anchor on the outlier’s behavior and adjust their recollections ofnonoutlying individuals, making their inferences about the group’s average behavior more extreme.
Keywords: group perception, social norms, outliers, biases
Supplemental materials: http://dx.doi.org/10.1037/xge0000336.supp
Every village has its idiot. Every class has its clown. Society’srepresentations of groups frequently classify a majority as “nor-mal” and a small minority as deviants or social outliers. Becauseindividuals tend to pay more attention to extremes than common-alities (Berger, 2011), outliers are a notable part of one’s dailyexperience. They attract our attention, highlighted apart from therest as moral do-gooders (Monin, Sawyer, & Marquez, 2008) orbad apples (Felps, Mitchell, & Byington, 2006), feeding watercooler gossip with what they wear (Bellezza, Gino, & Keinan,2014), how they act (Van Kleef, Homan, Finkenauer, Gündemir, &Stamkou, 2011), and what they achieve (Whyte, 1955).
People frequently envision outliers as individuals who “marchto the beat of their own drum”—freestanding social structures set
apart from a group or society. As a consequence, when researchexamines outliers, it tends to look at them in isolation (Kunda &Oleson, 1997) or in contrast to other group members (Marques,Yzerbyt, & Leyens, 1988). But outliers do not exist in isolation.Rather, outliers are statistically deviant parts of a group or cate-gory. And yet, little research examines how our perception of thegroup as a whole might change when the group contains an outlier.Furthermore, what little research has focused on outliers offersconflicting accounts of how individuals incorporate outliers intotheir perceptions of the group, with some research suggesting thatperceivers are likely to be influenced by outliers because of theirsalience (Tversky & Kahneman, 1974), and other research sug-gesting that perceivers are likely to ignore outliers because they arederogated or subtyped (Marques et al., 1988).
In this article, we focus on how an outlier in a small group caninfluence observers’ perceptions of group norms—the range oftypical or appropriate group behavior and opinions. We adopt thisfocus on social norm perception for three reasons. First, previousresearch suggests that individuals tend to learn descriptive norms,what people typically do in a situation, by observing the behaviorof those in their social network, making social norm perception areasonable context for examining how outliers might affect groupperception (Kashima, Wilson, Lusher, Pearson, & Pearson, 2013).Second, much of the research on the appraisal of outliers byobservers defines outliers in relation to social norms (Bellezza etal., 2014; Marques et al., 1988; Van Kleef et al., 2011). Third,though research has recognized that social norms exert a powerfulforce on individual behavior (Miller & Prentice, 2016; Paluck,Shepherd, & Aronow, 2016), little research examines how indi-viduals infer a group’s social norm from the distribution of itsmembers’ behavior (Tankard & Paluck, 2016). By adopting thisfocus on social norm perception, we hope to offer insight into the
Jennifer E. Dannals and Dale T. Miller, Department of OrganizationalBehavior, Stanford University: Graduate School of Business.
We thank the audiences of the Society for Personality and SocialPsychology, the Society for Judgment and Decision Making, the Interdis-ciplinary Network for Group Researchers, the Behavioral Decision Re-search in Management Conference, and the Transatlantic Doctoral Con-sortium for their comments and feedback on earlier versions of this work.We are also grateful to Lindred Greer for feedback on an earlier version ofthis work, and to Taylor Philips, Sean Malahy, Julian Zlatev, Nir Halevy,Max Weisbuch, and our anonymous reviewers for excellent comments andadvice. We further thank Michelle Peretz, Schinria Islam, Ryan Dwyer,Lauren Agnew, Christine Hart, Anna Barker, Aakash Gupta, Julian Zlatev,Joshua Morris, Alex Depaoli, Arthur Jago, Nathaniel Nakashima, JacobModel, Sean Malahy, and Tony Vashevko for lending their visages to studystimuli.
Correspondence concerning this article should be addressed to JenniferE. Dannals, department of Organizational Behavior, Stanford University:Graduate School of Business, 655 Knight Way, Stanford, CA 94305.E-mail: [email protected]
Thi
sdo
cum
ent
isco
pyri
ghte
dby
the
Am
eric
anPs
ycho
logi
cal
Ass
ocia
tion
oron
eof
itsal
lied
publ
ishe
rs.
Thi
sar
ticle
isin
tend
edso
lely
for
the
pers
onal
use
ofth
ein
divi
dual
user
and
isno
tto
bedi
ssem
inat
edbr
oadl
y.
Journal of Experimental Psychology: General © 2017 American Psychological Association2017, Vol. 1, No. 2, 000 0096-3445/17/$12.00 http://dx.doi.org/10.1037/xge0000336
1

cognitive processes that underlie social norm perception in smallgroups or teams.
In the service of clarity, consider the following situation as aprototypical example of the context for our investigation. Imaginethat Lily has just been hired by a small company and wants to fitin with her new coworkers. On her first day, she observes howothers on the team behave in order to find out what is within therange of acceptability. We propose that when individuals, likeLily, observe a distribution of group behavior without outliers,they will more or less accurately perceive the average behavior andthe social norm. However, because individuals are attentive toextremes, we suggest that when individuals view a distribution ofgroup behavior containing an outlier, they may be influenced bythe outlying behavior when summarizing the distribution of groupbehavior and thus overweight1 it. We further propose that individ-uals will distinguish between outliers based on their extremity,being more influenced by moderate outliers than extreme outliers.In the remaining sections of the introduction, we elaborate on eachof these claims in turn.
Perceiving Groups
Lily’s task on her first day can be simplified as perceiving andsummarizing a distribution of behavior. Assessing whether herjudgments of the group norm accurately reflect behavior requiresa normative benchmark. The most conservative benchmark forassessing the impact of an outlier in a descriptive norm is 1/N,proportional influence.2 To the degree that individuals perceive thedistribution of behavior (the mean, median, or mode) as more inline with the outlying behavior, they are overweighting (beingoverinfluenced by) the outlier’s behavior in their representation ofthe group. For example, Lily would be overweighting a casuallydressed outlier in a room full of suit-wearers to the extent sheinferred the group to be more casually dressed than they actuallywere. When examining prescriptive norms, what most individualsin a group judge to be appropriate or acceptable, a similar bench-mark applies. In a situation in which the majority enact BehaviorA and only an outlier enacts Behavior B, we will consider observ-ers’ judgments of acceptability or appropriateness to overweightoutliers to the extent that these judgments shift away from Behav-ior A in the direction of Behavior B more than is proportional, thatis, 1/N.
Research suggests that individuals are adept at judging theaverage behavior of a group and thus may also be adept atperceiving descriptive social norms. Previous research in ensemblecoding or summary perception suggests that individuals possess aremarkable ability to encode accurately and rapidly sets (ensem-bles) of stimuli (Alvarez, 2011; Whitney, Haberman, & Sweeny,2014). This is true of basic visual stimuli such as item size (Ariely,2001; Chong & Treisman, 2003), orientation (Alvarez & Oliva,2009; Dakin & Watt, 1997), speed (Watamaniuk & Duchon,1992), and location (Alvarez & Oliva, 2008). It is also true ofsocial stimuli such as the emotion (Haberman & Whitney, 2009),gender (Haberman & Whitney, 2007) and identity of a group offaces (de Fockert & Wolfenstein, 2009), as well as the direction ofa moving crowd (Sweeny, Haroz, & Whitney, 2013). Research onensemble coding has consistently shown that the visual systemrapidly and automatically encodes summary statistics of a set ofobserved stimuli, even when recollections of the individual pieces
of stimuli is far less accurate (Whitney et al., 2014). Researchfurther suggests that after individuals view a series of numbers,they can accurately judge the probability of numbers from thesame distribution occurring in the future (Goldstein & Rothschild,2014).
Though research on ensemble coding generally focuses on stim-uli most commonly used in the fields of vision and cognitiveneuroscience, we suggest that people will display similar adeptnesswhen summarizing the behavior of individuals in small groups.Social norm perception likely requires more time and consciousfocus than the perception of visual ensembles (see the GeneralDiscussion for a greater examination of differences), but the firststage of norm perception likely depends on our ability to quicklysurvey an array of stimuli and infer features of its distribution.Supporting this conjecture, research suggests that people can guesswith fair accuracy the distribution of their peers’ attitudes on avariety of issues as well as how frequently they engage in a varietyof behaviors (Nisbett & Kunda, 1985). Collectively, this researchsuggests that individuals are generally capable of accurately sum-marizing group behavior.
Overweighting Outliers in Perceptions of theDescriptive Norm
We hypothesize that individuals are likely to be less accuratewhen summarizing group behavior if the group contains an outlier,because outliers grab attention, which leads them to be over-weighted in perceptions of group norms. According to the avail-ability heuristic, when individuals are uncertain how often some-thing occurs, they search their recollections for related occurrencesand use the ease of recall to infer the actual frequency (Tversky &Kahneman, 1974). The availability heuristic, or the related anchor-ing and adjustment heuristic (Tversky & Kahneman, 1974), canthus lead one salient exemplar to influence the perception thelarger group or category. The use of these heuristics when recallinga distribution of behavior across a group that includes outliers maylead to a similar error in which outliers influence the perception ofthe group by distorting perceptions of other group members.
Imagine that after her first day of work, Lily tries to recall whenmost people arrived in the morning in order to plan her arrival thenext day. Using saliency or ease of recall as a cue to reconstruct thedistribution, she can be expected to better remember an individualwho arrived earlier than the others in the group because of thisperson’s unique behavior. Because of this, she may believe thatpeople generally arrived earlier in the day than they in fact did and,thus, that the average time of arrival for the group is earlier than it
1 The term overweight is used to describe the outcome—recollections ofthe group will be more influenced by the outlier’s behavior than by thebehavior of a nonoutlying behavior—rather than the process.
2 Questions inquiring about the descriptive norm frequently ask what“most” peers do or ask participants to bracket common behavior in theirpeer group (Cialdini, Reno, & Kallgren, 1990; Prentice & Miller, 1993). Asthese questions indicate, the descriptive norm corresponds to a sense of thecentral tendency of the group. An accurate representation of the descriptivenorm thus requires participants to accurately represent the distribution ofbehavior in the group and to correctly determine how the majority ofindividuals or how an average individual behaves (Bicchieri, 2006). Themean is the most sensitive to outlier presence and thus the most conser-vative benchmark to test for overweighting because it already gives themost weight to the outlier (see Study 1 stimuli).
Thi
sdo
cum
ent
isco
pyri
ghte
dby
the
Am
eric
anPs
ycho
logi
cal
Ass
ocia
tion
oron
eof
itsal
lied
publ
ishe
rs.
Thi
sar
ticle
isin
tend
edso
lely
for
the
pers
onal
use
ofth
ein
divi
dual
user
and
isno
tto
bedi
ssem
inat
edbr
oadl
y.
2 DANNALS AND MILLER

was. This suggests that outliers may be overweighted in groupperceptions because they bias recollection of normally behavinggroup members, making the whole group appear slightly moreextreme. We therefore hypothesize the following:
Hypothesis 1 (H1): Individuals will overweight outliers intheir inferences of the descriptive norm of a small group.
Weighting of Moderate Versus Extreme Outliers inDescriptive Norms
A central question in the present research is whether outliers ofvarying extremity have similar or different impacts on perceptionsof group descriptive norms. We use the terms “moderate” and“extreme” outliers to refer to individuals whose behavior differs inextremity but not in the kind. The two types of outliers we consideronly differ in how deviant their behavior is in relation to othergroup members or to perceivers’ expectations.
Research suggests a number of reasons why extreme outliersmay have less impact on small group perception than more mod-erate outliers. First, consider the finding that individuals dislikeand derogate deviant in-group members because they perceivedeviant group members to be a threat to group cohesion andidentity (Marques et al., 1988). When assessing the group norm,then, Lily might give less weight to the behavior of an extremeoutlier than to that of a more moderate outlier because of heranticipation that the rest of the group is likely either to temper thebehavior of the extreme outlier or to exclude them from the group.
Another reason why extreme outliers may influence group per-ception less than more moderate outliers derives from the catego-rization process. First, individuals tend to be more influenced bymoderate, plausible numerical anchors than by more extreme, values(Chapman & Johnson, 1994). In addition, though individuals willincorporate moderate counterstereotypical exemplars into their stereo-types, they tend to ignore or subcategorize more extreme counterst-ereotypical exemplars because they wish to maintain the strength oftheir stereotype (Kunda & Oleson, 1997). In addition, research onattitude change suggests that moderately extreme attitudes aremore persuasive than those that are either more extreme or moretempered (Sherif & Hovland, 1961). Based on these findings, onemight expect perceivers to be more likely to subcategorize anextreme than a moderate outlier (i.e., assume they are drawn froma different distribution), leading extreme outliers to have lessinfluence on group perceptions. In fact, Haberman and Whitney(2010) found that individuals automatically discount or ignoreextremely sad faces when summarizing a group of mostly happyemotional expressions, suggesting that even on a visual level,individuals selectively construct social categories based on ex-tremity. As these diverse cases all suggest, individuals tend toaccord less weight to extreme relative to more moderate behaviorin their summary judgments. We therefore hypothesize the follow-ing:
Hypothesis 2 (H2): Individuals will give relatively less weightto extreme outliers compared with moderate outliers in theirinferences of the descriptive norm of a small group.
Inferring Prescriptive Norms in Groups With Outliers
Thus far, we have discussed how outliers affect the generalperception of small group behavior. However, representations of
small group norms take two different forms. The first, the focus ofour discussion so far, is the descriptive norm—observers’ repre-sentations of what individuals do. The second is the prescriptive orinjunctive norm—observers’ representations of what behavior isacceptable or appropriate (Eriksson, Strimling, & Coultas, 2015;Miller & Prentice, 2016). Though one cannot, with certainty, infera prescriptive norm from descriptive behavior alone (Bicchieri,2006), many behaviors have transituational prescriptive relevance,such that when individuals enter a new situation, they know thatcertain behaviors or attitudes will hold prescriptive importance(Kahneman & Miller, 1986). For example, when entering a newworkplace, individuals might expect observed dress formality orpunctuality to hold prescriptive relevance.
The relationship between perceptions of what members of agroup do and what they think is appropriate may well depend onthe presence and extremity of an outlier. For example, imagineLily observes a coworker who arrives 15 min later than hercolleagues versus one who arrives 30 min later than her colleagues.Because prescriptive norms represent not simply what is done butwhat is appropriate, they often are derived from a more stringentevaluation of a distribution of behavior. Although all behavior ina group is descriptively relevant, only some of it may be viewed asprescriptively acceptable. For example, as outliers become moreextreme, they may be discounted more in the assessment of theprescriptive than the descriptive norm. The coworker arriving 15min late may be viewed as a deviant group member but not as soextreme as to be entirely prescriptively irrelevant. The employeearriving 30 min late, on the other hand, may be more likely to beconsidered prescriptively irrelevant by Lily and other group mem-bers because their behavior seems beyond the pale of acceptability.We therefore hypothesize the following:
Hypothesis 3 (H3): Individuals will overweight outliers intheir inferences of the prescriptive norm of a small group.
Hypothesis 4 (H4): Individuals will give less weight to ex-treme outliers compared with moderate outliers in inferencesof the prescriptive norm. Moreover, this effect will be strongerin individuals’ perceptions of the prescriptive than the descrip-tive norm.
Current Research
In this article, we report four studies that test the previouslystated four hypotheses. In Study 1, we report results from aparadigm that examines perceptions of the appropriate time ofarrival for group members. Using a numeric norm such as arrivaltime allows us to compare participants’ perceptions of the distri-bution of group arrival times with the actual distribution of arrivaltimes. In Study 2, we strengthen our findings by ruling out thepossibility that the impact of extreme behavior in Study 1 was dueto participants interpreting outliers as evidence of there being nogroup norm. We do this by showing that groups with a singleoutlier are seen differently than groups with comparably highvariance but no outlier. In Study 3, we extend our findings usinga different norm and a modified paradigm focusing on the appro-priate style of dress in a new group. In Study 4, we return to thenorm of punctuality and examine how individuals update theirperceptions of the norm following a second day’s observation.Across the four studies, we find strong support for our hypotheses.
Thi
sdo
cum
ent
isco
pyri
ghte
dby
the
Am
eric
anPs
ycho
logi
cal
Ass
ocia
tion
oron
eof
itsal
lied
publ
ishe
rs.
Thi
sar
ticle
isin
tend
edso
lely
for
the
pers
onal
use
ofth
ein
divi
dual
user
and
isno
tto
bedi
ssem
inat
edbr
oadl
y.
3OUTLIERS IN GROUPS
Individuals’ perceptions of groups are accurate when the groupscontain no outliers but are systematically distorted when they do.Specifically, observers tend to overweight outlying behavior butdo so less as the behavior becomes more extreme, particularly injudgments of prescriptive norms.
Study 1
In Study 1, we examine how observers infer a group normpertaining to punctuality. By varying the distribution of arrivaltimes, our stimuli vary the presence and extremity of the outlier inthe group but keep the mean arrival times in the groups identicalacross all conditions. This permits the use of the statistical averageof the stimuli as the normative benchmark to aid in evaluating therelative effect of outliers. In addition, by using punctuality asthe norm, we can distinguish between descriptive outliers whosebehavior is prescriptively congruent, arriving earlier than ex-pected, and those whose behavior is prescriptively incongruent(deviant), arriving later than expected. This permits the test of ourhypotheses for outliers who deviate in both directions from thegroup norm (Morrison & Miller, 2008).3
Method
Participants. Six hundred sixty-eight participants were re-cruited from Amazon’s Mechanical Turk. In line with Simonsohn(2014), we sought here, and across all subsequent studies, torecruit at least 75 participants per cell, in order to power each studycommensurate with our interest in the phenomenon, given that thetrue effect size was unknown. Participants who did not pass ourvideo attention check (entering a code; n � 9) or who indicateddifficulty playing the video (asked directly; n � 12) were removedfrom analyses, resulting in a final sample of 647 (56.4% women,median age � 30, SD � 10.18). All analyses reported are per-formed on this pruned sample of participants but are similar tothose performed on the full sample of participants. In all studiesreported here, we report all measures, conditions, data exclusions,and the reasoning behind the sample size used.
Procedure and measures. All participants watched a video,lasting 1 min 32 s, showing eight individuals walking through adoor (see times for each condition in Table 1). On the page, abovethe video, participants read the following description:
You will now watch a video of a work team arriving in the morning.Team members arrive at a variety of times, each displayed at thebottom of the video as the team member arrives. As you watch, pleasethink about when a new member of this team would think it wasappropriate to arrive.
The time of arrival for each individual was displayed in digitalformat as a repeated moving ticker across the bottom of the screen.The distribution of times in the video was manipulated to eitherhave or not have one outlier, though the mean time of arrival forthe group remained constant. We chose to use a video rather thansimply displaying a table of times in order to enhance verisimili-tude and better mimic the cognitive pressures and processes at playwhen participants observe a real small group. A timer on the pagerequired individuals to remain on the page for a minimum of 1 min30 s.
Once they finished watching the video, participants completedthe attention check described above and then completed an innoc-
uous word search as a distractor task for 3 min. This task was usedto approximate the cognitive load participants would be under in amore naturalistic environment in which they might be performingdaily tasks while interacting with the target group. After complet-ing the task, participants completed the dependent measures in arandomized order.
Perceived group behavior. Participants were asked to indicatetheir recollection of the arrival time of each of the group members(eight items, one per individual in the group).4
Descriptive norm. These eight items serve as our measure ofthe descriptive norm. For each condition, we held the averagearrival time of the group stimuli constant. Thus, the average ofparticipants’ perceived arrival times should not differ across con-ditions, unless outliers distort these perceptions as we hypothesize.
Accuracy. We also used responses to the eight items men-tioned above to measure the accuracy of participant recall of thegroup members’ individual arrival times in the video. To do this,we first collapsed5 across early and late outliers by multiplying allresponses from the early outlier conditions by �1. We then sub-tracted the objective arrival time for each arrival in the video fromparticipants’ responses. Positive values thus represented the tar-get’s arrival time being judged closer than it was to that of theoutlier; negative values represented the target’s arrival time beingjudged more distant than it was from the outlier. A value of zerorepresented perfect accuracy.
Prescriptive norm. Participants were asked to indicate therange of times in which most (defined for participants as �50%)of the group (a) would feel comfortable arriving, (b) would thinkit acceptable to arrive, and (c) would think it was appropriate toarrive, with the order of question randomized. Each of thesestatements was accompanied by two items that focused on thelower and upper bounds of the range. Participants were given aslider from 7:30 a.m. to 8:45 a.m. to indicate each response. Theseitems created a six-item measure of the prescriptive norm (� �.71).
Results
Because the objective average time of arrival was constantacross all conditions (8:10 a.m.), we centered all dependent vari-ables on 8:10 a.m., so that negative values reflected earlier recol-lections (i.e., �2 represented 2 min early) and positive valuesreflected later recollections (i.e., �2 represented 2 min late).Participants offered generally meaningful values, given that 0reflected the average arrival time of the video and thus the nor-matively accurate answer (for descriptive statistics by condition,see the online supplemental materials).
3 We assume, for the purposes of this article, that the global prescriptivenorm for punctuality dictates that being earlier is more acceptable thanbeing late. Popular sayings such as “If you’re on time, you’re already late”reinforce this perspective.
4 Participants were also asked to indicate when most of the group tendedto arrive in the morning. They did this by responding to two items focusingon the lower (“The earliest most members would arrive is . . .”) and upper(“The latest most members arrive is . . .”) bounds of the range. Participantswere given a slider from 7:30 to 8:45 to indicate each response. Allanalyses remain the same when these responses are averaged with therecollection of the arrival time of the full distribution.
5 Before doing this, we first checked to verify that early and late outliersdid not have different effects (see the online supplemental materials).
Thi
sdo
cum
ent
isco
pyri
ghte
dby
the
Am
eric
anPs
ycho
logi
cal
Ass
ocia
tion
oron
eof
itsal
lied
publ
ishe
rs.
Thi
sar
ticle
isin
tend
edso
lely
for
the
pers
onal
use
ofth
ein
divi
dual
user
and
isno
tto
bedi
ssem
inat
edbr
oadl
y.
4 DANNALS AND MILLER

In all of our analyses, the independent variable—the extremityof the outlier—is operationalized as the number of minutes early orlate relative to the next closest arrival (e.g., 14 min later resultedin �14).6
H1: Overweighting outliers in descriptive norm judgments.We first examined our hypothesis (H1) that outliers would beoverweighted in perceptions of the descriptive norm. We reasonedthat if participants were overweighting outliers, the distribution ofarrival times reported would be biased in the direction of theoutlier (recall that the average time of arrival was objectively equalacross conditions). Because each participant in the study offeredtheir recollection for each of the eight group members separately,we model this as a multilevel model using a random effect term forparticipant ID in a mixed model fitted using lme4 (Bates,Maechler, Bolker, & Walker, 2014) and lmerTest (Kuznetsova,Brockhoff, & Christensen, 2015) in R statistics software.
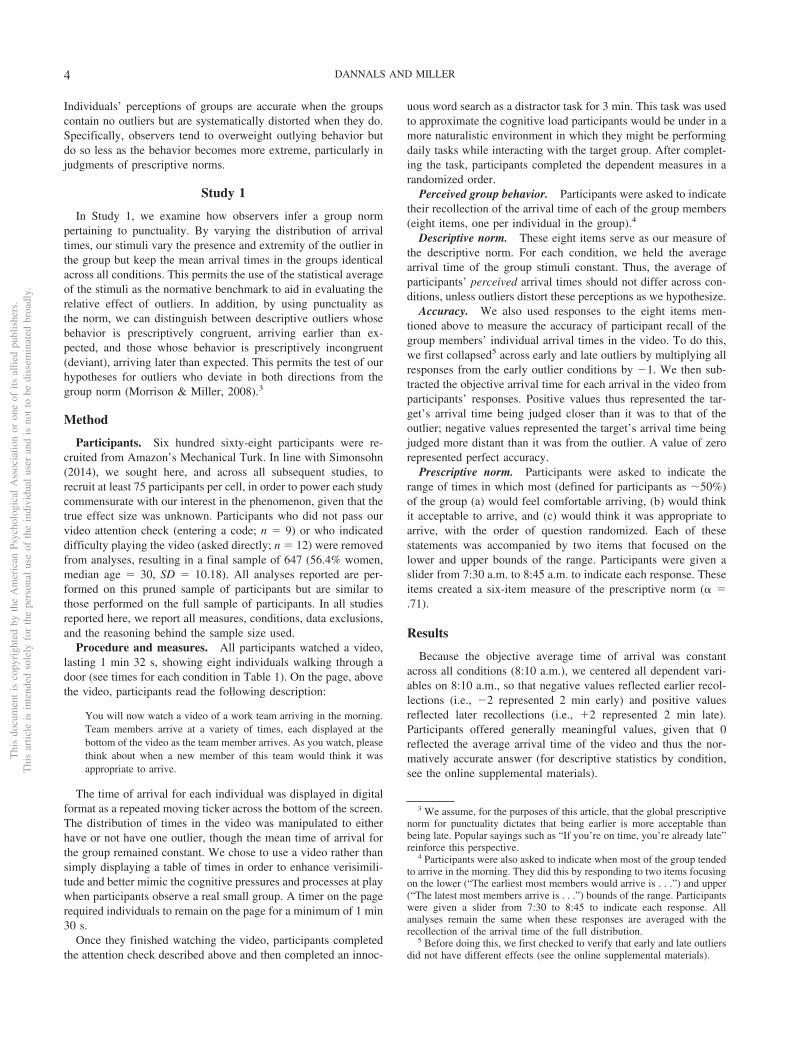
Do individuals overweight outliers in descriptive norms? Wefound a significant linear pattern, such that perceptions of thedescriptive norm were pulled in the direction of the outlier (b �0.04, SE � 0.01), t(644) � 5.57, p � .001 (see Figure 1, Panel A).This suggests a pattern of overweighting in which the presence ofa late outlier led participants to recall the distribution of arrivaltimes as later than it was, and the presence of an early outlier ledparticipants to recall the distribution as earlier than it was.
Are recollections of nonoutlying group members shifted to-ward the outlier? If, as hypothesized (H1), outliers would beoverweighted because their saliency would distort recollections ofnonoutlying group members, we would expect recollections ofthose closest to the outlier to be the most distorted. To test whetherarrivals closest to the outlier, in conditions with an outlier, weremost inaccurately recalled, we ran a mixed-effects multilevelmodel using an interaction of outlier extremity and a dummy-coded value of 1 to 7 for each of the seven arrivals (7 being closestto the outlier in time) to predict participant accuracy in recallingthe time of arrival for the seven nonoutlying group members.
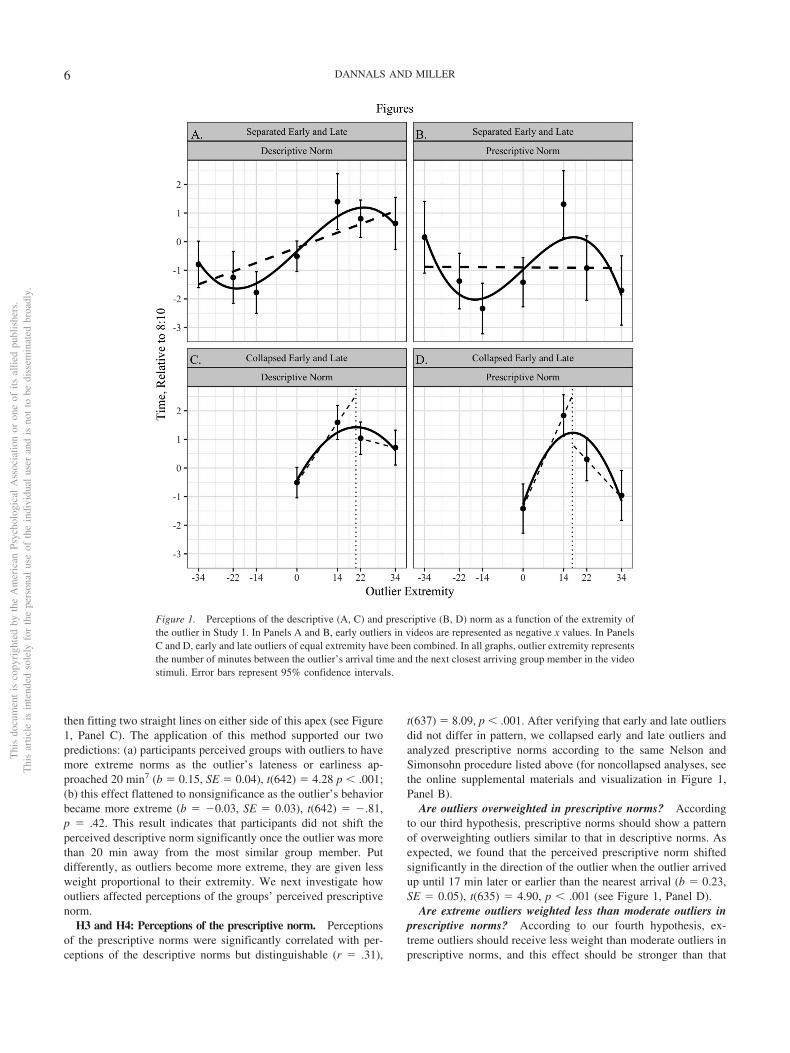
We found that participants were significantly less accurate inrecalling the arrival time of the group members the closer theyarrived to the outlier’s arrival time and the more extreme theoutlier’s arrival (b � 0.02, SE � 0.003), t(3874) � 6.086, p � .001(see Figure 2). In other words, participants recalled the group
members arriving closer to the outlier than they actually had in thevideo. In the most extreme case, this resulted in participantsrecalling the group member who was closest to the outlier inarrival time as arriving nearly 6 min closer to the outlier’s arrivaltime than had been shown in the video. Thus, the participant’sperception of the descriptive norm overweighted the outlier’sbehavior because they perceived the behavior of other groupmembers as more similar to the outlier’s behavior than they were.
H2: Weighting of extreme and moderate outliers in descrip-tive norms. Our second hypothesis stated that overweighting ofoutliers in descriptive norms would be moderated by the extremityof the outlier, with moderate outliers being overweighted morethan extreme outliers. To test this hypothesis, we returned to thelinear model described above and added two additional terms, onequadratic and one cubic, to capture curvilinear weighting of out-liers. We reasoned that if extreme early and late outliers weregiven relatively less weight than moderate early and late outliers,we should find a significant cubic effect.
We found that the linear pattern of overweighting was qualifiedby a significant cubic curvilinear effect (to model one curve forearly and one curve for late outliers), such that extreme outliersshifted the descriptive norm comparatively less than moderateoutliers (b � �41.00, SE � 11.01), t(642) � �3.72, p � .001 (seeFigure 1, Panel A), thus confirming H2.
Because we found no significant differences in participant re-sponses to early versus late outliers (see the online supplementalmaterials), we verified this pattern by collapsing early and lateoutliers—multiplying early responses by �1 (see collapsed meansand standard deviations in the online supplemental materials)—and using a method recommended by Nelson and Simonsohn(2014) for testing curvilinear effects. This method calls for fittinga quadratic regression line, identifying the apex of the curve, and
6 These analyses remain the same if the independent variable is treatedas a factor (see the online supplemental materials).
7 This number, and the 17 min of the prescriptive norms analysis, shouldbe interpreted with caution. Though it is the apex of the quadratic regres-sion line in this analysis, the specific number found is a function of theparadigm used here and thus is less generalizable than the broader notionof curvilinearity.
Table 1Arrival Times in Each of the Seven Stimuli Videos in Study 1
Stimulistatistics Early outlier videos Control Late outlier videos
7:37 7:47 7:54 8:04 8:04 8:03 8:018:11 8:09 8:08 8:05 8:05 8:04 8:038:11 8:11 8:10 8:08 8:05 8:04 8:048:13 8:11 8:10 8:10 8:08 8:07 8:048:16 8:13 8:12 8:10 8:10 8:09 8:078:16 8:16 8:15 8:12 8:10 8:09 8:098:17 8:16 8:15 8:15 8:12 8:11 8:098:19 8:17 8:16 8:16 8:26 8:33 8:43
Mean 8:10 8:10 8:10 8:10 8:10 8:10 8:10Mode 8:11/8:16 8:11/8:16 8:10/8:15 8:10 8:10/8:05 8:04/8:09 8:04/8:09Median 8:14.5 8:12 8:11 8:10 8:09 8:08 8:05.5
Note. Each column contains the arrival times for one video shown in Study 1. The outlier in each video isbolded.
Thi
sdo
cum
ent
isco
pyri
ghte
dby
the
Am
eric
anPs
ycho
logi
cal
Ass
ocia
tion
oron
eof
itsal
lied
publ
ishe
rs.
Thi
sar
ticle
isin
tend
edso
lely
for
the
pers
onal
use
ofth
ein
divi
dual
user
and
isno
tto
bedi
ssem
inat
edbr
oadl
y.
5OUTLIERS IN GROUPS
then fitting two straight lines on either side of this apex (see Figure1, Panel C). The application of this method supported our twopredictions: (a) participants perceived groups with outliers to havemore extreme norms as the outlier’s lateness or earliness ap-proached 20 min7 (b � 0.15, SE � 0.04), t(642) � 4.28 p � .001;(b) this effect flattened to nonsignificance as the outlier’s behaviorbecame more extreme (b � �0.03, SE � 0.03), t(642) � �.81,p � .42. This result indicates that participants did not shift theperceived descriptive norm significantly once the outlier was morethan 20 min away from the most similar group member. Putdifferently, as outliers become more extreme, they are given lessweight proportional to their extremity. We next investigate howoutliers affected perceptions of the groups’ perceived prescriptivenorm.
H3 and H4: Perceptions of the prescriptive norm. Perceptionsof the prescriptive norms were significantly correlated with per-ceptions of the descriptive norms but distinguishable (r � .31),
t(637) � 8.09, p � .001. After verifying that early and late outliersdid not differ in pattern, we collapsed early and late outliers andanalyzed prescriptive norms according to the same Nelson andSimonsohn procedure listed above (for noncollapsed analyses, seethe online supplemental materials and visualization in Figure 1,Panel B).
Are outliers overweighted in prescriptive norms? Accordingto our third hypothesis, prescriptive norms should show a patternof overweighting outliers similar to that in descriptive norms. Asexpected, we found that the perceived prescriptive norm shiftedsignificantly in the direction of the outlier when the outlier arrivedup until 17 min later or earlier than the nearest arrival (b � 0.23,SE � 0.05), t(635) � 4.90, p � .001 (see Figure 1, Panel D).
Are extreme outliers weighted less than moderate outliers inprescriptive norms? According to our fourth hypothesis, ex-treme outliers should receive less weight than moderate outliers inprescriptive norms, and this effect should be stronger than that
Figure 1. Perceptions of the descriptive (A, C) and prescriptive (B, D) norm as a function of the extremity ofthe outlier in Study 1. In Panels A and B, early outliers in videos are represented as negative x values. In PanelsC and D, early and late outliers of equal extremity have been combined. In all graphs, outlier extremity representsthe number of minutes between the outlier’s arrival time and the next closest arriving group member in the videostimuli. Error bars represent 95% confidence intervals.
Thi
sdo
cum
ent
isco
pyri
ghte
dby
the
Am
eric
anPs
ycho
logi
cal
Ass
ocia
tion
oron
eof
itsal
lied
publ
ishe
rs.
Thi
sar
ticle
isin
tend
edso
lely
for
the
pers
onal
use
ofth
ein
divi
dual
user
and
isno
tto
bedi
ssem
inat
edbr
oadl
y.
6 DANNALS AND MILLER
observed in descriptive norms. When the outlier arrived more than17 min, compared with less than 17 min, away from the nearestarrival they had significantly less impact on prescriptive normperceptions, (b � �0.11, SE � 0.05), t(635) � �2.32, p � .021(see Figure 1, Panel D). Extreme outliers were thus given lessweight that moderate outliers in judgments of the prescriptivenorm.
We then compared the coefficient of this effect with the non-significant decrease found in descriptive norms. The attenuatedoverweighting was marginally stronger in prescriptive than de-scriptive norms (z � 1.83, p � .067). This suggests that, aspredicted, the curvilinear pattern was stronger for prescriptivenorms than descriptive norms, indicating that extreme outliersreceive less weight in prescriptive than descriptive norms.
Exploratory analysis of accuracy in outlier recall. In addi-tion to tests of our hypotheses, we performed an exploratoryanalysis to determine how accurately individuals recalled the out-lier’s time of arrival. We used a linear regression to compare howaccurately participants remembered the last arrival in the controlcondition video with outlier’s arrival in the other conditions. Wefound that individuals were less accurate in recalling the finalindividual’s time in the outlier conditions than in the control videoand became less accurate as the outlier became more extreme.Closer inspection revealed that participants’ inaccuracy in theperception of outliers was due to their significant underestimationof the outlier’s extremity (b � �0.15, SE � 0.03),t(644) � �5.47, p � .001. Individuals recalled the outlier’s arrivaltime as significantly less extreme than it was.
Discussion
In Study 1, participants perceived the descriptive and prescrip-tive norm to be a few minutes later than the actual group averagewhen observing a group with a late outlier and a few minutes
earlier when observing a group with an early outlier. Even whenseven of the eight group members arrive early, participants in thelate outlier condition report it acceptable and appropriate to arrivelater, and vice versa for the early outlier conditions. Importantly,these effects occurred despite the fact that the average time ofarrival across conditions for the observed group remained thesame, 8:10 a.m., as did the central tendencies (i.e., median, mode)of the arrival time distribution.
Further examination of participants’ perception of the distribu-tion of arrival times offered insight into how participants wereinfluenced by the outlier. Participants’ perceptions of the socialnorm shifted in part because they perceived group members arriv-ing at the times most proximal the outlier as more proximal to theoutlier than they were. Participants remembered the team membersclosest to the outlier as arriving roughly 5 min closer to the outlierthan they in fact did in. Though the video shows group membersmost proximate to the outliers as arriving between 8:08 and 8:12across the different conditions, participants recall them arrivingcloser to 8:15 to 8:17 in the late outlier condition and closer to 8:03to 8:05 in the early outlier condition. This pattern suggests that theextremity of the outlier’s behavior may function as a cognitiveanchor, leading participants to implicitly adjust the arrival time ofindividuals proximal to the outlier. It is important to note that thisshift in recollections happened both when the outlier was moderateand when the outlier was more extreme. When the outlier arrived34 min later than the closest group member, the latter was stillrecalled as arriving roughly 6 min later than they actually did, asimilar magnitude to the shift when the outlier was 22 or 14 minlate. This suggests that outliers of all extremity can function as acognitive anchor, though the effect of this anchor does not increaseas extremity increases.
Extreme outliers did not function similarly to moderate out-liers in all aspects. As hypothesized (H4), we found that par-ticipants gave less weight to the extreme outlier than the mod-erate outlier when perceiving the prescriptive norm.Participants judged it less acceptable to arrive late when therewas an extremely late outlier than when there was a moderatelylate outlier, and less acceptable to arrive early when there wasan extremely early outlier than when the outlier was moderatelyearly. In fact, participants perceived no difference between theprescriptive norms of groups with extreme outliers and groupswith no outlier at all.
How might extreme outliers be viewed differently than moder-ate outliers? Here, the insight provided by Study 1 is limited.Exploratory analyses suggest that participants tend to underesti-mate the extremity of the outlier, but this may be because theyexpect the group to punish the outlier and bring them more in linewith the group or because they expect the outlier to regress to themean because the outlying behavior was a fluke. In addition, whencombined with overestimating the extremity of the normal groupmembers, this could alternatively suggest that participants tend tomake the group more homogenous when recounting the arrivaltimes, by moving the outlier and the other closest arrivals closertogether in arrival time. This pattern is similar to those observedwhen individuals’ ensemble code highly variable groups of dots(Burr & Ross, 2008) or chaotic moving crowds (Sweeny et al.,2013), or to the finding that perceptions of individual recollectionscan be biased by the average of a set (Brady & Alvarez, 2011). We
Figure 2. Accuracy of recall for each group member (excluding theoutlier) as a function of the extremity of the outlier and the order of arrival.Zero on the y-axis reflects accurate recall; positive values reflect inaccu-racy in the direction of the outlier, and negative values reflect inaccuraterecall away from the outlier. Early and late outliers are collapsed based onoutlier extremity. The lines graphed are lines of best fit based on amixed-model multilevel model predicting accuracy from an interaction ofoutlier extremity and a dummy code for arrival order.
Thi
sdo
cum
ent
isco
pyri
ghte
dby
the
Am
eric
anPs
ycho
logi
cal
Ass
ocia
tion
oron
eof
itsal
lied
publ
ishe
rs.
Thi
sar
ticle
isin
tend
edso
lely
for
the
pers
onal
use
ofth
ein
divi
dual
user
and
isno
tto
bedi
ssem
inat
edbr
oadl
y.
7OUTLIERS IN GROUPS

return to the question of how extreme versus moderate outliersmay be perceived differently in Study 3.
Study 2
The procedure of Study 1 was designed to ensure that the centraltendency of group arrival times across conditions was equivalent;however, the statistical variance of the distribution did vary.Though the variance of the core group of seven nonextremearrivals is similar across conditions, the variance of the full groupof eight arrivals varies because the outlier’s arrival time varies inextremity across conditions. In Study 2, we disentangle variancefrom the presence of an outlier. This helps to control for the effectof variance in group behavior, which might suggest to perceiversthat the norm regarding punctuality is “looser” in groups withextreme than moderate outliers (Gelfand et al., 2011).
We address this possibility in Study 2 by showing participantsone of two videos that varied in whether they included an outlierbut were equivalent in the variance depicted in group behavior.Following the viewing of the video, participants were asked howlikely it was that a new late arriver would be punished by thegroup. Willingness to punish deviant group members functions asa proxy for the strength of the perceived prescriptive norm withinthe group (Brauer & Chaurand, 2010). By examining if anticipatedpunishment for a future late group member varies across condi-tions, we can test if the presence of an outlier, by increasing groupvariance, conveys a weak social norm. This tests a fifth hypothesis:
Hypothesis 5 (H5): Small groups containing an outlier willhave stronger social norms than small groups with no outlierbut equivalent variance in group behavior.
Method
Participants. Participants were recruited from Amazon’s Me-chanical Turk to complete the survey. The same manipulationchecks employed in Study 1 were used to ensure that the videostimuli were transmitted effectively. Two hundred two participantscompleted the survey; seven were removed due to failing theattention checks. In addition, due to an error in the survey, thetimer that served to ensure participants did not advance untilthe duration time of the video had elapsed did not function. Wepruned those who advanced before the video could have concluded(90 s) as well as those who spent more than three median absolutedeviations (168.76 s) on the survey page, resulting in 29 people cutand a final sample size of 166 participants (93 women, medianage � 30.5, SD � 9.96). The results remain similar when theserestrictions are not applied.
Procedure and measures. Participants were randomly as-signed to one of two conditions. In the outlier condition, partici-pants viewed the same video that Study 1 used to depict anextreme late outlier, wherein the outlier arrives 22 min after thenext closest arrival. In the general variance condition, participantsviewed a group arriving with no outlier but generally high variancein arrival time (see Table 2 for the specific arrival times for eachobserved group member). The general variance video was de-signed to depict statistical variance that matched as closely aspossible that in the outlier video. After they had finished watchingthe video, participants read the following:
Imagine Sam is a new member of the group you saw in the video. Samtends to arrive around 8:25 a.m. Given what you saw about this team,what are the chances that the following things would happen?
Participants next completed the dependent measures, whichfocused on perceptions of the strength of the norm in the groupobserved. We chose to focus on the perceived strength of theprescriptive norm rather than its content because prior research hasestablished that high variance in behavior leads to perceptions of aweak social norm. Participants answered a total of five questionsthat formed a scale to assess their perception of the strength of theprescriptive norm in the video (� � .90). Participants indicated thepercent chance (from 0 to 100) that group members (a) would beannoyed at Sam, (b) would complain about Sam in private, (c)would complain to a superior about Sam’s behavior and, further,that Sam (d) would be officially reprimanded or (e) would be firedfor this behavior. We chose the name “Sam” to be gender-neutral(though we acknowledge that participants may have been morelikely to view Sam as male; cf. Eagly & Kite, 1987).
Results
Confirming our fifth hypothesis, participants who imagined Samjoining the group to which the late outlier belonged believed thatSam was significantly more likely to face punishment for arrivingat 8:25 a.m. (M � 42.5, SD � 23.11) than participants whoimagined Sam joining the group with no outlier but the equivalentgeneral variance (M � 33.3, SD � 24.43), t(163) � �2.48, p �.014. Because examination of the dependent variable revealed mildnon-normality in the distribution, we performed a two-sampleWilcoxon’s rank sum test to ensure the robustness of our findings.The difference described above was significant by this test as well(w � 2,590, p � .011).
Discussion
The results of Study 2 show that the effects of an extreme outlierfound in Study 1 were not due to the greater group variance createdby outlier’s presence. Specifically, Study 2 found that participantsexpected a future deviant would receive greater punishment whenthey belonged to a group with an extreme outlier than when thefuture deviant belonged to a group that had no extreme outlier but
Table 2Arrival Times in Each of the Two Stimuli Videos in Study 2
Stimulistatistics Extreme outlier Matched variance
8:03 7:538:04 8:038:04 8:098:07 8:108:09 8:108:09 8:118:11 8:178:33 8:27
Mean 8:10 8:10Mode 8:04/8:09 8:10Median 8:08 8:10SD 9.72 9.84
Thi
sdo
cum
ent
isco
pyri
ghte
dby
the
Am
eric
anPs
ycho
logi
cal
Ass
ocia
tion
oron
eof
itsal
lied
publ
ishe
rs.
Thi
sar
ticle
isin
tend
edso
lely
for
the
pers
onal
use
ofth
ein
divi
dual
user
and
isno
tto
bedi
ssem
inat
edbr
oadl
y.
8 DANNALS AND MILLER

similar variance in behavior. These results augment those of Study1 and together suggest that outliers shift the normative range ofarrival, but they do not weaken perceptions of norm strength in thesame way that variance does. This is not to say that the presenceof an outlier does not weaken the norm at all, only that perceivinga group with an outlier is not psychologically equivalent to per-ceiving a group with high variance.
Study 3
Study 3 sought to establish that the effects of outliers on groupperception observed in Studies 1 and 2 were not specific topunctuality-related norms. It did so by examining how individualsperceive both the average and the appropriate style of dress in agroup containing informally dressed outliers. Time was well suitedfor conservative tests of our hypotheses regarding overweightingbecause it allowed for a study design that controlled for thestatistical mean arrival time. For other behaviors, this is moredifficult because the normative benchmark (the true values of thedistribution) are less precisely defined. Nonetheless, we sought toverify the pattern from Study 1 in the context of a different norm,even if this norm did not allow for as clear a normative benchmarkfor comparisons.
Because of the lack of a normative benchmark, we will notdirectly examine the overweighting and relative weighting ofoutliers (H1 and H2) but will examine how the impact of outliersdiffers in the case of perceptions of prescriptive norms versusdescriptive norms (H3 and H4). Study 3 also examines howindividuals make sense of the outlying behavior in order to under-stand more fully the differences observed in participant percep-tions of moderate versus extreme outliers.
Method
Participants. Participants (N � 465) were recruited fromAmazon’s Mechanical Turk. The majority of participants werefemale (282 identified as women, 182 as men, one as nonbinary),and the median age was 30 (SD � 9.63). No participants wereexcluded from analyses.
Procedure and measures. Participants were randomly as-signed to one of three conditions in the online survey. Afterproviding informed consent, all participants read the followingintroduction:
In this study you will view a series of images of a work team,photographed outside their office. Team members dress in a variety ofways. (We’ve removed identifying features of the team members forthe purpose of this study.) As you watch, please think about how anew member of this team would think it was appropriate to dress. (Atimer on each page will allow you to advance after observing for atleast 10 seconds.)
After reading this, participants viewed a series of eight images,in a randomized order, for a minimum of 10 s each. Each imagedepicted a different male8 standing in front of a light-colored wall.Seven of the eight images of group members remained constantacross the three conditions: All participants always viewed fourmen wearing a suit and tie, and three men wearing a suit with notie (see Figure 3). In the control condition, the eighth groupmember was another man in a suit with no tie (see Figure 3b). In
the moderate outlier condition, the eighth group member wasinstead wearing a dress shirt with dark jeans and sneakers (seeFigure 3c). In the extreme outlier condition, the eighth groupmember was wearing athletic shorts and a T-shirt (see Figure 3d).
Each image was accompanied with a statement such as “Johnwore this.” There were a total of 10 names that were randomlyassigned to accompany each of the eight photos.9
After viewing all eight images, participants completed an in-nocuous word search as a distractor task for 2 min. This task wasused to approximate the cognitive load participants would be underin a more naturalistic environment in which they might be per-forming daily tasks while interacting with the target group. Aftercompleting the task, participants completed the dependent mea-sures in a randomized order.
Descriptive norm. Paralleling Study 1, participants wereasked to indicate their recollection of each of the group members’formality using a scale that ranged from 1 (very casual, e.g., jeansand t-shirt) to 7 (very formal, e.g., formal suit) for a total of eightitems, one per group member. The average of these items providedthe measure of the descriptive norm.
Prescriptive norm. Participants were also asked to indicate therange of style in which most of the group would feel comfortabledressing, the range in which most of the group would think it wasacceptable to dress, and the range in which most of the groupwould think it was appropriate to dress. Each of these statements
8 After pretesting images of male and female targets in formal attire, wedetermined that there was much less agreement for what qualified asformal versus casual attire for female when compared with male targets.Because we wanted to examine how the distribution of attire affectedperceptions of appropriate dress, we needed to use images that wereunequivocally moderate or extreme outliers in work dress. We thereforefocused only on male target images in order to decrease extraneousvariance in participant perceptions of what constituted formal versus casualdress.
9 We had names accompany the photos to permit a test of our hypothesisthat outliers would be more salient than other individuals in a group andthus their characteristics (see the online supplemental materials), suchas their name would be more memorable than those of other groupmembers. The names—John, James, Sean, Arthur, Joshua, Andrew, Mat-thew, Anthony, Daniel, and Kevin—were thus chosen for their ubiquityand roughly equivalent length.
Figure 3. Examples of the photo stimuli for the style of dress shown forthe main seven group members in Study 3 (a and b), followed by the photostimuli for the moderate outlier (c) and the photo stimuli for the extremeoutlier (d).
Thi
sdo
cum
ent
isco
pyri
ghte
dby
the
Am
eric
anPs
ycho
logi
cal
Ass
ocia
tion
oron
eof
itsal
lied
publ
ishe
rs.
Thi
sar
ticle
isin
tend
edso
lely
for
the
pers
onal
use
ofth
ein
divi
dual
user
and
isno
tto
bedi
ssem
inat
edbr
oadl
y.
9OUTLIERS IN GROUPS

was accompanied by two items indicating the lower and upperbounds of the range on a 7-point spectrum from 1 (very casual,e.g., jeans and t-shirt) to 7 (very formal, e.g., formal suit). Thiscreated a six-item measure of the prescriptive norm (� � .77).
Free response. For a better understanding of how participantsmade sense of the outlier’s style of dress, we included a free-response question after the other dependent measures. The ques-tion included an image of the outlier or an image of one of thenormally dressed individuals in the control condition, and askedparticipants to explain, in two to three sentences, why they be-lieved the individual was dressed that way.
Two independent coders blind to participant condition and hy-potheses coded each free response for two characteristics. Thecoders first rated the degree to which each response expressed thatthe target was an unusual group member (ICC � 0.70). The codersthen rated the degree to which each response indicated that the daythe photo was taken was an unusual day (ICC � 0.71). Bothratings were made on a scale from 1 to 5, with 1 representing atypical group member or a typical day, and 5 representing anatypical group member or an atypical day. For example, responseslike “I think this person was probably dressed this way becausethey mentally don’t catch on to social cues. I have experience withthese kinds of people and unless you specifically tell them what towear they won’t get it” received a high score for atypical personbut a low score for atypical day. Alternatively, responses such as“He had just been called into a meeting on his day off while he wasat the gym so he had to dump the kid with his sister as quickly aspossible and then race into work” received a high score for atypicalday but a low score for atypical person.
Results
Because the objective average formality shifts across conditionsin this study, we cannot make strong tests of our hypothesesregarding overweighting and relative weighting of outliers (H1 andH2). Instead, we first assess whether responses in Study 3 followsimilar patterns to Study 1, and then examine what explanationsindividuals offer for moderate versus extreme outliers.
H1 and H2: Perceptions of the descriptive norm. Becausewe had only three conditions, and because clothing is not numericlike time, we chose to analyze the independent variable as athree-level factor rather than a continuous variable, though analy-ses remain the same when analyzed continuously. We regresseddescriptive norms on two planned contrasts of the outlier extremityfactor, one linear and one quadratic, and found that outlier extrem-ity linearly predicted descriptive norms (b � �0.38, SE � 0.05),t(462) � �8.17, p � .001, but did not show any curvilinearrelationship (b � 0.02, SE � 0.03), t(462) � .69, p � .49 (seeFigure 4). In addition, pairwise t tests with a Holm correction formultiple tests confirmed that participants viewed a group contain-ing a moderate outlier as significantly less formal than a groupcontaining no outlier (p � .001), and viewed a group with anextreme outlier as significantly less formal than both the groupwith a moderate outlier (p � .001) and the control group with nooutlier (p � .001).
H3 and H4: Perceptions of the prescriptive norm. Weregressed prescriptive norms on the same two planned contrastsand found that outlier extremity both linearly predicted prescrip-tive norms (b � �0.16, SE � 0.05), t(462) � �3.14, p � .002,
and curvilinearly predicted prescriptive norms (b � 0.06, SE �0.03), t(462) � 2.08, p � .038 (see Figure 4). We further analyzedpairwise t tests with a Holm correction and found that participantspredicted that members in a group containing no outlier wouldthink their peers should dress significantly more formally thanwould members in a group containing either a moderate outlier(p � .005) or an extreme outlier (p � .008). Participants predictedthat the prescriptive norms of groups with either a moderate outlieror an extreme outlier would not differ (p � .73).
Probing H2 and H4: Attribution differs between moderateand extreme outliers. Participants’ explanations for style ofdress in the control condition suggested that the target groupmember was generally seen as a typical member of the group (M �1.33, SD � 0.61) and the day of observation as a typical day forthe individual (M � 1.34, SD � 0.74). In contrast, participantstended to view the moderate outlier as a highly atypical groupmember (M � 3.13, SD � 1.36) but the day as only a somewhatatypical day (M � 1.94, SD � 1.2). The pattern was different forparticipants viewing the extreme outlier. Compared with thoseviewing the moderate outlier, they judged the extreme outlier to bea less atypical group member (M � 2.46, SD � 1.2) but the day tobe a more atypical day (M � 2.86, SD � 1.15).
To further explore the differences in attribution made for mod-erate and extreme outliers’ style of dress, we regressed attributionsof dispositional atypicality (i.e., is this an atypical group member?)on the same outlier extremity contrast codes used previously—onelinear and one curvilinear. We found that extremity of the outlierincreased individuals’ attributions of dispositional atypicality (b �0.56, SE � 0.06), t(458) � 9.07, p � .001, but this effect wasqualified by a significant curvilinear pattern (b � �0.41, SE �0.04), t(458) � �11.29, p � .001, indicating that individuals mademore attributions of dispositional atypicality for moderate outliersthan for extreme outliers. We next regressed attributions of situa-tional atypicality (i.e., is this an atypical day?) and found that asoutlier extremity increased, individuals increased their attributionsof situational atypicality linearly (b � 0.76, SE � 0.06),t(457)10 � 12.81, p � .001, but not curvilinearly (b � 0.05, SE �0.03), t(457) � 1.46, p � .14, indicating that extreme outliers weremore likely to be judged as representing fluke observations thanunusual group members.
Discussion
The results of Study 3 indicate that when a somewhat casuallydressed person is part of a more formally dressed group, observersremember the outlier better than other group members, and per-ceive the other members of the group as being more casuallydressed themselves and more accepting of casual dress in groupmembers. When the outlier is extremely casually dressed, anattenuated version of this effect occurs for the perceived prescrip-tive norm but remains unattenuated for the perceived descriptivenorm.
10 Degrees of freedom in each of these regressions vary and are lower thanthe total sample because coders could not classify four to five of the freeresponses. Reasons for this included insufficient responses (left blank), non-sensical responses, or irrelevant responses (e.g., “This is James. I rememberhim.”)
Thi
sdo
cum
ent
isco
pyri
ghte
dby
the
Am
eric
anPs
ycho
logi
cal
Ass
ocia
tion
oron
eof
itsal
lied
publ
ishe
rs.
Thi
sar
ticle
isin
tend
edso
lely
for
the
pers
onal
use
ofth
ein
divi
dual
user
and
isno
tto
bedi
ssem
inat
edbr
oadl
y.
10 DANNALS AND MILLER

The pattern for both the prescriptive and descriptive normswas largely similar to, but slightly different from, the pattern ofresults from Study 1. Consistent with Study 1, perceived de-scriptive and prescriptive norms shifted in the direction of theoutlier. Furthermore, extreme outliers had relatively less effecton prescriptive norms than on descriptive norms. There weretwo main differences in the results of the two studies. In Study1, as the outlier became more extreme, perceptions of thedescriptive norm began to asymptote, whereas in Study 3m theycontinued in their linear pattern. Further, in Study 1m percep-tions of the prescriptive norm significantly regressed toward tothe control condition, whereas in Study 3, perceptions of theprescriptive norm flattened.
Why might differences in the pattern of results emerge inStudies 1 and 3? We suspect they emerge because of a differ-ence in the stimuli used in the two studies that was necessitatedby the nature of content differences in the norms used. In Study1, because arrival time was the focal behavior, we were able to
keep the objective average of the group constant across outlierconditions. By shifting the focal behavior to formality of dressin Study 3, for reasons explained earlier, we were not able to dothis and the average of the group increased with the outlier’sextremity. This difference resulted in a shift in the meaning ofequal weighting versus overweighting in the two studies. Spe-cifically, in Study 1, were participants to weight equally themoderate and extreme outlier, because the means of theirgroups were similar, this would result in no differences betweenmoderate and extreme outlier conditions. On the other hand, inStudy 3, were participants to weight equally the two types ofoutliers, because the means of their groups were different, thiswould result in a significant shift in the direction of the outlierbetween the two conditions. Importantly, what did replicateacross the two studies was relative difference between descrip-tive and prescriptive norms, namely, extreme outliers are givenless weight in perceptions of the prescriptive compared withperceptions of the descriptive norms.
Figure 4. Participants’ inferences of the descriptive and prescriptive norm in groups with no, moderate, orextreme outliers from Study 3. �� p � .01. ��� p � .001 from Holm corrected t tests. Error bars are 95%confidence intervals.
Thi
sdo
cum
ent
isco
pyri
ghte
dby
the
Am
eric
anPs
ycho
logi
cal
Ass
ocia
tion
oron
eof
itsal
lied
publ
ishe
rs.
Thi
sar
ticle
isin
tend
edso
lely
for
the
pers
onal
use
ofth
ein
divi
dual
user
and
isno
tto
bedi
ssem
inat
edbr
oadl
y.
11OUTLIERS IN GROUPS

The open-ended results of Study 3 also deepen our understand-ing of why extreme outliers are more likely to be excluded fromperceptions of prescriptive norms than descriptive norms. Peopleare more likely to attribute the behavior of extreme than moderateoutliers to an unusual or atypical circumstance. We propose thatthat it is this assumed unreliability of the extreme outlier’s behav-ior that leads participants to exclude them when assessing theprescriptive norm. Thus, individuals who wear jeans will be in-corporated into perceptions of the prescriptive norm if they areviewed as always wearing jeans but not if they are viewed as onlywearing jeans because their suits were all dirty.
Study 4
Studies 1 to 3 focused on observers’ impressions of groupmembers based on a single encounter. Perceptions of group normsoften rely on more than a single encounter; thus, Study 4 extendedthe information provided observers to two encounters. Specifi-cally, it examined whether the impact that outliers have on per-ceptions of their group based on an initial encounter would persisteven when their behavior in a second encounter is more normative.
In Study 3, we found that extreme outliers are given less weightthan moderate outliers in part because they are viewed as unreli-able observations. This would suggest that if individuals were toobserve the outlier behaving normally the next day, they shouldgive even less weight to the outlier’s previous behavior now thatthere is confirmation of its unreliability. However, previous re-search suggests that first impressions are remarkably strong (Kel-ley, 1950; Nickerson, 1998; Rabin & Schrag, 1999). This suggeststhat individuals may not dismiss the outlier as quickly as would berational, because the outlying first impression continues to holddisproportionate weight in the general perception of the group. Wetherefore hypothesized the following:
Hypothesis 6 (H6): Even after individuals perceive the outlierbehaving more normally the next day, the effect of the initialoutlying behavior will persist on group perception.
Method
Participants. Participants were recruited from an online na-tional pool in order to vary the participant sample from the previ-ous studies that recruited participants from Amazon’s MechanicalTurk. Four hundred eighty participants completed the survey. Asin previous studies, we presented participants with two measures toassess whether they viewed the video properly. First, participantswere required to enter a code that appeared at the end of the video,and those who did not or who entered an incorrect code wereremoved from analyses (n � 27). Second, we asked participants atthe end of the survey to indicate if they had difficulty playing thevideo, and those who did were removed (n � 13). These removalsresulted in a final sample of 440 individuals, with a majority ofwomen (n � 307) and a median age of 32 (SD � 13.37). Allanalyses reported are performed on the pruned sample of partici-pants but remain similar with the additional participants included.
Procedure and measures. The study was a 3 (outlier extrem-ity: control vs. moderate vs. extreme) � 2 (number of daysobserved: one vs. two) design. Because Study 1 established asimilar pattern of results for early and late outliers, we includedonly late outliers in this study in order to conserve resources.
For participants assigned to view only 1 day of group arrivaltimes, the procedure was the same as that in Study 1. For the otherhalf of participants, instead of proceeding to the distractor task anddependent measures after they finished watching the first video,they were directed to a new page that contained another video withthe following message:
Imagine that the previous day of work is now over and it’s the nextday and people are arriving again. As you watch, please continuethinking about when a member of the team would think it wasappropriate to arrive.
These participants then watched a second video. The secondvideo was identical across the three extremity conditions. It nevershowed an outlier and generally was similar to the control video(see Table 3 for specific arrival times shown in this video). Thismeant that the individual who was seen to be an outlier in the firstvideo was seen in the second video to arrive at a time closer to thegroup’s average time of arrival.
Once they viewed the second video, participants completed a3-min distractor task, after which they completed the dependentmeasures. These were identical to Study 1, with one notableexception. Because half of the participants watched two differentvideos, containing 16 different arrival times, we deemed it unrea-sonable to ask them to report their recollection of each individualgroup members’ arrival time. Instead, to assess perceptions of thedescriptive norm, we simply asked them to indicate when theythought most (defined as �50%) group members arrived in gen-eral. This perception was measured with two items that focused onthe lower (“The earliest most members would arrive is . . .”) andupper (“The latest most members arrive is . . .”) bounds of therange. Participants were given a slider from 7:30 to 8:45 to indicateeach response. We averaged these two values to represent thegeneral perception of the distribution of arrivals.
Results
Our analyses addressed two questions. First, we examinedwhether the effects observed in Study 1 replicated in those condi-tions in which participants observed the group for only 1 day ofarrivals. Second, we examined whether observing a second day ofarrivals altered participants’ perceptions of the group norm.
Table 3Arrival Times in Each of the Stimuli Videos in Study 4
Stimulistatistics Control
Moderateoutlier
Extremeoutlier Next day
8:04 8:04 8:01 8:028:05 8:05 8:03 8:058:08 8:05 8:04 8:098:10 8:08 8:04 8:108:10 8:10 8:07 8:108:12 8:10 8:09 8:118:15 8:12 8:09 8:158:16 8:26 8:43 8:18
Mean 8:10 8:10 8:10 8:10Mode 8:10 8:10/8:05 8:04/8:09 8:10Median 8:10 8:09 8:05.5 8:10
Note. The outlier is bolded in the moderate and extreme outlier condi-tions.
Thi
sdo
cum
ent
isco
pyri
ghte
dby
the
Am
eric
anPs
ycho
logi
cal
Ass
ocia
tion
oron
eof
itsal
lied
publ
ishe
rs.
Thi
sar
ticle
isin
tend
edso
lely
for
the
pers
onal
use
ofth
ein
divi
dual
user
and
isno
tto
bedi
ssem
inat
edbr
oadl
y.
12 DANNALS AND MILLER

H1 to H4: Replicating Study 1. To analyze our results, wetreated outlier extremity as a factor and contrast-coded it withone linear and one quadratic contrast. Participants’ responses inthe single observation condition replicated Study 1’s findings(see the online supplemental materials for descriptive statis-tics). The later the outlier arrived on Day 1, the later participantsassessed the descriptive norm to be (b � 1.77, SE � 0.52),t(434) � 3.38, p � .001 (see Table 4, Model 1). This was qualifiedby a marginal curvilinear trend (b � �0.93, SE � 0.52),t(434) � �1.79, p � .07 (see Table 4, Model 1), most likelybecause the effect of outlier extremity on descriptive norms doesnot increase as the outlier becomes more extreme (see Study 1Discussion). Our patterns for prescriptive norms similarly repli-cated those from Study 1. Participants showed a marginally sig-nificant linear trend (b � 0.87, SE � 0.51), t � 1.71, p � .088 (seeTable 4, Model 4) toward overweighting the outlier. Pairwise ttests with a Holm correction for multiple analyses verified asignificant difference between the control condition and the mod-erate outlier condition (p � .002). In addition, participants showeddiminished weighting of more extreme outliers in their judgmentof the prescriptive norm, replicating the curvilinear pattern(b � �1.51, SE � 0.51), t � �2.99, p � .003 (see Table 4, Model4).
H6: Effect of multiple days. To test whether observing thegroup for a second day caused any significant changes in theperceptions of the descriptive and prescriptive norm, we interactedtwo orthogonal dummy codes, one linear and one curvilinear, witha dummy-coded variable representing whether participants viewed1 or 2 days of the group’s arrivals. For descriptive norms, aspredicted, we found no significant interactions of number of daysof observation with either the linear (b � 0.14, SE � 1.05),t(432) � .14, p � .89, or curvilinear effect of outlier extremity(b � 0.60, SE � 1.04), t(432) � .58, p � .56 (see Table 4, Model3). However, for prescriptive norms, we found a marginal inter-action of the curvilinear effect of outlier extremity and number ofdays of observation (b � �1.86, SE � 1.01), t(426) � �1.84, p �.066 (see Table 4, Model 6). Specifically, when participants ob-served 2 days of arrivals, their perceptions more strongly showed alinear pattern (b � 1.47, SE � 0.71), t(426) � 2.08, p � .038, thana curvilinear pattern (b � �0.57, SE � 0.72), t(426) � �0.79, p �.43 (see Table 4, Model 6).
Discussion
The results from this study offer insight into how the effectsfound in Studies 1 to 3 might play out over time. Having observedan individual arrive moderately late on the first day, participantspersist in perceiving the group norm for arrival time to be latereven if they observed that first-day outlier arrive closer to the restof the group on the second day. This suggests that not only isobserving an outlier capable of biasing inferences about groups onthe basis of a single encounter, but it is capable of sustainingbiased perceptions of the group norm even when the initial outlierceases to be an outlier in subsequent encounters. This resultcomports with prior research on the strength of first impressions(Kelley, 1950; Nickerson, 1998; Rabin & Schrag, 1999).
We found an interesting marginal pattern in prescriptive normperception over time. Participants who observed an extreme outlieron Day 1, but for whom the outlier then normalized on Day 2, T
able
4St
udy
4R
egre
ssio
nA
naly
ses
Pred
icto
rs
DV
:D
escr
iptiv
eno
rms
DV
:Pr
escr
iptiv
eno
rms
Mod
el1
Mod
el2
Mod
el3
Mod
el4
Mod
el5
Mod
el6
Lin
ear
cont
rast
1.77
���
(.75
–2.7
9)1.
77���
(.74
–2.7
9)1.
69�
(.22
–3.1
6).8
7�(�
.13–
1.87
).8
8�(�
.13–
1.88
)1.
47�
(.09
–2.8
9)Q
uadr
atic
cont
rast
�.9
4�(�
1.96
–.07
)�
.93�
(�1.
95–.
09)
�1.
22�
(�2.
65–
.20)
�1.
51���
(�2.
50–
�.5
2)�
1.52
���
(�2.
52–
�.5
3)�
.57
(�1.
98–.
84)
#D
ays
(0�
2da
ys,
1�
1da
y).3
5(�
.83–
1.53
).3
5(�
.83–
1.53
)�
.26
(�1.
41–.
89)
�.2
6(�
1.41
–.89
)L
inea
r�
Day
s�
.15
(�2.
20–1
.91)
�1.
22(�
3.22
–.78
)Q
uadr
atic
�D
ays
�.6
0(�
2.64
–1.4
4)�
1.86
�(�
3.84
–.12
)C
onst
ant
2.95
���
(2.3
6–3.
54)
3.13
���
(2.3
0–3.
96)
3.12
���
(2.2
9–3.
96)
.17
(�.4
0–.7
5).0
4(�
.78–
.86)
.03
(�.7
9–.8
5)O
bser
vatio
ns43
843
843
843
243
243
2
Not
e.D
V�
depe
nden
tva
riab
le.
�p
�.1
0.�
p�
.05.
���
p�
.001
.
Thi
sdo
cum
ent
isco
pyri
ghte
dby
the
Am
eric
anPs
ycho
logi
cal
Ass
ocia
tion
oron
eof
itsal
lied
publ
ishe
rs.
Thi
sar
ticle
isin
tend
edso
lely
for
the
pers
onal
use
ofth
ein
divi
dual
user
and
isno
tto
bedi
ssem
inat
edbr
oadl
y.
13OUTLIERS IN GROUPS

viewed the group norm as more extreme than participants whoviewed only the extreme outlier on Day 1. Why might viewing anormal group, in which the outlier has regressed to the mean, causeindividuals to perceive a later arrival time as more acceptable?Perhaps individuals view the Day 2 arrival time of the Day 1outlier through the lens of her earlier behavior. On Day 2, the sameactor associated with the extreme arrival on Day 1 arrives at 8:18a.m. Though the target’s Day 2 time is not particularly extreme—itwould likely raise little notice had it occurred on Day 1—it mayseem more extreme or noticeable in light of the target’s extremelylate arrival on Day 1. After only Day 1, participants may view theextreme behavior as unreliable, as shown in free responses inStudy 3, but on Day 2, the outlier is still the last to arrive, perhapssignaling that the extreme behavior from Day 1 is a more reliablesignal of the norm. If this is true, we speculate that an extremeoutlier, partially regressed to the group mean, may be treated by anobserver as more of a moderate outlier. To explore this possibility,in Figure 5, we graph the results again, but this time, for conditionsin which 2 days of arrivals are observed, we average the extremityof the outlier on Day 1 and Day 2. Participant judgments of theprescriptive norm suggest that they may average the distributionsacross time in forming their perception of the group. This suggeststhat first impressions hold sway but will eventually regress to themean if behavior stabilizes for long enough.
General Discussion
How are people’s representations of a small group’s socialnorms influenced by outliers? Across four studies, we showed that
the impact of outliers on perceptions of their group’s norm de-pends on their extremity. Moderate outliers shift observers’ per-ception of the descriptive and prescriptive norm disproportionatelytoward the outlier. Extreme outliers have a different effect onperceptions of the group. As outliers become more extreme, ob-servers are more likely to discount their behavior, shifting theirperceptions of the norm, especially the prescriptive norm, backtoward the behavior of the rest of the group. We documented thispattern across two behavioral social norms—style of dress andpunctuality—and examined how this process might play out overtime.
Why Are Outliers Overweighted?
We hypothesized that the greater cognitive availability of out-liers would lead them to be overweighted in perceptions of thegroup’s social norm. Our rationale for this hypothesis draws onresearch and theory on the anchoring and adjustment heuristic.Anchoring and adjustment is traditionally viewed as a subtype ofthe broader availability heuristic wherein individuals infer fre-quency from cognitive availability (Chapman & Johnson, 1999).In the classic studies of anchoring and adjustment, experimentersmake a numerical anchor salient to participants and then askparticipants to make a numerical target judgment (Tversky &Kahneman, 1974). Although participants adjust from the anchor,recognizing it as incorrect or irrelevant, they do so insufficiently,resulting in their responses shifting toward the anchor.
We propose that individuals’ perceptions of outliers reflect asimilar form of anchoring and insufficient adjustment. Although
Figure 5. Participant inferences of the prescriptive norm as a function of outlier extremity. The dotted linesrepresent the average extremity if one averages both days: (34 min later � 3 min later)/2 � 18.5; (14 min later �3 min later)/2 � 8.5.
Thi
sdo
cum
ent
isco
pyri
ghte
dby
the
Am
eric
anPs
ycho
logi
cal
Ass
ocia
tion
oron
eof
itsal
lied
publ
ishe
rs.
Thi
sar
ticle
isin
tend
edso
lely
for
the
pers
onal
use
ofth
ein
divi
dual
user
and
isno
tto
bedi
ssem
inat
edbr
oadl
y.
14 DANNALS AND MILLER

individuals may perceive the outlier as nonrepresentative of thecentral tendency of the group as a whole, we propose they never-theless fail to adjust sufficiently from them when trying to estimatethe group’s behavior. We can see anchoring and adjustment atwork in participants’ recollections of the individual arrival times ofeach group member. Individuals anchor on the salient arrival timeof the outlier, and then adjust the arrival time of the group membernearest the outlier thereby rendering the outlier’s arrival time lessextreme. Individuals also adjust recollections of the outliers’ ar-rival, by moving the outlier closer to the other group members’time of arrival, possibly reflecting a motivation to recall groupbehavior as more consistent across group members than it was(Hamilton & Sherman, 1996).
Why Are Extreme Outliers Given Less Weight ThanModerate Outliers?
We propose that there are at least three explanations for whyextreme outliers are given less weight than moderate outliers ininferences about the group norm. Although these accounts allpredict the different weighting of moderate and extreme outliers ofextreme outliers, they implicate different, though not mutuallyexclusive, psychological processes.
The first account suggests that individuals who observe anextreme outlier may tend to discount their relevance to the groupnorm because they see their behavior as unreliable—or a fluke.For example, individuals might believe that the extreme outlier inStudy 1 is late because of a flat tire on the way to work. Whenobservers attribute an instance of extreme lateness to a flat tire,they can legitimately discount this as a relevant data point for thegroup norm both because it is nondiagnostic of the group norm andbecause it likely is an infrequent occurrence. The inferences foundin Study 3 support this process explanation. Participants were morelikely to infer that extreme, compared with moderate, outliers weredressed differently because it was an unusual day, implying thattheir informal dress was nondiagnostic.
A second explanation for the different impact of moderate andextreme outliers focuses on the inferences perceivers draw aboutthe social status of the two types of outliers. As outliers becomemore extreme, observers might be more likely to infer somethingnegative about the outlier’s character and standing in the group,perhaps that they are lazy or inconsiderate. Judgments such asthese would be in line with the black sheep effect (Marques et al.,1988), whereby group members become disliked and derogatedwhen they violate group norms. Discounting of the outlier follow-ing this type of inference would occur not because perceiversbelieve their behavior is infrequent but because they believe thebehavior is indicative of a norm violator who will be rejectedrather than emulated by other group members. That individuals aremore likely to assign black sheep status to the target as theirbehavior becomes more extreme would fit the curvilinear patternobserved in Studies 1 and 3. The persuasiveness of this explanationis diminished, however, by the pattern of attributions that partic-ipants in Study 3 gave for the extreme outlier’s behavior. Partic-ipants in Study 3 were more likely to categorize the extreme outlieras having an unusual day but categorize more moderate outliers asunusual individuals. If discounting an extreme outlier is driven byattributions of lower group status, then individuals should be morelikely to attribute the outlier’s behavior to a dispositional feature
(e.g., “This is a bad group member”) than to a situational feature(e.g., “He rode his bike to work”).
A third explanation for the greater impact on perceived groupnorms of moderate than extreme outliers focuses on the tendencynot to negatively differentiate extreme outgroup members fromtheir peers but to positively differentiate them. More specifically,observers might infer that the extreme outlier is a disproportion-ately good group member, or a group leader. Several lines ofresearch (Abrams, de Moura, Marques, & Hutchison, 2008; Ha-levy, Berson, & Galinsky, 2011; Van Kleef et al., 2011) suggestthat individuals infer that those breaking social norms are morepowerful because individuals higher in power or leadership areafforded greater license to transgress social norms. Individuals,therefore, might infer from the extreme late outlier’s behavior thatthey are a group leader because only the group leader could getaway with, or would have an excuse for, such behavior. Partici-pants who make such attributions would be discounting the ex-treme behavior not because they believe it is counternormative, butbecause they believe it is representative of a norm for a different(higher status) reference group. Although possible, this accountalso seems less plausible in light of the pattern of participants’attributions found in Study 3.
Accuracy in Group Perceptions
As noted earlier, the methods and goals of the present researchcorrespond in a number of respects with those that characterizeensemble-coding research in the visual sciences. However, theyalso differ in important respects that inform our theoretical insightsregarding accuracy in group perception. First, ensemble codingstudies tend to use a shorter span of exposure to the target stimulithan the present research. Participants typically view the stimulifrom anywhere from 200 ms (Whiting & Oriet, 2011) to 2 s(Ariely, 2001), but it is always a brief span of time. In contrast, ourparticipants view the target group for much longer: Each targetactor appears on the screen for at least 9 s. Participants in ensemblecoding experiments also routinely complete many more trials ofthe task did the present participants. In addition, research inensemble coding tends to use a different normative benchmark foraccuracy of decisions. Participants are usually asked to make abinary choice with the accuracy of their responses being comparedwith chance. Researchers conclude that individuals are accuratelydetecting a signal when they perform at rates better than chance.The standard of accuracy in the present research was much moredemanding. Participants in our studies had to recall a set of eightarrival times.
The differences in method found between the ensemble codingresearch and the present research reflect the different goals guidingthe two types of research. Ensemble coding research aims tounderstand the near instantaneous visual appraisal of sets of ob-jects or people. As such, the short time span of studies mirrors theprocessing speed of the visual system. In contrast, understanding agroup’s social norms can take months of time, and the presentstudies serve as only a starting point in which we examine thesmallest unit possible—only eight group members—in the sim-plest situation—all data points visible and clearly construed. Giventhat perceiving a social norm is more deliberative process thanvisual perception, we assumed that participants would requiremore time to infer a social norm than they would to encode the
Thi
sdo
cum
ent
isco
pyri
ghte
dby
the
Am
eric
anPs
ycho
logi
cal
Ass
ocia
tion
oron
eof
itsal
lied
publ
ishe
rs.
Thi
sar
ticle
isin
tend
edso
lely
for
the
pers
onal
use
ofth
ein
divi
dual
user
and
isno
tto
bedi
ssem
inat
edbr
oadl
y.
15OUTLIERS IN GROUPS
crowd’s motion, just as they may typically spend more time andcognitive effort considering how to fit in with a group comparedwith evaluating the group’s gender composition (Haberman &Whitney, 2007).
This extra time provided participants in the present researchmight have facilitated the errors in judgment found. Participantsmay have represented the group accurately at the moment ofperception, with outlier-driven inaccuracy only emerging whenthey later recalled the group behavior in order to form impressionsof the group and its social norms. Furthermore, the inaccuracyobserved in the present study does not preclude the possibility thatparticipants’ judgments were still above the equivalent of chanceaccuracy. Researchers rarely use the benchmarks of chance versusperfect accuracy in the same study. This makes sense. It wouldseem inappropriate to use chance accuracy as a comparison whenthe task for participants is guessing the number of murders inDetroit. Conversely, it would seem inappropriate to use perfectaccuracy as a comparison when participants are tasked with com-paring a circle with the mean of a series of circles that theypreviously had seen for a fraction of a second. This pattern,however, leaves unexplored an area between 50% and 100%accuracy, which future researchers should examine perception tounderstand better how these different processes interact to producesubtle distortions in accuracy.
Limitations and Future Directions
This article serves only as a starting point for understanding howpeople infer descriptive and prescriptive norms. There are severalfeatures of the process that we leave unexplored in this article andopen for future research. First, though we demonstrate our findingsacross two norms, these two norms are hardly representative of thenorms one may encounter every day. For some norms, such asstrong social mores, individuals may rarely update their percep-tions. For others, such as those relating to behavior that is rarelydirectly observed, individuals may have to base their judgments onsummaries of hearsay from friends or media reports. In these lattercases, it would be interesting to see what, if any, counterweightindividuals place on less direct sources of information versusdirect observation of descriptive behavior.
Furthermore, even in the case of the currently explored norms,questions remain. For example, individuals may be more likely todiscount even moderate outliers when an obvious explanation—such as a widely reported traffic accident or a weather anomaly—could explain the late arrival. Our results from Study 3 suggest thatindividuals spontaneously construct stories in explanation of theoutlying behavior, and this should only increase when obviousexplanations are readily available. In addition, in this article, weexamine only small groups. As groups become larger and thevariance in group behavior increases, it is possible that outlyingbehavior is tolerated more and carries less impact in the gestaltrepresentation. Further, the degree of extremity that is categorizedas moderate versus extreme is likely somewhat dependent upon theperceived cohesion and number of the other group members. In agroup with 20 normal group members, 15 min late may seem moreextreme than in our cases in which the extremity is balanced byonly seven normal arrivals. In the same way, if the 20 groupmembers are highly variable, one more very late arrival may carry
less weight when the group is already encoded as having a weaknorm.
Similarly, this article investigates only the presence of singleoutliers. It would be interesting to determine when multiple out-liers are present whether their effects are additive or diminishing.Furthermore, the coexistence of outliers of varying extremity mayproduce counterintuitive normalization; in a group with an extremeoutlier, a moderate outlier becomes less outlying. With greaterexploration of these situations, we can improve not only ourunderstanding of social norms but also our understanding of groupperception and social interactions.
Conclusion
Our article extends theory and research on group perception andsocial norms by offering insight into how individuals view groupswith outliers. Though outliers are an infrequent occurrence, byunderstanding how we incorporate outlying behavior into ourunderstanding of groups, social psychology may gain insight intoa variety of important phenomena. One interesting example of thisis social change. When individuals advocate for a change of thestatus quo, they are likely to be perceived as outliers in their group,in terms of both attitudes and behavior. However, in order for theseindividuals to shift the either outsiders’ or insiders’ perception ofthe group’s position, they must continue to be considered a part ofthe group. For example, a dovish Republican must still be per-ceived as a conservative, and a fiscally conservative Democratmust still be perceived as a member of the Democratic Party, inorder for them to have an impact on how their party is perceived.In light of the current research, outliers hoping to shift the meanperception of their group may be advised to take moderate posi-tions, lest they be discounted with other extremists.
References
Abrams, D., de Moura, G. R., Marques, J. M., & Hutchison, P. (2008).Innovation credit: When can leaders oppose their group’s norms? Jour-nal of Personality and Social Psychology, 95, 662–678. http://dx.doi.org/10.1037/0022-3514.95.3.662
Alvarez, G. A. (2011). Representing multiple objects as an ensembleenhances visual cognition. Trends in Cognitive Sciences, 15, 122–131.http://dx.doi.org/10.1016/j.tics.2011.01.003
Alvarez, G. A., & Oliva, A. (2008). The representation of simple ensemblevisual features outside the focus of attention. Psychological Science, 19,392–398. http://dx.doi.org/10.1111/j.1467-9280.2008.02098.x
Alvarez, G. A., & Oliva, A. (2009). Spatial ensemble statistics are efficientcodes that can be represented with reduced attention. Proceedings of theNational Academy of Sciences of the United States of America, 106,7345–7350. http://dx.doi.org/10.1073/pnas.0808981106
Ariely, D. (2001). Seeing sets: Representation by statistical properties.Psychological Science, 12, 157–162. http://dx.doi.org/10.1111/1467-9280.00327
Bates, D., Maechler, M., Bolker, B., & Walker, S. (2014). lme4: Linearmixed-effects models using “Eigen” and S4: R package (Version 1.1–13) [Computer software]. Retrieved from https://cran.r-project.org/web/packages/lme4/index.html
Bellezza, S., Gino, F., & Keinan, A. (2014). The red sneakers effect:Inferring status and competence from signals of nonconformity. Journalof Consumer Research, 41, 35–54. http://dx.doi.org/10.1086/674870
Berger, J. (2011). Arousal increases social transmission of information.Psychological Science, 22, 891– 893. http://dx.doi.org/10.1177/0956797611413294
Thi
sdo
cum
ent
isco
pyri
ghte
dby
the
Am
eric
anPs
ycho
logi
cal
Ass
ocia
tion
oron
eof
itsal
lied
publ
ishe
rs.
Thi
sar
ticle
isin
tend
edso
lely
for
the
pers
onal
use
ofth
ein
divi
dual
user
and
isno
tto
bedi
ssem
inat
edbr
oadl
y.
16 DANNALS AND MILLER
Bicchieri, C. (2006). The grammar of society: The nature and dynamics ofsocial norms. Cambridge, UK: Cambridge University Press.
Brady, T. F., & Alvarez, G. A. (2011). Hierarchical encoding in visualworking memory: Ensemble statistics bias memory for individual items.Psychological Science, 22, 384 –392. http://dx.doi.org/10.1177/0956797610397956
Brauer, M., & Chaurand, N. (2010). Descriptive norms, prescriptive norms,and social control: An intercultural comparison of people’s reactions touncivil behaviors. European Journal of Social Psychology, 40, 490–499.
Burr, D., & Ross, J. (2008). A visual sense of number. Current Biology, 18,425–428. http://dx.doi.org/10.1016/j.cub.2008.02.052
Chapman, G. B., & Johnson, E. J. (1994). The limits of anchoring. Journalof Behavioral Decision Making, 7, 223–242. http://dx.doi.org/10.1002/bdm.3960070402
Chapman, G. B., & Johnson, E. J. (1999). Anchoring, activation, and theconstruction of values. Organizational Behavior and Human DecisionProcesses, 79, 115–153. http://dx.doi.org/10.1006/obhd.1999.2841
Chong, S. C., & Treisman, A. (2003). Representation of statistical prop-erties. Vision Research, 43, 393–404. http://dx.doi.org/10.1016/S0042-6989(02)00596-5
Cialdini, R. B., Reno, R. R., & Kallgren, C. A. (1990). A focus theory ofnormative conduct: Recycling the concept of norms to reduce littering inpublic places. Journal of Personality and Social Psychology, 58, 1015–1026. http://dx.doi.org/10.1037/0022-3514.58.6.1015
Dakin, S. C., & Watt, R. J. (1997). The computation of orientation statisticsfrom visual texture. Vision Research, 37, 3181–3192. http://dx.doi.org/10.1016/S0042-6989(97)00133-8
de Fockert, J., & Wolfenstein, C. (2009). Rapid extraction of mean identityfrom sets of faces. The Quarterly Journal of Experimental Psychology,62, 1716–1722. http://dx.doi.org/10.1080/17470210902811249
Eagly, A. H., & Kite, M. E. (1987). Are stereotypes of nationalities appliedto both women and men? Journal of Personality and Social Psychology,53, 451–462. http://dx.doi.org/10.1037/0022-3514.53.3.451
Eriksson, K., Strimling, P., & Coultas, J. C. (2015). Bidirectional associ-ations between descriptive and injunctive norms. Organizational Behav-ior and Human Decision Processes, 129, 59–69. http://dx.doi.org/10.1016/j.obhdp.2014.09.011
Felps, W., Mitchell, T. R., & Byington, E. (2006). How, when, and whybad apples spoil the barrel: Negative group members and dysfunctionalgroups. Research in Organizational Behavior, 27, 175–222. http://dx.doi.org/10.1016/S0191-3085(06)27005-9
Gelfand, M. J., Raver, J. L., Nishii, L., Leslie, L. M., Lun, J., Lim, B. C.,. . . Yamaguchi, S. (2011). Differences between tight and loose cultures:A 33-nation study. Science, 332, 1100–1104. http://dx.doi.org/10.1126/science.1197754
Goldstein, D. G., & Rothschild, D. (2014). Lay understanding of proba-bility distributions. Judgment and Decision Making, 9, 1–14.
Haberman, J., & Whitney, D. (2007). Rapid extraction of mean emotionand gender from sets of faces. Current Biology, 17, R751–R753. http://dx.doi.org/10.1016/j.cub.2007.06.039
Haberman, J., & Whitney, D. (2009). Seeing the mean: Ensemble codingfor sets of faces. Journal of Experimental Psychology: Human Percep-tion and Performance, 35, 718–734. http://dx.doi.org/10.1037/a0013899
Haberman, J., & Whitney, D. (2010). The visual system discounts emo-tional deviants when extracting average expression. Attention, Percep-tion, & Psychophysics, 72, 1825–1838. http://dx.doi.org/10.3758/APP.72.7.1825
Halevy, N., Berson, Y., & Galinsky, A. D. (2011). The mainstream is notelectable: When vision triumphs over representativeness in leader emer-gence and effectiveness. Personality and Social Psychology Bulletin, 37,893–904. http://dx.doi.org/10.1177/0146167211402836
Hamilton, D. L., & Sherman, S. J. (1996). Perceiving persons and groups.Psychological Review, 103, 336–355. http://dx.doi.org/10.1037/0033-295X.103.2.336
Kahneman, D., & Miller, D. T. (1986). Norm theory: Comparing reality toits alternatives. Psychological Review, 93, 136–153.
Kashima, Y., Wilson, S., Lusher, D., Pearson, L. J., & Pearson, C. (2013).The acquisition of perceived descriptive norms as social category learn-ing in social networks. Social Networks, 35, 711–719. http://dx.doi.org/10.1016/j.socnet.2013.06.002
Kelley, H. H. (1950). The warm-cold variable in first impressions ofpersons. Journal of Personality, 18, 431–439. http://dx.doi.org/10.1111/j.1467-6494.1950.tb01260.x
Kunda, Z., & Oleson, K. C. (1997). When exceptions prove the rule: Howextremity of deviance determines the impact of deviant examples onstereotypes. Journal of Personality and Social Psychology, 72, 965–979.http://dx.doi.org/10.1037/0022-3514.72.5.965
Kuznetsova, A., Brockhoff, P. B., & Christensen, R. H. B. (2015). Package“lmerTest”: R package (Version, 2.0–33) [Computer software]. Re-trieved from https://cran.r-project.org/web/packages/lmerTest/index.html
Marques, J. M., Yzerbyt, V. Y., & Leyens, J.-P. (1988). The “Black SheepEffect”: Extremity of judgments towards ingroup members as a functionof group identification. European Journal of Social Psychology, 18,1–16. http://dx.doi.org/10.1002/ejsp.2420180102
Miller, D. T., & Prentice, D. A. (2016). Changing norms to changebehavior. Annual Review of Psychology, 67, 6.1–6.23.
Monin, B., Sawyer, P. J., & Marquez, M. J. (2008). The rejection of moralrebels: Resenting those who do the right thing. Journal of Personalityand Social Psychology, 95, 76–93. http://dx.doi.org/10.1037/0022-3514.95.1.76
Morrison, K. R., & Miller, D. T. (2008). Distinguishing between silent andvocal minorities: Not all deviants feel marginal. Journal of Personalityand Social Psychology, 94, 871–882. http://dx.doi.org/10.1037/0022-3514.94.5.871
Nelson, L. D., & Simonsohn, U. (2014, September 9). Thirty-somethingsare shrinking and other u-shaped challenges. [Web log post]. Retrievedfrom http://datacolada.org/2014/09/17/27-thirty-somethings-are-shrinking-and-other-u-shaped-challenges/
Nickerson, R. S. (1998). Confirmation bias: A ubiquitous phenomenon inmany guises. Review of General Psychology, 2, 175–220. http://dx.doi.org/10.1037/1089-2680.2.2.175
Nisbett, R. E., & Kunda, Z. (1985). Perception of social distributions.Journal of Personality and Social Psychology, 48, 297–311. http://dx.doi.org/10.1037/0022-3514.48.2.297
Paluck, E. L., Shepherd, H., & Aronow, P. M. (2016). Changing climatesof conflict: A social network experiment in 56 schools. Proceedings ofthe National Academy of Sciences of the United States of America, 113,566–571. http://dx.doi.org/10.1073/pnas.1514483113
Prentice, D. A., & Miller, D. T. (1993). Pluralistic ignorance and alcoholuse on campus: Some consequences of misperceiving the social norm.Journal of Personality and Social Psychology, 64, 243–256. http://dx.doi.org/10.1037/0022-3514.64.2.243
Rabin, M., & Schrag, J. L. (1999). First impressions matter: A model ofconfirmatory bias. The Quarterly Journal of Economics, 114, 37–82.http://dx.doi.org/10.1162/003355399555945
Simonsohn, U. (2014, January). Go big or go home: A practical alternativeto impractical power analysis. Presented at The Society of Personalityand Social Psychology, Austin, TX.
Sherif, M., & Hovland, C. I. (1961). Social judgment: Assimilation andcontrast effects in communication and attitude change. New Haven, CT:Yale University Press.
Sweeny, T. D., Haroz, S., & Whitney, D. (2013). Perceiving group behav-ior: Sensitive ensemble coding mechanisms for biological motion of
Thi
sdo
cum
ent
isco
pyri
ghte
dby
the
Am
eric
anPs
ycho
logi
cal
Ass
ocia
tion
oron
eof
itsal
lied
publ
ishe
rs.
Thi
sar
ticle
isin
tend
edso
lely
for
the
pers
onal
use
ofth
ein
divi
dual
user
and
isno
tto
bedi
ssem
inat
edbr
oadl
y.
17OUTLIERS IN GROUPS
human crowds. Journal of Experimental Psychology: Human Perceptionand Performance, 39, 329–337. http://dx.doi.org/10.1037/a0028712
Tankard, M. E., & Paluck, E. L. (2016). Norm perception as a vehicle forsocial change. Social Issues and Policy Review, 10, 181–211. http://dx.doi.org/10.1111/sipr.12022
Tversky, A., & Kahneman, D. (1974). Judgment under uncertainty: Heu-ristics and biases. Science, 185, 1124–1131. http://dx.doi.org/10.1126/science.185.4157.1124
Van Kleef, G. A., Homan, A. C., Finkenauer, C., Gündemir, S., & Stam-kou, E. (2011). Breaking the rules to rise to power how norm violatorsgain power in the eyes of others. Social Psychological and PersonalityScience, 2, 500–507. http://dx.doi.org/10.1177/1948550611398416
Watamaniuk, S. N., & Duchon, A. (1992). The human visual systemaverages speed information. Vision Research, 32, 931–941. http://dx.doi.org/10.1016/0042-6989(92)90036-I
Whiting, B. F., & Oriet, C. (2011). Rapid averaging? Not so fast! Psycho-nomic Bulletin & Review, 18, 484 – 489. http://dx.doi.org/10.3758/s13423-011-0071-3
Whitney, D., Haberman, J., & Sweeny, T. D. (2014). From textures tocrowds: Multiple levels of summary statistical perception. In J. S.Werner & L. M. Chalupa (Eds.), The new visual neurosciences (pp.695–710). Cambridge, MA: MIT Press.
Whyte, W. F. (1955). Money and motivation: An analysis of incentives inthe industry. New York, NY: Harper.
Received August 15, 2016Revision received April 3, 2017
Accepted May 8, 2017 �
Thi
sdo
cum
ent
isco
pyri
ghte
dby
the
Am
eric
anPs
ycho
logi
cal
Ass
ocia
tion
oron
eof
itsal
lied
publ
ishe
rs.
Thi
sar
ticle
isin
tend
edso
lely
for
the
pers
onal
use
ofth
ein
divi
dual
user
and
isno
tto
bedi
ssem
inat
edbr
oadl
y.
18 DANNALS AND MILLER