general education and core competencies · general education and core competencies ... sacs...
TRANSCRIPT

General Education and Core Competencies Paul D. Camp Community College 2010-2011 Dir. Assessment & IR General Education Committee 2/11/11
ii
Table of Contents
Introduction ………………………………………………………………………………………………. 1 VCCS General Education …………………………………………………………………………… 3 VCCS Core Competencies …………………………………………………………………………. 5 Communication: Writing Core Competency ………………………………………………… 6 Communication: Oral Core Competency ……………………………………………………. 14 Critical Thinking ………………………………………………………………………………………… 19 Cultural and Social Understanding ……………………………………………………………. 25 Information Literacy …………………………………………………………………………………. 33 Personal Development ……………………………………………………………………………… 40 Quantitative Reasoning ……………………………………………………………………………. 47 Scientific Reasoning ………………………………………………………………………………….. 55
1
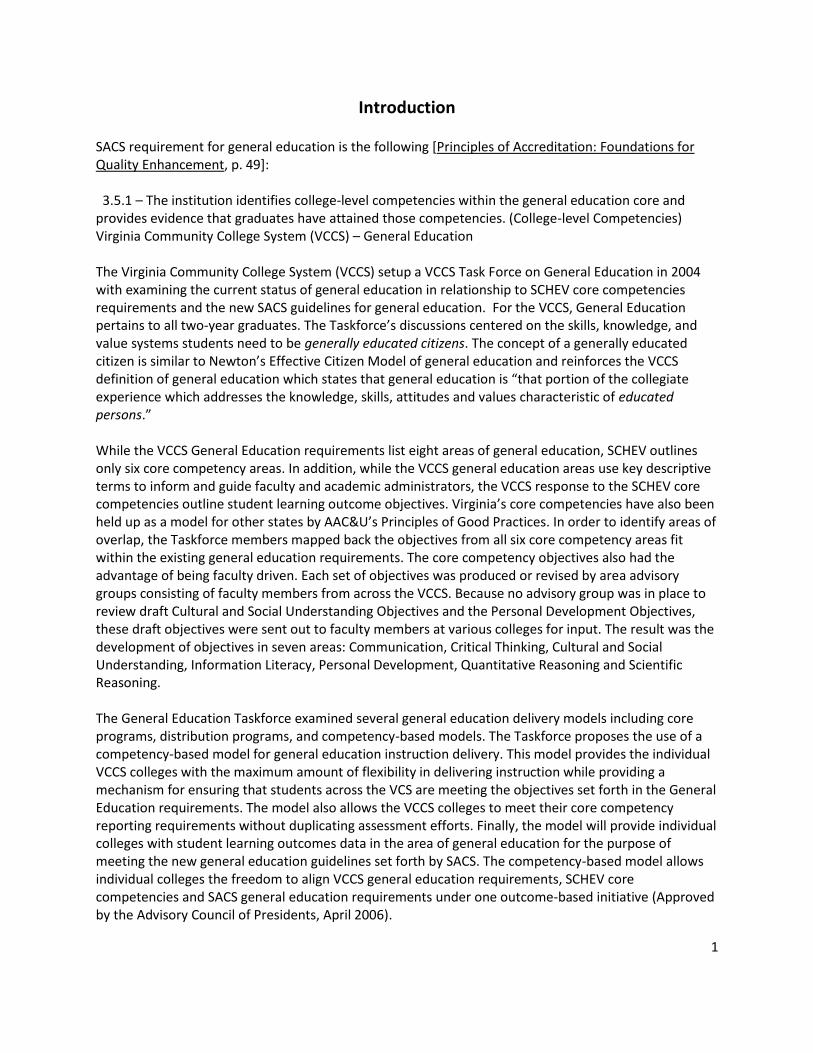
Introduction SACS requirement for general education is the following [Principles of Accreditation: Foundations for Quality Enhancement, p. 49]: 3.5.1 – The institution identifies college-level competencies within the general education core and provides evidence that graduates have attained those competencies. (College-level Competencies) Virginia Community College System (VCCS) – General Education The Virginia Community College System (VCCS) setup a VCCS Task Force on General Education in 2004 with examining the current status of general education in relationship to SCHEV core competencies requirements and the new SACS guidelines for general education. For the VCCS, General Education pertains to all two-year graduates. The Taskforce’s discussions centered on the skills, knowledge, and value systems students need to be generally educated citizens. The concept of a generally educated citizen is similar to Newton’s Effective Citizen Model of general education and reinforces the VCCS definition of general education which states that general education is “that portion of the collegiate experience which addresses the knowledge, skills, attitudes and values characteristic of educated persons.” While the VCCS General Education requirements list eight areas of general education, SCHEV outlines only six core competency areas. In addition, while the VCCS general education areas use key descriptive terms to inform and guide faculty and academic administrators, the VCCS response to the SCHEV core competencies outline student learning outcome objectives. Virginia’s core competencies have also been held up as a model for other states by AAC&U’s Principles of Good Practices. In order to identify areas of overlap, the Taskforce members mapped back the objectives from all six core competency areas fit within the existing general education requirements. The core competency objectives also had the advantage of being faculty driven. Each set of objectives was produced or revised by area advisory groups consisting of faculty members from across the VCCS. Because no advisory group was in place to review draft Cultural and Social Understanding Objectives and the Personal Development Objectives, these draft objectives were sent out to faculty members at various colleges for input. The result was the development of objectives in seven areas: Communication, Critical Thinking, Cultural and Social Understanding, Information Literacy, Personal Development, Quantitative Reasoning and Scientific Reasoning. The General Education Taskforce examined several general education delivery models including core programs, distribution programs, and competency-based models. The Taskforce proposes the use of a competency-based model for general education instruction delivery. This model provides the individual VCCS colleges with the maximum amount of flexibility in delivering instruction while providing a mechanism for ensuring that students across the VCS are meeting the objectives set forth in the General Education requirements. The model also allows the VCCS colleges to meet their core competency reporting requirements without duplicating assessment efforts. Finally, the model will provide individual colleges with student learning outcomes data in the area of general education for the purpose of meeting the new general education guidelines set forth by SACS. The competency-based model allows individual colleges the freedom to align VCCS general education requirements, SCHEV core competencies and SACS general education requirements under one outcome-based initiative (Approved by the Advisory Council of Presidents, April 2006).
2
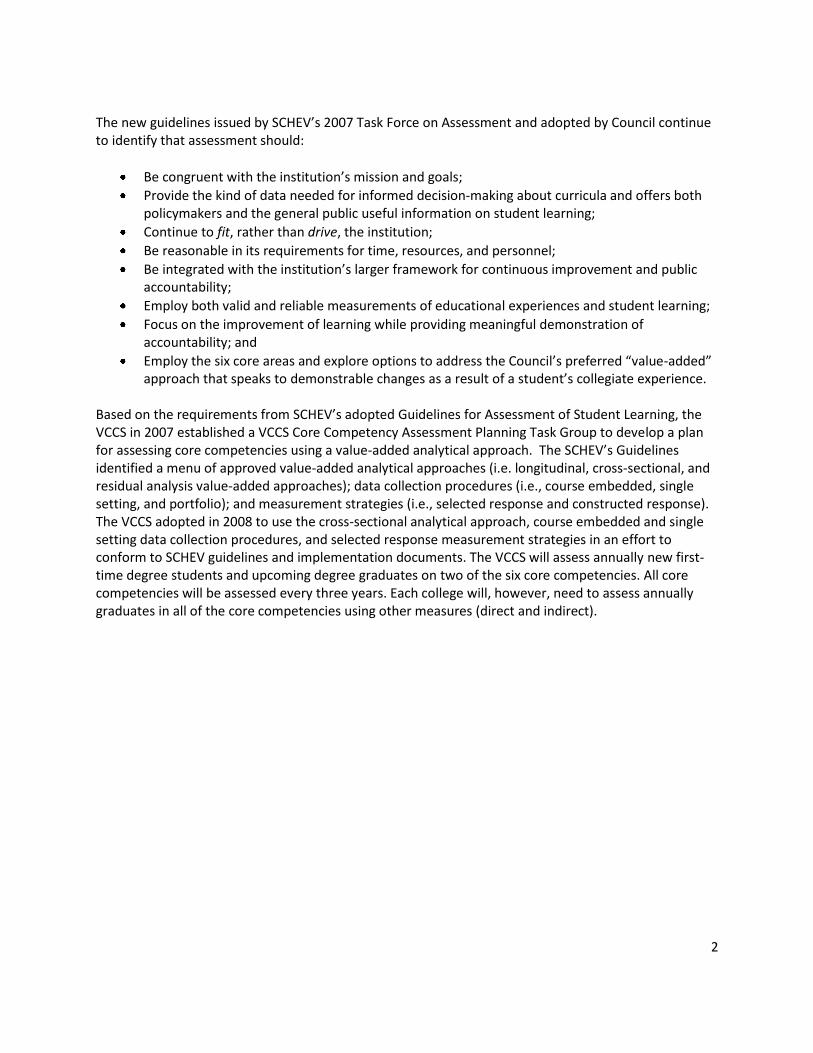
The new guidelines issued by SCHEV’s 2007 Task Force on Assessment and adopted by Council continue to identify that assessment should:
Be congruent with the institution’s mission and goals;
Provide the kind of data needed for informed decision-making about curricula and offers both policymakers and the general public useful information on student learning;
Continue to fit, rather than drive, the institution;
Be reasonable in its requirements for time, resources, and personnel;
Be integrated with the institution’s larger framework for continuous improvement and public accountability;
Employ both valid and reliable measurements of educational experiences and student learning;
Focus on the improvement of learning while providing meaningful demonstration of accountability; and
Employ the six core areas and explore options to address the Council’s preferred “value-added” approach that speaks to demonstrable changes as a result of a student’s collegiate experience.
Based on the requirements from SCHEV’s adopted Guidelines for Assessment of Student Learning, the VCCS in 2007 established a VCCS Core Competency Assessment Planning Task Group to develop a plan for assessing core competencies using a value-added analytical approach. The SCHEV’s Guidelines identified a menu of approved value-added analytical approaches (i.e. longitudinal, cross-sectional, and residual analysis value-added approaches); data collection procedures (i.e., course embedded, single setting, and portfolio); and measurement strategies (i.e., selected response and constructed response). The VCCS adopted in 2008 to use the cross-sectional analytical approach, course embedded and single setting data collection procedures, and selected response measurement strategies in an effort to conform to SCHEV guidelines and implementation documents. The VCCS will assess annually new first-time degree students and upcoming degree graduates on two of the six core competencies. All core competencies will be assessed every three years. Each college will, however, need to assess annually graduates in all of the core competencies using other measures (direct and indirect).
3
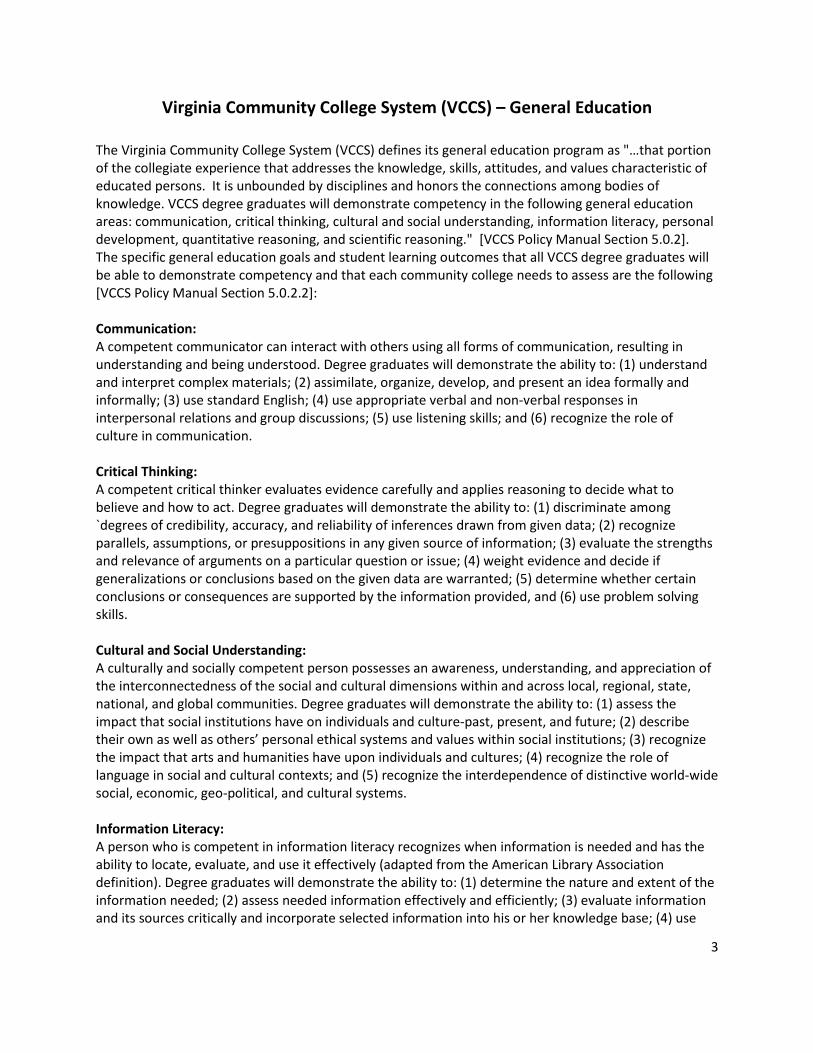
Virginia Community College System (VCCS) – General Education
The Virginia Community College System (VCCS) defines its general education program as "…that portion of the collegiate experience that addresses the knowledge, skills, attitudes, and values characteristic of educated persons. It is unbounded by disciplines and honors the connections among bodies of knowledge. VCCS degree graduates will demonstrate competency in the following general education areas: communication, critical thinking, cultural and social understanding, information literacy, personal development, quantitative reasoning, and scientific reasoning." [VCCS Policy Manual Section 5.0.2]. The specific general education goals and student learning outcomes that all VCCS degree graduates will be able to demonstrate competency and that each community college needs to assess are the following [VCCS Policy Manual Section 5.0.2.2]: Communication: A competent communicator can interact with others using all forms of communication, resulting in understanding and being understood. Degree graduates will demonstrate the ability to: (1) understand and interpret complex materials; (2) assimilate, organize, develop, and present an idea formally and informally; (3) use standard English; (4) use appropriate verbal and non-verbal responses in interpersonal relations and group discussions; (5) use listening skills; and (6) recognize the role of culture in communication. Critical Thinking: A competent critical thinker evaluates evidence carefully and applies reasoning to decide what to believe and how to act. Degree graduates will demonstrate the ability to: (1) discriminate among `degrees of credibility, accuracy, and reliability of inferences drawn from given data; (2) recognize parallels, assumptions, or presuppositions in any given source of information; (3) evaluate the strengths and relevance of arguments on a particular question or issue; (4) weight evidence and decide if generalizations or conclusions based on the given data are warranted; (5) determine whether certain conclusions or consequences are supported by the information provided, and (6) use problem solving skills. Cultural and Social Understanding: A culturally and socially competent person possesses an awareness, understanding, and appreciation of the interconnectedness of the social and cultural dimensions within and across local, regional, state, national, and global communities. Degree graduates will demonstrate the ability to: (1) assess the impact that social institutions have on individuals and culture-past, present, and future; (2) describe their own as well as others’ personal ethical systems and values within social institutions; (3) recognize the impact that arts and humanities have upon individuals and cultures; (4) recognize the role of language in social and cultural contexts; and (5) recognize the interdependence of distinctive world-wide social, economic, geo-political, and cultural systems. Information Literacy: A person who is competent in information literacy recognizes when information is needed and has the ability to locate, evaluate, and use it effectively (adapted from the American Library Association definition). Degree graduates will demonstrate the ability to: (1) determine the nature and extent of the information needed; (2) assess needed information effectively and efficiently; (3) evaluate information and its sources critically and incorporate selected information into his or her knowledge base; (4) use
4
information effectively, individually or as a member of a group, to accomplish a specific purpose; and (5) understand many of the economic, legal, and social issues surrounding the use of information and access and use information ethically and legally. Personal Development: An individual engaged in personal development strives for physical well-being and emotional maturity. Degree graduates will demonstrate the ability to: (1) develop and/or refine personal wellness goals; and (2) develop and/or enhance the knowledge, skills, and understanding to make informed academic, social, personal, career, and interpersonal decisions. Quantitative Reasoning: A person who is competent in quantitative reasoning possesses the skills and knowledge necessary to apply the use of logic, numbers, and mathematics to deal effectively with common problems and issues. A person who is quantitatively literate can use numerical, geometric, and measurement data and concepts, mathematical skills, and principles of mathematical reasoning to draw logical conclusions and to make well-reasoned decisions. Degree graduates will demonstrate the ability to: (1) use logical and mathematical reasoning within the context of various disciplines; (2) interpret and use mathematical formulas; (3) interpret mathematical models such as graphs, tables and schematics and draw inferences form them; (4) use graphical, symbolic, and numerical methods to analyze, organize, and interpret data; (5) estimate and consider answers to mathematical problems in order to determine reasonableness; and (6) represent mathematical information numerically, symbolically, and visually, using graphs and charts. Scientific Reasoning: A person who is competent in scientific reasoning adheres to a self-correcting system of inquire (the scientific method) and relies on empirical evidence to describe, understand, predict, and control natural phenomena. Degree graduates will demonstrate the ability to: (1) generate an empirically evidenced and logical argument; (2) distinguish a scientific argument from a non-scientific argument; (3) reason by deduction, induction and analogy; (4) distinguish between causal and correlational relationships; and (5) recognize methods of inquiry that lead to scientific knowledge.
5
VCCS Core Competencies The Virginia Community College System’s Report of the VCCS Task Force on Assessing Core Competencies, clarified and enhanced general education outcomes for students. Writing: In a written discourse the student will demonstrate the ability to state the purpose that addresses the writing task in a thoughtful way; organize content with effective transitions and effective beginning and ending paragraphs; develop logical and concrete ideas with effective use of paragraph structure; use appropriate and precise word choice; demonstrate few mechanical and usage errors with evidence of control of diction. Information Literacy: The information literate student will demonstrate the ability to determine the nature and extent of the information needed; access needed information effectively and efficiently; evaluate information and its sources critically and incorporate selected information into his/her knowledge base and value system; use information effectively to accomplish a specific purpose; and, understand many of the economic, legal, and social issues surrounding the use of information and access and use information ethically and legally. Quantitative Reasoning : The student will demonstrate the ability to use logical and mathematical reasoning within the context of various disciplines; interpret and use mathematical formulas; interpret mathematical models; use arithmetic, algebraic, geometric, and statistical models to solve problems; estimate and consider answers to mathematical problems in order to determine reasonableness; recognize and communicate the appropriate applications of mathematical and statistical models; and, represent mathematical information numerically, symbolically, and visually, using graphs and charts. Scientific Reasoning: The student will be able to generate an empirically evidenced and logical argument; distinguish a scientific argument from a non-scientific argument; reason by deduction, induction and analogy; and, distinguish between causal and correlational relationships. Critical Thinking: The student will demonstrate the ability to discriminate among degrees of truth or falsity of inferences drawn from given data; recognize unstated assumptions or presuppositions in given statements or assertions; determine whether certain conclusions necessarily follow from information; weigh evidence and decide if generalizations or conclusions based on given data are warranted; and, distinguish between arguments that are strong and relevant and those that are weak and irrelevant to a particular question at issue. Oral Communication: The student will demonstrate skill in idea development and verbal effectiveness by the use of language and the organization of ideas for a specific audience, setting and occasion and to achieve a purpose; nonverbal effectiveness, assuring that the nonverbal message supports and is consistent with the verbal message and responsiveness, communication skills modified based on verbal and nonverbal feedback.
6
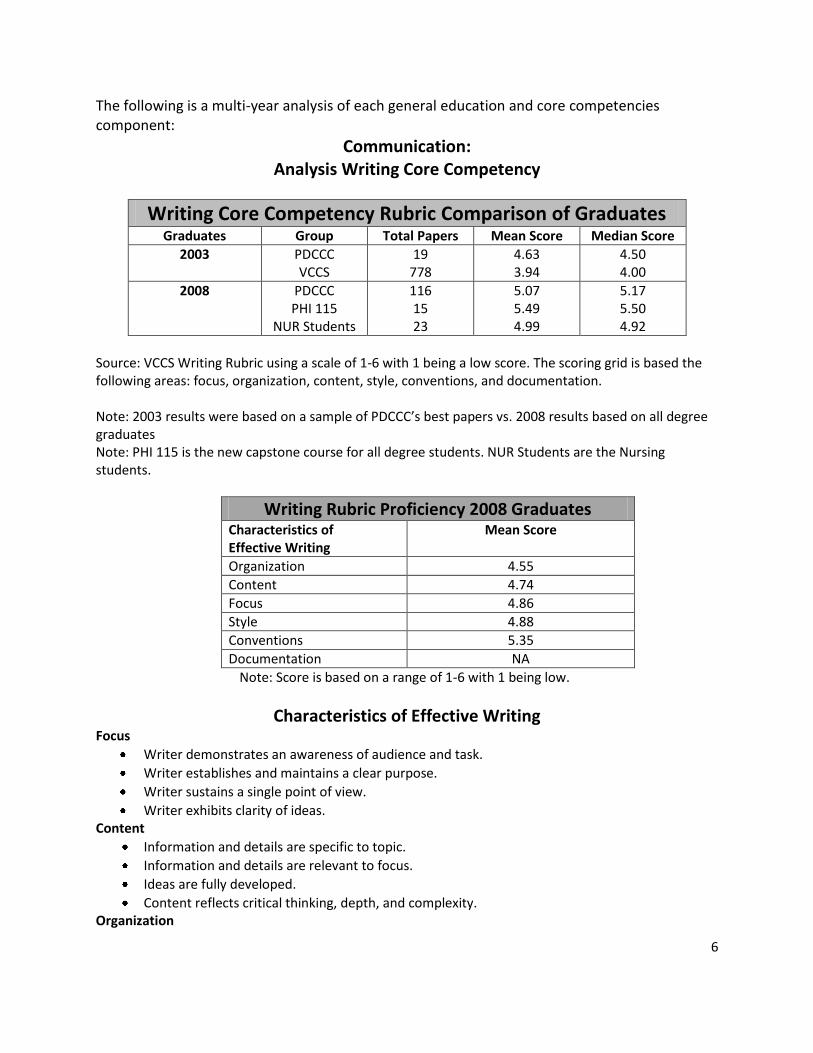
The following is a multi-year analysis of each general education and core competencies component:
Communication: Analysis Writing Core Competency
Writing Core Competency Rubric Comparison of Graduates Graduates Group Total Papers Mean Score Median Score
2003 PDCCC VCCS
19 778
4.63 3.94
4.50 4.00
2008 PDCCC PHI 115
NUR Students
116 15 23
5.07 5.49 4.99
5.17 5.50 4.92
Source: VCCS Writing Rubric using a scale of 1-6 with 1 being a low score. The scoring grid is based the following areas: focus, organization, content, style, conventions, and documentation. Note: 2003 results were based on a sample of PDCCC’s best papers vs. 2008 results based on all degree graduates Note: PHI 115 is the new capstone course for all degree students. NUR Students are the Nursing students.
Writing Rubric Proficiency 2008 Graduates Characteristics of Effective Writing
Mean Score
Organization 4.55
Content 4.74
Focus 4.86
Style 4.88
Conventions 5.35
Documentation NA
Note: Score is based on a range of 1-6 with 1 being low.
Characteristics of Effective Writing Focus
Writer demonstrates an awareness of audience and task.
Writer establishes and maintains a clear purpose.
Writer sustains a single point of view.
Writer exhibits clarity of ideas. Content
Information and details are specific to topic.
Information and details are relevant to focus.
Ideas are fully developed.
Content reflects critical thinking, depth, and complexity. Organization

7
Logical order or sequence is maintained.
Paragraphs deal with one subject.
Logical transitions are made within sentences and between paragraphs. Style
Writer uses precise language.
Writer uses effective word choice representing a range of vocabulary.
Writer demonstrates voice, tone, originality of language.
Writer uses variety of sentence structures, types, and lengths. Conventions
Irregular mechanics (spelling, capitalization, punctuation) are minimum and do not detract from meaning.
Usage (e.g., pronoun references, subject-verb agreement) errors are minimal and do not detract from meaning.
Sentence structure is standard, for the most part. Irregularities (such as fragments) may be intentional, as a matter of style.
Documentation
Material from outside sources is well-integrated and documented consistently and correctly
Consistent usage of citation style
Writing Core Competency 2010 Graduates
N=50
Rhetorical Knowledge
Critical Thinking
Organization Content & Clarity
Style Conventions
Developmental Completer
n=28
4.00 3.75 3.75 3.82 3.86 3.61
No Developmental
n=22
4.64 4.45 4.55 4.41 4.41 4.23
Total 4.28 4.06 4.10 4.08 4.10 3.88
Note: Based on 6 point rubric developed by VCCS English Faculty and Assessment Coordinators.
Paul D. Camp Community College STAGE Testing General
Education
1999 2000 2001 2002 2003 2010
Communication 7.58 7.52 7.25 6.75 7.16 6.89
Note: STAGE test was developed by IR staff members from the Virginia Community College System (VCCS) in 1999 and revised in 2010. The score ranges from 1-10 with 1 being low. Benchmark is set at 5.
8
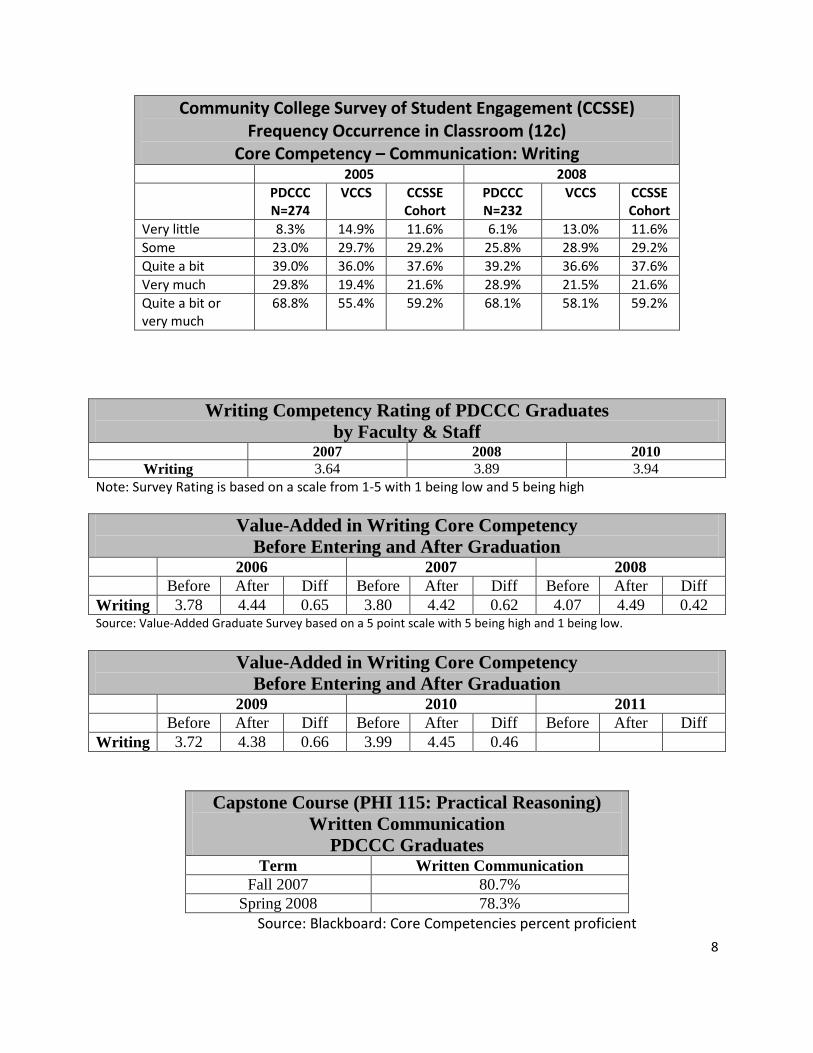
Community College Survey of Student Engagement (CCSSE) Frequency Occurrence in Classroom (12c)
Core Competency – Communication: Writing 2005 2008
PDCCC N=274
VCCS CCSSE Cohort
PDCCC N=232
VCCS CCSSE Cohort
Very little 8.3% 14.9% 11.6% 6.1% 13.0% 11.6%
Some 23.0% 29.7% 29.2% 25.8% 28.9% 29.2%
Quite a bit 39.0% 36.0% 37.6% 39.2% 36.6% 37.6%
Very much 29.8% 19.4% 21.6% 28.9% 21.5% 21.6%
Quite a bit or very much
68.8% 55.4% 59.2% 68.1% 58.1% 59.2%
Writing Competency Rating of PDCCC Graduates
by Faculty & Staff 2007 2008 2010
Writing 3.64 3.89 3.94
Note: Survey Rating is based on a scale from 1-5 with 1 being low and 5 being high
Value-Added in Writing Core Competency
Before Entering and After Graduation 2006 2007 2008
Before After Diff Before After Diff Before After Diff
Writing 3.78 4.44 0.65 3.80 4.42 0.62 4.07 4.49 0.42 Source: Value-Added Graduate Survey based on a 5 point scale with 5 being high and 1 being low.
Value-Added in Writing Core Competency
Before Entering and After Graduation 2009 2010 2011
Before After Diff Before After Diff Before After Diff
Writing 3.72 4.38 0.66 3.99 4.45 0.46
Capstone Course (PHI 115: Practical Reasoning)
Written Communication
PDCCC Graduates
Term Written Communication
Fall 2007 80.7%
Spring 2008 78.3%
Source: Blackboard: Core Competencies percent proficient

9
Capstone Course (PHI 115) Writing Communication Core Competencies Assessments
% Proficiency and Mean Score (0-3) Using Rubric
Core Competency & Objectives 2009 2010 Action Plan
Writing Communication 74.2% 2.23
84.6% 2.55
Focus: State purpose that addresses the writing task in a thoughtful way. Graduates will achieve at least 80% proficiency.
67.8% 2.00
100% 2.91
For 2010, research, analyze, and modify material in PHI 115 to convey how to establish a purpose that addresses the task. Reevaluate material that focuses on developing complex writings.
Organization: Organize content with effective transitions and effective beginning and ending paragraphs with 80% proficiency. Graduates will achieve at least 80% proficiency.
70.2% 2.16
30% 0.91
For 2010, redesign various assignments in PHI 115 to clearly demonstrate the correlation of organization and transitioning of concepts.
Content: Develop logical and concrete ideas with effective use of paragraph structure. Graduates will achieve at least 80% proficiency.
77.8% 2.30
100% 2.92
For 2010, research, analyze and modify material in PHI 115 to convey how to establish a purpose that addresses developing valid ideas and applying them effectively.
Style: Use appropriate and precise word choice where language and sentence structure are alive, mature, and varied. Graduates will achieve at least 80% proficiency.
72.6% 2.20
100% 3.00
For 2010, develop a list of vocabulary words and identify the common usage of the words and research strategies related to thesaurus application in writing for the PHI 115 class.
Conventions: Demonstrate few mechanical and usage errors, with evidence of control of diction. Graduates will achieve at least 80% proficiency.
82.8% 2.48
100% 3.00
For 2010, design lessons that promote more interaction between the instructor and students in the PHI 115 course and utilize the discussion board to design lessons that promote sampling.
Note: ratings are based on a 0-3 point scale with 3 being the highest.
10
Results 2007-2008: According to the VCCS writing rubric, PDCCC writing skills were equal to or higher than the VCCS benchmarked in 2003 (4.63 vs. 3.94), however, the college’s mean score in 2003 was based on a sample of the best papers. In 2008, the writing scores consisted of all degree graduates. In 2008, its mean score was 5.07. The 2008 graduates who also took the new capstone course (PHI 115) scored even better with 5.49. The weakest area in writing competency appears to be in the area of organization. According to the 2008 Community College Survey of Student Engagement (CCSSE), the frequency of occurrence in the classroom of writing clearly and effectively has decreased slightly from 2005 (68.1% quite a bit or very much in 2008 vs. 68.8% for 2005). However, the level of occurrence is higher than the VCCS averages (55.4% in 2005 and 58.1% in 2008) and the CCSSE averages (56.9% in 2005 and 59.2% in 2008). The perception by faculty and staff (using survey results), show that the writing skills of its graduates have improved in 2008 vs. 2007 (3.89 vs. 3.64). This is reinforced by the graduate value-added (Pre-Post) survey which show the perception of skill level when students first entering the college and at graduation from 2006-2008. There was an improvement in all three years. The writing skill level at graduation had increased from 4.42 in 2007 to 4.49 in 2008. The college had recognized for the past few years that PDCCC competencies in all of the core competency areas needed improvement, especially when compared to the VCCS as a benchmark. As a result, the college established a capstone course (PHI 115) in 2006-07. Changes to improve the course in 2007-08 included, handouts and booklets developed in each core competency module to assist students and web-sites were added to each core competency module so that students could visit and acclimate themselves to terms, principles, and formulas associated with specific subjects. Each student is also invited to sit in on courses related to any module/subject that he or she may have experienced difficulty in satisfactorily complying with the requirements (The courses must be instructed by one of the team teachers). The faculty teaching the course also advocates the use of PDCCC Library, PDCCC Learning Assistance Center (LATC), and tutorial modules developed by the VCCS and PDCCC. As a result, the teaching pedagogy and the proficiency level in the capstone have improved from 2006 (data was lost for comparison due to blackboard update). The proficiency level for 2007-08 has remained about the same with 80.7% in fall 2007 and 78.3% in spring 2008. 1st Cycle Action Plan (Closing the Loop): The college needs to continue to improve on its capstone course. The capstone team of instructors needs to use rubrics for each core competency in order to identify weaknesses in any of the skill levels under each core competency. The capstone instructors can use the three rubrics developed by the VCCS (written communication, oral communication, and information literacy), but the team needs to create new ones for quantitative reasoning, scientific reasoning, and critical thinking.
11
Each fall term, all of the English 111 classes need to be assessing written communication using rubrics to identify specific weaknesses and to develop action plans for improvement. These course assessments will be completed by the end of term and sent to their dean and to the Director of Assessment & IR. A major point that the deans need to emphasize with their faculty is that assessment of writing
competency is not just an evaluation of ENG 111 but of all disciplines. As a college, scholarly
writing across the curriculum has to be integrated in other courses. Each discipline must work
collaboratively to ensure our students will be successful and encouraged to use the writing
rubric in evaluating writing assignments.
The General Education Committee will identify other courses which have primary objectives under written communication and decide which ones should have the instructor assess written communication skill levels. The college will also develop written communication modules to be placed on the college’s web site to assist faculty teaching the capstone course and any other faculty requiring written assignments for their course. All lead faculty should survey employers of their graduates on skill levels related to core competencies. The Director of Assessment & IR has an employer survey online available for lead faculty use. Results 2008-2009: In the graduate value-added (Pre-Post) survey which show the perception of skill level when students first entering the college and at graduation from 2006-2009. There had been an improvement each year from 2006-2008. In 2009, there was a slight decrease from 4.49 in 2008 to 4.38 in 2009. However the value added in 2009 increase 0.66 points vs. 0.42 points in 2008. In the capstone course, PHI 115, graduates writing proficiency was 74.2%. This was below the goal of all graduating achieving 80% proficiency. The weakest sub-category was in focus with 67.8% proficiency. The strongest sub-category was in conventions with 82.8% proficiency. Other sub-categories included organization (70.2%), content (77.8%), and style (72.6%). 2st Cycle Action Plan (Closing the Loop): Over the past few years, English faculty at PDCCC have taken numerous steps to improve written
communication skills. English faculty have employed use of rubrics to evaluate students' writing,
integrated writing assignments with an interdisciplinary approach, increased the cut-score for student
enrollment in English 111, adopted Patterns for College Writing - A Rhetorical Reader and Guide by
Kirszner and Mandell, which has exemplars of various genres of writing, participated and taught writing
workshops, and incorporated more technological resources to improve writing.

12
Based on the findings of students' proficiency levels in written communication, English faculty will align
all English courses with Student Learning Outcomes, research and analyze best practices to improve
writing, develop specific strategies geared toward PDCCC's student population that will enhance writing,
and research the development and implementation of English 111 variations which may enhance levels
of proficiency in written communication.
The faculty should continue to tweak the writing rubric. Changes in the capstone course, PHI 115, as noted in the table above should be implemented. Results 2009-2010: From the writing rubric developed by the Virginia Community College System (VCCS), 2010 graduates who did not need any developmental courses performed better than graduates who had taken a developmental course. Overall, graduates were weakest in writing conventions (3.88). This was also a decrease from 2008 graduates with a mean score of 5.35 on a six-point scale. The strongest scores were in rhetorical knowledge (4.28). On the STAGE test which was developed by VCCS Assessment Coordinators, 2010 graduates scored a 6.89 which was above the benchmark score set at 5.00. On the Faculty and Staff Survey, the 2010 graduates were rated 3.94 on a 5-point scale. This was an increase from 2008 graduates with 3.89 and the 2007 graduates with 3.64. The Graduate Survey based on a 5-point scale with 1 being low showed value-added for the 2010 graduates. Their score increased from 3.99 upon entering the college to 4.45 at graduation. The 2010 graduates also showed an increase from the 2009 graduates’ score of 4.38. The Capstone Course based on a 80% proficiency rubric showed that the 2010 graduates were proficient in writing communication skills 84.6% of the time vs. 74.2% in 2009. The rubric also showed the 2010 graduates had a rating of 2.55 vs. 2.23 (based on a 0-3 scale with 3 being the highest). The weakest area for 2010 graduates was in the area of organizing content with effective transitions and effective beginning and ending paragraphs. 3rd Cycle Action Plan (Closing the Loop): To improve student success in organization for written communication, use of effective
transitions, and development of beginning and ending paragraphs, English faculty used They
Say, I Say by Gerald Graff and Cathy Birkenstein, which contains sentence templates and
transitional words that show students how to juxtapose them within their writing to help with
coherence and organization. In addition, faculty provided numerous exemplars of effective and
ineffective paragraphs/essays that provided students concrete examples of weak and strong
written expressions. These analytical skills were employed as students wrote their own papers.
13
Finally, faculty reviewed the writing rubric with students and demonstrated how organization is
evaluated in their writing; moreover, faculty required outlines for student papers, which also
aided students in developing their writing.
In the science courses, four current event writings were required in Biology 101. In Biology 142,
instructors enhanced the use of the Learning Resource Center for research and writing. This was done by
increasing the previous requirement of two writing units to four. BIO 270, 150, 205, NAS 125 and GOL
111 required mandatory project writings. Although the previously assigned presentations sufficed, the
new requirements were aimed at improving students organization of content and cohesion of ideas.
14
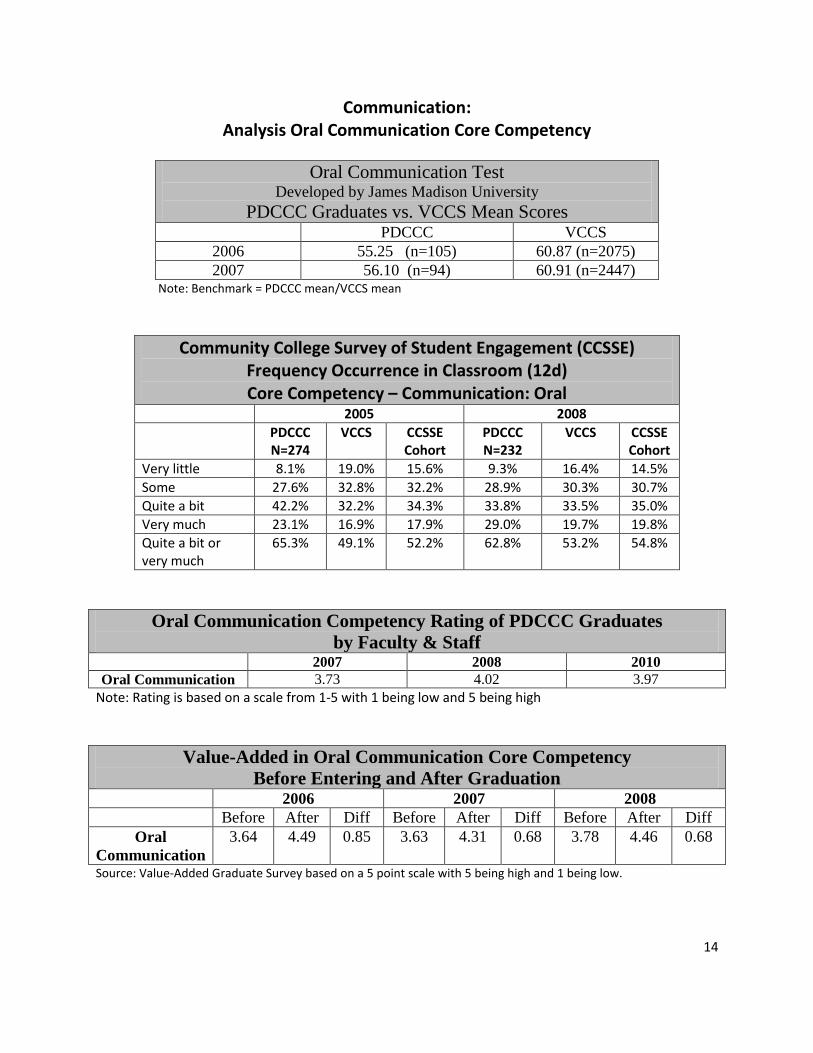
Communication: Analysis Oral Communication Core Competency
Oral Communication Test Developed by James Madison University
PDCCC Graduates vs. VCCS Mean Scores
PDCCC VCCS
2006 55.25 (n=105) 60.87 (n=2075)
2007 56.10 (n=94) 60.91 (n=2447) Note: Benchmark = PDCCC mean/VCCS mean
Community College Survey of Student Engagement (CCSSE) Frequency Occurrence in Classroom (12d) Core Competency – Communication: Oral
2005 2008
PDCCC N=274
VCCS CCSSE Cohort
PDCCC N=232
VCCS CCSSE Cohort
Very little 8.1% 19.0% 15.6% 9.3% 16.4% 14.5%
Some 27.6% 32.8% 32.2% 28.9% 30.3% 30.7%
Quite a bit 42.2% 32.2% 34.3% 33.8% 33.5% 35.0%
Very much 23.1% 16.9% 17.9% 29.0% 19.7% 19.8%
Quite a bit or very much
65.3% 49.1% 52.2% 62.8% 53.2% 54.8%
Oral Communication Competency Rating of PDCCC Graduates
by Faculty & Staff 2007 2008 2010
Oral Communication 3.73 4.02 3.97
Note: Rating is based on a scale from 1-5 with 1 being low and 5 being high
Value-Added in Oral Communication Core Competency
Before Entering and After Graduation 2006 2007 2008
Before After Diff Before After Diff Before After Diff
Oral
Communication
3.64 4.49 0.85 3.63 4.31 0.68 3.78 4.46 0.68
Source: Value-Added Graduate Survey based on a 5 point scale with 5 being high and 1 being low.
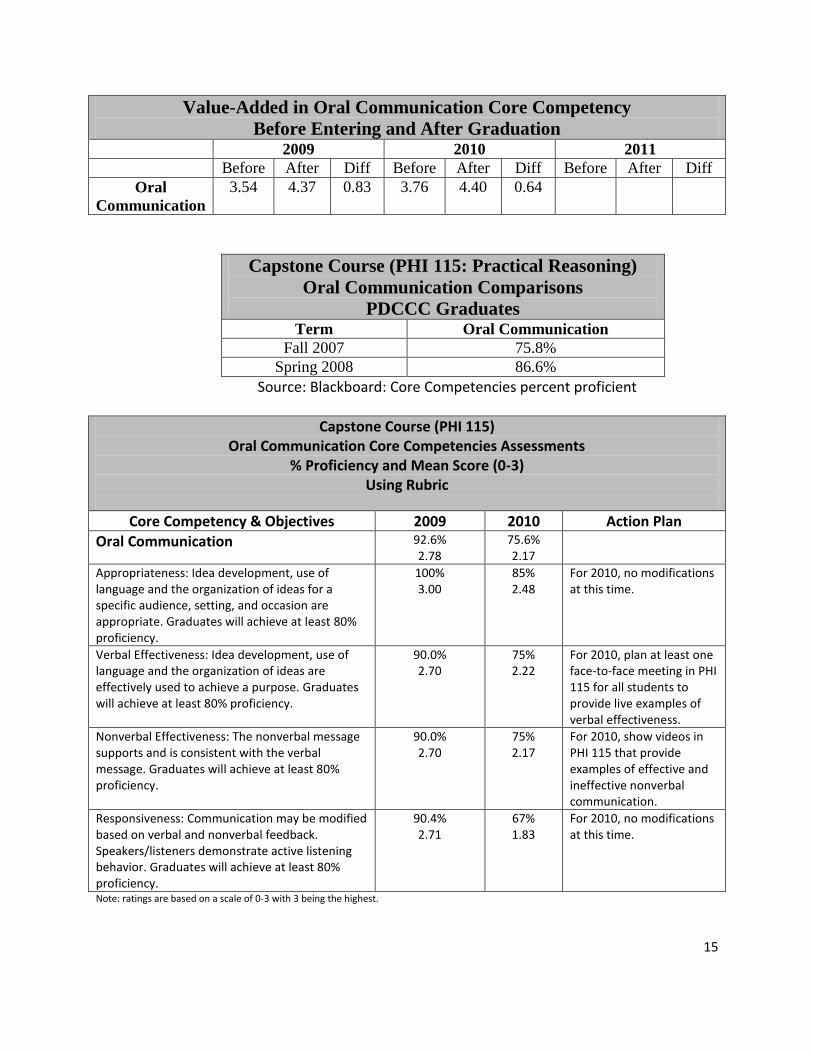
15
Value-Added in Oral Communication Core Competency
Before Entering and After Graduation 2009 2010 2011
Before After Diff Before After Diff Before After Diff
Oral
Communication
3.54 4.37 0.83 3.76 4.40 0.64
Capstone Course (PHI 115: Practical Reasoning)
Oral Communication Comparisons
PDCCC Graduates
Term Oral Communication
Fall 2007 75.8%
Spring 2008 86.6%
Source: Blackboard: Core Competencies percent proficient
Capstone Course (PHI 115) Oral Communication Core Competencies Assessments
% Proficiency and Mean Score (0-3) Using Rubric
Core Competency & Objectives 2009 2010 Action Plan
Oral Communication 92.6% 2.78
75.6% 2.17
Appropriateness: Idea development, use of language and the organization of ideas for a specific audience, setting, and occasion are appropriate. Graduates will achieve at least 80% proficiency.
100% 3.00
85% 2.48
For 2010, no modifications at this time.
Verbal Effectiveness: Idea development, use of language and the organization of ideas are effectively used to achieve a purpose. Graduates will achieve at least 80% proficiency.
90.0% 2.70
75% 2.22
For 2010, plan at least one face-to-face meeting in PHI 115 for all students to provide live examples of verbal effectiveness.
Nonverbal Effectiveness: The nonverbal message supports and is consistent with the verbal message. Graduates will achieve at least 80% proficiency.
90.0% 2.70
75% 2.17
For 2010, show videos in PHI 115 that provide examples of effective and ineffective nonverbal communication.
Responsiveness: Communication may be modified based on verbal and nonverbal feedback. Speakers/listeners demonstrate active listening behavior. Graduates will achieve at least 80% proficiency.
90.4% 2.71
67% 1.83
For 2010, no modifications at this time.
Note: ratings are based on a scale of 0-3 with 3 being the highest.
16
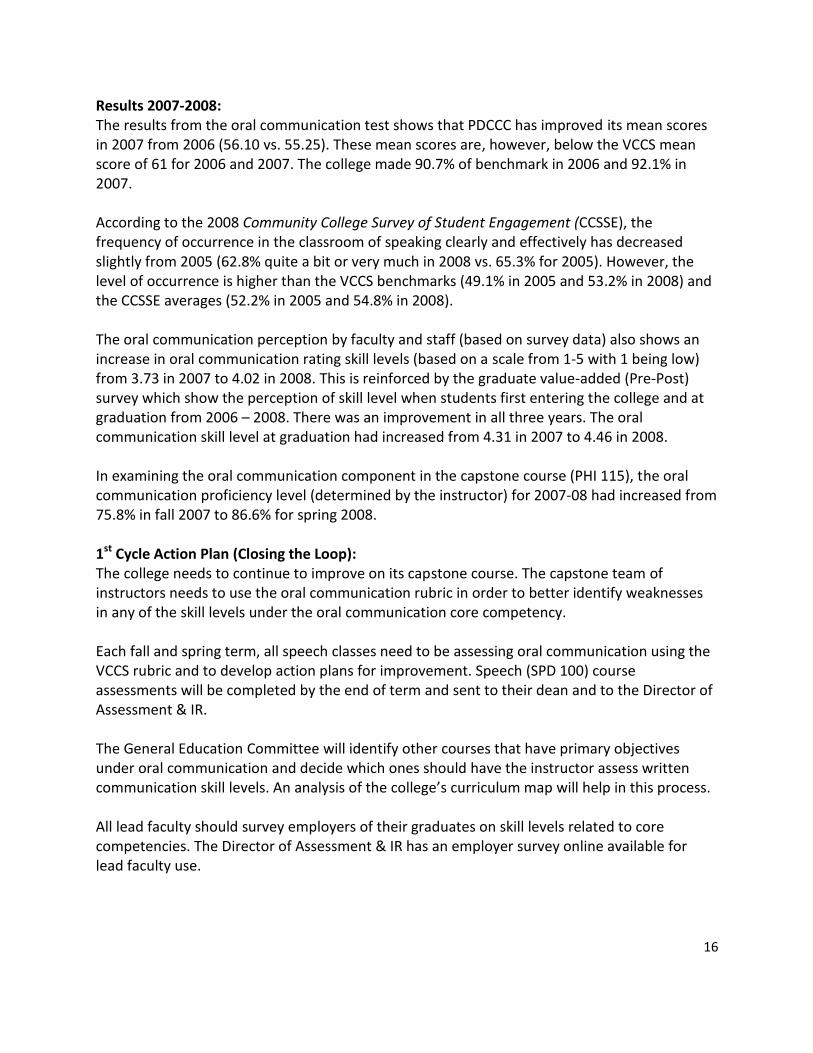
Results 2007-2008: The results from the oral communication test shows that PDCCC has improved its mean scores in 2007 from 2006 (56.10 vs. 55.25). These mean scores are, however, below the VCCS mean score of 61 for 2006 and 2007. The college made 90.7% of benchmark in 2006 and 92.1% in 2007. According to the 2008 Community College Survey of Student Engagement (CCSSE), the frequency of occurrence in the classroom of speaking clearly and effectively has decreased slightly from 2005 (62.8% quite a bit or very much in 2008 vs. 65.3% for 2005). However, the level of occurrence is higher than the VCCS benchmarks (49.1% in 2005 and 53.2% in 2008) and the CCSSE averages (52.2% in 2005 and 54.8% in 2008). The oral communication perception by faculty and staff (based on survey data) also shows an increase in oral communication rating skill levels (based on a scale from 1-5 with 1 being low) from 3.73 in 2007 to 4.02 in 2008. This is reinforced by the graduate value-added (Pre-Post) survey which show the perception of skill level when students first entering the college and at graduation from 2006 – 2008. There was an improvement in all three years. The oral communication skill level at graduation had increased from 4.31 in 2007 to 4.46 in 2008. In examining the oral communication component in the capstone course (PHI 115), the oral communication proficiency level (determined by the instructor) for 2007-08 had increased from 75.8% in fall 2007 to 86.6% for spring 2008. 1st Cycle Action Plan (Closing the Loop): The college needs to continue to improve on its capstone course. The capstone team of instructors needs to use the oral communication rubric in order to better identify weaknesses in any of the skill levels under the oral communication core competency. Each fall and spring term, all speech classes need to be assessing oral communication using the VCCS rubric and to develop action plans for improvement. Speech (SPD 100) course assessments will be completed by the end of term and sent to their dean and to the Director of Assessment & IR. The General Education Committee will identify other courses that have primary objectives under oral communication and decide which ones should have the instructor assess written communication skill levels. An analysis of the college’s curriculum map will help in this process. All lead faculty should survey employers of their graduates on skill levels related to core competencies. The Director of Assessment & IR has an employer survey online available for lead faculty use.
17
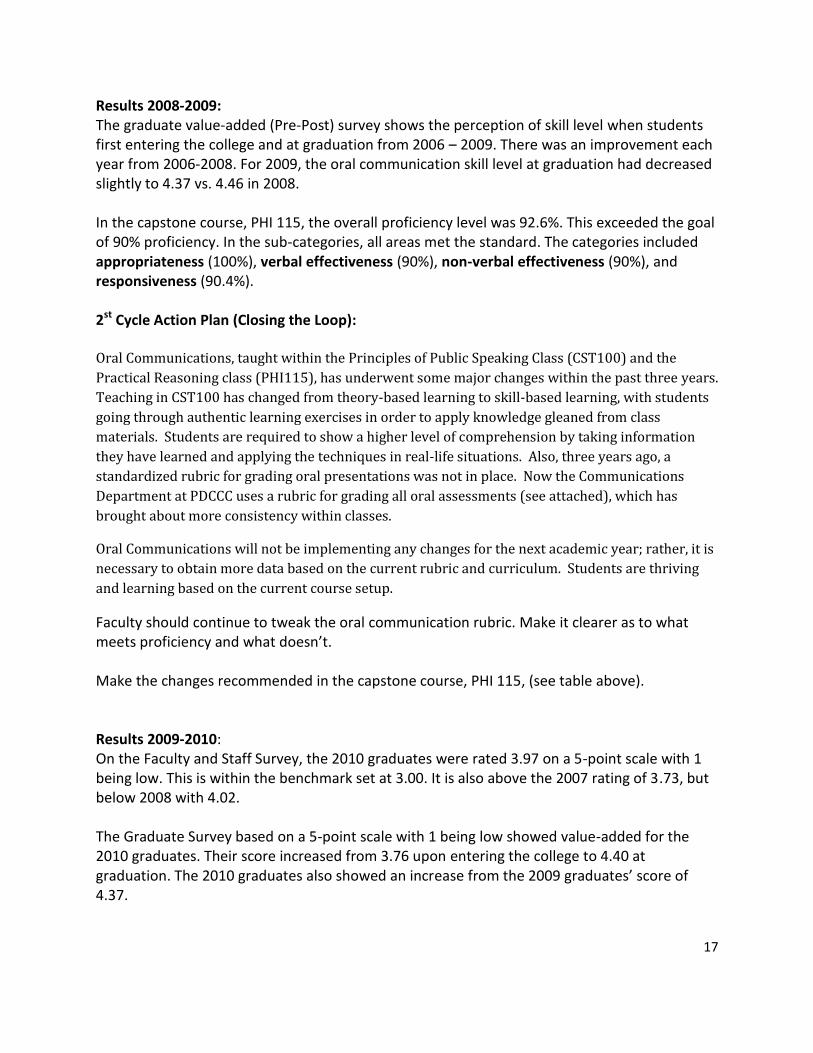
Results 2008-2009: The graduate value-added (Pre-Post) survey shows the perception of skill level when students first entering the college and at graduation from 2006 – 2009. There was an improvement each year from 2006-2008. For 2009, the oral communication skill level at graduation had decreased slightly to 4.37 vs. 4.46 in 2008. In the capstone course, PHI 115, the overall proficiency level was 92.6%. This exceeded the goal of 90% proficiency. In the sub-categories, all areas met the standard. The categories included appropriateness (100%), verbal effectiveness (90%), non-verbal effectiveness (90%), and responsiveness (90.4%). 2st Cycle Action Plan (Closing the Loop): Oral Communications, taught within the Principles of Public Speaking Class (CST100) and the
Practical Reasoning class (PHI115), has underwent some major changes within the past three years.
Teaching in CST100 has changed from theory-based learning to skill-based learning, with students
going through authentic learning exercises in order to apply knowledge gleaned from class
materials. Students are required to show a higher level of comprehension by taking information
they have learned and applying the techniques in real-life situations. Also, three years ago, a
standardized rubric for grading oral presentations was not in place. Now the Communications
Department at PDCCC uses a rubric for grading all oral assessments (see attached), which has
brought about more consistency within classes.
Oral Communications will not be implementing any changes for the next academic year; rather, it is
necessary to obtain more data based on the current rubric and curriculum. Students are thriving
and learning based on the current course setup.
Faculty should continue to tweak the oral communication rubric. Make it clearer as to what meets proficiency and what doesn’t. Make the changes recommended in the capstone course, PHI 115, (see table above). Results 2009-2010: On the Faculty and Staff Survey, the 2010 graduates were rated 3.97 on a 5-point scale with 1 being low. This is within the benchmark set at 3.00. It is also above the 2007 rating of 3.73, but below 2008 with 4.02. The Graduate Survey based on a 5-point scale with 1 being low showed value-added for the 2010 graduates. Their score increased from 3.76 upon entering the college to 4.40 at graduation. The 2010 graduates also showed an increase from the 2009 graduates’ score of 4.37.
18
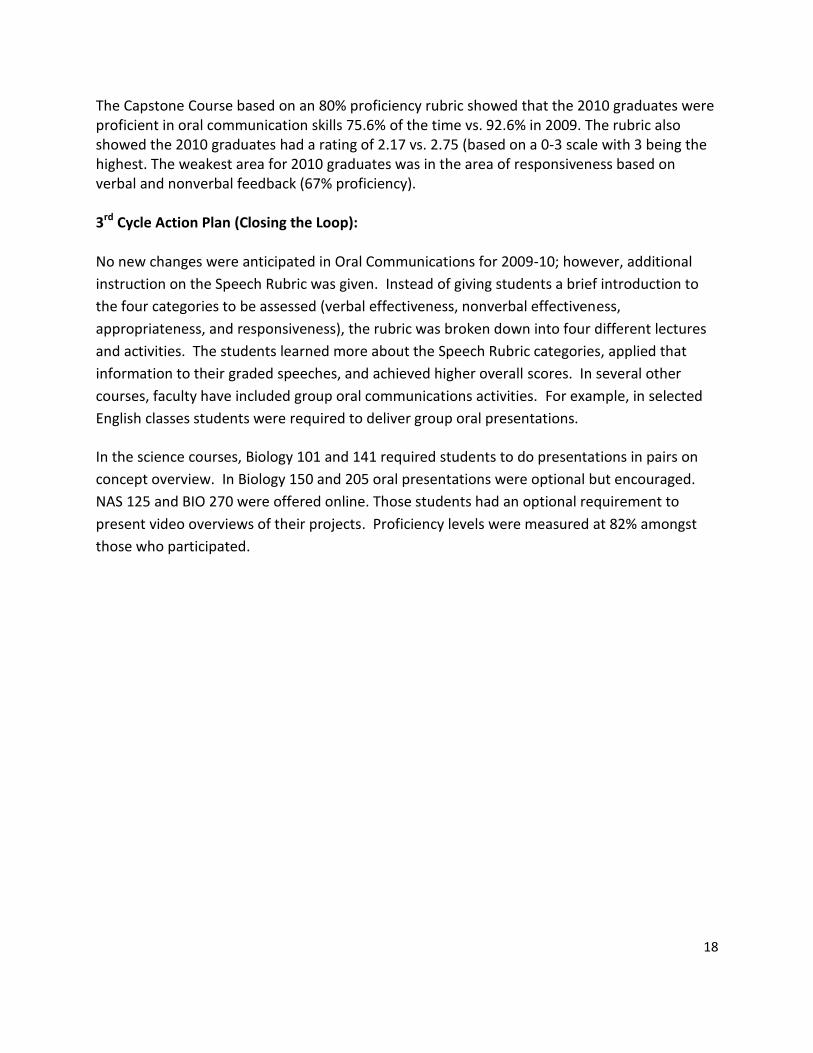
The Capstone Course based on an 80% proficiency rubric showed that the 2010 graduates were proficient in oral communication skills 75.6% of the time vs. 92.6% in 2009. The rubric also showed the 2010 graduates had a rating of 2.17 vs. 2.75 (based on a 0-3 scale with 3 being the highest. The weakest area for 2010 graduates was in the area of responsiveness based on verbal and nonverbal feedback (67% proficiency). 3rd Cycle Action Plan (Closing the Loop): No new changes were anticipated in Oral Communications for 2009-10; however, additional
instruction on the Speech Rubric was given. Instead of giving students a brief introduction to
the four categories to be assessed (verbal effectiveness, nonverbal effectiveness,
appropriateness, and responsiveness), the rubric was broken down into four different lectures
and activities. The students learned more about the Speech Rubric categories, applied that
information to their graded speeches, and achieved higher overall scores. In several other
courses, faculty have included group oral communications activities. For example, in selected
English classes students were required to deliver group oral presentations.
In the science courses, Biology 101 and 141 required students to do presentations in pairs on
concept overview. In Biology 150 and 205 oral presentations were optional but encouraged.
NAS 125 and BIO 270 were offered online. Those students had an optional requirement to
present video overviews of their projects. Proficiency levels were measured at 82% amongst
those who participated.
19
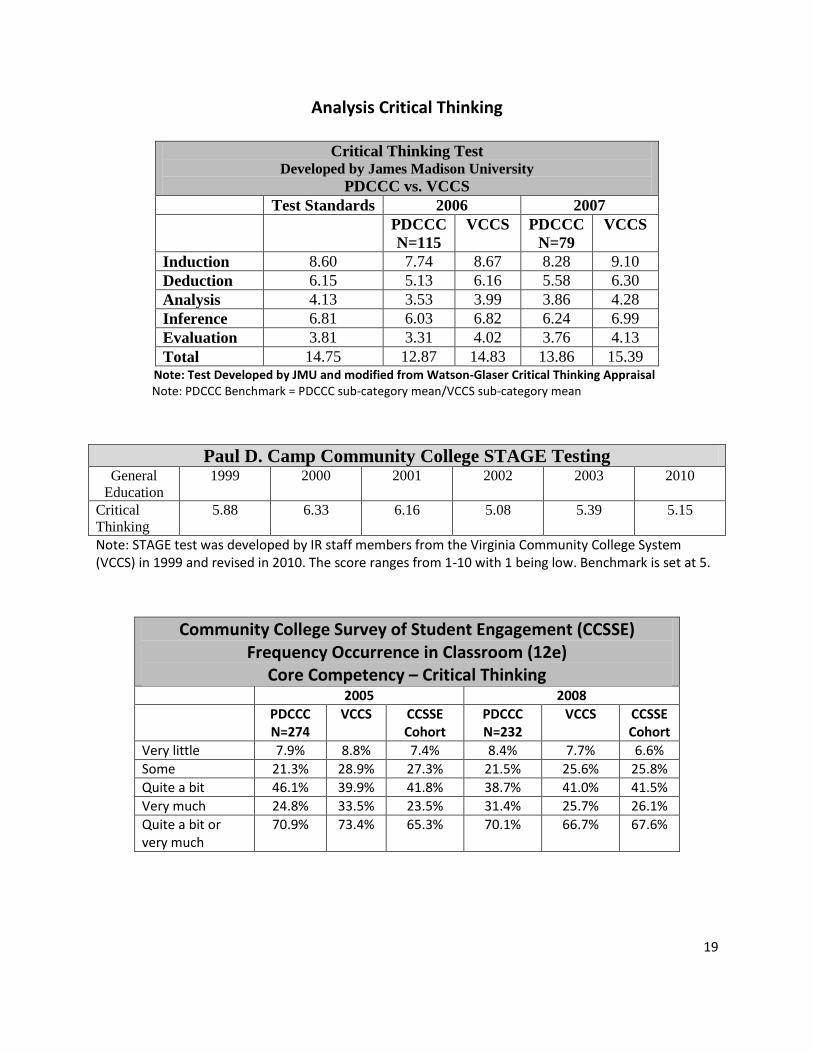
Analysis Critical Thinking
Critical Thinking Test Developed by James Madison University
PDCCC vs. VCCS
Test Standards 2006 2007
PDCCC
N=115
VCCS PDCCC
N=79
VCCS
Induction 8.60 7.74 8.67 8.28 9.10
Deduction 6.15 5.13 6.16 5.58 6.30
Analysis 4.13 3.53 3.99 3.86 4.28
Inference 6.81 6.03 6.82 6.24 6.99
Evaluation 3.81 3.31 4.02 3.76 4.13
Total 14.75 12.87 14.83 13.86 15.39 Note: Test Developed by JMU and modified from Watson-Glaser Critical Thinking Appraisal Note: PDCCC Benchmark = PDCCC sub-category mean/VCCS sub-category mean
Paul D. Camp Community College STAGE Testing General
Education
1999 2000 2001 2002 2003 2010
Critical
Thinking
5.88 6.33 6.16 5.08 5.39 5.15
Note: STAGE test was developed by IR staff members from the Virginia Community College System (VCCS) in 1999 and revised in 2010. The score ranges from 1-10 with 1 being low. Benchmark is set at 5.
Community College Survey of Student Engagement (CCSSE) Frequency Occurrence in Classroom (12e)
Core Competency – Critical Thinking
2005 2008
PDCCC N=274
VCCS CCSSE Cohort
PDCCC N=232
VCCS CCSSE Cohort
Very little 7.9% 8.8% 7.4% 8.4% 7.7% 6.6%
Some 21.3% 28.9% 27.3% 21.5% 25.6% 25.8%
Quite a bit 46.1% 39.9% 41.8% 38.7% 41.0% 41.5%
Very much 24.8% 33.5% 23.5% 31.4% 25.7% 26.1%
Quite a bit or very much
70.9% 73.4% 65.3% 70.1% 66.7% 67.6%
20
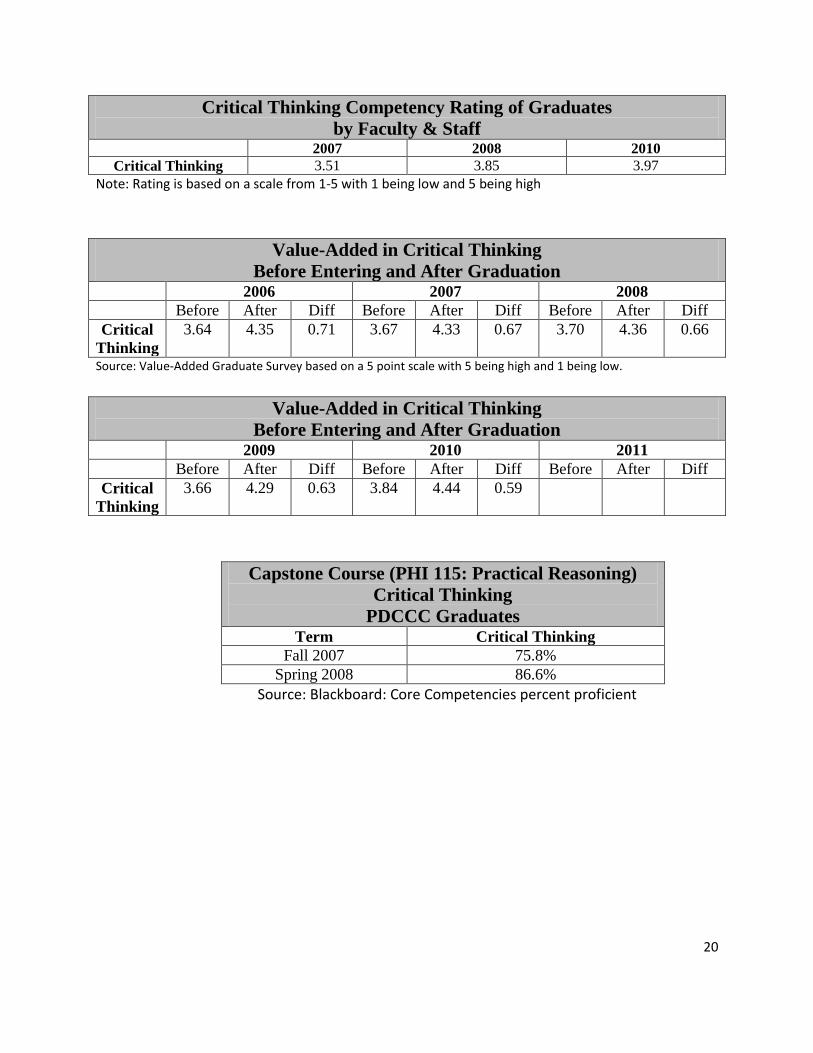
Critical Thinking Competency Rating of Graduates
by Faculty & Staff 2007 2008 2010
Critical Thinking 3.51 3.85 3.97
Note: Rating is based on a scale from 1-5 with 1 being low and 5 being high
Value-Added in Critical Thinking
Before Entering and After Graduation 2006 2007 2008
Before After Diff Before After Diff Before After Diff
Critical
Thinking
3.64 4.35 0.71 3.67 4.33 0.67 3.70 4.36 0.66
Source: Value-Added Graduate Survey based on a 5 point scale with 5 being high and 1 being low.
Value-Added in Critical Thinking
Before Entering and After Graduation 2009 2010 2011
Before After Diff Before After Diff Before After Diff
Critical
Thinking
3.66 4.29 0.63 3.84 4.44 0.59
Capstone Course (PHI 115: Practical Reasoning)
Critical Thinking
PDCCC Graduates
Term Critical Thinking
Fall 2007 75.8%
Spring 2008 86.6%
Source: Blackboard: Core Competencies percent proficient
21
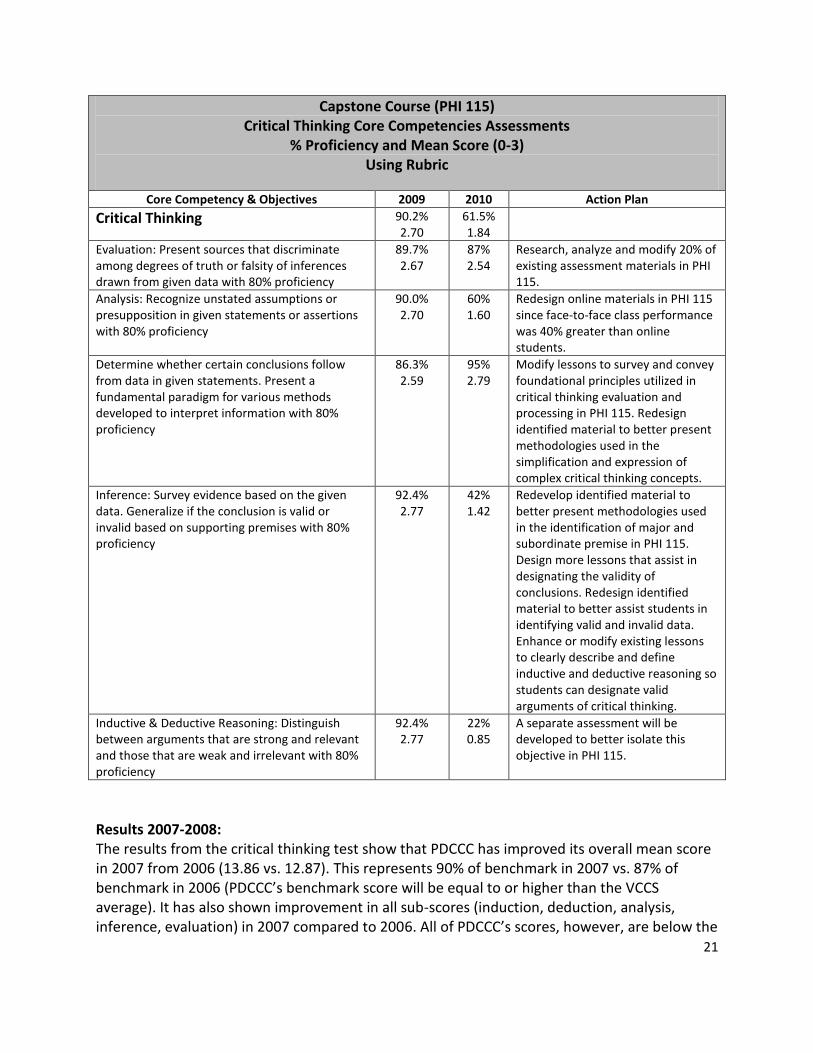
Capstone Course (PHI 115) Critical Thinking Core Competencies Assessments
% Proficiency and Mean Score (0-3) Using Rubric
Core Competency & Objectives 2009 2010 Action Plan
Critical Thinking 90.2% 2.70
61.5% 1.84
Evaluation: Present sources that discriminate among degrees of truth or falsity of inferences drawn from given data with 80% proficiency
89.7% 2.67
87% 2.54
Research, analyze and modify 20% of existing assessment materials in PHI 115.
Analysis: Recognize unstated assumptions or presupposition in given statements or assertions with 80% proficiency
90.0% 2.70
60% 1.60
Redesign online materials in PHI 115 since face-to-face class performance was 40% greater than online students.
Determine whether certain conclusions follow from data in given statements. Present a fundamental paradigm for various methods developed to interpret information with 80% proficiency
86.3% 2.59
95% 2.79
Modify lessons to survey and convey foundational principles utilized in critical thinking evaluation and processing in PHI 115. Redesign identified material to better present methodologies used in the simplification and expression of complex critical thinking concepts.
Inference: Survey evidence based on the given data. Generalize if the conclusion is valid or invalid based on supporting premises with 80% proficiency
92.4% 2.77
42% 1.42
Redevelop identified material to better present methodologies used in the identification of major and subordinate premise in PHI 115. Design more lessons that assist in designating the validity of conclusions. Redesign identified material to better assist students in identifying valid and invalid data. Enhance or modify existing lessons to clearly describe and define inductive and deductive reasoning so students can designate valid arguments of critical thinking.
Inductive & Deductive Reasoning: Distinguish between arguments that are strong and relevant and those that are weak and irrelevant with 80% proficiency
92.4% 2.77
22% 0.85
A separate assessment will be developed to better isolate this objective in PHI 115.
Results 2007-2008: The results from the critical thinking test show that PDCCC has improved its overall mean score in 2007 from 2006 (13.86 vs. 12.87). This represents 90% of benchmark in 2007 vs. 87% of benchmark in 2006 (PDCCC’s benchmark score will be equal to or higher than the VCCS average). It has also shown improvement in all sub-scores (induction, deduction, analysis, inference, evaluation) in 2007 compared to 2006. All of PDCCC’s scores, however, are below the
22
VCCS mean scores in all categories and below the test standards in all areas. PDCCC’s benchmark comparison with the VCCS improved in all sub-categories from 2006 to 2007 (induction was 89.3% in 2006 vs. 91.0% in 2007; deduction was 83.3% in 2006 vs. 88.6% in 2007; analysis was 88.5% in 2006 vs. 90.2% in 2007; inference was 88.4% in 2006 vs. 89.3% in 2007; evaluation was 82.3% in 2006 vs. 91.0% in 2007; and the total was 86.8% in 2006 vs. 90.0% in 2007). According to the 2008 Community College Survey of Student Engagement (CCSSE), the frequency of occurrence in the classroom of thinking critically and analytically has decreased slightly from 2005 (70.1% quite a bit or very much in 2008 vs. 70.9% for 2005). The level of occurrence was below the VCCS benchmarks in 2005 (70.9% vs. VCCS 73.4%), but higher in 2008 (70.1% vs. VCCS 61.7%). The frequency of occurrence in the classroom was higher in 2005 and in 2008 compared to the CCSSE cohorts (70.9% vs. CCSSE 65.3% in 2005 and 70.1% vs. CCSSE 67.6% in 2008). The critical thinking perception by faculty and staff (based on survey data) show an increase in critical thinking rating skill level (based on a scale from 1-5 with 1 being low) from 3.51 in 2007 to 3.85 in 2008. This may be due to the introduction of a capstone course which reinforces all areas of gen ed. This is reinforced by the graduate value-added (Pre-Post) survey which show the perception of skill level when students first entering the college and at graduation from 2006 to 2008. In all three years, graduates felt that there was significant improvement in skill level between when they first entered the college and at graduation. In evaluating the graduation data, there was also a slight improvement from 2007 to 2008. The critical thinking skill level at graduation had increased from 4.33 in 2007 to 4.36 in 2008. In examining the critical thinking component in the capstone course (PHI 115), the critical thinking proficiency level (determined by the instructor) from 2007-2008 had increased from 75.8% in fall 2007 to 86.6% for spring 2008. 1st Cycle Action Plan (Closing the Loop): The college needs to continue to improve on its capstone course. The capstone team of instructors needs to develop a critical thinking rubric in order to better identify weaknesses in sub-categories of critical thinking (induction, deduction, analysis, inference, and evaluation). Each fall and spring term, the critical thinking rubric should be used in the PHI 115 class assessment and in the development of action plans for course improvement. When the class action plan is completed at the end of term, it will be sent to their dean and to the Director of Assessment & IR. The General Education Committee will identify other courses that have primary objectives under critical thinking and decide which ones should have the instructor assess critical thinking skill levels. An analysis of the college’s curriculum map will help in this process.
23
The college should develop a critical thinking module and post it on the college’s web site so that faculty will be able to use it in their classes when they have critical thinking assignments. All lead faculty should survey employers of their graduates on skill levels related to core competencies. The Director of Assessment & IR has an employer survey online available for lead faculty use. Results 2008-2009 The graduate value-added (Pre-Post) survey shows the perception of critical thinking skill level when students first entering the college and at graduation from 2006 to 2009. In all four years, graduates felt that there was significant improvement in skill level between when they first entered the college and at graduation. In evaluating the graduation data, there was, however, a slight decrease from 2008 to 2009 (4.36 vs. 4.29). In the capstone course, PHI 115, graduates met the goal of 80% proficiency in all categories. The overall proficiency level was 90.2%. The sub-categories included evaluation (89.7%), analysis (90%), inference (92.4%), and inductive and deductive reasoning (92.4%). For fall 2009, however, analysis and inductive and deductive reasoning fell below 80%. 2st Cycle Action Plan (Closing the Loop): Within the previous three years, the Practical Reasoning Committee and coordinator have instituted a variety of methods to improve the efficiency and effectiveness of critical thinking skills through the capstone course, (PHI-115, Practical Reasoning). Initially, the course was structured in a community learning/team teaching format. The methodology transitioned from six instructors to three instructors and then to one instructor. The CLEP manual was used as the course book and 85% of the selective resources were used to enhance its limitation. As a result of fluctuating performance scores and to promote cohesiveness and consistency of the course, “Think” has been chosen to serve as the course manual. Within the school term of 2009-2010, rubrics have been added in the course grading and assessment methods to better identify strengths and weaknesses in student learning outcomes. The capstone course has expanded from being offered only during the fall semester to being offered online. PHI-115 has also been added to the summer semester academic calendar. Data collected from each revision encourages the following actions: (1) PHI-115 has been added to all academic degree curriculum of PDCCC; (2) coordinator of the course will communicate directly with each department chair instead of a committee to make improvements on student learning outcomes success by graduates; (3) more instructive presentations will be added to blackboard exercises, quizzes, and test to measure student learning outcomes; and (4) changes will be implemented as identified by the data within
the capstone course. The critical thinking rubric developed last year will continue to be tweaked.
The PHI 115 capstone course will be modified to address weaknesses in students proficiencies (see action plan in table above). Additional samples and tutorial information, related to the analysis component and determining conclusions and proficiently interpreting data component will be incorporated into the PHI-115 critical thinking module to enhance student proficiency. A request will also be made to faculty requesting that a concerted effort be made to emphasize strengthening the two components across the curriculum.

24
Results 2009-2010: On the STAGE test which was developed by Virginia Community College (VCCS) Assessment Coordinators, 2010 graduates scored 5.15 which was above the benchmark score set at 5.00. This was above the 2002 graduates’ score of 5.08. On the Faculty and Staff Survey, the 2010 graduates were rated 3.97 on a 5-point scale with 1 being low. This was an increase from 2008 graduates with 3.85 and the 2007 graduates with 3.51. This was also above the benchmark set at 3.00. The Graduate Survey based on a 5-point scale with 1 being low showed value-added for the 2010 graduates. Their score increased from 3.84 upon entering the college to 4.44 at graduation. The 2010 graduates also showed an increase from the 2009 graduates’ score of 4.29. The Capstone Course based on an 80% proficiency rubric showed that the 2010 graduates were proficient in critical thinking skills 61.5% of the time vs. 90.2% in 2009. The rubric also showed the 2010 graduates had a rating of 1.84 vs. 2.70 (based on a 0-3 scale with 3 being the highest). The weakest areas for 2010 graduates was in the area of analysis (60% proficiency), Inference (42% proficiency) and Induction & Deductive Reasoning (22% proficiency). 3rd Cycle Action Plan (Closing the Loop): A complete analysis of the progressive approach taken over the calendar years used to promote a holistic critical thinking assessment was performed within the third cycle of study. All data within the critical thinking competency module was re-analyzed and assessment outcomes were heavily scrutinized. As a result, over ten percent (10%) of the assessment material was modified, exercise questions, quiz questions, and test questions. Twenty percent (20%) of Critical Thinking Quiz One (1) was enhanced. Presently, it contains case study arguments that require each student to accurately employ good critical thinking engagement of analysis, interpretation, evaluation, inferences, explanation, and cognitive thought. Twenty-five percent (25%) of student related engagement was enhanced. Group sessions were included to promote collaborative transference of ideas and alternative methods of logical reasoning. An additional ten percent (10%) of directive instructions and interpretive examples were include within the critical thinking competency module. The modifications were incorporate to address weaknesses in students proficiencies indicated in previously generated report tables. All enhancements were employed in an effort to ensure that progress is maintained in monitoring assessments and corrective actions are initiated in accordance with the PDCCC’s goal of improving student learning outcomes. In all life science courses, critical thinking, scientific reasoning and quantitative skills were taught as
lecture concepts and lab activities. Although college wide data for critical thinking scores were rather
weak, science students had better than a 75% proficiency in the area of inductive and deductive
reasoning.
25
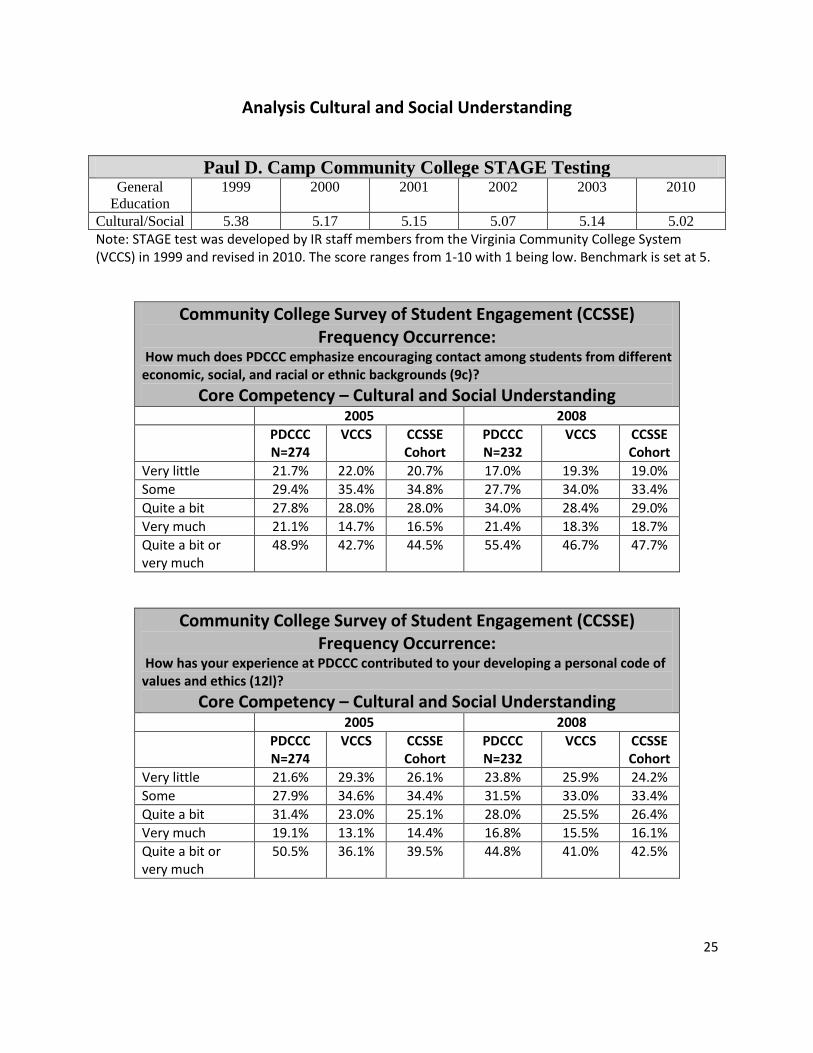
Analysis Cultural and Social Understanding
Paul D. Camp Community College STAGE Testing General
Education
1999 2000 2001 2002 2003 2010
Cultural/Social 5.38 5.17 5.15 5.07 5.14 5.02
Note: STAGE test was developed by IR staff members from the Virginia Community College System (VCCS) in 1999 and revised in 2010. The score ranges from 1-10 with 1 being low. Benchmark is set at 5.
Community College Survey of Student Engagement (CCSSE) Frequency Occurrence:
How much does PDCCC emphasize encouraging contact among students from different economic, social, and racial or ethnic backgrounds (9c)?
Core Competency – Cultural and Social Understanding
2005 2008
PDCCC N=274
VCCS CCSSE Cohort
PDCCC N=232
VCCS CCSSE Cohort
Very little 21.7% 22.0% 20.7% 17.0% 19.3% 19.0%
Some 29.4% 35.4% 34.8% 27.7% 34.0% 33.4%
Quite a bit 27.8% 28.0% 28.0% 34.0% 28.4% 29.0%
Very much 21.1% 14.7% 16.5% 21.4% 18.3% 18.7%
Quite a bit or very much
48.9% 42.7% 44.5% 55.4% 46.7% 47.7%
Community College Survey of Student Engagement (CCSSE) Frequency Occurrence:
How has your experience at PDCCC contributed to your developing a personal code of values and ethics (12l)?
Core Competency – Cultural and Social Understanding
2005 2008
PDCCC N=274
VCCS CCSSE Cohort
PDCCC N=232
VCCS CCSSE Cohort
Very little 21.6% 29.3% 26.1% 23.8% 25.9% 24.2%
Some 27.9% 34.6% 34.4% 31.5% 33.0% 33.4%
Quite a bit 31.4% 23.0% 25.1% 28.0% 25.5% 26.4%
Very much 19.1% 13.1% 14.4% 16.8% 15.5% 16.1%
Quite a bit or very much
50.5% 36.1% 39.5% 44.8% 41.0% 42.5%
26
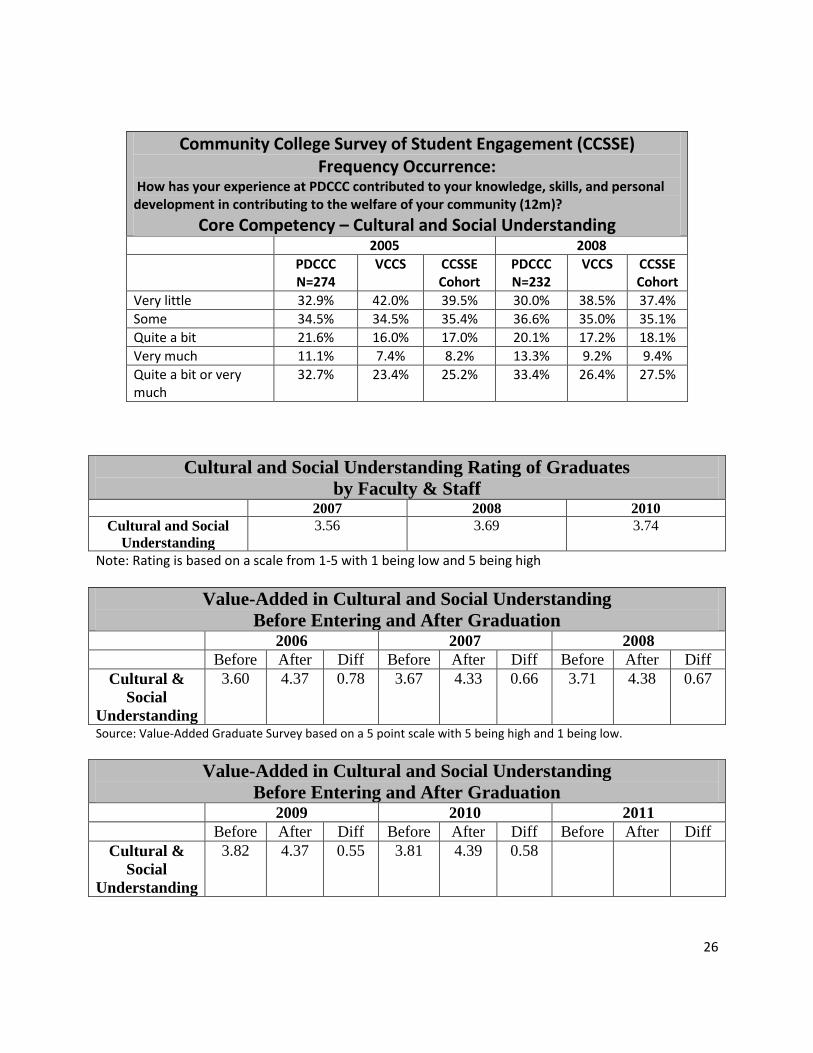
Community College Survey of Student Engagement (CCSSE) Frequency Occurrence:
How has your experience at PDCCC contributed to your knowledge, skills, and personal development in contributing to the welfare of your community (12m)?
Core Competency – Cultural and Social Understanding
2005 2008
PDCCC N=274
VCCS CCSSE Cohort
PDCCC N=232
VCCS CCSSE Cohort
Very little 32.9% 42.0% 39.5% 30.0% 38.5% 37.4%
Some 34.5% 34.5% 35.4% 36.6% 35.0% 35.1%
Quite a bit 21.6% 16.0% 17.0% 20.1% 17.2% 18.1%
Very much 11.1% 7.4% 8.2% 13.3% 9.2% 9.4%
Quite a bit or very much
32.7% 23.4% 25.2% 33.4% 26.4% 27.5%
Cultural and Social Understanding Rating of Graduates
by Faculty & Staff 2007 2008 2010
Cultural and Social
Understanding
3.56 3.69 3.74
Note: Rating is based on a scale from 1-5 with 1 being low and 5 being high
Value-Added in Cultural and Social Understanding
Before Entering and After Graduation 2006 2007 2008
Before After Diff Before After Diff Before After Diff
Cultural &
Social
Understanding
3.60 4.37 0.78 3.67 4.33 0.66 3.71 4.38 0.67
Source: Value-Added Graduate Survey based on a 5 point scale with 5 being high and 1 being low.
Value-Added in Cultural and Social Understanding
Before Entering and After Graduation 2009 2010 2011
Before After Diff Before After Diff Before After Diff
Cultural &
Social
Understanding
3.82 4.37 0.55 3.81 4.39 0.58
27
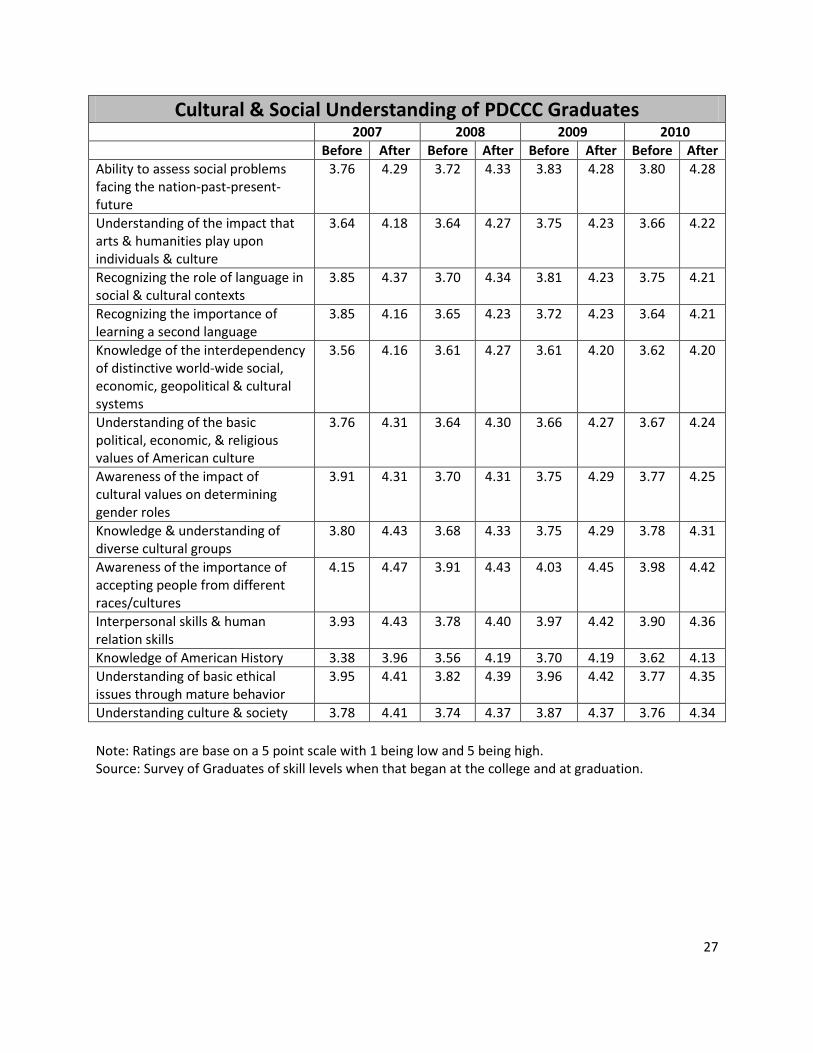
Cultural & Social Understanding of PDCCC Graduates 2007 2008 2009 2010
Before After Before After Before After Before After
Ability to assess social problems facing the nation-past-present-future
3.76 4.29 3.72 4.33 3.83 4.28 3.80 4.28
Understanding of the impact that arts & humanities play upon individuals & culture
3.64 4.18 3.64 4.27 3.75 4.23 3.66 4.22
Recognizing the role of language in social & cultural contexts
3.85 4.37 3.70 4.34 3.81 4.23 3.75 4.21
Recognizing the importance of learning a second language
3.85 4.16 3.65 4.23 3.72 4.23 3.64 4.21
Knowledge of the interdependency of distinctive world-wide social, economic, geopolitical & cultural systems
3.56 4.16 3.61 4.27 3.61 4.20 3.62 4.20
Understanding of the basic political, economic, & religious values of American culture
3.76 4.31 3.64 4.30 3.66 4.27 3.67 4.24
Awareness of the impact of cultural values on determining gender roles
3.91 4.31 3.70 4.31 3.75 4.29 3.77 4.25
Knowledge & understanding of diverse cultural groups
3.80 4.43 3.68 4.33 3.75 4.29 3.78 4.31
Awareness of the importance of accepting people from different races/cultures
4.15 4.47 3.91 4.43 4.03 4.45 3.98 4.42
Interpersonal skills & human relation skills
3.93 4.43 3.78 4.40 3.97 4.42 3.90 4.36
Knowledge of American History 3.38 3.96 3.56 4.19 3.70 4.19 3.62 4.13
Understanding of basic ethical issues through mature behavior
3.95 4.41 3.82 4.39 3.96 4.42 3.77 4.35
Understanding culture & society 3.78 4.41 3.74 4.37 3.87 4.37 3.76 4.34
Note: Ratings are base on a 5 point scale with 1 being low and 5 being high. Source: Survey of Graduates of skill levels when that began at the college and at graduation.

28
Cultural and Social Events
Student Support Services (SSS) Grant
2006-2007
Fall 2006 Jamestown Visit – Centennial Celebration
Hampton University Museum – Hampton, VA
Spring 2007 Maya Angelou Symposium – Chrysler Hall, Norfolk, VA
MoMix: The Illusionist, Christopher Newport University, Newport
News, VA
2007-2008
Fall 2007 General Assembly Session – Richmond, VA
Tour of Washington, DC
Spring 2008 African American Cultural Arts Center – Baltimore, MD: Trip
cancelled because of problems with van
Tania Issaac Dance Troupe – Suffolk, VA
2008-2009
Fall 2008 African American Cultural Arts center—Baltimore, MD
Spring 2009 Tour of Washington, DC
2009-2010
Fall 2009 The Color Purple Play—Chrysler Hall, Norfolk, VA, TCC Roper
center-Hurrah Players
Spring 2010 National Cathedral, Arlington National Cemetery, The National Mall,
Washington, DC
Note: SSS sponsors, as required in its grant, two cultural events a semester
Student Activities also sponsored a number of activities each term which has supported cultural and social events. These have included the following:
September– Constitution Day event: This event takes place every year in the Distance Learning
room in order to make it available to all students at the same time. This event highlights the
impact of the U.S. Constitution and its impact on our past, present and future.
October – Pink Ribbons – Available throughout October: This event allows for social awareness
and honors the survivors, those who are currently fighting and those who lost the battle with
breast cancer. It also shows support for the ongoing battle to find the cure.
November - Angel Tree: For this event the students and staff choose to take a name off of the
tree and therefore take an active role in providing a gift for Christmas to a child who needs it,
bringing awareness to students about those who are less fortunate and each individual’s impact
on one another.
December – Angel Tree gifts picked up by Salvation Army: The students and staff have already
turned the gifts in to me and I will take them to the Salvation Army.
29
February– Nathan Richardson poetry reading: Mr. Richardson is a local poet who is self
published and performs readings for various community and four year colleges. For this event
Mr. Richardson read original poems and discussed important issues within the African-American
community. The purpose of this event was to bring social awareness, recognize the impact that
the arts have on a culture and the role of language, in this case poetry, in social and cultural
context.
February – Black History Month Film Series: This film series, in honor of Black history Month,
was intended to point out the impact of past events on the present and future as well as
recognizing the differences in personal and social ethical systems and values between the past
and present.
April – Earth day. Recycling Drive. Recycling boxes available on both campuses for entire
week: This event was intended to bring social awareness on our impact on the environment
while also allowing students the opportunity to easily recycle and do their part for the
environment.
September– Club Drive: This week is used to get information to students about the clubs and
activities available throughout Paul d. Camp Community College. This event not only fits into
the Cultural and Social Understanding category by providing students with the ability to join the
clubs that deal with the arts and humanities, but also in the Personal Development category by
giving students club information as well as information on how to create a club allowing students
to make their own informed decisions about their extracurricular participation at Paul D. Camp
Community College.
Results 2007-08: The graduate value-added (Pre-Post) cultural and social understanding survey show the perception of skill level when students first entering the college and at graduation from 2007 and 2008. In both years, graduates felt that there was significant improvement in cultural and social understanding skill level between when they first entered the college and at graduation. In 2007 and 2008, students’ weakest area was in knowledge of American history. At graduation, knowledge of American history had improved, but still the weakest area compared to the other categories. Overall, 2006 - 2008 graduates felt that their skill level in cultural and social understanding has improved since first enrolling at PDCCC. Skill level at graduation has remained fairly constant (4.37 in 2006 to 4.33 in 2007, and 4.38 in 2008). According to the 2008 Community College Survey of Student Engagement (CCSSE), the frequency of occurrence on how PDCCC emphasizes encouraging contact among students from different economic, social, and racial or ethnic backgrounds has increased from 2005 (55.4% quite a bit or very much in 2008 vs. 48.9% for 2005). Having workshops for faculty on diversity may have been a factor. The level of occurrence was also higher than the VCCS (42.7% in 2005 and 46.7% in 2008) and the CCSSE averages (44.5% in 2005 and 47.7% in 2008).
30
According to the 2008 Community College Survey of Student Engagement (CCSSE), the frequency of occurrence on how the students experiences at PDCCC contributed to their personal code of values and ethics has decreased slightly from 2005 (44.8% quite a bit or very much in 2008 vs. 50.5% for 2005). However, the level of occurrence is higher than the VCCS averages (36.1% in 2005 and 41.0% in 2008) and the CCSSE averages (39.5% in 2005 and 42.5% in 2008). According to the 2008 Community College Survey of Student Engagement (CCSSE), the frequency of occurrence on how the students experiences at PDCCC contributed to their contributing to the welfare of their community has increased from 2005 (33.4% quite a bit or very much in 2008 vs. 32.7% for 2005). Having the new nursing program which promotes community service projects may have been a factor. The level of occurrence was also higher than the VCCS (23.4% in 2005 and 26.4% in 2008) and the CCSSE averages (25.2% in 2005 and 27.5% in 2008). The cultural and social understanding perception by faculty and staff (based on survey data) show an increase in cultural and social understanding rating skill level (based on a scale from 1-5 with 1 being low) from 3.56 in 2007 to 3.64 in 2008. The Student Support Services (SSS) continues to have two cultural events each term for their grant students and student activities continues to have a number of cultural and social events for all students. 1st Cycle Action Plan (Closing the Loop): Since knowledge of American history appears to be the weakness area for entering students and for graduates, the college should focus more activities on American history. Student activities needs to document more on evaluation of cultural and social events, especially those related to American history. Each fall and spring term, the American History (HIS 121 and HIS 122) class should use a rubric to do class assessment and an action plan for course improvement. When the class action plan is completed at the end of the term, it will be sent to their dean and to the Director of Assessment & IR. Results 2008-09: The graduate value-added (Pre-Post) cultural and social understanding survey show the perception of skill level when students first entering the college and at graduation from 2006-2009. In all four years, graduates felt that there was significant improvement in cultural and social understanding skill level between when they first entered the college and at graduation. Skill level at graduation has remained fairly constant (4.37 in 2006, 4.33 in 2007, 4.38 in 2008, and 4.37 in 2009).
31
When looking at the sub-categories of cultural and social understanding, students’ weakest area was in knowledge of American history. This was true for 2007 (3.96), 2008 (4.19), and 2009 (4.19).
2st Cycle Action Plan (Closing the Loop): Over the past few years there has been limited change in cultural and social understanding. The value-
added pre-post testing of graduates has been positive over the past few years. The weakness area
appears to be in the knowledge of American history. The textbook to teach cultural and social
understanding was changed two years ago. The instructor has integrated more multi-media in
instruction. The instructor used “U Tube” mini lectures to enhance learning. Blackboard is used to
communicate with students online.
Essay question exams and research papers measures the applied knowledge of students in the subject
area. The students’ skills in analysis of information have improved. The students synthesized and draw
conclusions using the resource materials and assigned texts to formula opinions and apply knowledge
obtained from reading and independent research. This is evidenced by the improved test scores
received by students in the social science courses this year.
The social science instructors will increase the use of multi-media technologies to aide in instructing
students. Current events, recent video documentaries, movies on historical events will be utilized to
enhance instruction. Also course notes and internet source references will be available to students
through online connections.
Results 2009-10: On the STAGE test which was developed by the Virginia Community College (VCCS) Assessment Coordinators, 2010 graduates scored a 5.02 which was above the benchmark score set at 5.00. On the Faculty and Staff Survey, the 2010 graduates were rated 3.74 on a 5-point scale with 1 being low. This is above the benchmark set at 3.00. It is also an increase from 2008 graduates’ score of 3.69. The Graduate Survey based on a 5-point scale with 1 being low showed value-added for the 2010 graduates. Their score increased from 3.81 upon entering the college to 4.39 at graduation. The 2010 graduates also showed an increase from the 2009 graduates’ score of 4.37. The weakest area appears to be in knowledge of American History. This was also the weakest area in 2009 and 2008. Clubs and Student Support Services continue to offer activities to support cultural and social understanding.
32
3rd Cycle Action Plan (Closing the Loop):
Students’ grades in American History (History 121 and History 122) improved in the Fall 2010 semester.
The average grade range in the class was 80-82 (B average) as oppose to the average grade range of 75-
78 (C+ average) in the previous semesters. Students were encouraged and conducted group study
sessions. Also group review of lectured materials was conducted before each of the (three) exams.
Students took more responsibility for their own learning which resulted in a more social and cultural
understanding of American History.
The social science instructors continued the use of multi-media technologies to aide in instructing
students. Current event, recent video documentaries, movies on historical events have been utilized to
enhance instruction. Also course notes and internet source references were made available to students
through online connections.
33
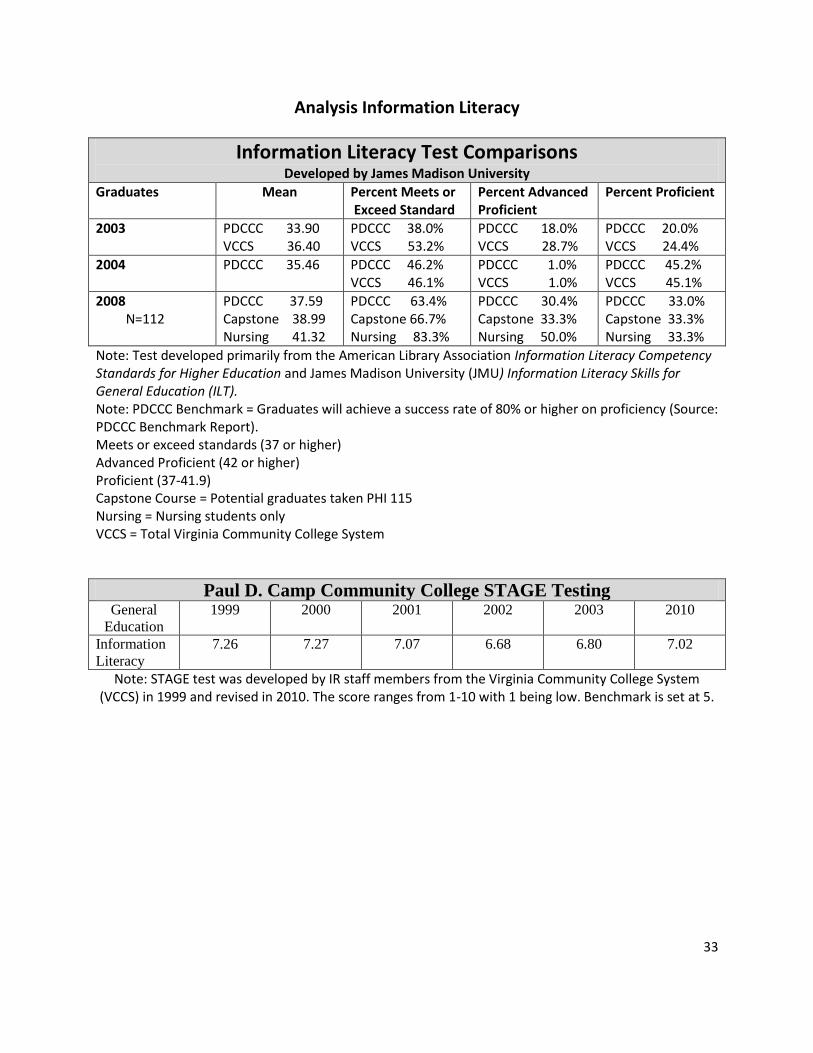
Analysis Information Literacy
Information Literacy Test Comparisons Developed by James Madison University
Graduates Mean Percent Meets or Exceed Standard
Percent Advanced Proficient
Percent Proficient
2003 PDCCC 33.90 VCCS 36.40
PDCCC 38.0% VCCS 53.2%
PDCCC 18.0% VCCS 28.7%
PDCCC 20.0% VCCS 24.4%
2004 PDCCC 35.46 PDCCC 46.2% VCCS 46.1%
PDCCC 1.0% VCCS 1.0%
PDCCC 45.2% VCCS 45.1%
2008 N=112
PDCCC 37.59 Capstone 38.99 Nursing 41.32
PDCCC 63.4% Capstone 66.7% Nursing 83.3%
PDCCC 30.4% Capstone 33.3% Nursing 50.0%
PDCCC 33.0% Capstone 33.3% Nursing 33.3%
Note: Test developed primarily from the American Library Association Information Literacy Competency Standards for Higher Education and James Madison University (JMU) Information Literacy Skills for General Education (ILT). Note: PDCCC Benchmark = Graduates will achieve a success rate of 80% or higher on proficiency (Source: PDCCC Benchmark Report). Meets or exceed standards (37 or higher) Advanced Proficient (42 or higher) Proficient (37-41.9) Capstone Course = Potential graduates taken PHI 115 Nursing = Nursing students only VCCS = Total Virginia Community College System
Paul D. Camp Community College STAGE Testing General
Education
1999 2000 2001 2002 2003 2010
Information
Literacy
7.26 7.27 7.07 6.68 6.80 7.02
Note: STAGE test was developed by IR staff members from the Virginia Community College System (VCCS) in 1999 and revised in 2010. The score ranges from 1-10 with 1 being low. Benchmark is set at 5.
34
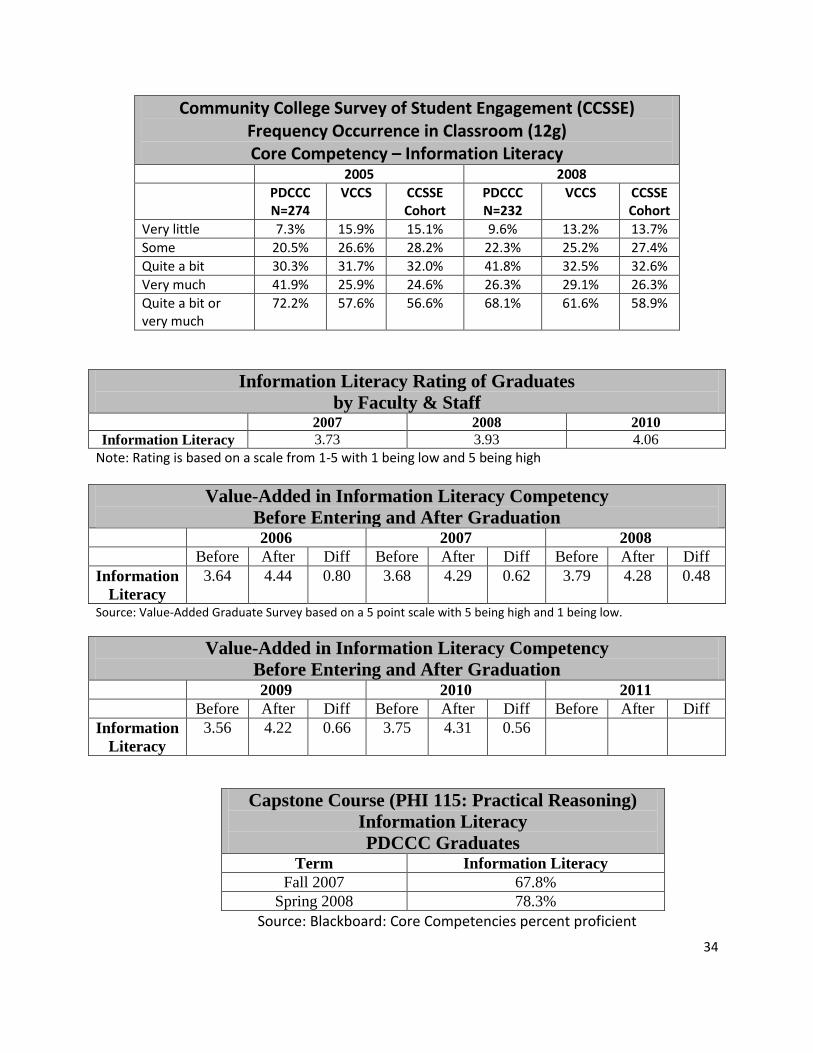
Community College Survey of Student Engagement (CCSSE) Frequency Occurrence in Classroom (12g) Core Competency – Information Literacy
2005 2008
PDCCC N=274
VCCS CCSSE Cohort
PDCCC N=232
VCCS CCSSE Cohort
Very little 7.3% 15.9% 15.1% 9.6% 13.2% 13.7%
Some 20.5% 26.6% 28.2% 22.3% 25.2% 27.4%
Quite a bit 30.3% 31.7% 32.0% 41.8% 32.5% 32.6%
Very much 41.9% 25.9% 24.6% 26.3% 29.1% 26.3%
Quite a bit or very much
72.2% 57.6% 56.6% 68.1% 61.6% 58.9%
Information Literacy Rating of Graduates
by Faculty & Staff 2007 2008 2010
Information Literacy 3.73 3.93 4.06
Note: Rating is based on a scale from 1-5 with 1 being low and 5 being high
Value-Added in Information Literacy Competency
Before Entering and After Graduation 2006 2007 2008
Before After Diff Before After Diff Before After Diff
Information
Literacy
3.64 4.44 0.80 3.68 4.29 0.62 3.79 4.28 0.48
Source: Value-Added Graduate Survey based on a 5 point scale with 5 being high and 1 being low.
Value-Added in Information Literacy Competency
Before Entering and After Graduation 2009 2010 2011
Before After Diff Before After Diff Before After Diff
Information
Literacy
3.56 4.22 0.66 3.75 4.31 0.56
Capstone Course (PHI 115: Practical Reasoning)
Information Literacy
PDCCC Graduates
Term Information Literacy
Fall 2007 67.8%
Spring 2008 78.3%
Source: Blackboard: Core Competencies percent proficient
35
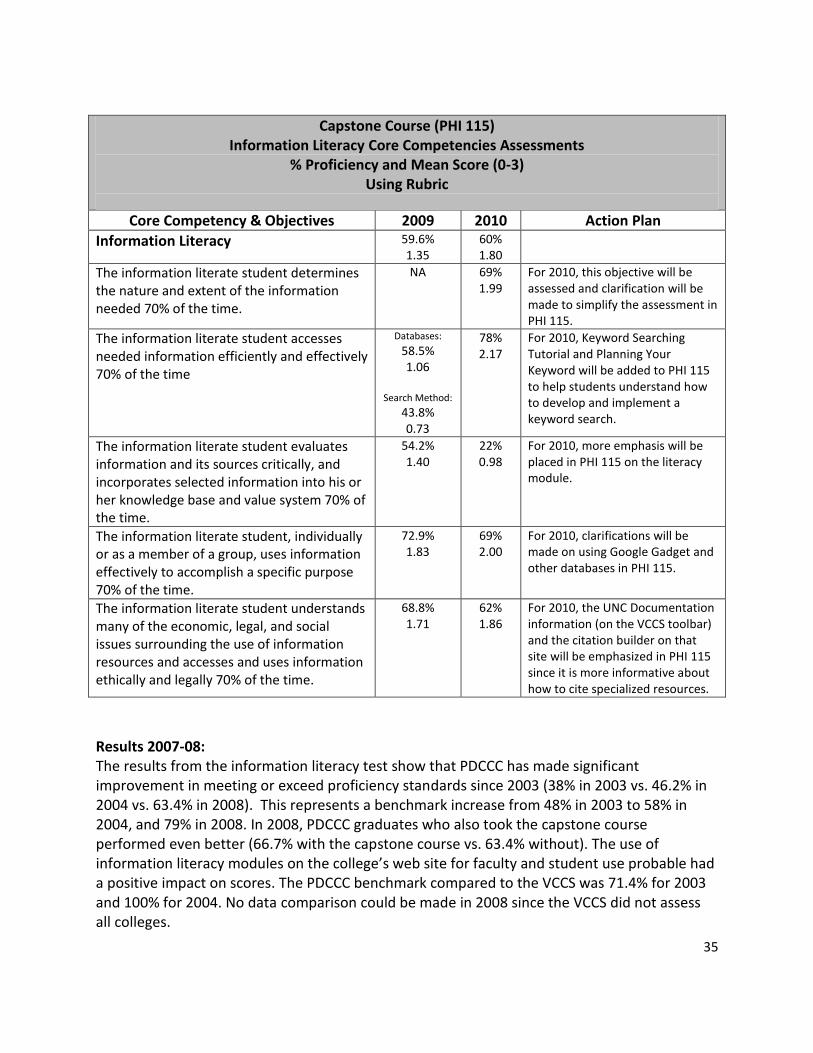
Capstone Course (PHI 115) Information Literacy Core Competencies Assessments
% Proficiency and Mean Score (0-3) Using Rubric
Core Competency & Objectives 2009 2010 Action Plan
Information Literacy 59.6% 1.35
60% 1.80
The information literate student determines the nature and extent of the information needed 70% of the time.
NA 69% 1.99
For 2010, this objective will be assessed and clarification will be made to simplify the assessment in PHI 115.
The information literate student accesses needed information efficiently and effectively 70% of the time
Databases:
58.5% 1.06
Search Method:
43.8% 0.73
78% 2.17
For 2010, Keyword Searching Tutorial and Planning Your Keyword will be added to PHI 115 to help students understand how to develop and implement a keyword search.
The information literate student evaluates information and its sources critically, and incorporates selected information into his or her knowledge base and value system 70% of the time.
54.2% 1.40
22% 0.98
For 2010, more emphasis will be placed in PHI 115 on the literacy module.
The information literate student, individually or as a member of a group, uses information effectively to accomplish a specific purpose 70% of the time.
72.9% 1.83
69% 2.00
For 2010, clarifications will be made on using Google Gadget and other databases in PHI 115.
The information literate student understands many of the economic, legal, and social issues surrounding the use of information resources and accesses and uses information ethically and legally 70% of the time.
68.8% 1.71
62% 1.86
For 2010, the UNC Documentation information (on the VCCS toolbar) and the citation builder on that site will be emphasized in PHI 115 since it is more informative about how to cite specialized resources.
Results 2007-08: The results from the information literacy test show that PDCCC has made significant improvement in meeting or exceed proficiency standards since 2003 (38% in 2003 vs. 46.2% in 2004 vs. 63.4% in 2008). This represents a benchmark increase from 48% in 2003 to 58% in 2004, and 79% in 2008. In 2008, PDCCC graduates who also took the capstone course performed even better (66.7% with the capstone course vs. 63.4% without). The use of information literacy modules on the college’s web site for faculty and student use probable had a positive impact on scores. The PDCCC benchmark compared to the VCCS was 71.4% for 2003 and 100% for 2004. No data comparison could be made in 2008 since the VCCS did not assess all colleges.
36
According to the 2008 Community College Survey of Student Engagement (CCSSE), the frequency of occurrence in the classroom of using computing and information technology has decreased slightly from 2005 (68.1% quite a bit or very much in 2008 vs. 72.2% for 2005). However, the level of occurrence is higher than the VCCS averages (57.6% in 2005 and 61.6% in 2008) and the CCSSE averages (56.6% in 2005 and 58.9% in 2008). The information literacy perception by faculty and staff (based on survey data) show an increase in information literacy rating skill level (based on a scale from 1-5 with 1 being low) from 3.73 in 2007 to 3.93 in 2008. This is reinforced by the graduate value-added (Pre-Post) survey which show the perception of skill level when students first entering the college and at graduation from 2006 to 2008. In all three years, graduates felt that there was significant improvement in skill level between when they first entered the college and at graduation. However, the degree of improvement appears to be decreasing (an increase of 0.8 in 2006 vs. 0.62 in 2007, and 0.48 in 2008). This may be due to the fact that more students are entering college from high school with a higher degree of computer and information literacy skills today than they did a few years ago. In examining the information literacy component in the capstone course (PHI 115), the information literacy proficiency level (determined by the instructor) from 2007-2008 had increased from 67.8% in fall 2007 to 78.3% in spring 2008. 1st Cycle Action Plan (Closing the Loop): The college needs to continue to improve on its capstone course. The capstone team of instructors needs to use the information literacy rubric developed by the VCCS, in order to better identify weaknesses in sub-categories of information literacy. Each fall and spring term, the information literacy rubric should be used in the PHI 115 class assessment and in the development of action plans for course improvement. When the class action plan is completed at the end of term, it will be sent to their dean and to the Director of Assessment & IR. The General Education Committee will identify other courses that have primary objectives under information literacy and decide which ones should also have the instructor assess information literacy. An analysis of the college’s curriculum map will help in this process. Courses with a primary information literacy objective will be included in that course syllabus. All lead faculty should survey employers of their graduates on skill levels related to core competencies. The Director of Assessment & IR has an employer survey online available for lead faculty use.
37
Results 2008-09: The graduate value-added (Pre-Post) survey shows the perception of skill level when students first entering the college and at graduation from 2006 to 2009. In all four years, graduates felt that there was significant improvement in skill level between when they first entered the college and at graduation. The degree of improvement from when the student first entered the college has increased 0.66 points in 2009 vs. 0.48 points in 2008. However, the overall skill level rating decreased slightly from 4.28 in 2008 to 4.22 in 2009. In the capstone course, PHI 115, the overall proficiency level was 59.6%. This was below the goal of 70% proficiency. In looking at the sub-categories, proficiency levels were below standard in all areas except one. This area pertained to using information effectively to accomplish a specific purpose. 2st Cycle Action Plan (Closing the Loop): Continue to tweak the PDCCC Information Literacy Rubric. The information literacy course has evolved from two face-to-face courses to a face-to-face and online course. Videos, tutorials, and instructional guides have been incorporated to give students more information and better instructions. A new approach has been taken for teaching the course. A philosophy textbook has been adopted and the module is being taught by the philosophy instructors. There was significant improvement in the information literacy test scores from 2003 through the 2009 academic year. There were also improvements for four of the five objectives over the past couple of years. It has been recommended that the librarians be more involved in the design and teaching of the module. Efforts will be made to ensure that the search process is clear to students and that they have the instructional materials to accomplish the objectives. Recommendations for revisions to realign assignments to meet the objectives have been made, also. The ITE 115 course has been revised to include extensive use of a simulator. It is anticipated that students will come out of this course with a better command of the tools they have available to them. Since this course is offered early in the curriculum, it should help students perform better on the information literacy tasks they are latter expected to master. Make information literacy changes recommended in the capstone course, PHI 115 (see table above). The SDV course has been restructured to emphasis the primary resources for research. This is the entry level course, where most students are introduced to information literacy. Students are given hands-on experience with using these resources. The Director of Learning Resources and the Suffolk Campus Librarian are working with English faculty to provide information literacy instruction that covers the steps for research from creating a research
38
question, identifying search terms, developing a search strategy statement, and using Boolean operators to selecting appropriate resources. A Library Help Button was created to connect students with library resources via Blackboard. The Director of Learning Resources and the Suffolk Campus Librarian are working with faculty to introduce this resource to students. Some faculty members have incorporated this resource into their Blackboard sites and others are being recruited. All of these efforts should result in students being better prepared for the capstone course and more successful when they take the information literacy assessment.
Results 2009-2010: On the STAGE test which was developed by the Virginia Community College System (VCCS) Assessment Coordinators, the 2010 graduates scored a 7.02 which was above the benchmark score set at 5.00. This was an increase from the 2003 graduates’ score of 6.80. On the Faculty and Staff Survey, the 2010 graduates were rated 4.06 on a 5-point scale with 1 being low. This was an increase from 2009 graduates with 3.93 and the 2007 graduates with 3.73. This is above the benchmark set at 3.00. The Graduate Survey based on a 5-point scale with 1 being low showed value-added for the 2010 graduates. Their score increased from 3.75 upon entering the college to 4.31 at graduation. The 2010 graduates also showed an increase from the 2009 graduates’ score of 4.22. The Capstone Course base on an 80% proficiency rubric showed that the 2010 graduates were proficient in information literacy skills 60% of the time vs. 59.6% in 2009. The rubric also showed the 2010 graduates had a rating of 1.80 vs. 1.35 9based on a 0-3 scale with 3 being highest). The weakest area for 2010 graduates was in the area of evaluating information and its sources critically and incorporating selected information into his or her knowledge base (22% proficiency). 3rd Cycle Action Plan (Closing the Loop): The percent of accuracy was changed from 80% proficiency to 70% proficiency.
The following items were added or revised to clarify capstone course assignments and to
strengthen students’ skills in the areas of accessing needed information efficiently and
effectively, evaluating information and its sources critically, and incorporating selected
information into his/her knowledge base and value system:
Search Strategy Worksheet example was added
39
Discovering, Comparing and Selecting Library Resources Worksheet was revised to combine an example with the exercise
The Good the Bad & the Ugly or Why It’s a Good Idea to Evaluate Web Sources, a website that gives criteria and examples for evaluating websites was added
Other strategies to help students become more information literate included:
Library Help Buttons customized according to the content area were added to Blackboard sites, upon request by faculty, to familiarize students with library resources to support their course(s) and make them more accessible
Presentations were made to acquaint students with Library Help Buttons
A Guided Worksheet was created to introduce students in student development (SDV) courses how to utilize library resources
The PHI 115 Blackboard site was revised to include the revised and additional information
In the science courses, although data from both 2009 and 2010 shows weak proficiency with
respect to students’ evaluation of information, a smaller pool of students from science had
demonstrated 74% proficiency in literature survey assignments. This specific literature
research and evaluation of its merit continue to be part of our writing assignment in Science.
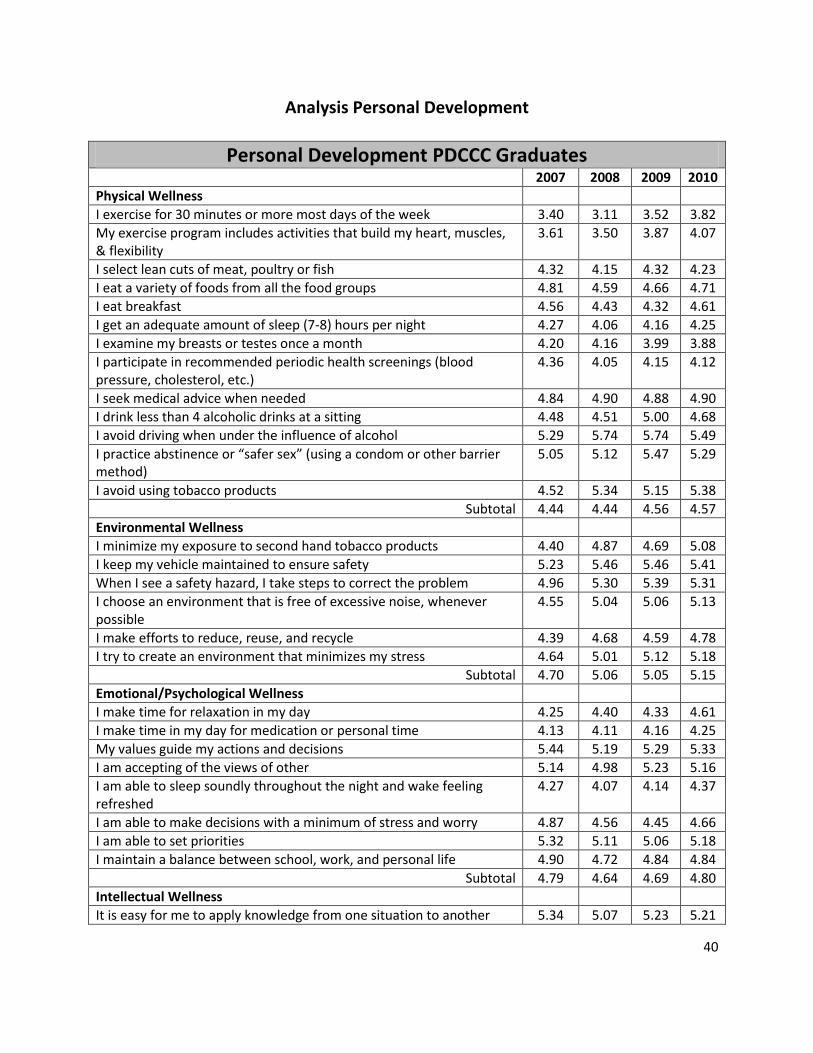
40
Analysis Personal Development
Personal Development PDCCC Graduates 2007 2008 2009 2010
Physical Wellness
I exercise for 30 minutes or more most days of the week 3.40 3.11 3.52 3.82
My exercise program includes activities that build my heart, muscles, & flexibility
3.61 3.50 3.87 4.07
I select lean cuts of meat, poultry or fish 4.32 4.15 4.32 4.23
I eat a variety of foods from all the food groups 4.81 4.59 4.66 4.71
I eat breakfast 4.56 4.43 4.32 4.61
I get an adequate amount of sleep (7-8) hours per night 4.27 4.06 4.16 4.25
I examine my breasts or testes once a month 4.20 4.16 3.99 3.88
I participate in recommended periodic health screenings (blood pressure, cholesterol, etc.)
4.36 4.05 4.15 4.12
I seek medical advice when needed 4.84 4.90 4.88 4.90
I drink less than 4 alcoholic drinks at a sitting 4.48 4.51 5.00 4.68
I avoid driving when under the influence of alcohol 5.29 5.74 5.74 5.49
I practice abstinence or “safer sex” (using a condom or other barrier method)
5.05 5.12 5.47 5.29
I avoid using tobacco products 4.52 5.34 5.15 5.38
Subtotal 4.44 4.44 4.56 4.57
Environmental Wellness
I minimize my exposure to second hand tobacco products 4.40 4.87 4.69 5.08
I keep my vehicle maintained to ensure safety 5.23 5.46 5.46 5.41
When I see a safety hazard, I take steps to correct the problem 4.96 5.30 5.39 5.31
I choose an environment that is free of excessive noise, whenever possible
4.55 5.04 5.06 5.13
I make efforts to reduce, reuse, and recycle 4.39 4.68 4.59 4.78
I try to create an environment that minimizes my stress 4.64 5.01 5.12 5.18
Subtotal 4.70 5.06 5.05 5.15
Emotional/Psychological Wellness
I make time for relaxation in my day 4.25 4.40 4.33 4.61
I make time in my day for medication or personal time 4.13 4.11 4.16 4.25
My values guide my actions and decisions 5.44 5.19 5.29 5.33
I am accepting of the views of other 5.14 4.98 5.23 5.16
I am able to sleep soundly throughout the night and wake feeling refreshed
4.27 4.07 4.14 4.37
I am able to make decisions with a minimum of stress and worry 4.87 4.56 4.45 4.66
I am able to set priorities 5.32 5.11 5.06 5.18
I maintain a balance between school, work, and personal life 4.90 4.72 4.84 4.84
Subtotal 4.79 4.64 4.69 4.80
Intellectual Wellness
It is easy for me to apply knowledge from one situation to another 5.34 5.07 5.23 5.21
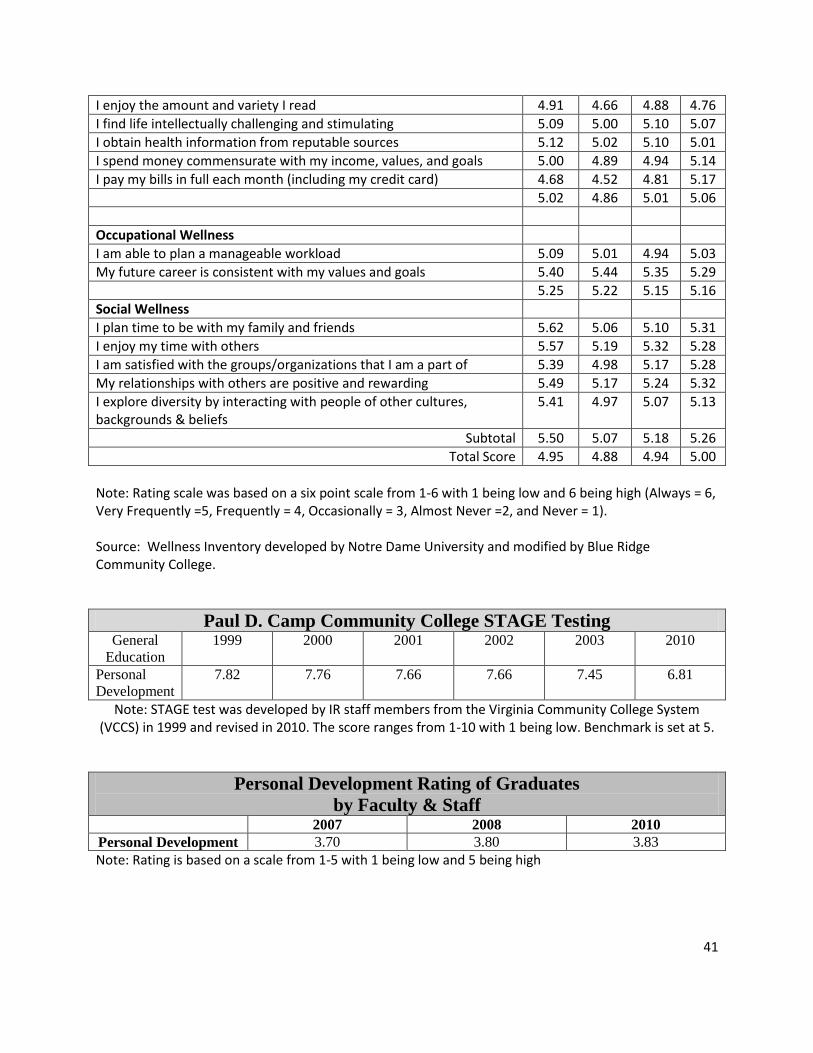
41
I enjoy the amount and variety I read 4.91 4.66 4.88 4.76
I find life intellectually challenging and stimulating 5.09 5.00 5.10 5.07
I obtain health information from reputable sources 5.12 5.02 5.10 5.01
I spend money commensurate with my income, values, and goals 5.00 4.89 4.94 5.14
I pay my bills in full each month (including my credit card) 4.68 4.52 4.81 5.17
5.02 4.86 5.01 5.06
Occupational Wellness
I am able to plan a manageable workload 5.09 5.01 4.94 5.03
My future career is consistent with my values and goals 5.40 5.44 5.35 5.29
5.25 5.22 5.15 5.16
Social Wellness
I plan time to be with my family and friends 5.62 5.06 5.10 5.31
I enjoy my time with others 5.57 5.19 5.32 5.28
I am satisfied with the groups/organizations that I am a part of 5.39 4.98 5.17 5.28
My relationships with others are positive and rewarding 5.49 5.17 5.24 5.32
I explore diversity by interacting with people of other cultures, backgrounds & beliefs
5.41 4.97 5.07 5.13
Subtotal 5.50 5.07 5.18 5.26
Total Score 4.95 4.88 4.94 5.00
Note: Rating scale was based on a six point scale from 1-6 with 1 being low and 6 being high (Always = 6, Very Frequently =5, Frequently = 4, Occasionally = 3, Almost Never =2, and Never = 1). Source: Wellness Inventory developed by Notre Dame University and modified by Blue Ridge Community College.
Paul D. Camp Community College STAGE Testing General
Education
1999 2000 2001 2002 2003 2010
Personal
Development
7.82 7.76 7.66 7.66 7.45 6.81
Note: STAGE test was developed by IR staff members from the Virginia Community College System (VCCS) in 1999 and revised in 2010. The score ranges from 1-10 with 1 being low. Benchmark is set at 5.
Personal Development Rating of Graduates
by Faculty & Staff 2007 2008 2010
Personal Development 3.70 3.80 3.83
Note: Rating is based on a scale from 1-5 with 1 being low and 5 being high
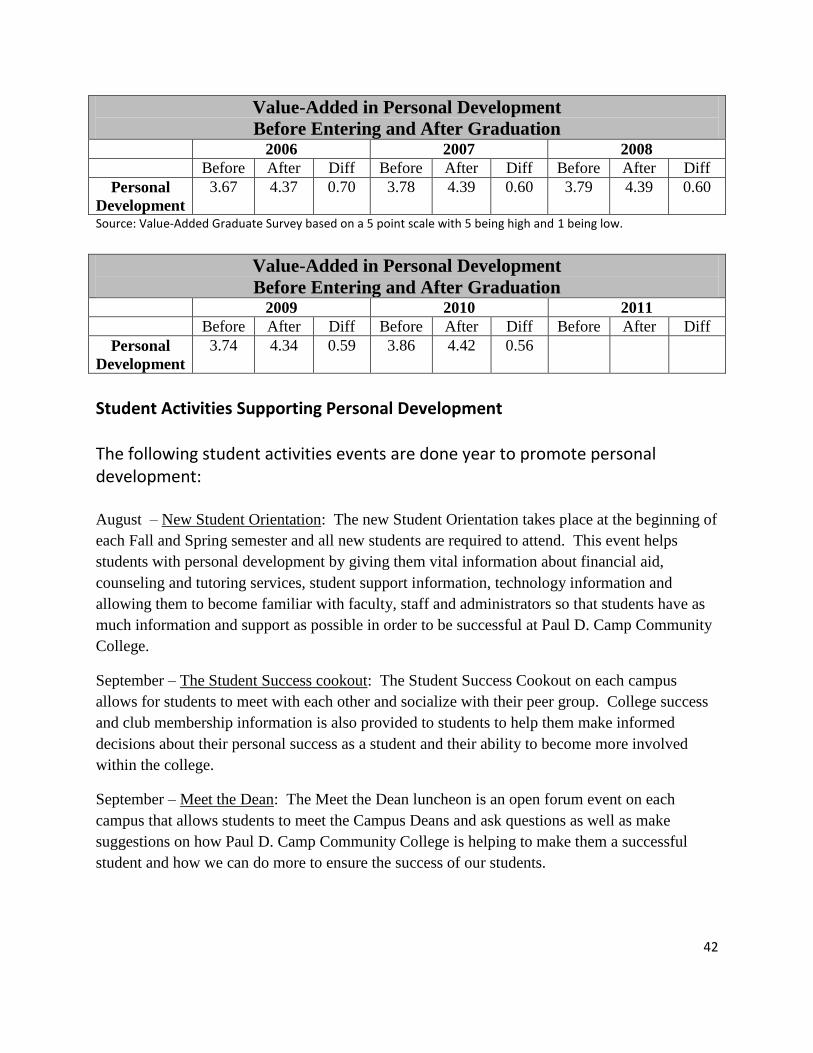
42
Value-Added in Personal Development
Before Entering and After Graduation 2006 2007 2008
Before After Diff Before After Diff Before After Diff
Personal
Development
3.67 4.37 0.70 3.78 4.39 0.60 3.79 4.39 0.60
Source: Value-Added Graduate Survey based on a 5 point scale with 5 being high and 1 being low.
Value-Added in Personal Development
Before Entering and After Graduation 2009 2010 2011
Before After Diff Before After Diff Before After Diff
Personal
Development
3.74 4.34 0.59 3.86 4.42 0.56
Student Activities Supporting Personal Development The following student activities events are done year to promote personal development: August – New Student Orientation: The new Student Orientation takes place at the beginning of
each Fall and Spring semester and all new students are required to attend. This event helps
students with personal development by giving them vital information about financial aid,
counseling and tutoring services, student support information, technology information and
allowing them to become familiar with faculty, staff and administrators so that students have as
much information and support as possible in order to be successful at Paul D. Camp Community
College.
September – The Student Success cookout: The Student Success Cookout on each campus
allows for students to meet with each other and socialize with their peer group. College success
and club membership information is also provided to students to help them make informed
decisions about their personal success as a student and their ability to become more involved
within the college.
September – Meet the Dean: The Meet the Dean luncheon is an open forum event on each
campus that allows students to meet the Campus Deans and ask questions as well as make
suggestions on how Paul D. Camp Community College is helping to make them a successful
student and how we can do more to ensure the success of our students.
43
September – Voter Registration: Students were given the opportunity to register to vote if they
had not done so yet.
November – Health Fair: The health fair each semester on each campus provides valuable
information to students about their general health. Blood pressure and glucose screenings are
available as well as sickle cell and HIV screenings. This is an important event that helps
students get an idea of where they are health wise and also allows students to develop health
goals.
November – College Transfer: Working with Student Support Services, Student Activities has
invited various local four year colleges to speak with students looking into transferring. The
purpose of this event is to give students information about different colleges so that they can
make an informed decision about which college would best suit their needs when they transfer.
December – Study tips and candy bags, both campuses: For this event we provide students with
a few pieces of candy and a list of study tips. This event is meant to help students prepare for
their finals.
December – Open Study Hall, both campuses: A quiet room on each campus is open to students
needing a place to study uninterrupted for their finals.
March – HR Block free tax seminar: Representatives from HR block are available on each
campus to discuss tax return information. This gives students information they need to make an
educated decision about their taxes.
March – Student Support Services Transfer presentation on both campuses: For this event
students were invited to discuss their transfer options, degree programs and the programs of four
year colleges in order to make an informed decision about Paul D. Camp’s transfer programs.
SSS also answered any questions student may have had as well as making appointments with
students who needed further help with transferring.
April– Student Success Cookout on both campuses: The Student Success Cookout allows for
students to meet with each other and socialize with their peer group. College success and club
membership information is also provided to students to help them make informed decisions
about their personal success as a student and their ability to become more involved within the
college.
April – Open Study hall, both campuses: A quiet room on each campus is open to students
needing a place to study uninterrupted for their finals.
April – Candy bags and study tips. Both campuses: For this event we provide students with a
few pieces of candy and a list of study tips. This event is meant to help students prepare for their
finals.
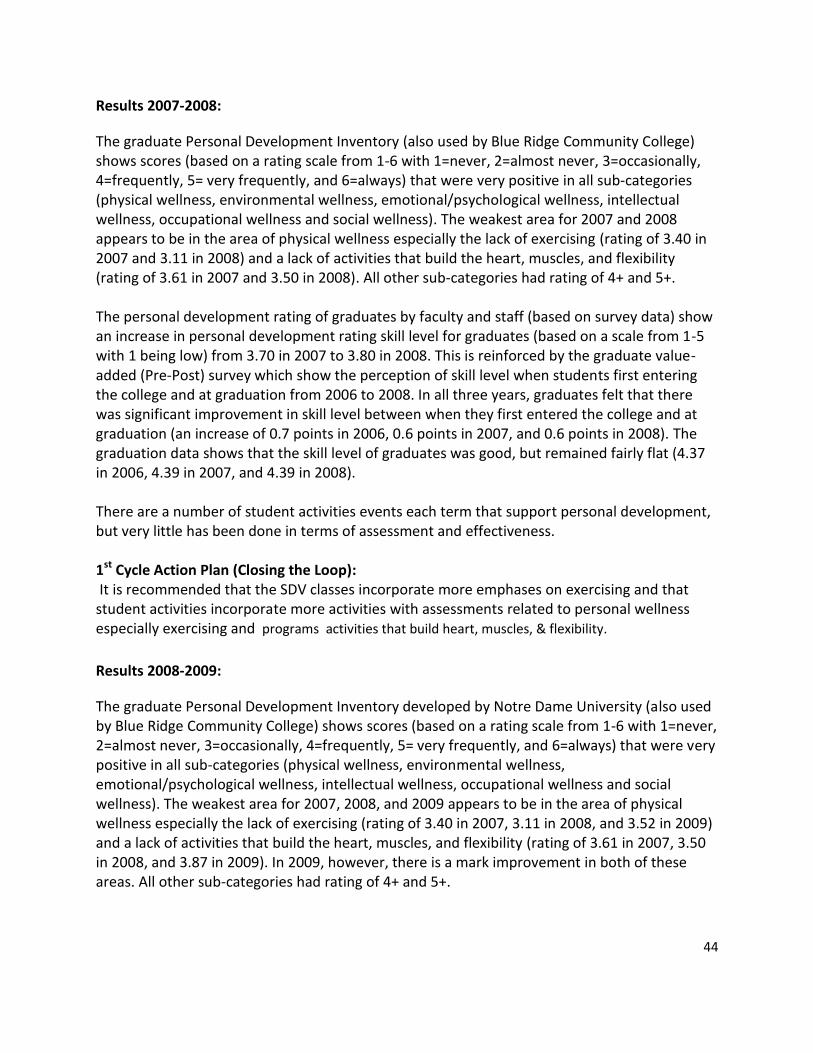
44
Results 2007-2008:
The graduate Personal Development Inventory (also used by Blue Ridge Community College) shows scores (based on a rating scale from 1-6 with 1=never, 2=almost never, 3=occasionally, 4=frequently, 5= very frequently, and 6=always) that were very positive in all sub-categories (physical wellness, environmental wellness, emotional/psychological wellness, intellectual wellness, occupational wellness and social wellness). The weakest area for 2007 and 2008 appears to be in the area of physical wellness especially the lack of exercising (rating of 3.40 in 2007 and 3.11 in 2008) and a lack of activities that build the heart, muscles, and flexibility (rating of 3.61 in 2007 and 3.50 in 2008). All other sub-categories had rating of 4+ and 5+. The personal development rating of graduates by faculty and staff (based on survey data) show an increase in personal development rating skill level for graduates (based on a scale from 1-5 with 1 being low) from 3.70 in 2007 to 3.80 in 2008. This is reinforced by the graduate value-added (Pre-Post) survey which show the perception of skill level when students first entering the college and at graduation from 2006 to 2008. In all three years, graduates felt that there was significant improvement in skill level between when they first entered the college and at graduation (an increase of 0.7 points in 2006, 0.6 points in 2007, and 0.6 points in 2008). The graduation data shows that the skill level of graduates was good, but remained fairly flat (4.37 in 2006, 4.39 in 2007, and 4.39 in 2008). There are a number of student activities events each term that support personal development, but very little has been done in terms of assessment and effectiveness. 1st Cycle Action Plan (Closing the Loop): It is recommended that the SDV classes incorporate more emphases on exercising and that student activities incorporate more activities with assessments related to personal wellness especially exercising and programs activities that build heart, muscles, & flexibility.
Results 2008-2009:
The graduate Personal Development Inventory developed by Notre Dame University (also used by Blue Ridge Community College) shows scores (based on a rating scale from 1-6 with 1=never, 2=almost never, 3=occasionally, 4=frequently, 5= very frequently, and 6=always) that were very positive in all sub-categories (physical wellness, environmental wellness, emotional/psychological wellness, intellectual wellness, occupational wellness and social wellness). The weakest area for 2007, 2008, and 2009 appears to be in the area of physical wellness especially the lack of exercising (rating of 3.40 in 2007, 3.11 in 2008, and 3.52 in 2009) and a lack of activities that build the heart, muscles, and flexibility (rating of 3.61 in 2007, 3.50 in 2008, and 3.87 in 2009). In 2009, however, there is a mark improvement in both of these areas. All other sub-categories had rating of 4+ and 5+.

45
The graduate value-added (Pre-Post) survey shows the perception of skill level when students first entering the college and at graduation from 2006 to 2009. In all four years, graduates felt that there was significant improvement in skill level between when they first entered the college and at graduation (an increase of 0.7 points in 2006, 0.6 points in 2007, 0.6 points in 2008, and 0.59 points in 2009). The graduation data shows that the skill level of graduates was good, but remained fairly flat (4.37 in 2006, 4.39 in 2007, 4.39 in 2008, and 4.34 in 2009). 2st Cycle Action Plan (Closing the Loop): During the past few years, the College Success Skills instructors have focused on providing information that will assist students in having successful learning outcomes. We recognize that students need to learn how to study, understand their learning styles, to overcome text anxieties, understand diversity, and be familiar with computer technology. Therefore, the College Success Skill classes are designed to provide the knowledge and understanding that will assist them in their other college courses. It is recommended that the SDV classes continue to incorporate more emphases on exercising and that student activities incorporate more activities with assessments related to personal wellness especially exercising and program events that build heart, muscles, & flexibility. According to students’ test scores, it revealed that they need support in their study skills. The College Success Skills classes provide strategies that will give students other ways to present and study their course content. Along with providing study skills techniques, it is recognized that students need to embrace diversity and advance technology. In order for students to be competitive in the twenty-first century and beyond, students need to appreciate diversity and different cultures. Advanced technology has been a prime area in which the instructors for the College Success Skills courses ensure that they have a working knowledge. For example, we assist students on how to access the student information system for transcripts, registration, blackboard, and VaWizard (career explorations), to name a few. Overall, the College Success Skills courses provide the pedagogy to assist students in gaining the skills necessary to ensure successful learning outcomes and equipping them for the twenty-first century workforce.
Results 2009-10 The main evaluation measure for personal development is the Wellness Inventory developed by Notre Dame University and modified by Blue Ridge Community College in Virginia. Scores are based on a six-point scale with 1 being low. The overall personal wellness scores for 2010 graduates were very positive. The mean score was 5.00. This was an increase from 2009 graduate scores of 4.94 and from 2008 graduate scores of 4.88. The weakest area for 2007, 2008, 2009, and 2010 appears to be in the area of physical wellness especially the lack of exercising including activities that build the heart, muscles, and flexibility. Physical wellness has, however, increased from 4.44 in 2007 to 4.57 in 2010. Environmental wellness has increased from 4.70 in 2007 to 5.15 in 2010. Emotional/Psychological wellness has remained constant from 4.79 in 2007 to 4.80 in 2010. Intellectual wellness has increased from 5.02 in 2007 to 5.06 in 2010. Occupational wellness has fallen from 5.25 in 2007 to 5.16 in 2010. Social wellness has also fallen from 5.50 in 2007 to 5.26 in 2010. Overall, however, all scores have been above the benchmark score of 4 (frequently).
46
On the STAGE test based on a 10-point scale and developed by the Virginia Community College System (VCCS) Assessment Coordinators, the 2010 graduates scored a 6.81 which was above the benchmark score set at 5.00. On the Faculty and Staff Survey, the 2010 graduates were rated 3.83 on a 5-point scale with 1 being low. This was an increase from 2008 graduates with 3.80 and the 2007 graduates with 3.70. This is within the benchmark set at 3.00. The Graduate Survey based on a 5-point scale with 1 being low showed value-added for the 2010 graduates. Their scores increased from 3.86 upon entering the college to 4.42 at graduation. The 2010 graduates also showed an increase from the 2009 graduates’ score of 4.34. The clubs and student activities continued to offer personal development activities each semester.
3rd Cycle Action Plan (Closing the Loop): To build on cycle 2, the SDV classes incorporated more emphases on exercising and healthy living tasks. The newly revised SDV textbook was used and provide a more current set of learning principles for the instructors and students. Specific changes made in the SDV classes to address weaknesses were the following:
Physical Wellness: Provided information and emphasized the benefits of maintaining optimum physical health. Allowed students to give examples of how they incorporate physical movement in their daily lives. This was done to foster a peer to peer forum to motivate all students to improve overall in this area.
Emotional/Psychological Wellness: Upon students identifying the many responsibilities that they have, a lesson was taught on the importance of setting daily priorities. By achieving this students shared that it reduced some negative stress. The results were verbally shared by the students.
Occupational Wellness: Students identified long-term goals. In accordance to those goals, time was spent in class confirming that students were enrolled in the appropriate educational plan. In cases where students were not enrolled in the correct program of study, they were advised on the better plan and instructed to change their major in the admissions office.
Social Wellness: To promote that students were exposed to working with others, the students were engaged in various in-class group activities.
Several PED classes were also added to provide some variety for students. The student activities team incorporated more activities related to personal wellness especially exercising. Workshops and seminars were delivered in the areas of stress reduction, time management and study strategies.
In the science courses, biological concepts and principles are delivered through Anatomy and
Physiology, Microbiology. Instruction continued to emphasize the relevance of the subject to students’
health and well being. The rubric did not specifically measure this piece directly, but a broader
component showed 87% knowledge base for this area.
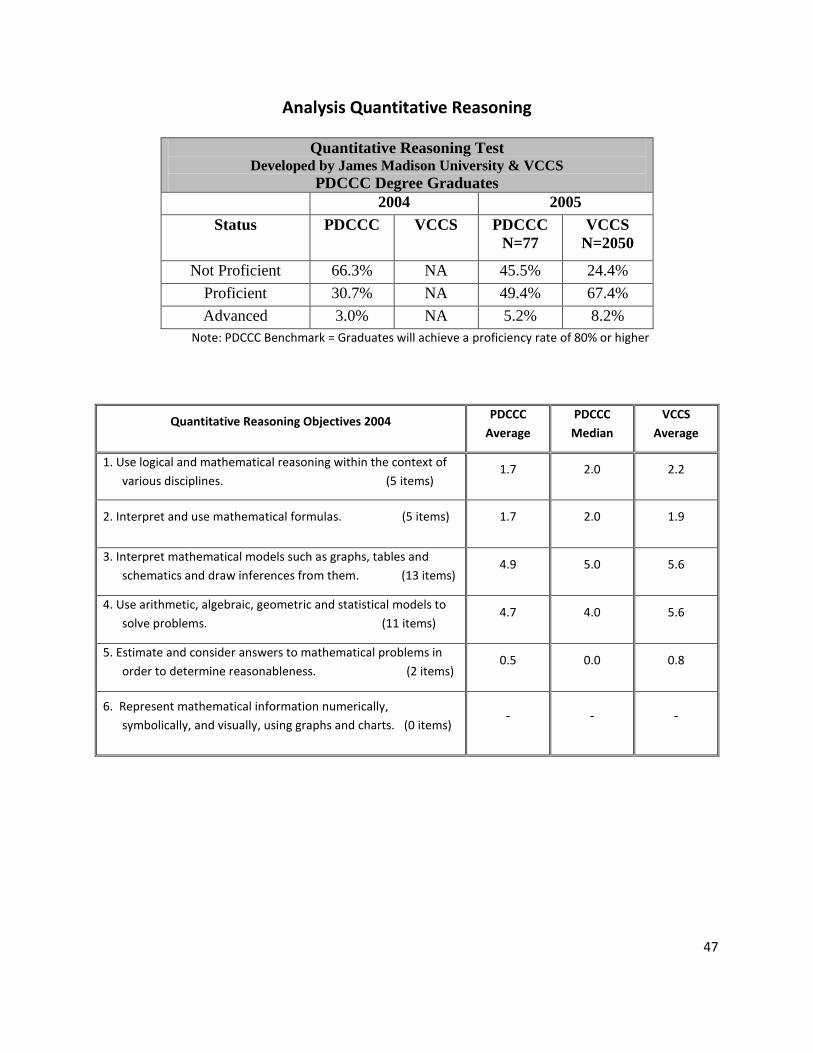
47
Analysis Quantitative Reasoning
Quantitative Reasoning Test Developed by James Madison University & VCCS
PDCCC Degree Graduates
2004 2005
Status PDCCC VCCS PDCCC
N=77
VCCS
N=2050
Not Proficient 66.3% NA 45.5% 24.4%
Proficient 30.7% NA 49.4% 67.4%
Advanced 3.0% NA 5.2% 8.2%
Note: PDCCC Benchmark = Graduates will achieve a proficiency rate of 80% or higher
Quantitative Reasoning Objectives 2004 PDCCC
Average
PDCCC
Median
VCCS
Average
1. Use logical and mathematical reasoning within the context of
various disciplines. (5 items) 1.7 2.0 2.2
2. Interpret and use mathematical formulas. (5 items) 1.7 2.0 1.9
3. Interpret mathematical models such as graphs, tables and
schematics and draw inferences from them. (13 items) 4.9 5.0 5.6
4. Use arithmetic, algebraic, geometric and statistical models to
solve problems. (11 items) 4.7 4.0 5.6
5. Estimate and consider answers to mathematical problems in
order to determine reasonableness. (2 items) 0.5 0.0 0.8
6. Represent mathematical information numerically,
symbolically, and visually, using graphs and charts. (0 items) - - -

48
Descriptive Statistics and Independent t-Test Results Quantitative Reasoning Objectives
(Developed by James Madison University & VCCS)
PDCCC Degree-Seeking Students 2008 New Students vs. 2009 Graduates
Pre-Test N=81
Post-Test N=114
Ind. t-Test Pre/Post Difference
Objective Mean Std Dev
Min. Max. Mean Std Dev
Min. Max. Diff t-obs. DF Probt Sig at .05
1 11.0 3.93 3 22 15.1 4.46 7 27 4.0 -6.524 193 0.000 *
2 2.4 1.58 0 8 3.2 1.90 0 8 0.8 -3.263 193 0.001 *
3 5.6 2.22 1 11 7.9 2.96 1 15 2.3 -5.806 193 0.000 *
4 7.2 2.53 1 14 9.5 3.32 3 18 2.3 -5.142 193 0.000 *
5 1.9 1.27 0 5 2.7 1.46 0 6 0.9 -4.443 193 0.000 *
6 3.6 1.56 1 7 4.9 2.11 1 11 1.3 -4.764 193 0.000 *
All 12.4 4.58 3 26 17.2 5.43 7 33 4.8 -6.478 193 0.000 *
Paul D. Camp Community College STAGE Testing General
Education
1999 2000 2001 2002 2003 2010
Quantitative
Reasoning
6.27 6.28 6.25 5.89 5.80 5.00
Note: STAGE test was developed by IR staff members from the Virginia Community College System (VCCS) in 1999 and revised in 2010. The score ranges from 1-10 with 1 being low. Benchmark is set at 5.
Community College Survey of Student Engagement (CCSSE) Frequency Occurrence in Classroom (12f)
Core Competency – Quantitative Reasoning
2005 2008
PDCCC N=274
VCCS CCSSE Cohort
PDCCC N=232
VCCS CCSSE Cohort
Very little 15.8% 20.9% 17.4% 16.4% 18.3% 16.2%
Some 32.3% 31.0% 30.0% 30.2% 29.3% 29.3%
Quite a bit 31.9% 31.0% 33.5% 36.1% 32.5% 33.8%
Very much 19.9% 17.0% 19.1% 17.3% 19.8% 20.7%
Quite a bit or very much
51.8% 48% 52.6% 53.4% 52.3% 54.5%
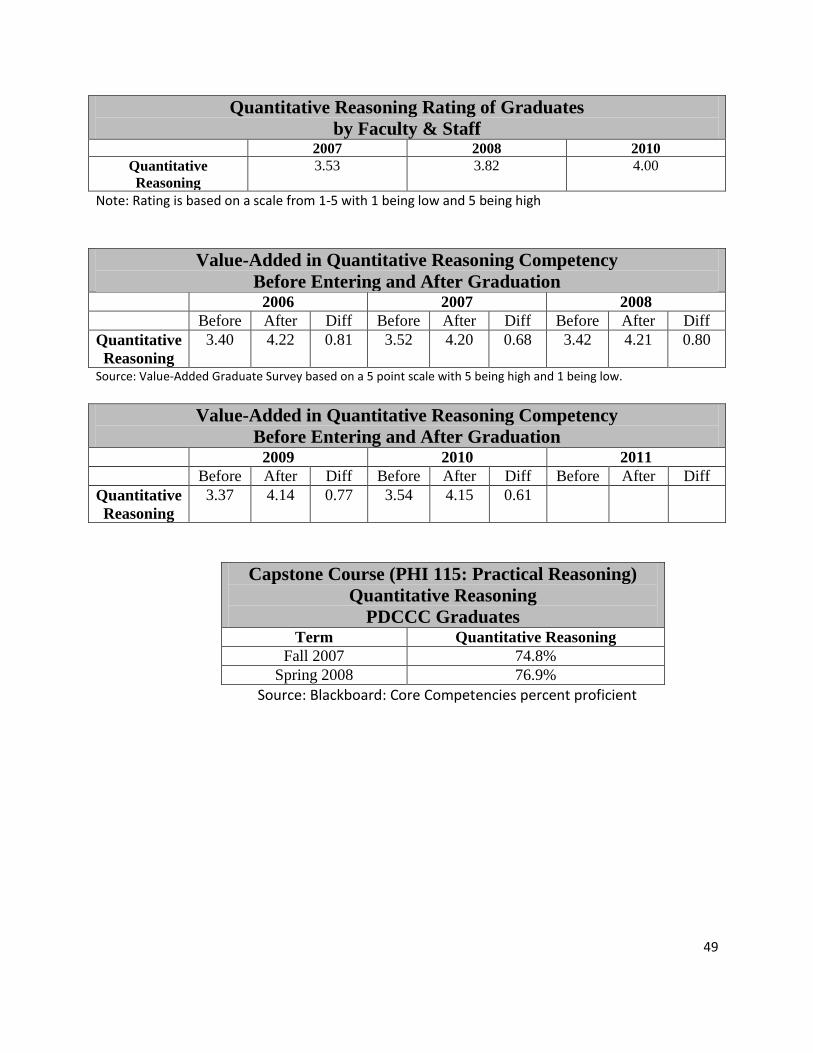
49
Quantitative Reasoning Rating of Graduates
by Faculty & Staff 2007 2008 2010
Quantitative
Reasoning
3.53 3.82 4.00
Note: Rating is based on a scale from 1-5 with 1 being low and 5 being high
Value-Added in Quantitative Reasoning Competency
Before Entering and After Graduation 2006 2007 2008
Before After Diff Before After Diff Before After Diff
Quantitative
Reasoning
3.40 4.22 0.81 3.52 4.20 0.68 3.42 4.21 0.80
Source: Value-Added Graduate Survey based on a 5 point scale with 5 being high and 1 being low.
Value-Added in Quantitative Reasoning Competency
Before Entering and After Graduation 2009 2010 2011
Before After Diff Before After Diff Before After Diff
Quantitative
Reasoning
3.37 4.14 0.77 3.54 4.15 0.61
Capstone Course (PHI 115: Practical Reasoning)
Quantitative Reasoning
PDCCC Graduates
Term Quantitative Reasoning
Fall 2007 74.8%
Spring 2008 76.9%
Source: Blackboard: Core Competencies percent proficient
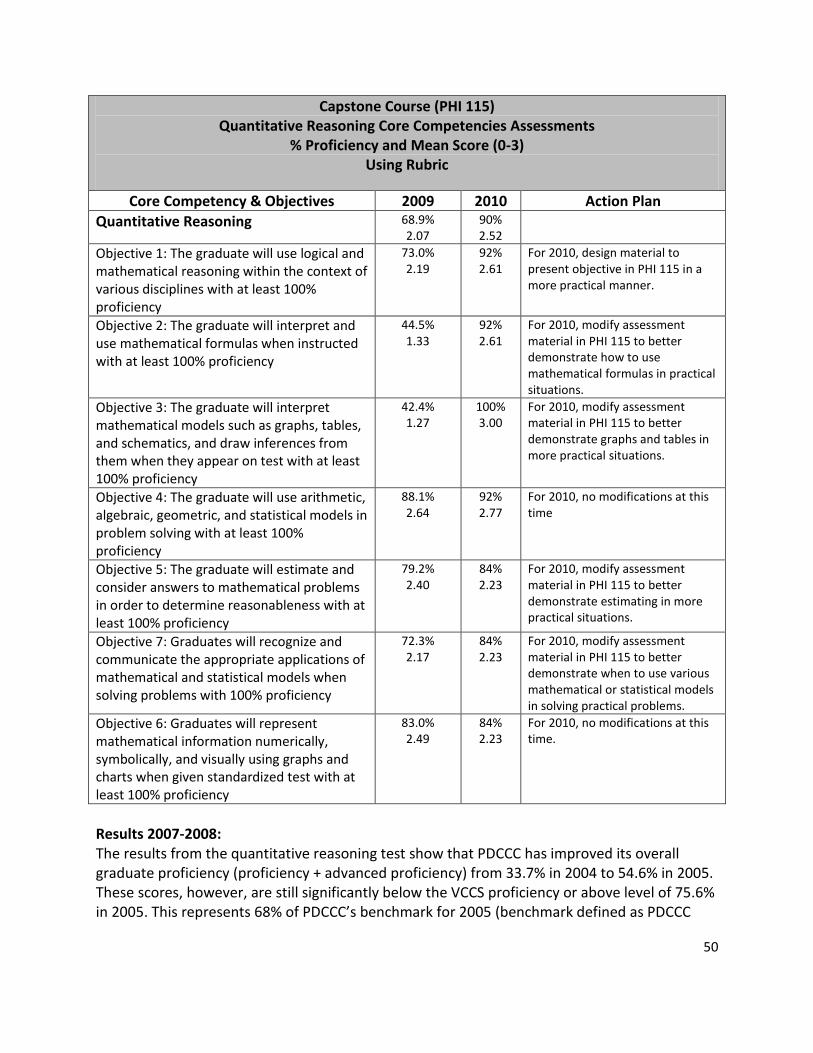
50
Capstone Course (PHI 115) Quantitative Reasoning Core Competencies Assessments
% Proficiency and Mean Score (0-3) Using Rubric
Core Competency & Objectives 2009 2010 Action Plan
Quantitative Reasoning 68.9% 2.07
90% 2.52
Objective 1: The graduate will use logical and mathematical reasoning within the context of various disciplines with at least 100% proficiency
73.0% 2.19
92% 2.61
For 2010, design material to present objective in PHI 115 in a more practical manner.
Objective 2: The graduate will interpret and use mathematical formulas when instructed with at least 100% proficiency
44.5% 1.33
92% 2.61
For 2010, modify assessment material in PHI 115 to better demonstrate how to use mathematical formulas in practical situations.
Objective 3: The graduate will interpret mathematical models such as graphs, tables, and schematics, and draw inferences from them when they appear on test with at least 100% proficiency
42.4% 1.27
100% 3.00
For 2010, modify assessment material in PHI 115 to better demonstrate graphs and tables in more practical situations.
Objective 4: The graduate will use arithmetic, algebraic, geometric, and statistical models in problem solving with at least 100% proficiency
88.1% 2.64
92% 2.77
For 2010, no modifications at this time
Objective 5: The graduate will estimate and consider answers to mathematical problems in order to determine reasonableness with at least 100% proficiency
79.2% 2.40
84% 2.23
For 2010, modify assessment material in PHI 115 to better demonstrate estimating in more practical situations.
Objective 7: Graduates will recognize and communicate the appropriate applications of mathematical and statistical models when solving problems with 100% proficiency
72.3% 2.17
84% 2.23
For 2010, modify assessment material in PHI 115 to better demonstrate when to use various mathematical or statistical models in solving practical problems.
Objective 6: Graduates will represent mathematical information numerically, symbolically, and visually using graphs and charts when given standardized test with at least 100% proficiency
83.0% 2.49
84% 2.23
For 2010, no modifications at this time.
Results 2007-2008: The results from the quantitative reasoning test show that PDCCC has improved its overall graduate proficiency (proficiency + advanced proficiency) from 33.7% in 2004 to 54.6% in 2005. These scores, however, are still significantly below the VCCS proficiency or above level of 75.6% in 2005. This represents 68% of PDCCC’s benchmark for 2005 (benchmark defined as PDCCC
51
graduates achieving a proficiency rate of 80% or higher: Source: PDCCC Benchmark Report). The 2004 data also shows PDCCC performing below the VCCS in all sub-categories of quantitative reasoning. According to the 2008 Community College Survey of Student Engagement (CCSSE), the frequency of occurrence in the classroom of solving numerical problems has increased slightly from 2005 (53.4% quite a bit or very much in 2008 vs. 51.8% for 2005). The level of occurrence is also higher than the VCCS averages (48.0% in 2005 and 52.3% in 2008). However, PDCCC was below the CCSSE average for both years (52.6% vs. PDCCC 51.8% in 2005 and 54.5% vs. PDCCC 53.4% in 2008). The quantitative reasoning perception by faculty and staff (based on survey data) show an increase in quantitative reasoning rating skill level (based on a scale form 1-5 with 1 being low) from 3.53 in 2007 to 3.82 in 2008. This is reinforced by the graduate value-added (Pre-Post) survey which show the perception of skill level when students first entering the college and at graduation for 2006 to 2008. In all three years, graduates felt that there was significant improvement in skill level between when they first entered the college and at graduation (an increase in 0.81 points in 2006, 0.68 points in 2007, and 0.80 points in 2008). The overall skill level for graduates, however, remained the same for all three years (4.22 in 2006, 4.20 in 2007, and 4.21 in 2008). In examining the quantitative reasoning component in the capstone course (PHI 115), the quantitative reasoning proficiency level (determined by the instructor) from 2007-2008 had increased from 74.8% in fall 2007 to 76.9% in spring 2008. 1st Cycle Action Plan (Closing the Loop): The college needs to continue to improve on its capstone course. The capstone team of instructors needs to develop a quantitative reasoning rubric in order to better identify weaknesses in sub-categories of quantitative reasoning. Each fall and spring term, the quantitative reasoning rubric will be used in the PHI 115 class assessment and in the development of action plans for course improvement. When the class action plan is completed at the end of term, it will be sent to their dean and to the Director of Assessment & IR. The General Education Committee will identify other courses that have primary objectives under quantitative reasoning and decide which ones should have the instructor assess quantitative reasoning skills using a rubric. An analysis of the college’s curriculum map will help in this process. Courses with a primary quantitative reasoning objective will be included in that course syllabus.
52
The college will develop a quantitative reasoning module and post it on the college’s web site so that faculty will be able to use it in their classes when they have quantitative reasoning assignments.
All lead faculty should survey employers of their graduates on skill levels related to core competencies. The Director of Assessment & IR has an employer survey online available for lead faculty use. Results 2008-2009: The graduate value-added (Pre-Post) survey shows the perception of skill level when students first entering the college and at graduation for 2006 to 2009. In all four years, graduates felt that there was significant improvement in skill level between when they first entered the college and at graduation (an increase in 0.81 points in 2006, 0.68 points in 2007, 0.80 points in 2008, and 0.77 points in 2009). The overall skill level for graduates, however, has decreased slightly in 2009 (4.22 in 2006, 4.20 in 2007, 4.21 in 2008, and 4.14 in 2009). In the capstone course, PHI 115, the overall proficiency rating was 68.9%. This was well below the goal of 100% proficiency. The weakest sub-categories of quantitative reasoning pertained to the ability to use mathematical formulas (44.5%) and to interpret mathematical models such as graphs, tables, and schematics (42.4%). All other categories ranged from 72% to 88% proficiency. 2st Cycle Action Plan (Closing the Loop): Over the past few years the cut-scores requirements for students to take college level math courses have been increased state wide using COMPASS based on student performance. Approximately five years ago, the college tightened the mathematics requirement for transfer programs so that only MTH courses numbered 150 or above will count in the program. In the past several years, to increase success rates in credit level courses, mathematics faculty have
dedicated a great deal of time and effort on improving the developmental education program. One of
their goals was to improve content understanding and retention. Once students were enrolled in a
credit course, emphasis was placed on critical thinking skills to better enable students to use knowledge
gained during class in their everyday lives. Technology continued to be a valuable tool for teaching and
learning.
After a review of data, it was determined that pedagogical methods are in need of change to better
meet the needs of students who have various learning styles. Full-time and adjunct faculty will work
together to identify possible areas of weakness in developmental and credit courses. When
appropriate, mathematics faculty will have professional development training in content delivery and
assessment.
53
Numerous students who enrolled in MTH 163 on the Suffolk Campus for fall 2009 were abnormally deficient in prerequisite skills and knowledge. Multiple pedagogical methods were used to meet the various needs of the students. Data was gathered on 17 students, a very small sample size. An evaluation of the data indicated that 53% of the students are prepared for the next math course (MTH 164- Precalculus 2 or MTH 240-Statistics). Until the remaining 47% increase their knowledge of basic mathematics and algebra, they will continue to have difficulties with the subject matter of MTH 163. Continue to tweak the quantitative rubric. The proficiency level should be lowered from 100% to maybe 70% in each sub-category. Faculty should incorporate the recommended changes to the capstone course, PHI 115 (see table above). Special emphasis should be placed on the use of mathematical formulas and the use of graphs, tables, and schematics.
Results 2009-2010: On the Quantitative Reasoning Test developed by James Madison University and adopted by the Virginia Community College System (VCCS), the 2009 graduates showed a statistical value-added for all VCCS quantitative reasoning core objectives using a cross-sectional analysis when compared to new degree students enrolled in fall of 2008. On the STAGE test based on a 10=point scale developed by the Virginia Community College System (VCCS) Assessment Coordinators, the 2010 graduates scored a 5.00. This was above the benchmark set at 3.00. On the Faculty and Staff Survey, the 2010 graduates were rated 4.00 on a 5-point scale with 1 being low. This was an increase from 2008 graduates with 3.82 and 2007 graduates with 3.53. This is also above the benchmark score set at 3.00. The Graduate Survey based on a 5-point scale with 1 being low showed value-added fo0r the 2010 graduates. Their score increased from 3.54 upon entering the college to 4.15 at graduation. The 2010 graduates also showed a slight increase from the 2009 graduates’ score of 4.14. The Capstone Course based on an 80% proficiency rubric showed that the 2010 graduates were proficient in quantitative reasoning skills 90% of the time vs. 69% in 2009. The rubric also showed the 2010 graduates had a rating of 2.52 vs. 2.07 for 2009 (based on a 0-3 scale with 3 being the highest). The weakest areas for 2010 graduates was in the area of estimating and considering answers to mathematical problems in order to determine reasonableness; and being able to represent mathematical information numerically, symbolically, and visually.
54
3rd Cycle Action Plan (Closing the Loop):
Overall college data with 84% or better proficiency in six objectives were consistent with our rubric
measures. Instructors continued to emphasize the significance of SI units in science.
In the capstone course, a Using Data from a Chart section was included in the Quantitative Reasoning
module. It introduced diverse types of graphs and provides numerous examples related to interpreting
graphs. Students learned methods that assist in describing quantitative data and data relationships using
numerical methods of analysis and symbolic representations in an effort to organize, interpret, plan and
execute the appropriate quantitative reasoning operation. Interactive exercises and quizzes were
included.

55
Analysis Scientific Reasoning
Scientific Reasoning Test Comparison Developed by James Madison University & VCCS
PDCCC Degree Graduates
2004 2005
Status PDCCC VCCS PDCCC VCCS
Not Proficient 62.4% NA 36.4% 4.0%
Proficient 35.6% NA 50.6% 79.3%
Advanced 2.0% NA 13.0% 16.7%
Note: VCCS Mean score 19.97 (20/35 items) = 57% Note: PDCCC Benchmark = Graduates will achieve a proficiency rate of 80% or higher
Scientific Reasoning Objectives 2004 PDCCC
Average
PDCCC
Median
VCCS
Average
1. Generate an empirically evidenced and logical argument.
(7 items)
3.6 4.0 3.6
2. Distinguish a scientific argument from a non-scientific
argument. (10 items ) 4.7 5.0 5.0
3. Reason by deduction, induction and analogy. (11 items)
7.3 7.0 7.8
4. Distinguish between causal and correlational relationships.
(7 items)
3.5 4.0 3.6
5. Recognize methods of inquiry that lead to scientific knowledge na na na
Descriptive Statistics and Independent t-Test Results Scientific Reasoning Objectives
(Developed by James Madison University & VCCS) PDCCC Degree-Seeking Students
2008 New Degree Students and 2009 Graduates
Pre-Test N=81
Post-Test N=114
Ind. t-Test Pre/Post Difference
Objective Mean Std Dev
Min. Max. Mean Std Dev
Min. Max. Diff t-obs. DF Probt Sig at .05
1 6.0 vs.
2.3 1 10 7.7 vs.
2.19 3 13 1.8 -5.478 193 0.000 *
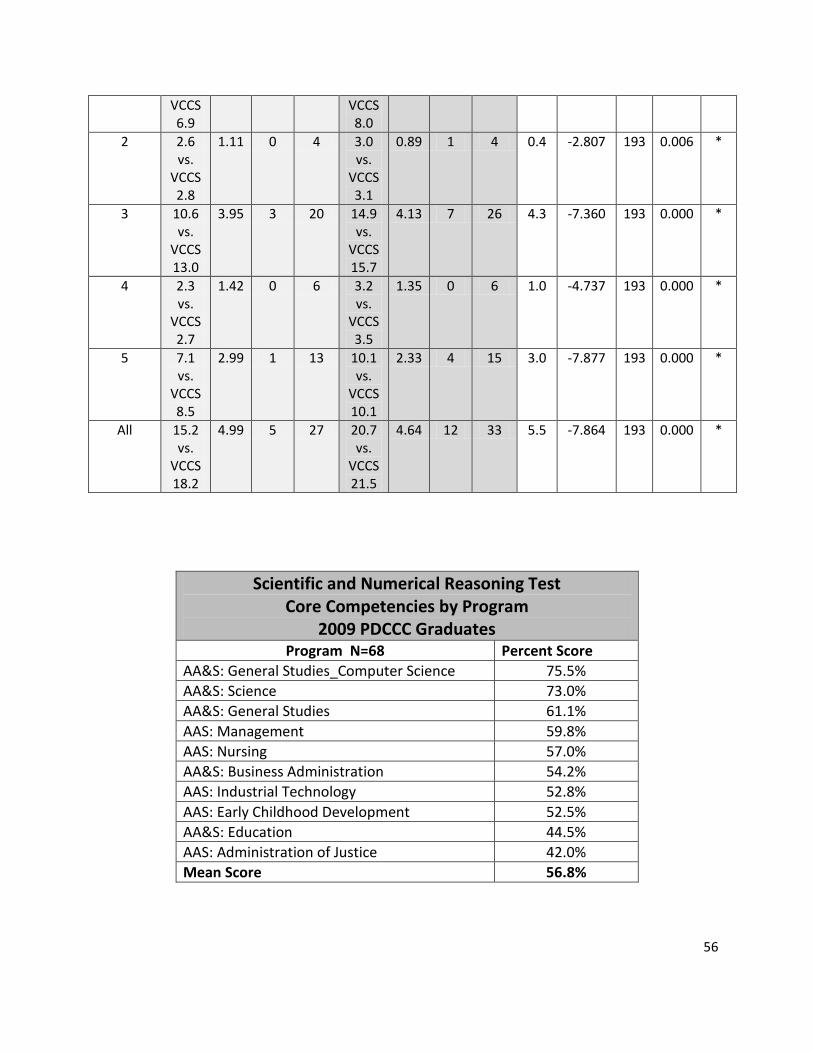
56
VCCS 6.9
VCCS 8.0
2 2.6 vs.
VCCS 2.8
1.11 0 4 3.0 vs.
VCCS 3.1
0.89 1 4 0.4 -2.807 193 0.006 *
3 10.6 vs.
VCCS 13.0
3.95 3 20 14.9 vs.
VCCS 15.7
4.13 7 26 4.3 -7.360 193 0.000 *
4 2.3 vs.
VCCS 2.7
1.42 0 6 3.2 vs.
VCCS 3.5
1.35 0 6 1.0 -4.737 193 0.000 *
5 7.1 vs.
VCCS 8.5
2.99 1 13 10.1 vs.
VCCS 10.1
2.33 4 15 3.0 -7.877 193 0.000 *
All 15.2 vs.
VCCS 18.2
4.99 5 27 20.7 vs.
VCCS 21.5
4.64 12 33 5.5 -7.864 193 0.000 *
Scientific and Numerical Reasoning Test Core Competencies by Program
2009 PDCCC Graduates Program N=68 Percent Score
AA&S: General Studies_Computer Science 75.5%
AA&S: Science 73.0%
AA&S: General Studies 61.1%
AAS: Management 59.8%
AAS: Nursing 57.0%
AA&S: Business Administration 54.2%
AAS: Industrial Technology 52.8%
AAS: Early Childhood Development 52.5%
AA&S: Education 44.5%
AAS: Administration of Justice 42.0%
Mean Score 56.8%
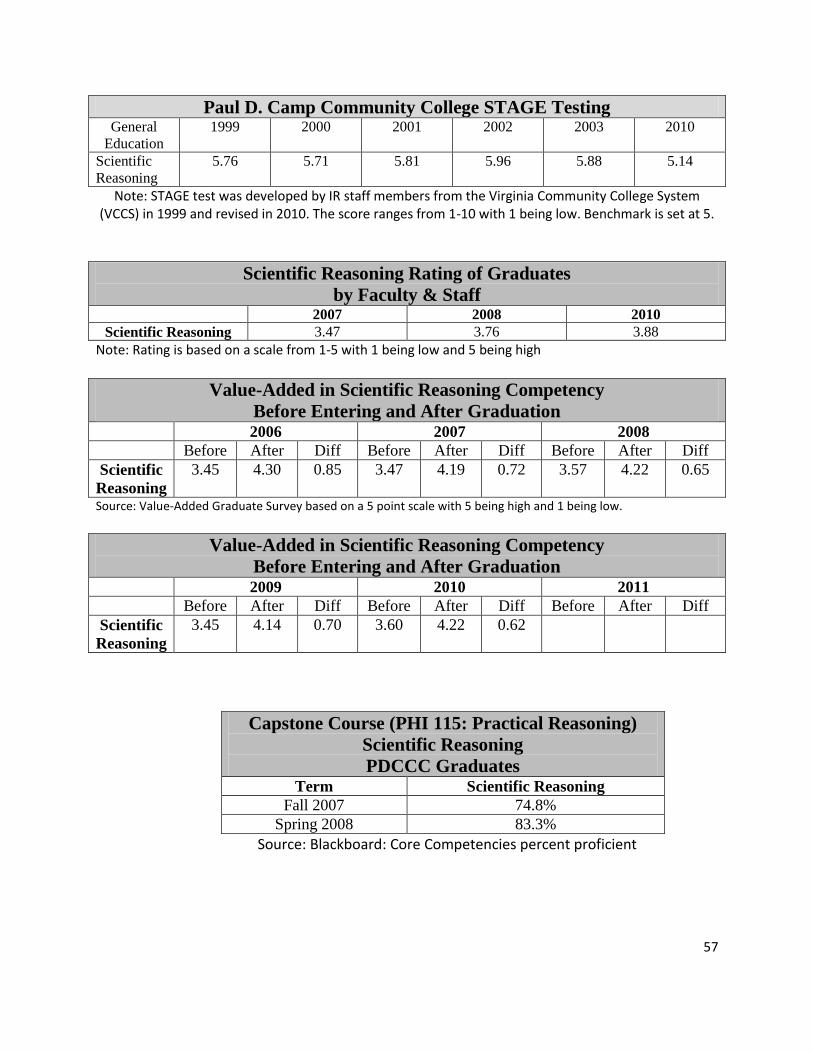
57
Paul D. Camp Community College STAGE Testing General
Education
1999 2000 2001 2002 2003 2010
Scientific
Reasoning
5.76 5.71 5.81 5.96 5.88 5.14
Note: STAGE test was developed by IR staff members from the Virginia Community College System (VCCS) in 1999 and revised in 2010. The score ranges from 1-10 with 1 being low. Benchmark is set at 5.
Scientific Reasoning Rating of Graduates
by Faculty & Staff 2007 2008 2010
Scientific Reasoning 3.47 3.76 3.88
Note: Rating is based on a scale from 1-5 with 1 being low and 5 being high
Value-Added in Scientific Reasoning Competency
Before Entering and After Graduation 2006 2007 2008
Before After Diff Before After Diff Before After Diff
Scientific
Reasoning
3.45 4.30 0.85 3.47 4.19 0.72 3.57 4.22 0.65
Source: Value-Added Graduate Survey based on a 5 point scale with 5 being high and 1 being low.
Value-Added in Scientific Reasoning Competency
Before Entering and After Graduation 2009 2010 2011
Before After Diff Before After Diff Before After Diff
Scientific
Reasoning
3.45 4.14 0.70 3.60 4.22 0.62
Capstone Course (PHI 115: Practical Reasoning)
Scientific Reasoning
PDCCC Graduates
Term Scientific Reasoning
Fall 2007 74.8%
Spring 2008 83.3%
Source: Blackboard: Core Competencies percent proficient
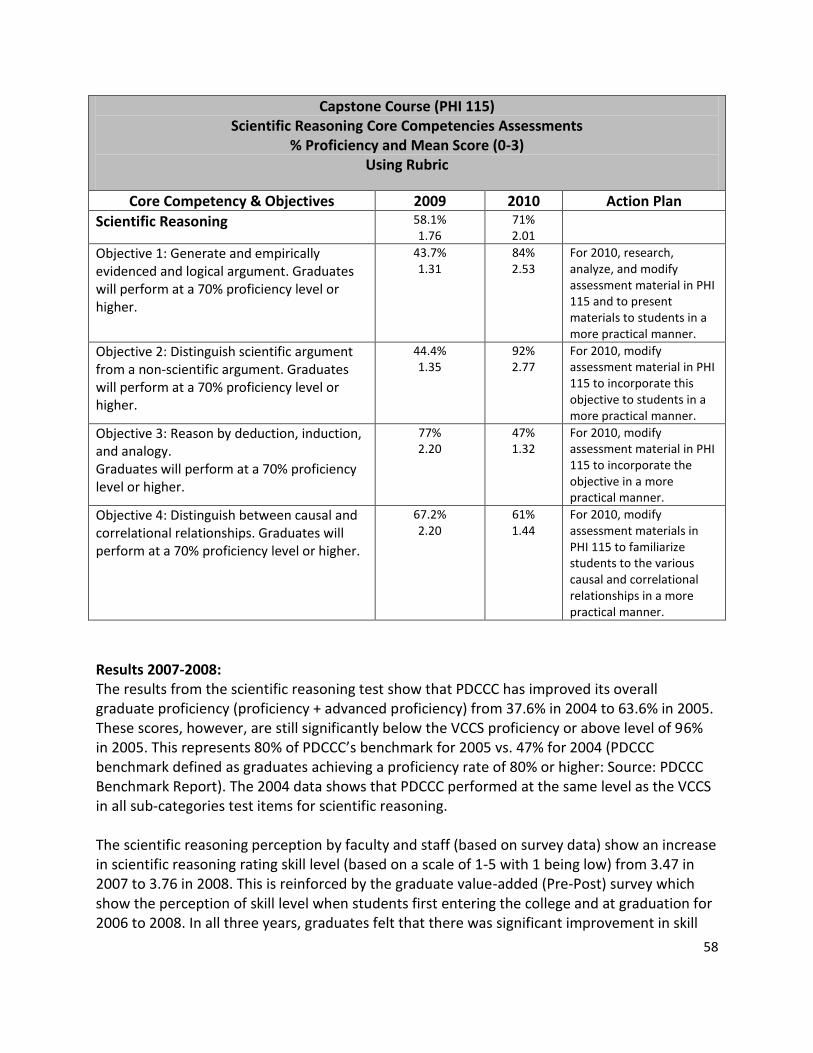
58
Capstone Course (PHI 115) Scientific Reasoning Core Competencies Assessments
% Proficiency and Mean Score (0-3) Using Rubric
Core Competency & Objectives 2009 2010 Action Plan
Scientific Reasoning 58.1% 1.76
71% 2.01
Objective 1: Generate and empirically evidenced and logical argument. Graduates will perform at a 70% proficiency level or higher.
43.7% 1.31
84% 2.53
For 2010, research, analyze, and modify assessment material in PHI 115 and to present materials to students in a more practical manner.
Objective 2: Distinguish scientific argument from a non-scientific argument. Graduates will perform at a 70% proficiency level or higher.
44.4% 1.35
92% 2.77
For 2010, modify assessment material in PHI 115 to incorporate this objective to students in a more practical manner.
Objective 3: Reason by deduction, induction, and analogy. Graduates will perform at a 70% proficiency level or higher.
77% 2.20
47% 1.32
For 2010, modify assessment material in PHI 115 to incorporate the objective in a more practical manner.
Objective 4: Distinguish between causal and correlational relationships. Graduates will perform at a 70% proficiency level or higher.
67.2% 2.20
61% 1.44
For 2010, modify assessment materials in PHI 115 to familiarize students to the various causal and correlational relationships in a more practical manner.
Results 2007-2008: The results from the scientific reasoning test show that PDCCC has improved its overall graduate proficiency (proficiency + advanced proficiency) from 37.6% in 2004 to 63.6% in 2005. These scores, however, are still significantly below the VCCS proficiency or above level of 96% in 2005. This represents 80% of PDCCC’s benchmark for 2005 vs. 47% for 2004 (PDCCC benchmark defined as graduates achieving a proficiency rate of 80% or higher: Source: PDCCC Benchmark Report). The 2004 data shows that PDCCC performed at the same level as the VCCS in all sub-categories test items for scientific reasoning. The scientific reasoning perception by faculty and staff (based on survey data) show an increase in scientific reasoning rating skill level (based on a scale of 1-5 with 1 being low) from 3.47 in 2007 to 3.76 in 2008. This is reinforced by the graduate value-added (Pre-Post) survey which show the perception of skill level when students first entering the college and at graduation for 2006 to 2008. In all three years, graduates felt that there was significant improvement in skill
59
level between when they first entered the college and at graduation (an increase in 0.85 point in 2006, 0.72 points in 2007, and 0.65 points in 2008. The overall skill level for graduates, however, remained fairly flat with 4.19 in 2007 and 4.22 in 2008. In examining the scientific reasoning component in the capstone course (PHI 115), the scientific reasoning proficiency level (determined by the instructor) from 2007-2008 had increased from 74.8% in fall 2007 to 83.3% in spring 2008. 1st Cycle Action Plan (Closing the Loop): The college needs to continue to improve on its capstone course. The capstone team of instructors needs to develop a scientific reasoning rubric in order to better identify weaknesses in sub-categories of scientific reasoning. Each fall and spring term, the scientific reasoning rubric will be used in PHI 115 class assessment and in the development of action plans for course improvement. When the class action plan is completed at the end of term, it will be sent to their dean and to the Director of Assessment & IR. All BIO classes will use the scientific reasoning rubric for class assessment and in the development of action plans for course improvement. When the class action plan is completed, it will be sent to their dean and to the Director of Assessment & IR. The General Education Committee will identify other courses that have primary objectives under scientific reasoning an d decide which ones should have the instructor assess scientific reasoning skills using a rubric. An analysis of the college’s curriculum map will help in this process. Courses with a primary scientific reasoning objective will be included in that course syllabus. The college will develop a scientific reasoning module and post it on the college’s web site so that faculty will be able to use it in their classes when they have scientific reasoning assignments. All lead faculty should survey employers of their graduates on skill levels related to core competencies. The Director of Assessment & IR has an employer survey online available for lead faculty use. Results 2008-2009: In general, the AA&S degrees did better than the AAS degree graduates on the VCCS Scientific and Numerical Reasoning Test. Administration of Justice graduates had the lowest mean scores (42%) and AA&S in General Studies-Computer Science had the highest mean score (75.5%). The average score was 56.8%.
60
The graduate value-added (Pre-Post) survey shows the perception of skill level when students first entering the college and at graduation for 2006 to 2009. In all four years, graduates felt that there was significant improvement in skill level between when they first entered the college and at graduation (an increase in 0.85 point in 2006, 0.72 points in 2007, 0.65 points in 2008, and 0.70 points in 2009. The overall skill level for graduates, however, has decreased in 2009 (4.22 in 2008 vs. 4.14 in 2009). In the capstone course, PHI 115, the proficiency level was 58.1%. This was below the goal of at least 70% proficiency. The sub-categories show the weakest areas are in (1) understanding empirical evidence and logical arguments (43.7% proficiency) and (2) distinguishing scientific arguments from a non-scientific argument (44.4% proficiency). 2st Cycle Action Plan (Closing the Loop): Each semester presents a new set of challenges based on the skills readiness of students enrolled in our
basic science courses. Perhaps our most important achievement is in reducing the number of students
dropping out prior to completion of the course; less than one in ten students for some courses such as
general biology, BIO 101, and virtually 100% completion rates for other courses such as BIO 150 and BIO
205 – Introductory Microbiology and General Microbiology, respectively. Individual performance has
also improved markedly (Please see sample Assessment Rubric below).
Efforts towards offering personalized academic help and services to students, as opposed to general,
formal guidelines for academic instructions, plus innovative classroom dynamics, in form of active
learning groups, have helped tremendously in enhancing the flavor of learning and captivating students’
interests. This is evident in broader skills acquisition and ability to employ and transfer new skills into
new concepts and activities (Please see sample Assessment Rubrics).
Allowing for changes in the composition of students lab/activity groups has enhanced personal
compatibility, and for greater interaction and ease of work amongst students.
The plan for spring 2010 and subsequent semesters is allow for and cultivate greater creativity on the
part of the student by providing minimal, unrestrictive guidelines to students’ field and in-door learning
activities. There will also be greater infusion of sustainability component in most of the basic science
courses. This will enable students recognize the human and global relevancies of their curricula, and
likely promote greater citizenry education and responsibility.
Continue to tweak the new scientific reasoning rubric. Faculty should make the recommended changes in the capstone course, PHI 115 (see table above). The Administration of Justice Program should see how it can incorporate more reasoning skills in its classes.

61
Laboratory exercises are being modified to tackle more problems that address the scientific method, especially in attempting to distinguish scientific from non-scientific arguments. In addition, the pre-lab segment for each weekly laboratory activities will be enhanced to incorporate specific logic, empirical, and testing principles.
Results 2009-2010: On the Scientific Reasoning Test developed by James Madison University and adopted by the Virginia Community College System (VCCS), the 2009 graduates showed a statistical value-added for all VCCS scientific reasoning core objectives using a cross-sectional analysis when compared to new degree students enrolled in fall of 2008. On the STAGE test based on a 10-point scale and developed by the Virginia Community College System (VCCS) Assessment Coordinators, the 2010 graduates scored a 5.14 which was above the benchmark score set at 5.00. On the Faculty and Staff Survey, the 2010 graduates were rated 3.88 on a 5-point scale with 1 being low. This was an increase from 2008 graduates’ score of 3.76 and 2007 graduates’ score of 3.47. This is within the benchmark set at 3.00. The Graduate Survey based on a 5-point scale with 1 being low showed value added for the 2010 graduates. Their score increased from 3.60 upon entering the college to 4.22 at graduation. The 2010 graduates also showed an increase from the 2009 graduates’ score of 4.14. The Capstone Course based on an 80% proficiency rubric showed that the 2010 graduates were proficient in scientific reasoning skills 71% of the time vs. 58% in 2009. The rubric also showed the 2010 graduates had a rating of 2.01 vs. 1.76 (based on a 0-3 scale with 3 being the highest). The weakest area of 2010 graduates was in the area of reasoning by deduction, induction, and analogy (47% proficiency). 3rd Cycle Action Plan (Closing the Loop): In the science courses, the rubric used with this small sample size scored objective 3 with 78%.
This score is more in line with the 2009 data than the 2010 data which was only 47%
proficiency. The instructors have increased the number of lab sessions offered that involved
experimental design. The increase from three to five to address objective #3 (deduction,
induction, and analogy) has provided more experiences for enrolled students.
Courses have allowed for and cultivated greater creativity on the part of the students by providing
minimal, unrestrictive guidelines to students’ field and in-door learning activities. There has been
greater infusion of sustainability component in most of the basic science courses. This has enabled
62
students to recognize the human and global relevancies of their curricula, and promoted greater
citizenry education and responsibility.
The new scientific reasoning rubric has received minor modification. This is an ongoing process. In the capstone course, a Methods of Scientific Inquiry section was included in the Empirical Evidence
and Logical Argument section. The section introduced students to various scientific methods of inquiry
related to data collection that leads to scientific knowledge. It familiarized students how to effectively
select the appropriate form of inquiry, interpret scientific data, draw inferences from analyzed data, and
test the conclusion in order to gain reasonable scientific knowledge.