general conduct of - awajis...2 general conduct of 2016 unified tertiary matriculation examination...
TRANSCRIPT

1

2
GENERAL CONDUCT OF
2016 UNIFIED TERTIARY MATRICULATION EXAMINATION
The 2016 Unified Tertiary Matriculation Examination (UTME)was conducted EXCLUSIVELY on a Computer-Based Testing(CBT) mode from Saturday, 27th February to Wednesday, 23rd
March, 2016.
INTRODUCTION
The examination was conducted throughout the Federationand eight Foreign Centres viz:
1. Benin Republic,2. Cameroun,3. Cote D’ Ivoire,4. Ethiopia,5. Ghana,6. Saudi Arabia,7. South Africa, and8. United Kingdom
3
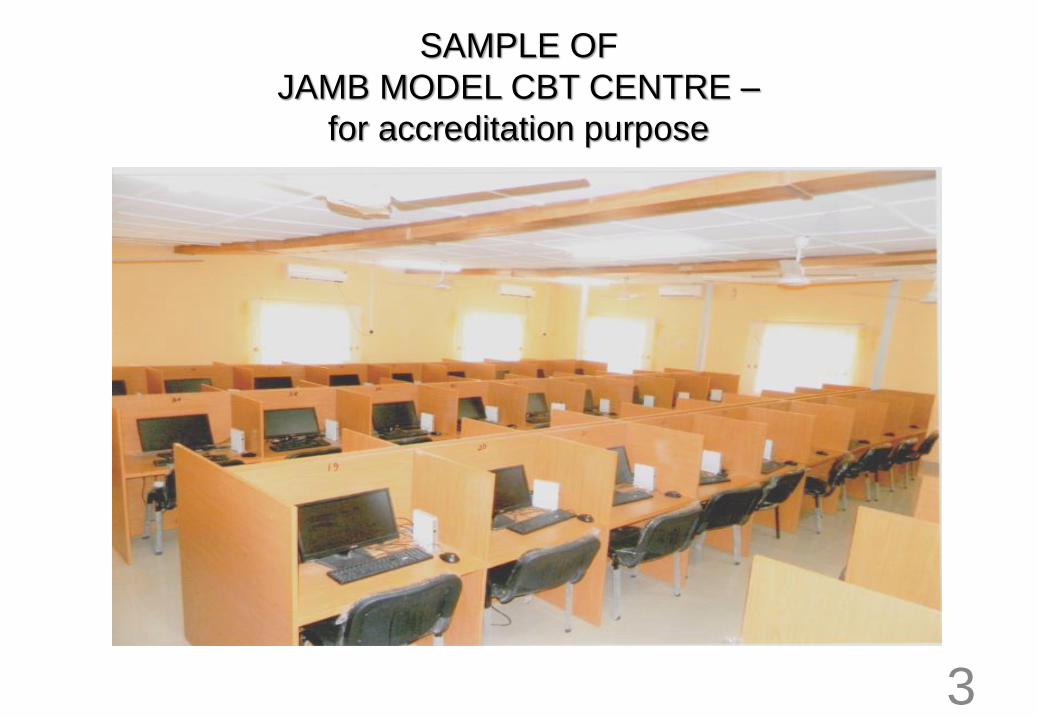
SAMPLE OF
JAMB MODEL CBT CENTRE –
for accreditation purpose

4
STATISTICAL REPORTS ON
2015 ADMISSIONS

5
REPORT ON THE CONDUCT OF THE
2015/2016 ADMISSIONS TO TERTIARY INSTITUTIONS
Guidelines and decisions of the 2015 Combined Policy Meetingwere implemented at the Technical Committee Meetings,under the Chairmanship of the Registrar/Chief Executive ofthe Board through thirty (30) Admissions Panels. Each Panelwas chaired by a Management staff of the Board.
Institutions present at the meetings also made submissionsfor consideration and approval by the Admissions Panels.
Ahmadu Bello University, Zaria is commended forthorough and prompt admissions exercise.

6
ADMISSION OF
VISUALLY IMPAIRED CANDIDATES
Reminder!!!
Institutions are again requested to give specialpreference and easy clearance to candidates who areVisually Impaired.
The Board commends and thanks the authorities of thefollowing institutions for their compliance:
7
S/N INSTITUTIONNO. OF
APPLICANTS
NO.
ADMITTED
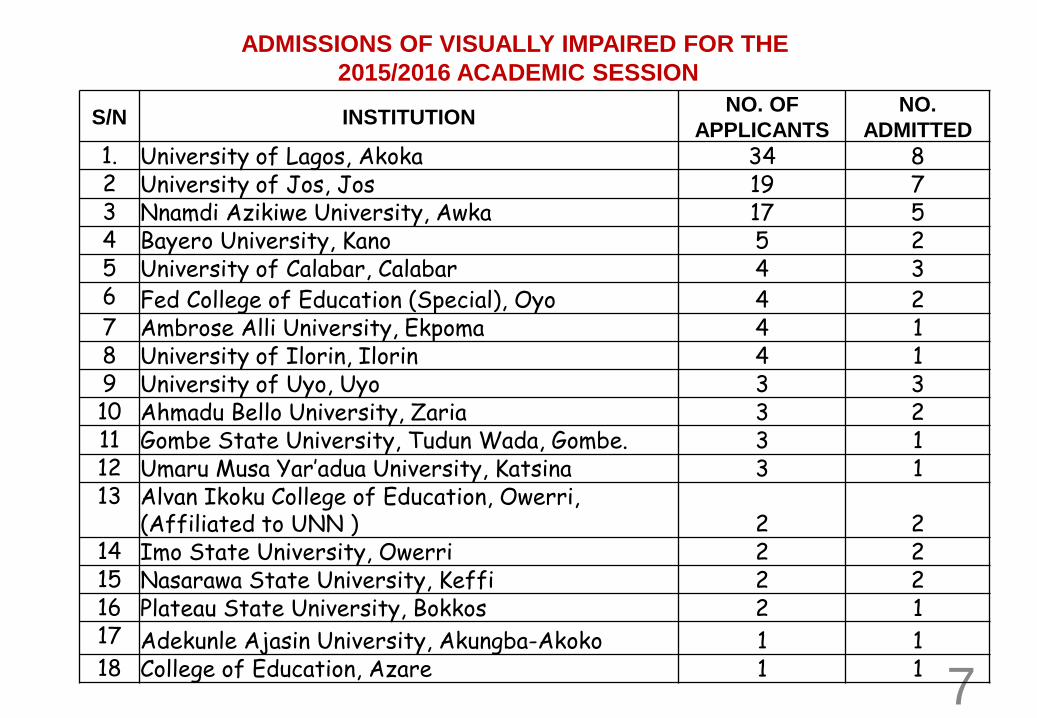
1. University of Lagos, Akoka 34 82 University of Jos, Jos 19 73 Nnamdi Azikiwe University, Awka 17 54 Bayero University, Kano 5 25 University of Calabar, Calabar 4 36 Fed College of Education (Special), Oyo 4 27 Ambrose Alli University, Ekpoma 4 18 University of Ilorin, Ilorin 4 19 University of Uyo, Uyo 3 310 Ahmadu Bello University, Zaria 3 211 Gombe State University, Tudun Wada, Gombe. 3 112 Umaru Musa Yar’adua University, Katsina 3 113 Alvan Ikoku College of Education, Owerri,
(Affiliated to UNN ) 2 214 Imo State University, Owerri 2 215 Nasarawa State University, Keffi 2 216 Plateau State University, Bokkos 2 117 Adekunle Ajasin University, Akungba-Akoko 1 118 College of Education, Azare 1 1
ADMISSIONS OF VISUALLY IMPAIRED FOR THE
2015/2016 ACADEMIC SESSION

8
2015 UTME ADMISSIONS STATISTICS BY FACULTY
-
20,000
40,000
60,000
80,000
100,000
120,000
6,929
21,037 21,498
30,662 32,938
44,100
55,171
66,972
105,198
9
STATISTICAL REPORTS ON
2016 UTME APPLICATIONS

10
PREFERENCETOTAL
APPLICATIONS
PERCENTAGE
(%)
DEGREE 1,557,017 97.78
NCE 17,673 1.11
ND 17,584 1.10
NID 31 0.002
TOTAL 1,592,305 100

11
GRAPHICAL PRESENTATION OF
2016 APPLICATIONS STATISTICS OF INSTITUTIONS
BY FIRST CHOICE PREFERENCE
DEGREE NCE ND NID
1,557,017
17,673 17,584 31
(97.78%)
(1.10%)(1.11%) (0.002%)
12
S/N ITEM 2015 UTME 2016 UTME
PERCENTAGE
INCREASE
(+%)
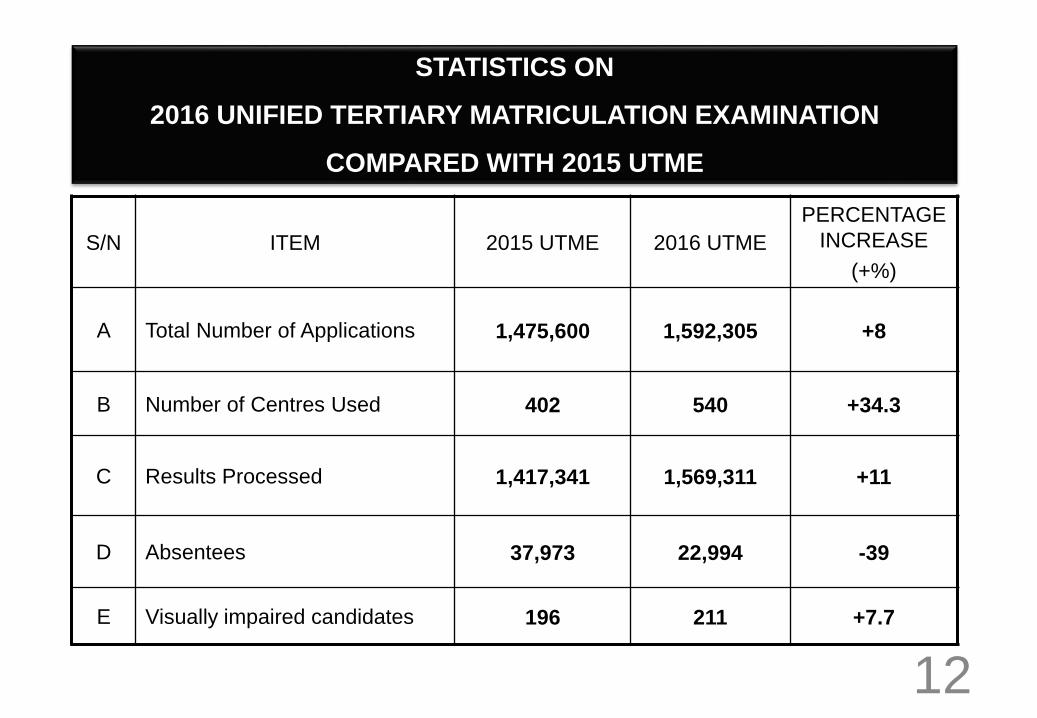
A Total Number of Applications 1,475,600 1,592,305 +8
B Number of Centres Used 402 540 +34.3
C Results Processed 1,417,341 1,569,311 +11
D Absentees 37,973 22,994 -39
E Visually impaired candidates 196 211 +7.7
STATISTICS ON
2016 UNIFIED TERTIARY MATRICULATION EXAMINATION
COMPARED WITH 2015 UTME
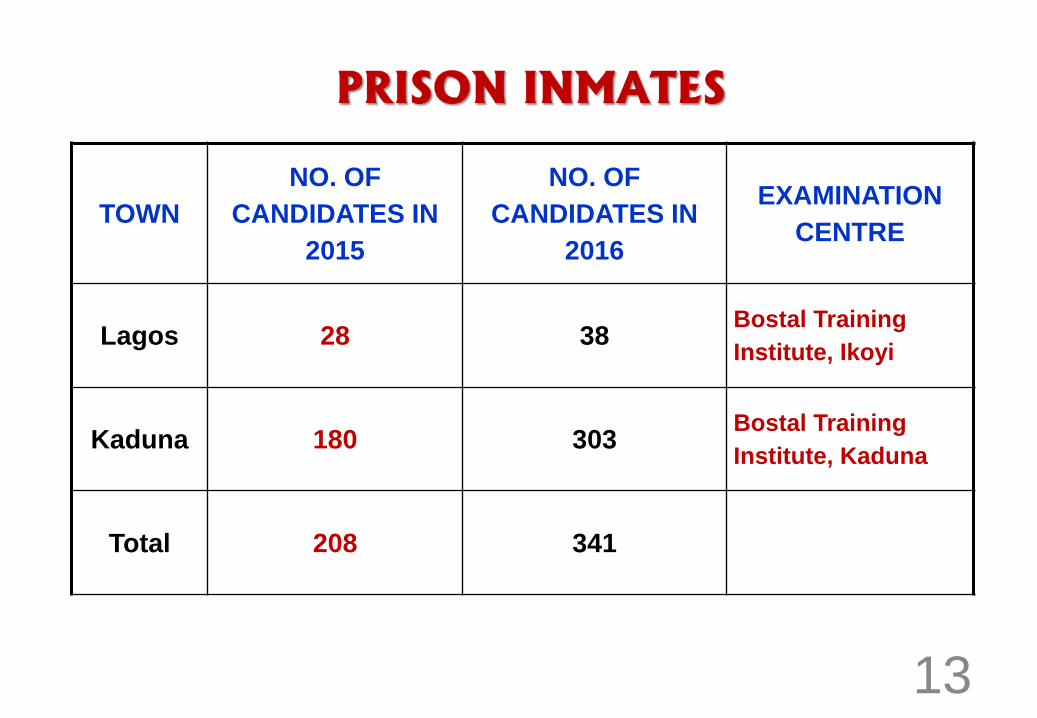
13
TOWN
NO. OF
CANDIDATES IN
2015
NO. OF
CANDIDATES IN
2016
EXAMINATION
CENTRE
Lagos 28 38Bostal Training
Institute, Ikoyi
Kaduna 180 303Bostal Training
Institute, Kaduna
Total 208 341

14
2016 UTME
CUMMULATIVE PERFORMANCE STATISTICS
S/N CUM. RANGE NO OF
CANDIDATES
PERCENTAGE
(%)
CUM. PERCENT
(%)
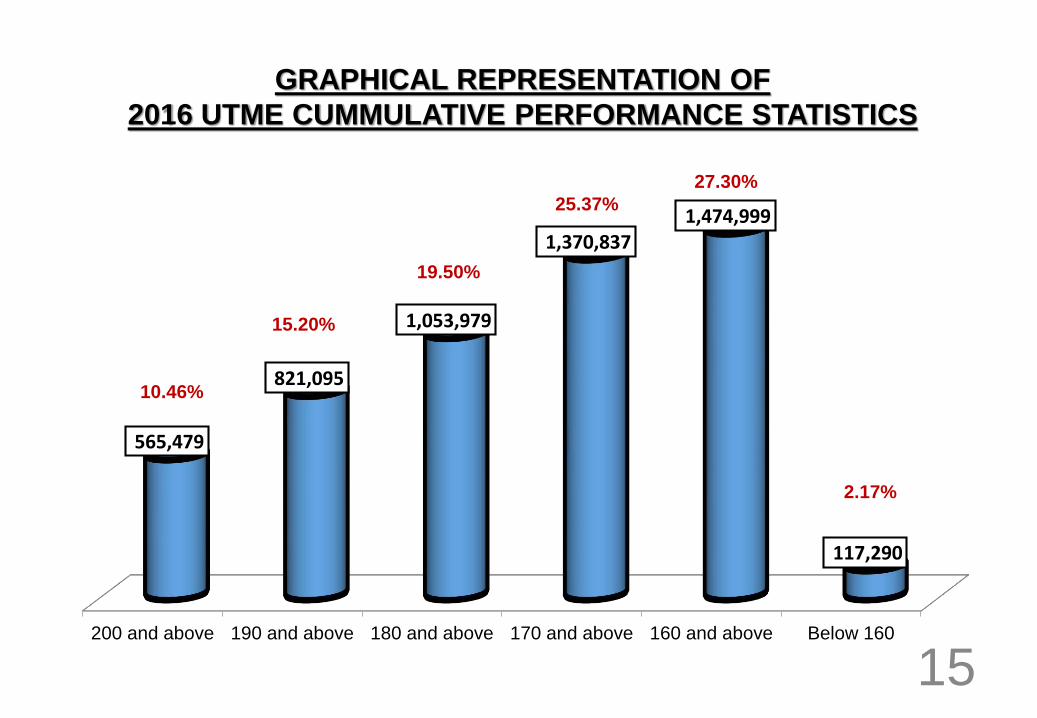
1 200 and above 565,479 10.46 10.46
2
3 180 and above 1,053,979 19.50 45.16
4 170 and above 1,370,837 25.37 70.53
5 160 and above 1,474,999 27.30 97.83
6 Below 160 117,290 2.17 100
2 190 and above 821,095 15.20 25.66
If 190 is minimum score, we still can FILL the carryingcapacity of ALL tertiary institutions in Nigeria – 695,449
15
GRAPHICAL REPRESENTATION OF
2016 UTME CUMMULATIVE PERFORMANCE STATISTICS
200 and above 190 and above 180 and above 170 and above 160 and above Below 160
565,479
821,095
1,053,979
1,370,837 1,474,999
117,290
10.46%
15.20%
19.50%
25.37%
2.17%
27.30%

16
S/N STATE TOTALPERCENTAGE
(%)1 ABIA 51,619 3.242 ADAMAWA 15,615 0.983 AKWA IBOM 62,369 3.924 ANAMBRA 77,694 4.885 BAUCHI 19,462 1.226 BAYELSA 21,208 1.337 BENUE 60,160 3.788 BORNO 15,697 0.999 CROSS RIVER 29,763 1.87
10 DELTA 78,854 4.9511 EBONYI 32,806 2.0612 EDO 66,107 4.1513 EKITI 34,398 2.1614 ENUGU 69,381 4.3615 GOMBE 19,729 1.2416 IMO 104,383 6.5617 JIGAWA 12,664 0.8018 KADUNA 54,227 3.4119 KANO 48,579 3.05
2016 UTME APPLICATION STATISTICS BY STATE OF ORIGIN

17
S/N STATE TOTAL PERCENTAGE (%)
20 KATSINA 23,522 1.48
21 KEBBI 8,947 0.56
22 KOGI 57,694 3.62
23 KWARA 54,606 3.43
24 LAGOS 24,160 1.52
25 NASARAWA 30,599 1.92
26 NIGER 18,231 1.14
27 OGUN 62,973 3.95
28 ONDO 54,110 3.40
29 OSUN 72,752 4.57
30 OYO 72,298 4.54
31 PLATEAU 34,469 2.16
32 RIVERS 41,331 2.60
33 SOKOTO 10,006 0.63
34 TARABA 15,672 0.98
35 YOBE 10,045 0.63
36 ZAMFARA 5,295 0.33
37 FCT 4,087 0.26
38 OTHERS 59 0.004

1818
2016 UTME APPLICATION STATISTICS BY
STATE OF ORIGIN
-
20,000
40,000
60,000
80,000
100,000
120,000IM
O
DE
L
AN
AM
OS
UN
OY
O
EN
U
ED
O
OG
UN
AK
/IB
BE
N
KO
G
KW
A
KA
D
ON
D
AB
IA
KA
N
RIV
PLA
EK
T
EB
Y
NA
S
C/R
IV
LA
G
KA
T
BA
Y
GO
M
BA
U
NIG
BO
R
TA
R
AD
AM
JIG
YO
B
SO
K
KE
B
ZA
M
FC
T
OT
HE
RS

19
2016 UTME APPLICATION STATISTICS BY
STATE OF ORIGIN AND GENDER
-
10,000
20,000
30,000
40,000
50,000
60,000
IMO
DE
L
AN
AM
OS
UN
OY
O
EN
U
ED
O
OG
UN
AK
/IB
BE
N
KO
G
KW
A
KA
D
ON
D
AB
IA
KA
N
RIV
PLA
EK
T
EB
Y
NA
S
C/R
IV
LA
G
KA
T
BA
Y
GO
M
BA
U
NIG
BO
R
TA
R
AD
AM
JIG
YO
B
SO
K
KE
B
ZA
M
FC
T
MALE
FEMALE
20
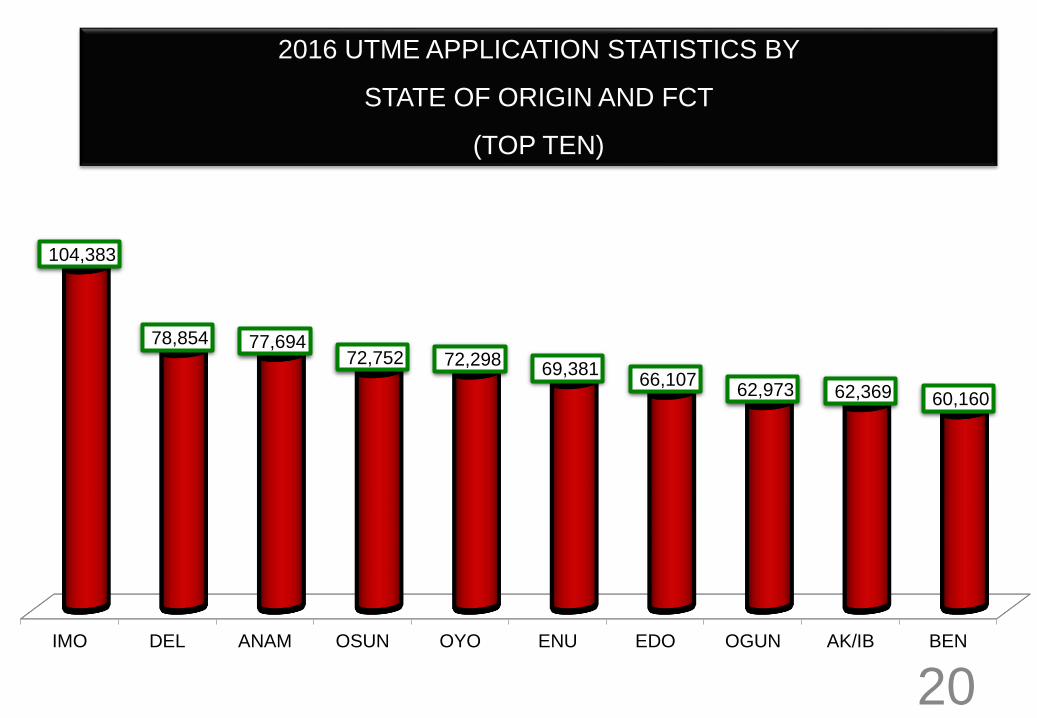
2016 UTME APPLICATION STATISTICS BY
STATE OF ORIGIN AND FCT
(TOP TEN)
IMO DEL ANAM OSUN OYO ENU EDO OGUN AK/IB BEN
104,383
78,854 77,694 72,752 72,298
69,381 66,107
62,973 62,369 60,160

21
2016 UTME APPLICATION STATISTICS BY
STATE OF ORIGIN AND FCT
(LOWEST TEN)
-
2,000
4,000
6,000
8,000
10,000
12,000
14,000
16,000
18,000
20,000
NIG BOR TAR ADAM JIG YOB SOK KEB ZAM FCT
18,231
15,697 15,672 15,615
12,664
10,045 10,006 8,947
5,295
4,087

22
2016 UTME APPLICATION STATISTICS BY FACULTY
-
50,000
100,000
150,000
200,000
250,000
300,000
350,000
400,000362,567
336,694
228,195 217,150
135,275
95,182 88,029 68,481
25,445

23
2016 UTME APPLICATION STATISTICS BY
TECHNOLOGY AND NON-TECHNOLOGY BASED COURSES
(POLYTECHNICS/MONOTECHNICS/IEI’s) – FIRST CHOICE
-
2,000
4,000
6,000
8,000
10,000
12,000
14,000
TECHNOLOGY NON-TECHNOLOGY
4,669
12,923
0.29%
0.81%
24
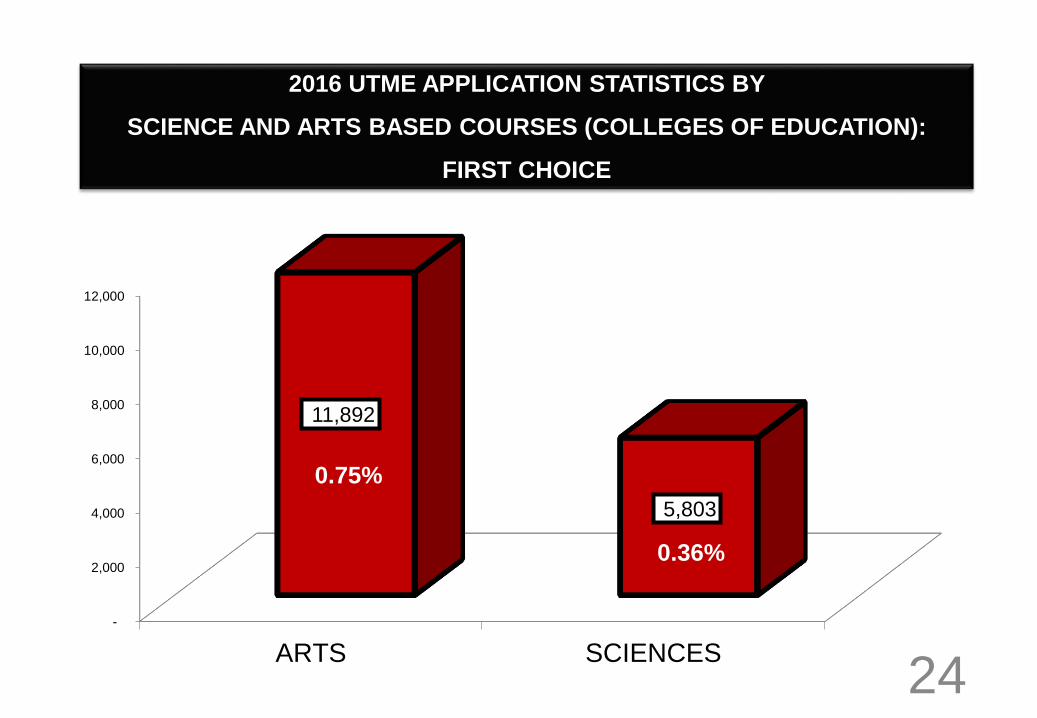
2016 UTME APPLICATION STATISTICS BY
SCIENCE AND ARTS BASED COURSES (COLLEGES OF EDUCATION):
FIRST CHOICE
-
2,000
4,000
6,000
8,000
10,000
12,000
ARTS SCIENCES
11,892
5,803
0.75%
0.36%

25
2015
POSITIONINSTITUTIONS
TOTAL NUMBER
OF
APPLICATIONS
PERCENTAGE
(%)
2016
POSITION
1ST
University of Ilorin, Ilorin 103,238 6.48 1ST
2ND
University of Benin, Benin City 81,363 5.11 2ND
6TH
Ahmadu Bello University, Zaria 75,383 4.73 3RD
4TH
University of Nigeria Nsukka 65,954 4.14 4TH
8TH
Bayero University, Kano 64,220 4.03 5TH
3RD
Nnamdi Azikiwe University, Awka 61,862 3.89 6TH
5TH
University of Lagos 60,659 3.81 7TH
7TH
University of Ibadan, Ibadan, 59,176 3.72 8TH
9TH
Obafemi Awolowo University, Ile-ife 45,924 2.88 9TH
NOT IN TOP
TENUniversity of Jos, Jos 40,366 2.54 10TH
2016 UTME APPLICATION STATISTICS BY INSTITUTION
TOP TEN INSTITUTIONS –
(PUBLIC UNIVERSITIES) – FIRST CHOICE

26
S/N INSTITUTIONS
TOTAL NUMBER
OF
APPLICATIONS
2016
POSITION
1 Covenant University, Canaan Land, Ota 2,586 1ST
2 Afe Babalola University, Ado-Ekiti 1,304 2ND
3 Babcock University, Ilishan-remo, 1,248 3RD
4 Igbinedion University, Okada, Benin City 418 4TH
5 Madonna University, Okija 370 5TH
6 Bowen University, Iwo 329 6TH
7 Al-Qalam University, Katsina 308 7TH
8 Baze University, FCT, Abuja 277 8TH
9 Bingham University, Karu 247 9TH
10 Benson Idahosa University, Benin City 204 10TH
2016 UTME APPLICATION STATISTICS BY INSTITUTION
TOP TEN INSTITUTIONS –
(PRIVATE UNIVERSITIES) – FIRST CHOICE

27
2015
POSITIONINSTITUTIONS
TOTAL NUMBER
OF
APPLICATIONS
PERCENTAGE
(%)
2016
POSITION
2ND
Federal College of Education, Zaria 2,441 0.15 1ST
1ST College of Education, Azare 2,165 0.14 2ND
3RD Federal College of Education (Tech.), Potiskum 2,080 0.13 3RD
6TH College of Education, Gidan-Waya 1,764 0.11 4TH
5TH College of Education, Akwanga 1,744 0.11 5TH
4TH Federal College of Education (Tech.), Gombe 1,685 0.11 6TH
NOT IN
TOP TENCollege of Education, Waka-Biu 875 0.05 7TH
7TH FCT College of Education, Zuba 561 0.04 8TH
NOT IN
TOP TENFederal College of Education, Yola 481 0.03 9TH
9TH Federal College of Education, Kano 461 0.03 10TH
2016 UTME APPLICATION STATISTICS BY INSTITUTION
TOP TEN INSTITUTIONS-
(PUBLIC COLLEGES OF EDUCATION) - FIRST CHOICE

28
2016 UTME APPLICATION STATISTICS BY INSTITUTION
TOP TEN INSTITUTIONS-(PRIVATE COLLEGES OF EDUCATION) - FIRST CHOICE)
S/N INSTITUTIONS
TOTAL NUMBER
OF
APPLICATIONS
2016
POSITION
1 Arabic and Islamic College of Education, Potiskum 172 1ST
2 Aminu Kano College of Islamic And Legal Studies, Kano 62 2ND
3 Hill College Of Education, Gwanji, Akwanga 48 3RD
4Yusuf Bala Usman College of Legal and General Studies,
Daura3 4TH
5 Yewa Central College of Education, Abeokuta 3 4TH
6 St. Augustine College of Education (Project Time), Yaba 1 6TH
7Our Saviour Inst. of Science & Technical College of Education,
Enugu State1 6TH
8 Onit College of Education Abagana 1 6TH
9Kinsey College of Education, Ilorin
1 6TH
10 Jibwis College of Arabic And Islamic Education, Gombe 1 6TH

29
2015
POSITIONINSTITUTIONS
TOTAL NUMBER
OF
APPLICATIONS
PERCENTAGE
(%)
2016
POSITION
1ST
Federal Polytechnic, Offa 2,156 0.14 1ST
3RD
Federal Polytechnic, Ilaro 1,715 0.11 2ND
4TH
Federal Polytechnic, Ede 1,498 0.09 3RD
5TH
Kaduna Polytechnic, Kaduna 1,216 0.08 4TH
NOT IN
TOP TEN Ramat Polytechnic, Maiduguri1,074 0.07 5TH
2ND
Akwa-Ibom State Polytechnic,
Ikot-Osurua1,040 0.07 6TH
7TH
Kwara State Polytechnic, Ilorin 678 0.04 7TH
6TH
Nuhu Bamalli Polytechnic, Zaria 589 0.04 8TH
9TH
Akanu Ibiam Federal Polytechnic,
Unwana, Afikpo588 0.04 9TH
NOT LISTED Maritime Academy of Nigeria, Oron 420 0.03 10TH
2016 UTME APPLICATION STATISTICS BY INSTITUTION
TOP TEN INSTITUTIONS-(PUBLIC POLYTECHNICS/MONOTECHNICS) –
FIRST CHOICE

30
2016 UTME APPLICATION STATISTICS BY INSTITUTION
TOP TEN INSTITUTIONS-(PRIVATE POLYTECHNICS/MONOTECHNICS) –
FIRST CHOICE
S/N INSTITUTIONS
TOTAL NUMBER
OF
APPLICATIONS
2016
POSITIO
N
1 Fidei Polytechnic, Gboko 27 1ST
2 Heritage Polytechnic, Ikot Udota 23 2ND
3 Dorben Polytechnic, Bwari-garam Road, FCT-Abuja 8 3RD
4 Interlink Polytechnic, Ijebu-Jesa, Osun State 7 4TH
5 Uyo City Polytechnic, Uyo 6 5TH
6 The Polytechnic, Ile-Ife 6 5TH
7 St Mary Polytechnic, Kwamba, Suleija, Niger State 4 7TH
8 Ibadan City Polytechnic, Ibadan 4 7TH
9 Igbajo Polytechnic, Igbajo 4 9TH
10 Allover Central Polytechnic, Ota Ogun State 3 10TH
31
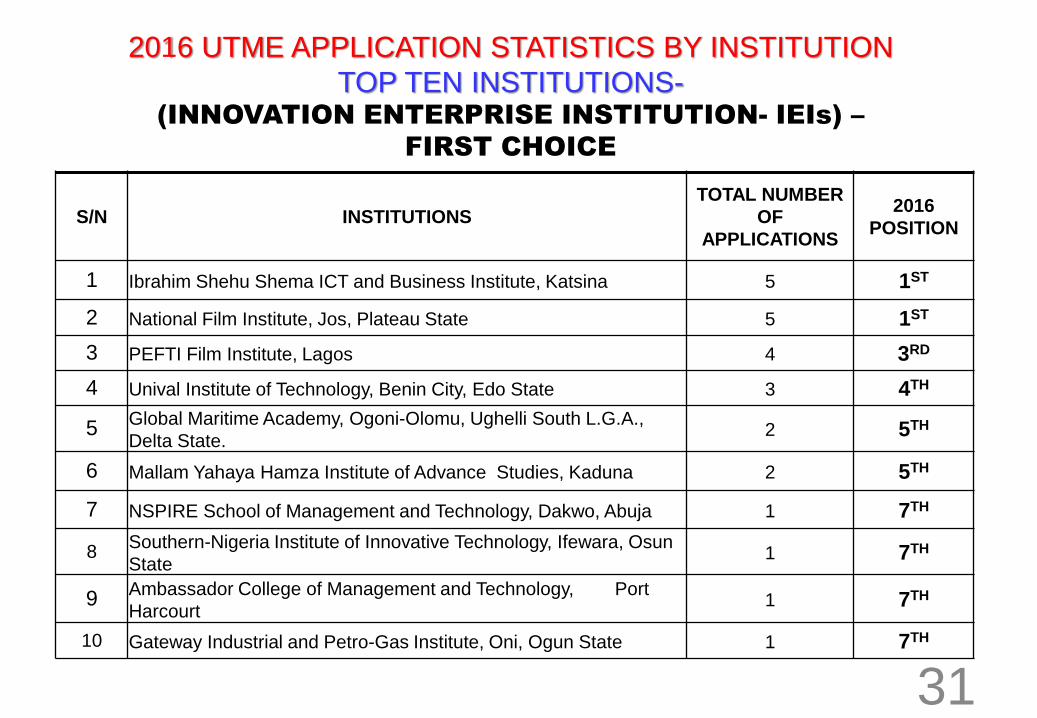
2016 UTME APPLICATION STATISTICS BY INSTITUTION
TOP TEN INSTITUTIONS-(INNOVATION ENTERPRISE INSTITUTION- IEIs) –
FIRST CHOICE
S/N INSTITUTIONS
TOTAL NUMBER
OF
APPLICATIONS
2016
POSITION
1 Ibrahim Shehu Shema ICT and Business Institute, Katsina 5 1ST
2 National Film Institute, Jos, Plateau State 5 1ST
3 PEFTI Film Institute, Lagos 4 3RD
4 Unival Institute of Technology, Benin City, Edo State 3 4TH
5Global Maritime Academy, Ogoni-Olomu, Ughelli South L.G.A.,
Delta State.2 5TH
6 Mallam Yahaya Hamza Institute of Advance Studies, Kaduna 2 5TH
7 NSPIRE School of Management and Technology, Dakwo, Abuja 1 7TH
8Southern-Nigeria Institute of Innovative Technology, Ifewara, Osun
State1 7TH
9Ambassador College of Management and Technology, Port
Harcourt1 7TH
10 Gateway Industrial and Petro-Gas Institute, Oni, Ogun State 1 7TH

32
REPORT ON 2016 UTME EXAMINATION IRREGULARITIES

S/
NNATURE OF IRREGULARITY 2015 2016
1.Colluded With Other Candidates/Examiners/ External Agents
7 78
2. Lateness To Examination Hall 385 2,851
3. Left Examination Hall Without Permission 6 7
5. Spying/Copying From Prepared Answers 263 0
7. Use Of GSM Phone/Electronic Device 87 117
8. Violent/Unruly Behaviours To Examiners 9 0
10Impersonation 100 351
12Multiple Examination 1,681 0
13 No E-registration Slip 43 58
TOTAL 2,581 (0.2%)3,462
0.2 (%)
33
Without lateness - 611
(0.04%)
2,851
34
2016 CBT ANECDOTES
35
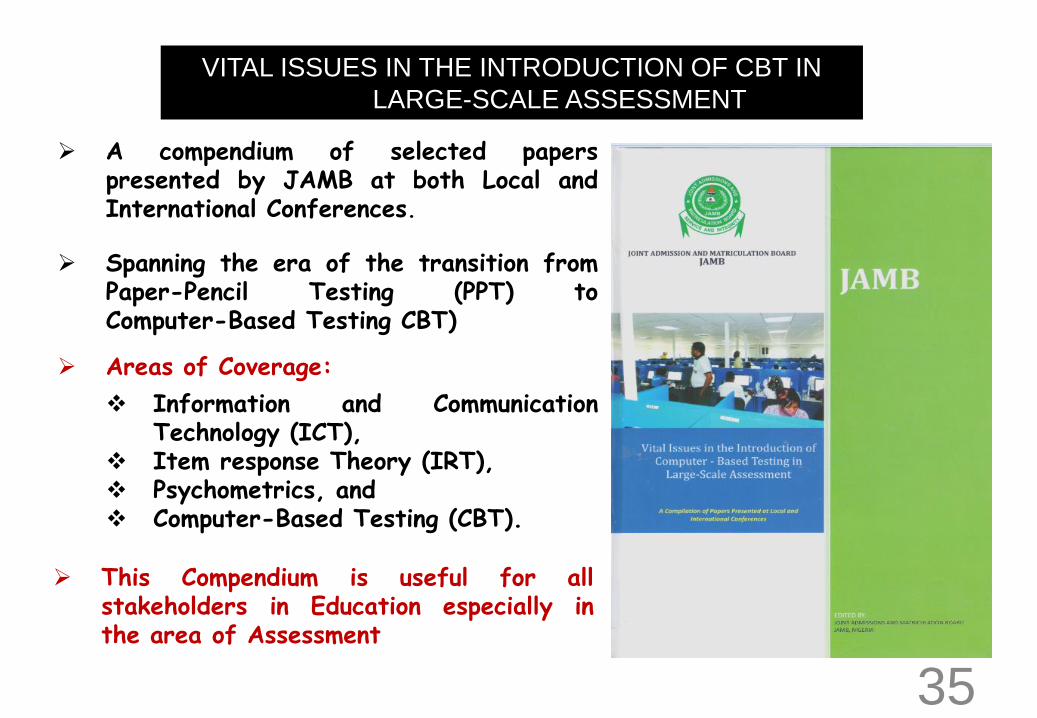
VITAL ISSUES IN THE INTRODUCTION OF CBT IN
LARGE-SCALE ASSESSMENT
A compendium of selected paperspresented by JAMB at both Local andInternational Conferences.
Spanning the era of the transition fromPaper-Pencil Testing (PPT) toComputer-Based Testing CBT)
Areas of Coverage:
Information and CommunicationTechnology (ICT),
Item response Theory (IRT), Psychometrics, and Computer-Based Testing (CBT).
This Compendium is useful for allstakeholders in Education especially inthe area of Assessment

36
PROTESTS AGAINST THE BOARD’S INITIATIVE TO REDISTRIBUTE CANDIDATES
TO “NEEDY” INSTITUTIONS
Play Video

37
INVASION OF MORO EXAMINATION CENTRE BY CANDIDATES FROM LAGOS STATE
Play Video 1 Play Video 2

38
PROTESTS IN LAGOS BY CANDIDATES AND MEMBERS OF ASSOCIATION OF TUTORIAL SCHOOL OWNERS
Play Video
39
ENCOUNTER WITH UROMI AND EWU EXAMINATION CENTRES
Play Video

40
PICTURES OF
TWO RESULT SLIPS OF A CANDIDATE
A

41
B
42
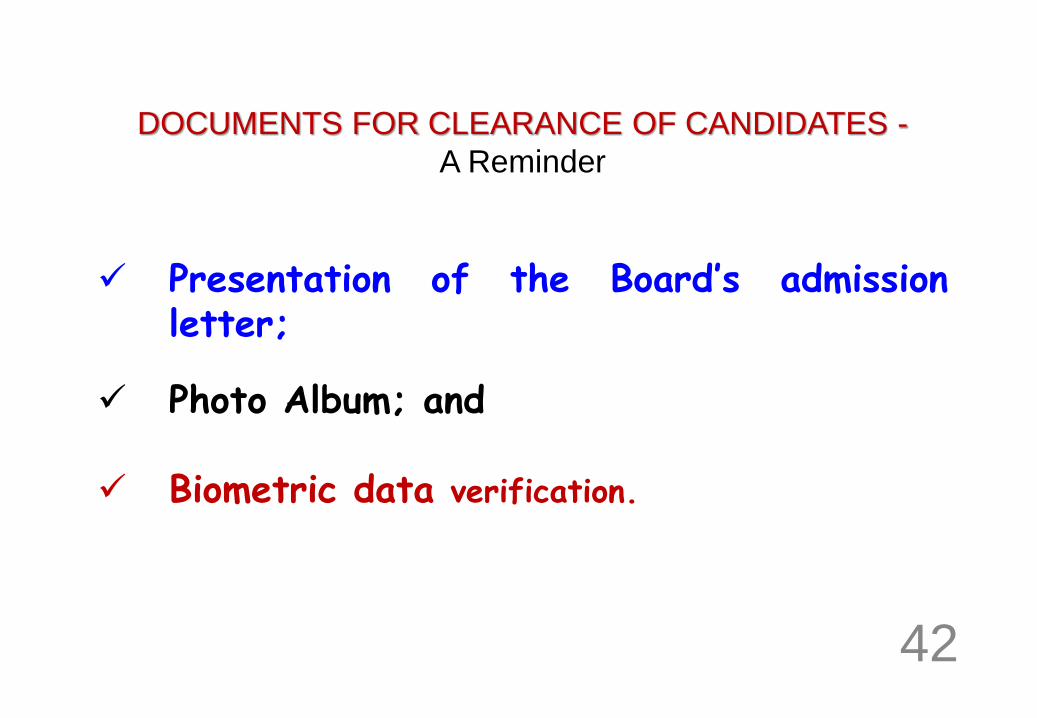
DOCUMENTS FOR CLEARANCE OF CANDIDATES -
A Reminder
Presentation of the Board’s admissionletter;
Photo Album; and
Biometric data verification.
43
THANK YOU