general aquatic life trout aquatic life water supply
TRANSCRIPT

2016 Draft Integrated Report Executive Summary
The 2016 Integrated Water Quality Assessment Report (Integrated Report) continues the comprehensive, regional approach to water quality assessment launched by the 2014 Integrated Report to support the identification of specific causes and sources of pollution, and to develop management measures tailored to the unique circumstances of one of New Jersey’s five Water Regions each assessment cycle. This approach is important in identifying and managing all the sources contributing to water quality impairment (including point and nonpoint sources of pollution), land use planning, and other resource management tools. The Barnegat Bay Initiative served as a pilot for this approach, which was expanded to the entire Atlantic Coastal Water Region for the 2014 Integrated Report. The 2016 Integrated Report focuses on the Raritan Water Region. The New Jersey portion of the entire Delaware River watershed will be the focus of the 2018/2020 Integrated Report. The Northeast Water Region will be the focus of the 2022 Integrated Report, after which the rotating regional assessment will return to the Atlantic Coastal Water Region in 2024. This approach will result in an extensive assessment of the entire State every 10 years as well as a comprehensive assessment of each water region that produces a greater number of thorough, validated, high confidence assessment decisions regarding ambient water quality conditions and the identification of data gaps. This report aims to guide future water quality sampling, sources of impairment on which to focus restoration activities, and new water quality issues for future investigation.
This report provides the information about New Jersey’s water resources, current water quality conditions, and causes and sources of water quality impairment needed to inform and guide water quality monitoring, restoration and protection efforts conducted at the state, regional, watershed and local levels. The information provided in this report is also used by Congress, the U.S. Environmental Protection Agency (USEPA), and the State of New Jersey to establish program priorities and funding for restoring, maintaining, enhancing and protecting waters of the State and the uses and benefits (public health, environmental, and economic) they provide.
The 2016 Integrated Report summarizes results of both short-term and long-term water quality analysis. The majority of the water quality data assessed for this report was generated during a five-year period, from January 2010 through July 2015. Such data provides a “snapshot” of regional water quality conditions over a relatively short period of time along with an overview of statewide water quality conditions as required to meet the federally-mandated, two-year reporting cycle. Long-term monitoring data, including certain ambient chemical data, macroinvertebrate data, and fish population studies, provide a better indication of changes in water quality over time.
General Aquatic LIfe
Trout Aquatic Life
Water Supply
Recreation
Shellfish Harvest for Consumption
Fish Consumption

2016 Draft Integrated Report Executive Summary
Figure ES-1: Statewide Designated Use Assessment Results, 2016
Water Supply: Thirty-eight percent of waters designated for the drinking water supply use fully support the use, 43 percent do not support the use, and 19 percent have insufficient information to assess the use. All New Jersey freshwater streams and lakes are designated for potential use as drinking water supply; however, most of the waters that do not support this use are not used for drinking water purposes. Arsenic is the predominant cause of water supply use impairment with 95% of impaired assessment units (AU’s) exceeding the arsenic surface water quality standards
(SWQS) human health criterion for arsenic of 0.017 micrograms per liter (ug/L). The frequency of arsenic impairment has increased over time due to improved laboratory methods that detect arsenic at levels approaching the human health criteria and increased monitoring throughout the state. Recreation: All waters of the State are designated for recreational use (e.g., swimming, boating). Most recreation occurs in ocean bathing
beaches where all are fully swimmable. Overall, twenty-four percent of all New Jersey waters including lakes, ponds, rivers, and streams fully support the recreational use; 43 percent do not support the use; and 33 percent have insufficient information. The Department has addressed pathogens (fecal coliform, E. coli,
0
200
400
600
800
1000
1200
Insufficient InformationNot SupportingFully Supporting
Num
ber o
f Ass
essm
ent U
nits
(AU
)
Designated Uses
2016 Draft Integrated Report Executive Summary
Enterococcus) through development of total maximum daily loads (TMDLs), as a regulatory response for most of these impairments.
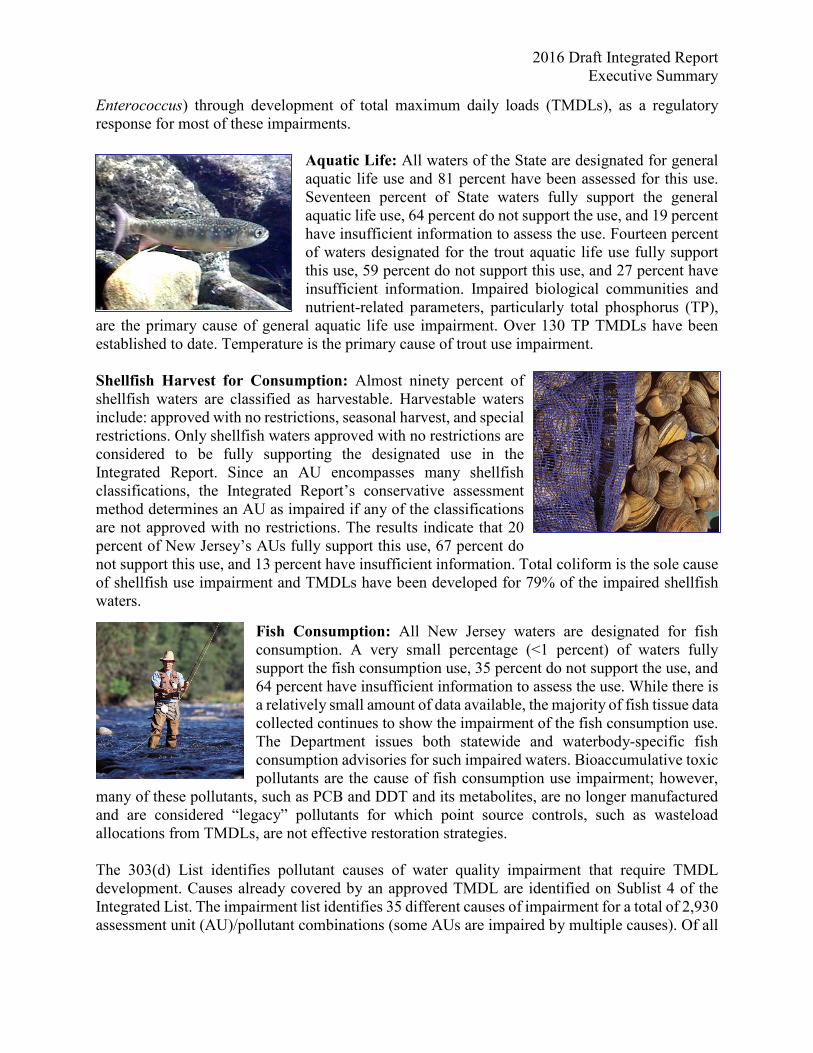
Aquatic Life: All waters of the State are designated for general aquatic life use and 81 percent have been assessed for this use. Seventeen percent of State waters fully support the general aquatic life use, 64 percent do not support the use, and 19 percent have insufficient information to assess the use. Fourteen percent of waters designated for the trout aquatic life use fully support this use, 59 percent do not support this use, and 27 percent have insufficient information. Impaired biological communities and nutrient-related parameters, particularly total phosphorus (TP),
are the primary cause of general aquatic life use impairment. Over 130 TP TMDLs have been established to date. Temperature is the primary cause of trout use impairment. Shellfish Harvest for Consumption: Almost ninety percent of shellfish waters are classified as harvestable. Harvestable waters include: approved with no restrictions, seasonal harvest, and special restrictions. Only shellfish waters approved with no restrictions are considered to be fully supporting the designated use in the Integrated Report. Since an AU encompasses many shellfish classifications, the Integrated Report’s conservative assessment method determines an AU as impaired if any of the classifications are not approved with no restrictions. The results indicate that 20 percent of New Jersey’s AUs fully support this use, 67 percent do not support this use, and 13 percent have insufficient information. Total coliform is the sole cause of shellfish use impairment and TMDLs have been developed for 79% of the impaired shellfish waters.
Fish Consumption: All New Jersey waters are designated for fish consumption. A very small percentage (<1 percent) of waters fully support the fish consumption use, 35 percent do not support the use, and 64 percent have insufficient information to assess the use. While there is a relatively small amount of data available, the majority of fish tissue data collected continues to show the impairment of the fish consumption use. The Department issues both statewide and waterbody-specific fish consumption advisories for such impaired waters. Bioaccumulative toxic pollutants are the cause of fish consumption use impairment; however,
many of these pollutants, such as PCB and DDT and its metabolites, are no longer manufactured and are considered “legacy” pollutants for which point source controls, such as wasteload allocations from TMDLs, are not effective restoration strategies. The 303(d) List identifies pollutant causes of water quality impairment that require TMDL development. Causes already covered by an approved TMDL are identified on Sublist 4 of the Integrated List. The impairment list identifies 35 different causes of impairment for a total of 2,930 assessment unit (AU)/pollutant combinations (some AUs are impaired by multiple causes). Of all
2016 Draft Integrated Report Executive Summary
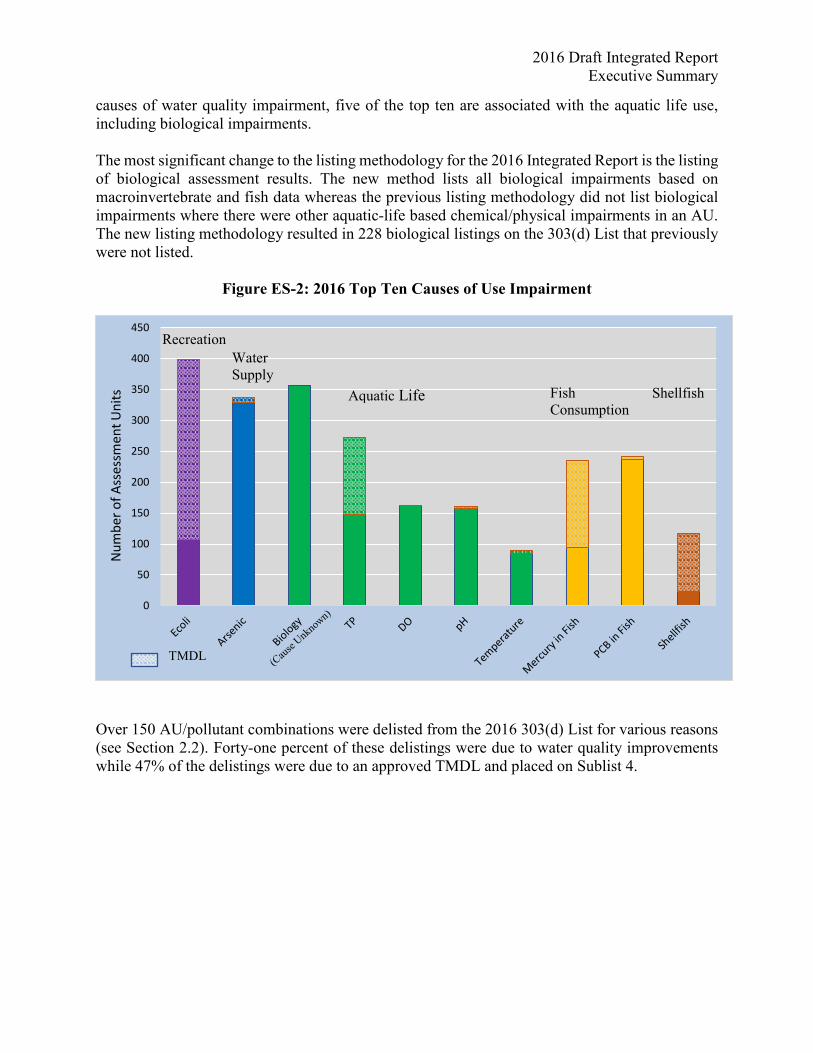
causes of water quality impairment, five of the top ten are associated with the aquatic life use, including biological impairments. The most significant change to the listing methodology for the 2016 Integrated Report is the listing of biological assessment results. The new method lists all biological impairments based on macroinvertebrate and fish data whereas the previous listing methodology did not list biological impairments where there were other aquatic-life based chemical/physical impairments in an AU. The new listing methodology resulted in 228 biological listings on the 303(d) List that previously were not listed.
Figure ES-2: 2016 Top Ten Causes of Use Impairment
Over 150 AU/pollutant combinations were delisted from the 2016 303(d) List for various reasons (see Section 2.2). Forty-one percent of these delistings were due to water quality improvements while 47% of the delistings were due to an approved TMDL and placed on Sublist 4.
0
50
100
150
200
250
300
350
400
450
Num
ber o
f Ass
essm
ent U
nits
TMDL
Recreation
Aquatic Life Fish Consumption
Shellfish
Water Supply

2016 Draft Integrated Report Executive Summary
Trends: A recent USGS statewide water quality trend analyses1 using data collected as far back as 1975 indicate that water quality has generally improved since the mid 1970’s, particularly with respect to total phosphorus and total nitrogen (nutrients). This improvement is most likely due to the upgrade and regionalization of wastewater treatment plants that occurred throughout the State in the late 1980’s through the early 1990’s, as well as improved treatment for nutrients in New Jersey Pollutant Discharge Elimination System (NJPDES) permits, implementation of nonpoint source pollution control programs, and stewardship activities at the local level aimed at reducing nonpoint source of pollution. Declining water quality trends for nitrate, total dissolved solids (TDS) and chlorides were also observed. Ammonia reduction measures implemented at waste treatment plants oxidize ammonia to form nitrate, resulting in increased nitrate concentrations over time. Runoff from urban and agricultural areas, including runoff of salt used to control ice on roadways, are the likely cause of increased TDS and chloride concentrations over time. Stable and improving nutrient trends are evident in the Raritan Water Region as well. In addition to chemical trends, biological trends and metal trends were observed in this region. Biological trend analysis from 1999 to 2015 points to stable conditions with the majority of sites showing no changes over the 15-year period. However, there was an observable trend in the number of “Excellent” conditions and “Poor” conditions migrating toward the “Good” and “Fair” categories. The trends also show a correlation between biological impairment and anthropogenic factors such as land use, total urban land, increase in impervious surface, and decrease in forests and wetlands in a stream’s drainage basin. The replacement of pervious land with impervious surfaces increases storm water and the associated impacts such as degraded riparian zones, unstable streambanks, higher turbidity, nutrients and other chemicals. The most significant trend in the Raritan Water Region is the dramatic decrease of metal and ammonia levels in the region resulting in a 95% reduction of impairments on the 303(d) List since 1998. These results do not include arsenic which continues to be detected at levels that exceed the human health criteria. In 1998, there were 191 303(d) listings for metals including unionized ammonia. Years of monitoring has revealed only nine 303(d) listings for metals remain in 2016. This improvement is the result of rules and regulations that have limited the discharge of toxins in the waterways and air, the remediation of contaminated sites, and the closing or shifting of many manufacturers out of the region. The Department’s strategic goal outlined in the “New Jersey Water Monitoring & Assessment Strategy (2005-2014)” to develop a comprehensive monitoring program for all waters of the state 1 Hickman, R.E. and R.M. Hirsch. 2017. Trends in the Quality of Water in New Jersey Streams, Water Years 1971-2011. SIR 2016-5176. USGS. Reston, VA.

2016 Draft Integrated Report Executive Summary
has resulted in drastic growth in the number of monitoring stations and samples collected over the last decade. In collaboration with other water monitoring stakeholders and agencies, the number of AUs with data has risen significantly. This trend has increased the number of samples used in the Integrated Report from approximately 300,000 data samples used in the 2006 assessment process to over 3.2 million discrete data samples and 1.8 million continuous data points for the 2016 Integrated Report. This data-rich environment has allowed the Department to increase the number of watersheds assessed and improve the validity of the assessments resulting in thorough, sound, high confidence assessment decisions. For the 2016 Integrated Report, the Raritan Water Region underwent a comprehensive analysis to determine water quality in the region. The comprehensive assessment includes a detailed analysis of water quality and biological data, hydrography, land use, weather events, potential pollution sources, and historical data to confirm current water quality conditions. Restoration activities that are associated with improved water quality are identified as well as potential pollutant sources specifically in impaired waters that had minimal development or point sources. The comprehensive assessment also identifies data gaps to guide future water quality sampling, sources of impairment on which to focus restoration activities, and water quality issues for future investigation. An analysis of land use demonstrates how developed land use and impervious surface impacts the aquatic ecosystem. Studies have shown that impervious surface is the most predictive and reliable land use indicator for biological integrity2. These studies reveal that where impervious surface exceeds 10% of watershed land use biological degradation occurs. In watersheds where biota reflect healthy communities, the data show they are located in watersheds with healthy, forested riparian zones that include wetlands. Riparian areas are transitional areas between terrestrial and aquatic ecosystems that are vital to watershed health. In watersheds with agricultural use or anthropogenic disturbance such as industrial, commercial, and residential development, the riparian zone provides a buffering between the stream and the area of disturbance. When observing impervious surface in riparian zones, the riparian buffer exhibits the highest sensitivity to disturbances in the watershed. In the Raritan Water Region, where impervious surface exceeds 10% in the riparian zone, the biological communities display extensive degradation with 90% of the biological communities impaired. Without a buffer to reduce the effects of stressors within the watershed, the biological communities are inundated and unable to recover. Development in the riparian zone degrades the benefits from a healthy ecosystem by intensifying storm water flow, 2 Booth, D.B. and L. Reinelt. 1993. Consequences of Urbanization on Aquatic Systems - Measured Effects, Degradation Thresholds, and Corrective Strategies. Proceedings of the Watershed '93 Conference.
Klein, R.D. 1979. Urbanization and Stream Quality Impairment. Water Resources Bulletin 15: 948-963.
Schueler, T.R. 1994. The Importance of Imperviousness. Watershed Protection Techniques 1(3): 100- 111.
Steedman, R.J. 1988. Modification and Assessment of an Index of Biotic Integrity to Quantify Stream Quality in Southern Ontario. Canadian Journal of Fisheries and Aquatic Sciences 45: 492-501.

2016 Draft Integrated Report Executive Summary
destabilizes streambanks, increases levels of sedimentation and other nonpoint pollutants, rises water temperatures, damages stream habitat, reduces infiltration into the soil, as well as increases the frequency and intensity of flooding and low stream flows. Over the last 10 years the Department has focused a strategy that allocated the resources needed to increase monitoring that has successfully reduced data gaps and achieved a stronger understanding of water quality conditions in the region. With this understanding of water quality issues in the Raritan Water Region, the Department has been able to initiate management actions to protect, maintain and restore water quality. Several significant efforts in the region include the approval of the Raritan TMDL, the “Non-Tidal Raritan River Watershed Protection Plan”, and nonpoint restoration efforts. Since 1998, the Department has funded over $11 million in nonpoint restoration projects including $7.6 million since 2015. These actions along with future efforts are expected to reduce pollutant loading to help restore water quality. In the effort to optimize resources for restoration efforts, the Department has initiated actions that identify and prioritize future nonpoint restoration efforts at a regional level. The goal of this effort is to maximize the utilization of restoration funding by identifying AUs that show the best potential for improving water quality, identifying areas within the AU that will have the most impact on water quality, and prioritizing these efforts. For the Raritan Water Region, 39 AUs were selected and vetted with stakeholders encompassing all four watershed management areas where AUs show the best potential in achieving water quality improvements to restore designated uses. The Department administers numerous programs to restore, maintain, and enhance water quality. These programs include regulatory and non-regulatory water pollution control programs along with pollution prevention through education, outreach and stewardship programs for volunteer and community groups. The success of the Department’s water quality management programs is supported by the results of the water quality trends analysis, which shows improving and stabilizing conditions over time (Chapter 2 and 3). These improvements are the result of significant financial investment, including millions of dollars in grants awarded for water quality planning, restoration, land acquisition, and wastewater facility infrastructure improvements, operations, and maintenance (Chapter 5). Since its inception in 1987, the NJ Water Bank Program as financed approximately $5.5 billion dollars to upgrade wastewater treatment facilities, reduce infiltration/inflow, control discharges from Combined Sewer Overflows (CSOs), construct sludge handling facilities, improve stormwater runoff, and close landfills. These investments have generated tangible results - increased beach days, trout waters, and shellfish harvests – that yield economic benefits for the entire State. New Jersey is the fifth smallest and most densely populated state in the Nation. It is also one of the most geologically and hydrogeologically diverse states, with over 18,000 miles of rivers and streams; over 50,000 acres of lakes, ponds, and reservoirs; 950,000 acres of wetlands; 260 square miles of estuaries; 127 miles of coastline; and over 450 square miles of ocean under its jurisdiction. The combination of population density, diversity of natural resources, and a wide range of

2016 Draft Integrated Report Executive Summary
industries and land uses presents unique challenges to protecting New Jersey’s water resources and these uses. New Jersey’s surface waters provide much of the water used for public drinking water, and serves as the primary resource for recreation, fish consumption and shellfish harvesting; yet most of the State's streams, lakes, ponds, bays, ground waters and ocean waters are impacted to some degree by both point and nonpoint sources of pollution. Protecting and restoring our water resources from such impacts has a direct and positive impact on the State’s economy, particularly dollars generated by tourism, including recreational boating, swimming, and fishing, as well as from commercial fisheries, including shellfish, and the seafood industry. The Department estimates that the economic value of New Jersey’s aquatic ecosystems at more than 19 billion dollars3. The full 2016 Integrated Report is available on the Department’s website at http://www.state.nj.us/dep/wms/bears/assessment.htm along with other related documents.
3 NJDEP. Valuing New Jersey’s Natural Capital: An Assessment of the Economic Value of the State’s Natural Resources. April 2007. Available at http://www.nj.gov/dep/dsr/naturalcap. Table 5.1 is based on data from Table 4 of Part II of the report. Dollar amounts were converted from 2004 to 2009 dollars using the change in the Consumer Price Index for All Urban Consumers published by the U.S. Department of Labor’s Bureau of Labor Statistics at http://www.bls.gov/cpi/.