general acronyms and...
TRANSCRIPT

Final Solar PEIS xxix July 2012
NOTATION 1
2
3
The following is a list of acronyms and abbreviations, chemical names, and units of 4
measure used in this document. Some acronyms used only in tables may be defined only in those 5
tables. 6
7
GENERAL ACRONYMS AND ABBREVIATIONS 8
9
AADT annual average daily traffic 10
AASHTO American Association of State Highway and Transportation Officials 11
AC alternating current 12
ACC air-cooled condenser 13
ACEC Area of Critical Environmental Concern 14
ADEQ Arizona Department of Environmental Quality 15
ACHP Advisory Council on Historic Preservation 16
ADOT Arizona Department of Transportation 17
ADWR Arizona Department of Water Resources 18
AERMOD AMS/EPA Regulatory Model 19
AFC Application for Certification 20
AGL above ground level 21
AIM Assessment, Inventory and Monitoring 22
AIRFA American Indian Religious Freedom Act 23
AMA active management area 24
AML animal management level 25
ANHP Arizona National Heritage Program 26
APE area of potential effect 27
APLIC Avian Power Line Interaction Committee 28
APP Avian Protection Plan 29
APS Arizona Public Service 30
AQCR Air Quality Control Region 31
AQRV air quality–related value 32
ARB Air Resources Board 33
ARRA American Recovery and Reinvestment Act of 2009 34
ARRTIS Arizona Renewable Resource and Transmission Identification Subcommittee 35
ARS Agricultural Research Service 36
ARZC Arizona and California 37
ATSDR Agency for Toxic Substances and Disease Registry 38
AUM animal unit month 39
AVSE Arlington Valley Solar Energy 40
AVWS Audio Visual Warning System 41
AWBA Arizona Water Banking Authority 42
AWEA American Wind Energy Association 43
AWRM Active Water Resource Management 44
AZDA Arizona Department of Agriculture 45
AZGFD Arizona Game and Fish Department 46

Final Solar PEIS xxx July 2012
AZGS Arizona Geological Survey 1
2
BA biological assessment 3
BAP base annual production 4
BEA Bureau of Economic Analysis 5
BISON-M Biota Information System of New Mexico 6
BLM Bureau of Land Management 7
BLM-CA Bureau of Land Management, California 8
BMP best management practice 9
BNSF Burlington Northern Santa Fe 10
BO biological opinion 11
BOR U.S. Bureau of Reclamation 12
BPA Bonneville Power Administration 13
BRAC Blue Ribbon Advisory Council on Climate Change 14
BSE Beacon Solar Energy 15
BSEP Beacon Solar Energy Project 16
BTS Bureau of Transportation Statistics 17
18
CAA Clean Air Act 19
CAAQS California Air Quality Standards 20
CAISO California Independent System Operator 21
Caltrans California Department of Transportation 22
C-AMA California-Arizona Maneuver Area 23
CAP Central Arizona Project 24
CARB California Air Resources Board 25
CAReGAP California Regional Gap Analysis Project 26
CASQA California Stormwater Quality Association 27
CASTNET Clean Air Status and Trends NETwork 28
CAWA Colorado Agricultural Water Alliance 29
CCC Civilian Conservation Corps 30
CDC Centers for Disease Control and Prevention 31
CDCA California Desert Conservation Area 32
CDFG California Department of Fish and Game 33
CDNCA California Desert National Conservation Area 34
CDOT Colorado Department of Transportation 35
CDOW Colorado Division of Wildlife (now Colorado Parks and Wildlife) 36
CDPHE Colorado Department of Public Health and Environment 37
CDWR California Department of Water Resources 38
CEC California Energy Commission 39
CEQ Council on Environmental Quality 40
CES constant elasticity of substitution 41
CESA California Endangered Species Act 42
CESF Carrizo Energy Solar Farm 43
CFR Code of Federal Regulations 44
CGE computable general equilibrium 45
CHAT crucial habitat assessment tool 46

Final Solar PEIS xxxi July 2012
CIRA Cooperative Institute for Research in the Atmosphere 1
CLFR compact linear Fresnel reflector 2
CNDDB California Natural Diversity Database 3
CNEL community noise equivalent level 4
CNHP Colorado National Heritage Program 5
Colorado DWR Colorado Division of Water Resources 6
CO2e carbon dioxide equivalent 7
CPC Center for Plant Conservation 8
CPUC California Public Utilities Commission 9
CPV concentrating photovoltaic 10
CRBSCF Colorado River Basin Salinity Control Forum 11
CREZ competitive renewable energy zone 12
CRPC Cultural Resources Preservation Council 13
CRSCP Colorado River Salinity Control Program 14
CSA Candidate Study Area 15
CSC Coastal Services Center 16
CSFG carbon-sequestration fossil generation 17
CSP concentrating solar power 18
CSQA California Stormwater Quality Association 19
CSRI Cultural Systems Research, Incorporated 20
CTG combustion turbine generator 21
CTPG California Transmission Planning Group 22
CTSR Cumbres & Toltec Scenic Railroad 23
CUP Conditional Use Permit 24
CVP Central Valley Project 25
CWA Clean Water Act 26
CWCB Colorado Water Conservation Board 27
CWHRS California Wildlife Habitat Relationship System 28
29
DC direct current 30
DEM digital elevation model 31
DHS U.S. Department of Homeland Security 32
DIMA Database for Inventory, Monitoring and Assessment 33
DLT dedicated-line transmission 34
DNA Determination of NEPA Adequacy 35
DNI direct normal insulation 36
DNL day-night average sound level 37
DoD U.S. Department of Defense 38
DOE U.S. Department of Energy 39
DOI U.S. Department of the Interior 40
DOL U.S. Department of Labor 41
DOT U.S. Department of Transportation 42
DRECP California Desert Renewable Energy Conservation Plan 43
DSM demand-side management 44
DSRP Decommissioning and Site Reclamation Plan 45
DTC/C-AMA Desert Training Center/California–Arizona Maneuver Area 46

Final Solar PEIS xxxii July 2012
DWMA Desert Wildlife Management Area 1
DWR Division of Water Resources 2
3
EA environmental assessment 4
EBID Elephant Butte Irrigation District 5
ECAR East Central Area Reliability Coordination Agreement 6
ECOS Environmental Conservation Online System (USFWS) 7
EERE Energy Efficiency and Renewable Energy (DOE) 8
Eg band gap energy 9
EIA Energy Information Administration (DOE) 10
EIS environmental impact statement 11
EISA Energy Independence and Security Act of 2007 12
EMF electromagnetic field 13
E.O. Executive Order 14
EPA U.S. Environmental Protection Agency 15
EPRI Electric Power Research Institute 16
EQIP Environmental Quality Incentives Program 17
ERCOT Electric Reliability Council of Texas 18
ERO Electric Reliability Organization 19
ERS Economic Research Service 20
ESA Endangered Species Act of 1973 21
ESRI Environmental Systems Research Institute 22
23
FAA Federal Aviation Administration 24
FBI Federal Bureau of Investigation 25
FEMA Federal Emergency Management Agency 26
FERC Federal Energy Regulatory Commission 27
FHWA Federal Highway Administration 28
FIRM Flood Insurance Rate Map 29
FLPMA Federal Land Policy and Management Act of 1976 30
FONSI Finding of No Significant Impact 31
FR Federal Register 32
FRCC Florida Reliability Coordinating Council 33
FSA Final Staff Assessment 34
FTE full-time equivalent 35
FY fiscal year 36
37
G&TM generation and transmission modeling 38
GCRP U.S. Global Climate Research Program 39
GDA generation development area 40
GHG greenhouse gas 41
GIS geographic information system 42
GMU game management unit 43
GPS global positioning system 44
GTM Generation and Transmission Model 45
46
Final Solar PEIS xxxiii July 2012
GUAC Groundwater Users Advisory Council 1
GWP global warming potential 2
3
HA herd area 4
HAP hazardous air pollutant 5
HAZCOM hazard communication 6
HCE heat collection element 7
HCP Habitat Conservation Plan 8
HMA herd management area 9
HMMH Harris Miller Miller & Hanson, Inc. 10
HRSG heat recovery steam generator 11
HSPD Homeland Security Presidential Directive 12
HTF heat transfer fluid 13
HUC hydrologic unit code 14
HVAC heating, ventilation, and air-conditioning 15
16
I Interstate 17
IARC International Agency for Research on Cancer 18
IBA important bird area 19
ICE internal combustion engine 20
ICPDS Imperial County Planning & Development Services 21
ICWMA Imperial County Weed Management Area 22
IDT interdisplinary team 23
IEC International Electrochemical Commission 24
IFR instrument flight rule 25
IID Imperial Irrigation District 26
IM Instruction Memorandum 27
IMPS Iron Mountain Pumping Station 28
IMS interim mitigation strategy 29
INA Irrigation Non-Expansion Area 30
IOP Interagency Operating Procedure 31
IOU investor-owned utility 32
IPCC Intergovernmental Panel on Climate Change 33
ISA Independent Science Advisor; Instant Study Area 34
ISB Intermontane Seismic Belt 35
ISCC integrated solar combined cycle 36
ISDRA Imperial Sand Dunes Recreation Area 37
ISEGS Ivanpah Solar Energy Generating System 38
ISO independent system operator; iterative self-organizing 39
ITFR Interim Temporary Final Rulemaking 40
ITP incidental take permit 41
IUCNNR International Union for Conservation of Nature and Natural Resources 42
IUCNP International Union for Conservation of Nature Pakistan 43
44
KGA known geothermal resources area 45
KML keyhole markup language 46

Final Solar PEIS xxxiv July 2012
KOP key observation point 1
KSLA known sodium leasing area 2
3
LCC Landscape Conservation Cooperative 4
LCCRDA Lincoln County Conservation, Recreation, and Development Act of 2004 5
LCOE levelized cost of energy 6
Ldn day-night average sound level 7
LDWMA Low Desert Weed Management Area 8
Leq equivalent sound pressure level 9
LiDAR light detection and ranging 10
LLA limited land available 11
LLRW low-level radioactive waste (waste classification) 12
LPN listing priority number 13
LRG Lower Rio Grande 14
LSA lake and streambed alteration 15
LSE load-serving entity 16
LTMP long-term monitoring and adaptive management plan 17
LTVA long-term visitor area 18
19
MAAC Mid-Atlantic Area Council 20
MAIN Mid-Atlantic Interconnected Network 21
MAPP methyl acetylene propadiene stabilizer; Mid-Continent Area Power Pool 22
MCAS Marine Corps Air Station 23
MCL maximum contaminant level 24
MEB Marine Expeditionary Brigade 25
MFP Management Framework Plan 26
MIG Minnesota IMPLAN Group 27
MLA maximum land available 28
MOA military operating area 29
MOU Memorandum of Understanding 30
MPDS maximum potential development scenario 31
MRA Multiple Resource Area 32
MRI Midwest Research Institute 33
MRO Midwest Reliability Organization 34
MSDS Material Safety Data Sheet 35
MSL mean sea level 36
MTR military training route 37
MVEDA Mesilla Valley Economic Development Alliance 38
MWA Mojave Water Agency 39
MWD Metropolitan Water District 40
MWMA Mojave Weed Management Area 41
NAAQS National Ambient Air Quality Standard(s) 42
NADP National Atmospheric Deposition Program 43
NAGPRA Native American Graves Protection and Repatriation Act 44
NAHC Native American Heritage Commission (California) 45
NAIC North American Industrial Classification System 46

Final Solar PEIS xxxv July 2012
NASA National Aeronautics and Space Administration 1
NCA National Conservation Area 2
NCCAC Nevada Climate Change Advisory Committee 3
NCDC National Climatic Data Center 4
NCES National Center for Education Statistics 5
NDAA National Defense Authorization Act 6
NDCNR Nevada Department of Conservation and Natural Resources 7
NDEP Nevada Division of Environmental Protection 8
NDOT Nevada Department of Transportation 9
NDOW Nevada Department of Wildlife 10
NDWP Nevada Division of Water Planning 11
NDWR Nevada Division of Water Resources 12
NEAP Natural Events Action Plan 13
NEC National Electric Code 14
NED National Elevation Database 15
NEP Natural Events Policy 16
NEPA National Environmental Policy Act of 1969 17
NERC North American Electricity Reliability Corporation 18
NGO non-governmental organization 19
NHA National Heritage Area 20
NHD National Hydrography Dataset 21
NHNM National Heritage New Mexico 22
NHPA National Historic Preservation Act of 1966 23
NID National Inventory of Dams 24
NLCS National Landscape Conservation System 25
NMAC New Mexico Administrative Code 26
NMBGMR New Mexico Bureau of Geology and Mineral Resources 27
NMDGF New Mexico Department of Game and Fish 28
NM DOT New Mexico Department of Transportation 29
NMED New Mexico Environment Department 30
NMED-AQB New Mexico Environment Department-Air Quality Board 31
NMFS National Marine Fisheries Service 32
NMOSE New Mexico Office of the State Engineer 33
NMSU New Mexico State University 34
NNHP Nevada Natural Heritage Program 35
NNL National Natural Landmark 36
NNSA National Nuclear Security Administration 37
NOA Notice of Availability 38
NOAA National Oceanic and Atmospheric Administration 39
NOI Notice of Intent 40
NP National Park 41
NPDES National Pollutant Discharge Elimination System 42
NPL National Priorities List 43
NPS National Park Service 44
NPV net present value 45
NRA National Recreation Area 46
Final Solar PEIS xxxvi July 2012
NRCS Natural Resources Conservation Service 1
NREL National Renewable Energy Laboratory 2
NRHP National Register of Historic Places 3
NRS Nevada Revised Statutes 4
NSC National Safety Council 5
NSO no surface occupancy 6
NSTC National Science and Technology Council 7
NTHP National Trust for Historic Preservation 8
NTS Nevada Test Site 9
NTTR Nevada Test and Training Range 10
NVCRS Nevada Cultural Resources Inventory System 11
NV DOT Nevada Department of Transportation 12
NWCC National Wind Coordinating Committee 13
NWI National Wetlands Inventory 14
NWIS National Water Information System (USGS) 15
NWPP Northwest Power Pool 16
NWR National Wildlife Refuge 17
NWSRS National Wild and Scenic River System 18
19
O&M operation and maintenance 20
ODFW Oregon Department of Fish and Wildlife 21
OHV off-highway vehicle 22
ONA Outstanding Natural Area 23
ORC organic Rankine cycle 24
OSE/ISC Office of the State Engineer/Interstate Stream Commission 25
OSHA Occupational Safety and Health Administration 26
OTA Office of Technology Assessment 27
28
PA Programmatic Agreement 29
PAD Preliminary Application Document 30
PAH polycyclic aromatic hydrocarbon 31
PAT peer analysis tool 32
PCB polychlorinated biphenyl 33
PCM purchase change material 34
PCS power conditioning system 35
PCU power converting unit 36
PEIS programmatic environmental impact statement 37
PFYC potential fossil yield classification 38
PGH Preliminary General Habitat 39
PIER Public Interest Energy Research 40
P.L. Public Law 41
PLSS Public Land Survey System 42
PM particulate matter 43
PM2.5 particulate matter with a diameter of 2.5 μm or less 44
PM10 particulate matter with a diameter of 10 μm or less 45
PPA Power Purchase Agreement 46

Final Solar PEIS xxxvii July 2012
P-P-D population-to-power density 1
PPH Preliminary Priority Habitat 2
POD plan of development 3
POU publicly owned utility 4
PPA Power Purchase Agreement 5
PPE personal protective equipment 6
PSD Prevention of Significant Deterioration 7
PURPA Public Utility Regulatory Policy Act 8
PV photovoltaic 9
PVID Palo Verde Irrigation District 10
PWR public water reserve 11
12
QRA qualified resource area 13
14
R&I relevance and importance 15
RAC Resource Advisory Council 16
RCE Reclamation Cost Estimate 17
RCI residential, commercial, and industrial (sector) 18
RCRA Resource Conservation and Recovery Act of 1976 19
RD&D research, development, and demonstration; research, development, and 20
deployment 21
RDBMS Relational Database Management System 22
RDEP Restoration Design Energy Project 23
REA Rapid Ecoregional Assessment 24
REAT Renewable Energy Action Team 25
REDA Renewable Energy Development Area 26
REDI Renewable Energy Development Infrastructure 27
REEA Renewable Energy Evaluation Area 28
ReEDS Regional Energy Deployment System 29
REPG Renewable Energy Policy Group 30
RETA Renewable Energy Transmission Authority 31
RETAAC Renewable Energy Transmission Access Advisory Committee 32
RETI Renewable Energy Transmission Initiative 33
REZ renewable energy zone 34
RF radio frequency 35
RFC Reliability First Corporation 36
RFDS reasonably foreseeable development scenario 37
RGP Rio Grande Project 38
RGWCD Rio Grande Water Conservation District 39
RMP Resource Management Plan 40
RMPA Rocky Mountain Power Area 41
RMZ Resource Management Zone 42
ROD Record of Decision 43
ROI region of influence 44
ROS recreation opportunity spectrum 45
ROW right-of-way 46

Final Solar PEIS xxxviii July 2012
RPG renewable portfolio goal 1
RPS Renewable Portfolio Standard 2
RRC Regional Reliability Council 3
RSEP Rice Solar Energy Project 4
RSI Renewable Systems Interconnection 5
RTO regional transmission organization 6
RTTF Renewable Transmission Task Force 7
RV recreational vehicle 8
9
SAAQS State Ambient Air Quality Standard(s) 10
SAMHSA Substance Abuse and Mental Health Services Administration 11
SCADA supervisory control and data acquisition 12
SCE Southern California Edison 13
SCRMA Special Cultural Resource Management Area 14
SDRREG San Diego Regional Renewable Energy Group 15
SDWA Safe Drinking Water Act of 1974 16
SEGIS Solar Energy Grid Integration System 17
SEGS Solar Energy Generating System 18
SEI Sustainable Energy Ireland 19
SEIA Solar Energy Industrial Association 20
SES Stirling Energy Systems 21
SETP Solar Energy Technologies Program (DOE) 22
SEZ solar energy zone 23
SHPO State Historic Preservation Office(r) 24
SIP State Implementation Plan 25
SLRG San Luis & Rio Grande 26
SMA Special Management Area 27
SMART specific, measurable, achievable, relevant, and time sensitive 28
SMP suggested management practice 29
SNWA Southern Nevada Water Authority 30
SPP Southwest Power Pool 31
SRMA Special Recreation Management Area 32
SSA Socorro Seismic Anomaly 33
SSI self-supplied industry 34
ST solar thermal 35
STG steam turbine generator 36
SUA special use airspace 37
SWAT Southwest Area Transmission 38
SWIP Southwest Intertie Project 39
SWPPP Stormwater Pollution Prevention Plan 40
SWReGAP Southwest Regional Gap Analysis Project 41
42
TAP toxic air pollutant 43
TCC Transmission Corridor Committee 44
TDS total dissolved solids 45
TEPPC Transmission Expansion Planning Policy Committee 46
Final Solar PEIS xxxix July 2012
TES thermal energy storage 1
TRACE Transmission Routing and Configuration Estimator 2
TSA Transportation Security Administration 3
TSCA Toxic Substances Control Act of 1976 4
TSDF treatment, storage, and disposal facility 5
TSP total suspended particulates 6
7
UACD Utah Association of Conservation Districts 8
UBWR Utah Board of Water Resources 9
UDA Utah Department of Agriculture 10
UDEQ Utah Department of Environmental Quality 11
UDNR Utah Department of Natural Resources 12
UDOT Utah Department of Transportation 13
UDWQ Utah Division of Water Quality 14
UDWR Utah Division of Wildlife Resources 15
UGS Utah Geological Survey 16
UNEP United Nations Environmental Programme 17
UNPS Utah Native Plant Society 18
UP Union Pacific 19
UREZ Utah Renewable Energy Zone 20
USACE U.S. Army Corps of Engineers 21
USAF U.S. Air Force 22
USC United States Code 23
USDA U.S. Department of Agriculture 24
USFS U.S. Forest Service 25
USFWS U.S. Fish and Wildlife Service 26
USGS U.S. Geological Survey 27
Utah DWR Utah Division of Water Rights 28
UTTR Utah Test and Training Range 29
UWS Underground Water Storage, Savings and Replenishment Act 30
31
VACAR Virginia–Carolinas Subregion 32
VCRS Visual Contrast Rating System 33
VFR visual flight rule 34
VOC volatile organic compound 35
VRHCRP Virgin River Habitat Conservation & Recovery Program 36
VRI Visual Resource Inventory 37
VRM Visual Resource Management 38
39
WA Wilderness Area 40
WECC Western Electricity Coordinating Council 41
WECC CAN Western Electricity Coordinating Council–Canada 42
WEG wind erodibility group 43
Western Western Area Power Administration 44
WGA Western Governors’ Association 45
WGFD Wyoming Game and Fish Department 46

Final Solar PEIS xl July 2012
WHA wildlife habitat area 1
WHO World Health Organization 2
WIA Wyoming Infrastructure Authority 3
WRAP Water Resources Allocation Program; Western Regional Air Partnership 4
WRCC Western Regional Climate Center 5
WREZ Western Renewable Energy Zones 6
WRRI Water Resources Research Institute 7
WSA Wilderness Study Area 8
WSC wildlife species of special concern 9
WSMR White Sands Missile Range 10
WSR Wild and Scenic River 11
WSRA Wild and Scenic Rivers Act of 1968 12
WWII World War II 13
WWP Western Watersheds Project 14
15
YPG Yuma Proving Ground 16
17
ZITA zone identification and technical analysis 18
ZLD zero liquid discharge 19
20
21
CHEMICALS 22
23
CH4 methane 24
CO carbon monoxide 25
CO2 carbon dioxide 26
27
H2S hydrogen sulfide 28
Hg mercury 29
30
N2O nitrous oxide 31
NH3 ammonia 32
NO2 nitrogen dioxide
NOx nitrogen oxides
O3 ozone
Pb lead
SF6 sulfur hexafluoride
SO2 sulfur dioxide
SOx sulfur oxides
33
34
UNITS OF MEASURE 35
36
ac-ft acre-foot (feet) 37
bhp brake horsepower 38
39
C degree(s) Celsius 40
cf cubic foot (feet) 41
cfs cubic foot (feet) per second 42
cm centimeter(s) 43
44
dB decibel(s) 45
dBA A-weighted decibel(s)
F degree(s) Fahrenheit
ft foot (feet)
ft2 square foot (feet)
ft3 cubic foot (feet)
g gram(s)
gal gallon(s)

Final Solar PEIS xli July 2012
GJ gigajoule(s) 1
gpcd gallon per capita per day 2
gpd gallon(s) per day 3
gpm gallon(s) per minute 4
GW gigawatt(s) 5
GWh gigawatt hour(s) 6
GWh/yr gigawatt hour(s) per year 7
8
h hour(s) 9
ha hectare(s) 10
Hz hertz 11
12
in. inch(es) 13
14
J joule(s) 15
16
K degree(s) Kelvin 17
kcal kilocalorie(s) 18
kg kilogram(s) 19
kHz kilohertz 20
km kilometer(s) 21
km2 square kilometer(s) 22
kPa kilopascal(s) 23
kV kilovolt(s) 24
kVA kilovolt-ampere(s) 25
kW kilowatt(s) 26
kWh kilowatt-hour(s) 27
kWp kilowatt peak 28
29
L liter(s) 30
lb pound(s) 31
32
m meter(s) 33
m2 square meter(s) 34
m3 cubic meter(s) 35
mg milligram(s) 36
Mgal million gallons 37
mi mile(s) 38
mi2 square mile(s) 39
min minute(s) 40
mm millimeter(s) 41
MMt million metric ton(s) 42
MPa megapascal(s) 43
mph mile(s) per hour 44
MVA megavolt-ampere(s) 45
MW megawatt(s) 46
MWe megawatt(s) electric
MWh megawatt-hour(s)
ppm part(s) per million
psi pound(s) per square inch
psia pound(s) per square inch absolute
rpm rotation(s) per minute
s second(s)
scf standard cubic foot (feet)
TWh terawatt hour(s)
VdB vibration velocity decibel(s)
W watt(s)
yd2 square yard(s)
yd3 cubic yard(s)
yr year(s)
μg microgram(s)
μm micrometer(s)

Final Solar PEIS 10.1-1 July 2012
10 UPDATE TO AFFECTED ENVIRONMENT AND IMPACT ASSESSMENT 1
FOR PROPOSED SOLAR ENERGY ZONES IN COLORADO 2
3
4
The U.S. Department of the Interior Bureau of Land Management (BLM) has carried 5
17 solar energy zones (SEZs) forward for analysis in this Final Solar Programmatic 6
Environmental Impact Statement (PEIS). These SEZs total approximately 285,000 acres 7
(1,153 km2) of land potentially available for development. This chapter includes analyses of 8
potential environmental impacts for the proposed SEZs in Colorado—Antonito Southeast, 9
De Tilla Gulch, Fourmile East, and Los Mogotes East. The SEZ-specific analyses provide 10
documentation from which the BLM will tier future project authorizations, thereby limiting the 11
required scope and effort of project-specific National Environmental Policy Act of 1969 (NEPA) 12
analyses. 13
14
The BLM is committed to collecting additional SEZ-specific resource data and 15
conducting additional analysis in order to more efficiently facilitate future development in 16
SEZs. The BLM developed action plans for each of the 17 SEZs carried forward as part of 17
the Supplement to the Draft Solar PEIS (BLM and DOE 2011). These action plans described 18
additional data that could be collected for individual SEZs and proposed data sources and 19
methods for the collection of those data. Work is under way to collect additional data as 20
specified under these action plans (e.g., additional data collection to support evaluation of 21
cultural, visual, and water resources has begun). As the data become available, they will be 22
posted on the project Web site (http://solareis.anl.gov) for use by applicants and the BLM and 23
other agency staff. 24
25
To accommodate the flexibility described in the BLM’s program objectives and in light 26
of anticipated changes in technologies and environmental conditions over time, the BLM has 27
removed some of the prescriptive SEZ-specific design features presented in the Draft Solar PEIS 28
(BLM and DOE 2010) and the Supplement to the Draft (e.g., height restrictions on technologies 29
used to address visual resource impacts). Alternatively, the BLM will give full consideration to 30
any outstanding conflicts in SEZs as part of the competitive process being developed through 31
rulemaking (see Section 2.2.2.2.1). 32
33
In preparing selected parcels for competitive offer, the BLM will review all existing 34
analysis for an SEZ and consider any new or changed circumstances that may affect the 35
development of the SEZ. The BLM will also work with appropriate federal, state, and local 36
agencies, and affected tribes, as necessary, to discuss SEZ-related issues. This work would 37
ultimately inform how a parcel would be offered competitively (e.g., parcel size and 38
configuration, technology limitations, mitigation requirements, and parcel-specific competitive 39
process). Prior to issuing a notice of competitive offer, the BLM would complete appropriate 40
NEPA analysis to support the offer. This analysis would tier to the analysis for SEZs in the Solar 41
PEIS to the extent practicable. 42
43
It is the BLM’s goal to compile all data, information, and analyses for SEZs from the 44
Draft Solar PEIS, the Supplement to the Draft, and this Final PEIS into a single location 45

Final Solar PEIS 10.1-2 July 2012
accessible via the project Web site (http://solareis.anl.gov) for ease of use by applicants and the 1
BLM and other agency staff. 2
3
This chapter is an update to the information on Colorado SEZs presented in the Draft 4
Solar PEIS. The information presented in this chapter supplements and updates, but does not 5
replace, the information provided in the corresponding Chapter 10 on proposed SEZs in 6
Colorado in the Draft Solar PEIS. Corrections to incorrect information in Sections 10.1, 10.2, 7
10.3, and 10.4 of the Draft Solar PEIS and in Sections C.3.1, C.3.2, C.3.3, and C.3.4 of the 8
Supplement to the Draft are provided in Sections 10.1.26, 10.2.26, 10.3.26, and 10.4.26 of this 9
Final Solar PEIS. 10
11
12
10.1 ANTONITO SOUTHEAST 13
14
15
10.1.1 Background and Summary of Impacts 16
17
18
10.1.1.1 General Information 19
20
The proposed Antonito Southeast SEZ is located in southeastern Conejos County, on the 21
southern Colorado state boundary with New Mexico. In 2008, the county population was 8,232, 22
while the surrounding six-county region in Colorado and New Mexico had a population of 23
116,511. The largest nearby town of Alamosa, which had a 2008 population of 8,745, is about 24
34 mi (55 km) to the north. Several small towns lie closer to the SEZ, with Antonito, Colorado, 25
about 2 mi (3 km) to the northwest. The area is served by the San Luis & Rio Grande (SLRG) 26
Railroad. As of October 28, 2011, there were no pending solar project applications within the 27
SEZ. 28
29
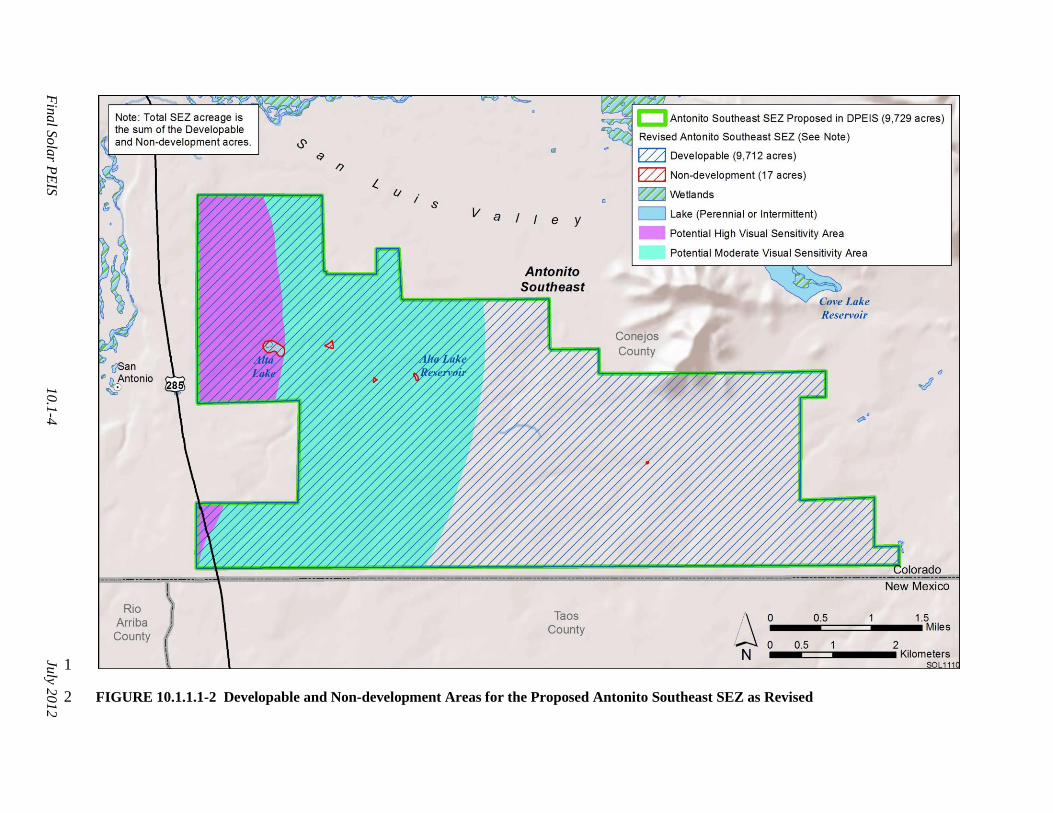
As published in the Draft Solar PEIS, the proposed Antonito Southeast SEZ had a total 30
area of 9,729 acres (39.4 km2) (see Figure 10.1.1.1-1). In the Supplement to the Draft Solar PEIS 31
(BLM and DOE 2011), no boundary revisions were identified for the proposed SEZ. However, 32
areas specified for non-development were mapped, where data were available. For the proposed 33
Antonito Southeast SEZ, 17 acres (0.07 km2) of wetland and lake areas were identified as non-34
development areas (see Figure 10.1.1.1-2). The remaining developable area within the SEZ is 35
9,712 acres (39.3 km2). 36
37
The analyses in the following sections update the affected environment and potential 38
environmental, cultural, and socioeconomic impacts associated with utility-scale solar energy 39
development in the proposed Antonito Southeast SEZ as described in the Draft Solar PEIS. 40
41
42
10.1.1.2 Development Assumptions for the Impact Analysis 43
44
Maximum development of the proposed Antonito Southeast SEZ was assumed to be 45
80% of the developable SEZ area over a period of 20 years, a maximum of 7,770 acres 46

Final Solar PEIS 10.1-3 July 2012
1
FIGURE 10.1.1.1-1 Proposed Antonito Southeast SEZ as Revised 2
Fin
al S
ola
r PE
IS
10.1
-4
July 2
01
2
1
FIGURE 10.1.1.1-2 Developable and Non-development Areas for the Proposed Antonito Southeast SEZ as Revised 2

Final Solar PEIS 10.1-5 July 2012
(31.4 km2) (Table 10.1.1.2-1). Full development of the Antonito Southeast SEZ would allow 1
development of facilities with an estimated total of between 863 MW (dish engine or 2
photovoltaic [PV] technologies, 9 acres/MW [0.04 km2/MW]) and 1,554 MW (solar trough 3
technologies, 5 acres/MW [0.02 km2/MW]) of electrical power capacity. 4
5
Availability of transmission from SEZs to load centers will be an important consideration 6
for future development in SEZs. For the proposed Antonito Southeast SEZ, updated data indicate 7
that the nearest existing transmission line is a 69-kV line located about 10 mi (16 km) west of the 8
SEZ (the Draft Solar PEIS had indicated that the closest existing line was a 69-kV line 4 mi 9
north of the SEZ). It is possible that a new transmission line could be constructed from the SEZ 10
to the nearest existing line, but the 69-kV capacity of the line would be inadequate for the 11
possible 1,554 MW of new capacity. Therefore, at full build-out capacity, new transmission lines 12
and/or upgrades of existing transmission lines would be required to bring electricity from the 13
proposed Antonito Southeast SEZ to load centers. An assessment of the most likely load center 14
destinations for power generated at the Antonito Southeast SEZ and a general assessment of the 15
impacts of constructing and operating new transmission facilities to those load centers is 16
provided in Section 10.1.23. In addition, the generic impacts of transmission and associated 17
infrastructure construction and of line upgrades for various resources are discussed in Chapter 5 18
of this Final Solar PEIS. Project-specific analyses would also be required to identify the specific 19
impacts of new transmission construction and line upgrades for any projects proposed within 20
the SEZ. 21
22
23 TABLE 10.1.1.2-1 Assumed Development Acreages, Solar MW Output, and Nearest Major 24 Access Road and Transmission Line for the Proposed Antonito Southeast SEZ as Revised 25
Total
Developable
Acreage and
Assumed
Developed
Acreage
(80% of Total)
Assumed
Maximum SEZ
Output for
Various Solar
Technologies
Distance to
Nearest
State, U.S.,
or Interstate
Highway
Distance and
Capacity of
Nearest
Existing
Transmission
Line
Assumed
Area of Road
ROW
Distance to Nearest
BLM-Designated
Transmission
Corridore
9,712 acresa
and 7,770 acres
863 MWb
1,554 MW
Adjacent
(U.S. 285)
10 mic,d and
69 kV
0 acres NAf
a To convert acres to km2, multiply by 0.004047.
b Maximum power output if the SEZ were fully developed using power tower, dish engine, or
PV technologies, assuming 9 acres/MW (0.04 km2/MW) of land required.
c To convert mi to km, multiply by 1.609.
d In the Draft Solar PEIS, the nearest transmission line identified was a 69-kV line 4 mi from the SEZ;
this information has been updated.
e BLM-designated corridors are developed for federal land use planning purposes only and are not
applicable to state-owned or privately owned land.
f NA = no BLM-designated corridor is near the proposed Antonito Southeast SEZ.

Final Solar PEIS 10.1-6 July 2012
The transmission assessment for the Antonito Southwest SEZ has been updated, and 1
the hypothetical transmission corridor assessed in the Draft Solar PEIS is no longer applicable. 2
For this updated assessment, the 121 acres (0.5 km2) of land disturbance for a hypothetical 3
transmission corridor to the existing transmission line is no longer assumed (although the 4
impacts of required new transmission overall are addressed in Section 10.1.23). 5
6
For the proposed Antonito Southeast SEZ, existing road access should be adequate to 7
support construction and operation of solar facilities, because U.S. 285 runs along the western 8
boundary of the SEZ. Thus, no additional road construction outside of the SEZ was assumed to 9
be required to support solar development of the SEZ, as summarized in Table 10.1.1.2-1. 10
11
12
10.1.1.3 Programmatic and SEZ-Specific Design Features 13
14
The proposed programmatic design features for each resource area to be required under 15
the BLM Solar Energy Program are presented in Section A.2.2 of Appendix A of this Final Solar 16
PEIS. These programmatic design features are intended to avoid, minimize, and/or mitigate 17
adverse impacts from solar energy development and will be required for development on all 18
BLM-administered lands including SEZ and non-SEZ lands.. 19
20
The discussions below addressing potential impacts from solar energy development on 21
specific resource areas (Sections 10.1.2 through 10.1.22) also provide an assessment of the 22
effectiveness of the programmatic design features in mitigating adverse impacts from solar 23
development within the SEZ. SEZ-specific design features to address impacts specific to the 24
proposed Antonito Southeast SEZ may be required in addition to the programmatic design 25
features. The proposed SEZ-specific design features for the Antonito Southeast SEZ have been 26
updated on the basis of revisions to the SEZ since the Draft Solar PEIS (such as boundary 27
changes and the identification of non-development areas), and on the basis of comments 28
received on the Draft and Supplement to the Draft Solar PEIS. All applicable SEZ-specific 29
design features identified to date (including those from the Draft Solar PEIS that are still 30
applicable) are presented in Sections 10.1.2 through 10.1.22. 31
32
33
10.1.2 Lands and Realty 34
35
36
10.1.2.1 Affected Environment 37
38
The proposed Antonito Southeast SEZ is a well blocked area of BLM-administered 39
public lands that is rural and largely undeveloped. The SEZ is bordered to the north by private 40
lands, and there are 1,280 acres (5.2 km2) of state lands located to the east and west of the area. 41
Land to the south of the SEZ in New Mexico is also public land. Section 10.1.2.1 of the Draft 42
Solar PEIS contained a statement that there was one solar facility operating in the San Luis 43
Valley near Mosca. There actually are several operating facilities in that area. The description in 44
the Draft Solar PEIS of the condition of the SEZ and surrounding area in regard to lands and 45
realty issues remains valid. 46
47

Final Solar PEIS 10.1-7 July 2012
10.1.2.2 Impacts 1
2
Solar development in the proposed SEZ would establish a large industrial area that would 3
exclude many existing and potential uses of the land, perhaps in perpetuity. Because the SEZ is 4
undeveloped and rural, utility-scale solar development would introduce a new and discordant 5
land use in the area. 6
7
The description of impacts in the Draft Solar PEIS identified a strip of public lands of 8
about 1,240 acres (5.0 km2) abutting the west end of the proposed SEZ that would be isolated by 9
solar development from the rest of the public lands in the SEZ, and indicated that it would be 10
difficult to manage. While the area may be managed differently from the lands in the SEZ, the 11
presence of the highway and cultural resource values in the area make this unavoidable. 12
13
Access to public lands south and east of the proposed SEZ could be affected by 14
development of solar facilities that could sever existing roads and trails. 15 16 17
10.1.2.3 SEZ-Specific Design Features and Design Feature Effectiveness 18
19
Required programmatic design features that would reduce impacts on lands and realty 20
are described in Section A.2.2 of Appendix A of this Final Solar PEIS. Implementing the 21
programmatic design features will provide some mitigation for the identified impacts but will not 22
completely mitigate adverse impacts. For example, impacts related to the exclusion of many 23
existing and potential uses of the public land, the visual impact of an industrial-type solar facility 24
within an otherwise rural area, and induced land use changes, if any, on nearby or adjacent state 25
and private lands may not be fully mitigated. 26
27
On the basis of impact analyses conducted for the Draft Solar PEIS and consideration of 28
comments received as applicable, the following proposed SEZ-specific design feature for the 29
revised Antonito Southeast SEZ has been identified: 30
31
• Management of the 1,240-acre (5.0-km2) area of public land west of the 32
proposed SEZ boundary should be addressed as part of the site-specific 33
analysis of any future development within the SEZ. 34
35
The need for additional SEZ-specific design features will be established for parcels 36
within the proposed Antonito Southeast SEZ through the process of preparing parcels for 37
competitive offer and subsequent project-specific analysis. 38 39 40 10.1.3 Specially Designated Areas and Lands with Wilderness Characteristics 41 42 43
10.1.3.1 Affected Environment 44
45
There are nine specially designated areas within 25 mi (40 km) of the proposed Antonito 46
Southeast SEZ. The Draft Solar PEIS accurately describes these areas with one addition. A 47

Final Solar PEIS 10.1-8 July 2012
recently maintained inventory of wilderness characteristics determined that public lands within 1
the proposed SEZ do not contain wilderness characteristics. 2
3
4
10.1.3.2 Impacts 5
6
As stated in the Draft Solar PEIS, solar energy development within the SEZ will result in 7
the development of a very large industrial site in an area that otherwise is currently rural. Visual 8
impacts on specially designated areas would be affected by the types of solar technologies 9
deployed within the SEZ. Lower height facilities, facilities with less reflectivity, and facilities 10
that do not use wet cooling would be expected to have less potential for adverse visual impact 11
on surrounding areas (see Section 10.1.14 for a more detailed discussion). Elevated viewpoints, 12
such as the slightly elevated portions of the Cumbres & Toltec Scenic Railroad (CTSR) or 13
nearby viewpoints, such as the San Antonio WSA, the West Fork of the North Branch of the 14
Old Spanish Trail, or the Los Caminos Antiguos Scenic Byway, would have significant views 15
of development within the SEZ and would likely be adversely affected. Site-specific analysis, 16
including consideration of the potential for visible glint and glare from solar panels and the 17
visibility of structures, will need to be completed before impacts can be fully assessed and 18
potential mitigation measures considered. Travelers coming south or east on the Los Antiguos 19
Scenic Byway would be looking directly into the SEZ, and development within the SEZ would 20
be very visible, having the potential to detract from the visitor experience. The route of a portion 21
of the West Branch of the North Fork of the Old Spanish Trail passes within 0.25 mi (0.4 km) of 22
the SEZ; thus solar development in the SEZ may have a major impact on the historic and visual 23
integrity of the Trail, depending on the determination of the integrity and historical significance 24
of the portion of the Trail from which solar development could be seen. Finally, development 25
within the SEZ may be inconsistent with the purposes for which the Sangre de Cristo National 26
Heritage Area (NHA) was designated. 27
28
29
10.1.3.3 SEZ-Specific Design Features and Design Feature Effectiveness 30
31
Required programmatic design features that would reduce impacts on specially 32
designated areas are described in Section A.2.2 of Appendix A of this Final Solar PEIS (design 33
features for specially designated areas, cultural resources, and visual resources would address 34
impacts). Implementing the programmatic design features will provide some mitigation for the 35
identified impacts but may not mitigate impacts on the CTSR and the San Antonio WSA. 36
Programmatic design features will be applied to address SEZ-specific resources and conditions, 37
for example: 38
39
• For projects in the Antonito Southeast SEZ that are located within the 40
viewshed of the West Fork of the North Branch of the Old Spanish Trail, a 41
National Trail inventory will be required to determine the area of possible 42
adverse impact on resources, qualities, values, and associated settings of the 43
Trail; to prevent substantial interference; and to determine any areas 44
unsuitable for development. Residual impacts will be avoided, minimized, 45
and/or mitigated to the extent practicable according to program policy 46
Final Solar PEIS 10.1-9 July 2012
standards. Programmatic design features have been included in BLM’s Solar 1
Energy Program to address impacts on National Historic Trails (see 2
Section A.2.2.23 of Appendix A). 3
4
On the basis of impact analyses conducted for the Draft Solar PEIS and consideration of 5
comments received as applicable, the following proposed SEZ-specific design features have been 6
identified: 7
8
• The SEZ-specific design features for visual resources specified in 9
Section 10.1.14.3 should be adopted, as they would provide some protection 10
for visual related impacts on the CTSR and the San Antonio WSA. 11
12
• Early consultation should be initiated with the entity responsible for 13
developing the management plan for the Sangre de Cristo NHA to understand 14
how development of the SEZ could be consistent with NHA plans/goals. 15
16
The need for additional SEZ-specific design features will be identified through the 17
process of preparing parcels for competitive offer and subsequent project-specific analysis. 18
19
20
10.1.4 Rangeland Resources 21
22
23
10.1.4.1 Livestock Grazing 24
25
26
10.1.4.1.1 Affected Environment 27
28
The proposed Antonito Southeast SEZ overlaps large portions of three seasonal grazing 29
allotments. These allotments are used by five grazing permittees and provide 669 animal unit 30
months (AUMs) of forage per year 31
32
33
10.1.4.1.2 Impacts 34
35
The general discussion in the Draft Solar PEIS regarding determining the impact on 36
grazing operations remains valid. Should the proposed SEZ be fully developed for solar energy 37
production, it is likely that the BLM grazing permits for all three allotments would be cancelled 38
and the permittees would be displaced. While the specific situation of each of the grazing 39
permittees is not known, it is clear that loss of all or part of their grazing permits would be a 40
significant adverse impact on them. Economic losses would not be limited to the value of the lost 41
grazing opportunity but would extend also to the value of the overall ranch operation including 42
any private lands tied to the grazing operation. While permittees would be reimbursed for their 43
portion of the value of range improvements on their permits, this reimbursement would not cover 44
their economic loss. 45
46
Final Solar PEIS 10.1-10 July 2012
10.1.4.1.3 SEZ-Specific Design Features and Design Feature Effectiveness 1
2
Required programmatic design features that would reduce impacts on livestock grazing 3
are described in Section A.2.2 of Appendix A of this Final Solar PEIS. Implementing the 4
programmatic design features will provide some mitigation for identified impacts should only 5
portions of grazing permits be affected, but they will not mitigate a complete loss of grazing 6
permits, the loss of livestock AUMs, or the loss of value in ranching operations including private 7
land values. 8
9
No SEZ-specific design features to protect livestock grazing have been identified in this 10
Final Solar PEIS. Some SEZ-specific design features may be identified through the process of 11
preparing parcels for competitive offer and subsequent project-specific analysis. 12
13
14
10.1.4.2 Wild Horses and Burros 15
16
17
10.1.4.2.1 Affected Environment 18
19
The information presented in the Draft Solar PEIS remains valid. There are no wild horse 20
or burro herd management areas (HMAs) within the proposed Antonito Southeast SEZ or in 21
proximity to it; however, there have been occasional reports of feral horses seen in the SEZ. 22
23
24
10.1.4.2.2 Impacts 25
26
As presented in the Draft Solar PEIS, solar energy development within the proposed 27
Antonito Southeast SEZ would not affect wild horses and burros. 28
29
30
10.1.4.2.3 SEZ-Specific Design Features and Design Feature Effectiveness 31
32
On the basis of impact analyses conducted for the Draft Solar PEIS and consideration of 33
comments received as applicable, no SEZ-specific design features to address wild horses and 34
burros are required for the proposed Antonito Southeast SEZ. 35
36
37
10.1.5 Recreation 38
39
40
10.1.5.1 Affected Environment 41
42
The area of the proposed Antonito Southeast SEZ has not changed from that presented in 43
the Draft Solar PEIS. 44
45

Final Solar PEIS 10.1-11 July 2012
Comments have pointed out that most of the recreational discussion in the Draft Solar 1
PEIS was focused internally within the SEZ and did not address the larger part that public and 2
other federal lands play in the landscape and tourism economy of the San Luis Valley. A 3
summary of the better known attractions within the valley includes Great Sand Dunes National 4
Park and Preserve, the Old Spanish Trail, two scenic railroads, the Los Caminos Antiguos 5
Scenic Byway, the Sangre de Cristo Mountains, three national wildlife refuges, and numerous 6
designated wilderness areas. These areas are among the highlights of the recreational and tourism 7
opportunities in the area. The Antonito Southeast SEZ is adjacent to U.S. 285, which is the major 8
access route into the valley from the south, and also is very visible from CO 17, which accesses 9
the valley from the west and is a part of the Los Caminos Antiguos Scenic Byway, which 10
accesses the valley from the west. Tourism is an important part of the valley economy and an 11
important focus for future economic growth. 12
13
While the public land within the proposed SEZ is flat and generally unremarkable, it is 14
also large and conspicuous because it is undeveloped and is readily accessible to recreational 15
users. It also adjoins a large block of public lands to the south in New Mexico. As described in 16
the Draft Solar PEIS, the area supports a range of dispersed recreational activities, although it is 17
believed that levels of recreational use are low. The Colorado Division of Wildlife (CDOW)1 has 18
commented the area is habitat for pronghorn antelope, an important species for hunting in the 19
area. More detailed information on impacts on these species can be found in Section 10.1.11.3.2 20
of the Draft Solar PEIS. 21
22
23
10.1.5.2 Impacts 24
25
As stated in the Draft Solar PEIS, solar development of the SEZ will be readily visible 26
to travelers on U.S. 285 and on the Los Caminos Antiguos Scenic Byway. Since the proposed 27
SEZ is large, solar development of the area has the potential to influence the impressions of 28
recreational and tourism visitors entering the San Luis Valley via routes near the SEZ. Whether 29
there would be a potential impact on recreation and tourism in the valley because of the solar 30
development along these access routes is unknown. There may be potential to provide 31
interpretive activities focused on solar energy and development that would be of interest to 32
travelers. 33
34
Because the route of the West Fork of the North Branch of the Old Spanish Trail is so 35
near the SEZ, it is anticipated that the viewshed of the Trail would be adversely affected by solar 36
development within the SEZ and might reduce the potential future recreational attraction of the 37
Trail. However, the integrity and historical significance of the portion of the Trail near to the 38
proposed SEZ remain undetermined. 39
40
Visual impacts on surrounding recreational use areas would be greater with taller solar 41
facilities such as power towers and facilities with wet cooling. Visitors to areas located at higher 42
elevations than the SEZ (e.g., San Luis Hills ACEC and WSA, and the CTSR) will see the solar 43
1 Note that on July 1, 2011, Colorado State Parks and the Colorado Division of wildlife were merged to form
Colorado State Parks and Wildlife.
Final Solar PEIS 10.1-12 July 2012
development within the SEZ, but the impact on recreational use of these areas is unknown at this 1
time. The types of solar technologies employed and whether there is significant glint or glare 2
from reflective surfaces of solar facilities would play a large role in the extent of visibility of 3
solar development. The focus and intent of the relatively new Sangre de Cristo NHA is not yet 4
well defined, so it has not been possible to assess how solar development may interact with the 5
objectives of the NHA. 6
7
The CDOW has commented there is a specific concern with the loss of pronghorn 8
antelope habitat in Game Management Unit (GMU) 81, where the SEZ is located. There are 9
limited antelope hunting permits issued in the GMU, and the reduction in habitat that would 10
occur due to solar development within the SEZ could result in a reduction in antelope hunting 11
opportunities. However, the overall impact on pronghorn was estimated to be small in this 12
assessment (see Section 10.1.11.4.2 of the Draft Solar PEIS), because only a small portion of 13
the available habitat in the valley occurs within the proposed SEZ. 14
15
In addition, lands that are outside of the proposed SEZ may be acquired or managed for 16
mitigation of impacts on other resources (e.g., sensitive species). Managing these lands for 17
mitigation could further exclude or restrict recreational use, potentially leading to additional 18
losses in recreational opportunities in the region. The impact of acquisition and management of 19
mitigation lands would be considered as a part of the environmental analysis of specific solar 20
energy projects. 21
22
23
10.1.5.3 SEZ-Specific Design Features and Design Feature Effectiveness 24
25
Required programmatic design features that would reduce impacts on recreational 26
resources are described in Section A.2.2 of Appendix A of this Final Solar PEIS (design features 27
for both specially designated areas and visual resources also would address some impacts). 28
Implementing the programmatic design features will provide some mitigation for the identified 29
impacts but will not mitigate the loss of recreational access to public lands developed for solar 30
energy production. Likewise, a loss of wildlife-related hunting recreation will not be mitigated. 31
32
On the basis of impact analyses conducted for the Draft Solar PEIS and consideration of 33
comments received as applicable, the following proposed SEZ-specific design feature for the 34
proposed Antonito Southeast SEZ has been identified: 35
36
• Tourism is an important economic growth area for the San Luis Valley, 37
and the Antonito Southeast SEZ is located in a visible location adjacent to 38
principal highway routes into the valley. Because of its location, there is 39
potential to influence visitors’ perception of the tourism climate in the valley. 40
As projects are proposed for the SEZ, the potential impacts on tourism should 41
be considered and reviewed with local community leaders. 42
43
The need for additional SEZ-specific design features will be identified through the 44
process of preparing parcels for competitive offer and subsequent project-specific analysis. 45
46
Final Solar PEIS 10.1-13 July 2012
10.1.6 Military and Civilian Aviation 1 2 3
10.1.6.1 Affected Environment 4
5
As stated in the Draft Solar PEIS, the proposed Antonito Southeast SEZ is located under 6
two military training routes (MTRs) and is identified by the BLM as an area of required 7
consultation with the U.S. Department of Defense (DoD). 8 9 10
10.1.6.2 Impacts 11
12
Through comments on the Draft Solar PEIS, the military has indicated that it has no 13
concerns about potential impacts on its activities associated with solar development. There also 14
are no anticipated impacts on civilian aviation. 15
16
17
10.1.6.3 SEZ-Specific Design Features and Design Feature Effectiveness 18
19
Required programmatic design features that would reduce impacts on military and 20
civilian aviation are described in Section A.2.2 of Appendix A of this Final Solar PEIS. The 21
programmatic design features require early coordination with the DoD to identify and avoid, 22
minimize, and/or mitigate, if possible, any potential impacts on the use of military airspace. 23
24
No SEZ-specific design features for military and civilian aviation have been identified in 25
this Final Solar PEIS. Some SEZ-specific design features may be identified through the process 26
of preparing parcels for competitive offer and subsequent project-specific analysis. 27
28
29
10.1.7 Geologic Setting and Soil Resources 30
31
32
10.1.7.1 Affected Environment 33
34
35
10.1.7.1.1 Geologic Setting 36
37
Data provided in the Draft Solar PEIS remain valid. The boundaries of the proposed 38
Antonito Southeast SEZ remain the same, but about 17 acres (0.069 km2) of wetland and lake 39
areas are now designated as non-development areas. 40
41
42
10.1.7.1.2 Soil Resources 43
44
Data provided in the Draft Solar PEIS remain valid, with the following update: 45
46

Final Solar PEIS 10.1-14 July 2012
• Table 10.1.7.1-1 provides revised areas for soil map units taking into account 1
the non-development area within the Antonito Southeast SEZ. 2
3
4
10.1.7.2 Impacts 5
6
Impacts on soil resources would occur mainly as a result of ground-disturbing activities 7
(e.g., grading, excavating, and drilling), especially during the construction phase of a solar 8
project. Because the developable area of the SEZ has changed by less than 1%, the assessment 9
of impacts provided in the Draft Solar PEIS remains valid, with the following update: 10
11
• Impacts related to wind erodibility are somewhat reduced because the 12
identification of non-development areas eliminates about 5 acres (0.020 km2) 13
of moderately erodible soils from development (the playa areas are not rated 14
for wind erodibility). 15
16
17
10.1.7.3 SEZ-Specific Design Features and Design Feature Effectiveness 18
19
Required programmatic design features that would reduce impacts on soils are described 20
in Section A.2.2 of Appendix A of this Final Solar PEIS. Implementing the programmatic design 21
features will reduce the potential for soil impacts during all project phases. 22
23
On the basis of impact analyses conducted for the Draft Solar PEIS and consideration 24
of comments received as applicable, no SEZ-specific design features for soil resources were 25
identified at the proposed Antonito Southeast SEZ. Some SEZ-specific design features may be 26
identified through the process of preparing parcels for competitive offer and subsequent project-27
specific analysis. 28
29
30
10.1.8 Minerals (Fluids, Solids, and Geothermal Resources) 31
32
A mineral potential assessment for the proposed Antonito Southeast SEZ has been 33
prepared and reviewed by BLM mineral specialists knowledgeable about the region where the 34
SEZ is located (BLM 2012). The BLM is proposing to withdraw the SEZ from settlement, sale, 35
location, or entry under the general land laws, including the mining laws, for a period of 20 years 36
(see Section 2.2.2.2.4 of the Final Solar PEIS). The potential impacts of this withdrawal are 37
discussed in Section 10.1.24. 38
39
40
10.1.8.1 Affected Environment 41
42
There are no oil and gas leases, mining claims, or geothermal leases located in the 43
proposed SEZ. The description of the mineral resources in the Draft Solar PEIS remains valid. 44
45
46

Fin
al S
ola
r PE
IS
10.1
-15
July 2
01
2
TABLE 10.1.7.1-1 Summary of Soil Map Units within the Proposed Antonito Southeast SEZ as Revised 1
Map
Unit
Symbola
Erosion Potential
Area in Acresd
(Percentage of
SEZ)
Map Unit Name
Waterb
Windc
Description
53 Travelers very stony
loam (1 to 3% slope)
Slight Low
(WEG 8)e
Nearly level soils on mesas and hillslopes capped by basalts, andesite,
and/or rhyolite. Parent material consists of thin calcareous sediments
weathered from basalt. Shallow and well to somewhat excessively drained,
with medium surface-runoff potential and moderate to moderately rapid
permeability. Available water capacity is very low. Used mainly as
rangeland. Susceptible to compaction.
5,445 (56.0)f
17 Garita cobbly loam
(0 to 3% slope)
Slight Moderate
(WEG 4)
Nearly level soils on alluvial fans and fan terraces. Parent material consists
of thick calcareous sediments from basalt. Deep and well drained, with very
low surface-runoff potential and moderate permeability. Available water
capacity is low. Used mainly as native pastureland. Susceptible to
compaction.
2,707 (27.8)g
18 Garita cobbly loam
(3 to 25% slope)
Slight Moderate
(WEG 4)
Nearly level to gently sloping soils on alluvial fans and fan terraces. Parent
material consists of thick calcareous and gravelly alluvium from basalt.
Deep and well drained, with low surface-runoff potential and moderate
permeability. Available water capacity is low. Used mainly as native
pastureland. Susceptible to compaction.
1,060 (10.9)h
38 Monte loam
(1 to 3% slope)
Slight Moderate
(WEG 4)
Nearly level soils on alluvial fans and floodplains. Parent material consists
of alluvium from rhyolite and latite. Deep and well drained, with low
surface-runoff potential and moderate permeability. Available water
capacity is high. Used mainly for native rangeland and irrigated cropland;
prime farmland if irrigated.i Susceptible to compaction; severe rutting
hazard.
209 (2.2)
2
Fin
al S
ola
r PE
IS
10.1
-16
July 2
01
2
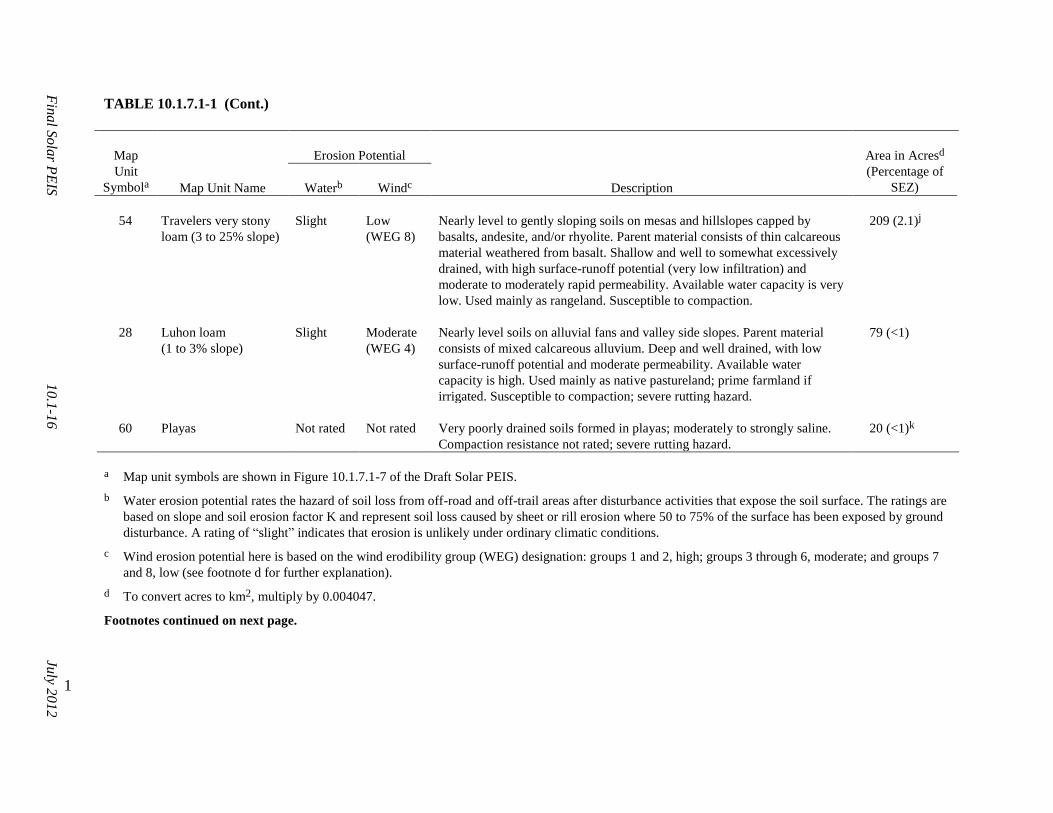
TABLE 10.1.7.1-1 (Cont.)
Map
Unit
Symbola
Erosion Potential
Area in Acresd
(Percentage of
SEZ)
Map Unit Name
Waterb
Windc
Description
54 Travelers very stony
loam (3 to 25% slope)
Slight Low
(WEG 8)
Nearly level to gently sloping soils on mesas and hillslopes capped by
basalts, andesite, and/or rhyolite. Parent material consists of thin calcareous
material weathered from basalt. Shallow and well to somewhat excessively
drained, with high surface-runoff potential (very low infiltration) and
moderate to moderately rapid permeability. Available water capacity is very
low. Used mainly as rangeland. Susceptible to compaction.
209 (2.1)j
28 Luhon loam
(1 to 3% slope)
Slight Moderate
(WEG 4)
Nearly level soils on alluvial fans and valley side slopes. Parent material
consists of mixed calcareous alluvium. Deep and well drained, with low
surface-runoff potential and moderate permeability. Available water
capacity is high. Used mainly as native pastureland; prime farmland if
irrigated. Susceptible to compaction; severe rutting hazard.
79 (<1)
60 Playas Not rated Not rated Very poorly drained soils formed in playas; moderately to strongly saline.
Compaction resistance not rated; severe rutting hazard.
20 (<1)k
a Map unit symbols are shown in Figure 10.1.7.1-7 of the Draft Solar PEIS.
b Water erosion potential rates the hazard of soil loss from off-road and off-trail areas after disturbance activities that expose the soil surface. The ratings are
based on slope and soil erosion factor K and represent soil loss caused by sheet or rill erosion where 50 to 75% of the surface has been exposed by ground
disturbance. A rating of “slight” indicates that erosion is unlikely under ordinary climatic conditions.
c Wind erosion potential here is based on the wind erodibility group (WEG) designation: groups 1 and 2, high; groups 3 through 6, moderate; and groups 7
and 8, low (see footnote d for further explanation).
d To convert acres to km2, multiply by 0.004047.
Footnotes continued on next page.
1
Fin
al S
ola
r PE
IS
10.1
-17
July 2
01
2
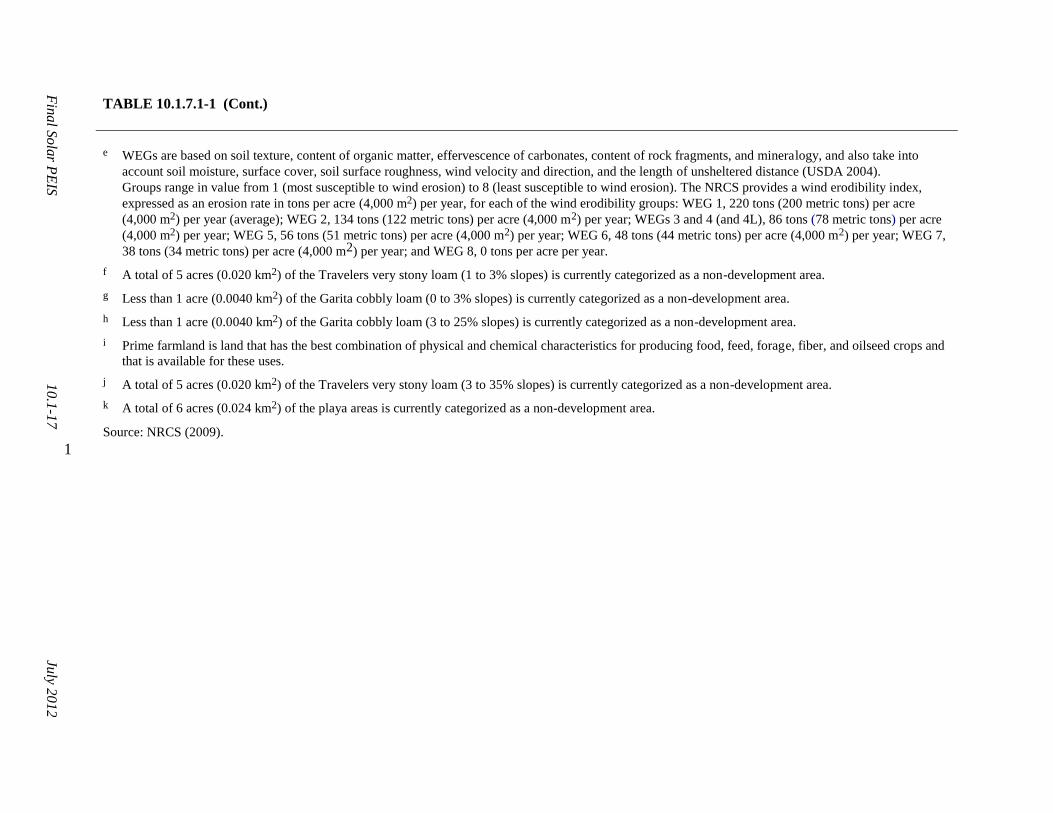
TABLE 10.1.7.1-1 (Cont.)
e WEGs are based on soil texture, content of organic matter, effervescence of carbonates, content of rock fragments, and mineralogy, and also take into
account soil moisture, surface cover, soil surface roughness, wind velocity and direction, and the length of unsheltered distance (USDA 2004).
Groups range in value from 1 (most susceptible to wind erosion) to 8 (least susceptible to wind erosion). The NRCS provides a wind erodibility index,
expressed as an erosion rate in tons per acre (4,000 m2) per year, for each of the wind erodibility groups: WEG 1, 220 tons (200 metric tons) per acre
(4,000 m2) per year (average); WEG 2, 134 tons (122 metric tons) per acre (4,000 m2) per year; WEGs 3 and 4 (and 4L), 86 tons (78 metric tons) per acre
(4,000 m2) per year; WEG 5, 56 tons (51 metric tons) per acre (4,000 m2) per year; WEG 6, 48 tons (44 metric tons) per acre (4,000 m2) per year; WEG 7,
38 tons (34 metric tons) per acre (4,000 m2) per year; and WEG 8, 0 tons per acre per year.
f A total of 5 acres (0.020 km2) of the Travelers very stony loam (1 to 3% slopes) is currently categorized as a non-development area.
g Less than 1 acre (0.0040 km2) of the Garita cobbly loam (0 to 3% slopes) is currently categorized as a non-development area.
h Less than 1 acre (0.0040 km2) of the Garita cobbly loam (3 to 25% slopes) is currently categorized as a non-development area.
i Prime farmland is land that has the best combination of physical and chemical characteristics for producing food, feed, forage, fiber, and oilseed crops and
that is available for these uses.
j A total of 5 acres (0.020 km2) of the Travelers very stony loam (3 to 35% slopes) is currently categorized as a non-development area.
k A total of 6 acres (0.024 km2) of the playa areas is currently categorized as a non-development area.
Source: NRCS (2009).
1

Final Solar PEIS 10.1-18 July 2012
10.1.8.2 Impacts 1
2
There are no anticipated impacts on mineral resources from the development of solar 3
energy facilities in the proposed SEZ. The analysis of impacts on mineral resources in the Draft 4
Solar PEIS remains valid. 5
6
7
10.1.8.3 SEZ-Specific Design Features and Design Feature Effectiveness 8
9
Required programmatic design features that will reduce impacts on mineral resources 10
are described in Section A.2.2 of Appendix A of this Final Solar PEIS. Implementing the 11
programmatic design features will provide adequate protection of mineral resources. 12
13
On the basis of impact analyses conducted for the Draft Solar PEIS and consideration 14
of comments received as applicable, no SEZ-specific design features for minerals have been 15
identified in this Final Solar PEIS. Some SEZ-specific design features may be identified through 16
the process of preparing parcels for competitive offer and subsequent project-specific analysis. 17
18
19
10.1.9 Water Resources 20
21
22
10.1.9.1 Affected Environment 23
24
The description of the affected environment given in the Draft Solar PEIS relevant to 25
water resources at the proposed Antonito Southeast SEZ remains valid and is summarized in the 26
following paragraphs. 27
28
The Antonito Southeast SEZ is within the Rio Grande Headwaters subbasin of the 29
Rio Grande hydrologic region. The SEZ is located in the San Luis Valley bounded by the 30
San Juan Mountains to the west and the Sangre de Cristo Mountains to the east. Precipitation 31
and snowfall in the valley is around 7 in./yr (18 cm/yr) and 25 in./yr (64 cm), respectively, with 32
much greater amounts in the surrounding mountains. Pan evaporation rates are estimated to be 33
on the order of 54 in./yr (137 cm/yr). Surface water features within the SEZ include Alta Lake 34
and several intermittent/ephemeral washes. Alta Lake covers an area of approximately 2 acres 35
(0.0040 km2), and the existing intermittent/ephemeral washes are generally shallow and flow 36
from southwest to northeast. Three palustrine wetlands have been identified within the SEZ, 37
which are temporally flooded throughout the year. Alta Lake and these wetland areas have been 38
identified as non-development areas covering 17 acres (0.07 km2) in total. Flood hazards have 39
not been identified, but intermittent flooding may occur along the intermittent/ephemeral washes 40
and Alta Lake. Groundwater in the San Luis Valley is primarily in basin-fill deposits with an 41
upper unconfined aquifer and a lower confined aquifer, which are separated by a series of 42
confining clay layers and unfractured volcanic rocks. There are no confining clay layers in the 43
vicinity of the Antonito Southeast SEZ; however, a basalt layer that is near the surface acts as a 44
confining unit over the basin-fill aquifer. Groundwater monitoring wells within the SEZ have 45
reported depths to groundwater ranging from 200 to 300 ft (61 to 91 m) below the surface that 46
Final Solar PEIS 10.1-19 July 2012
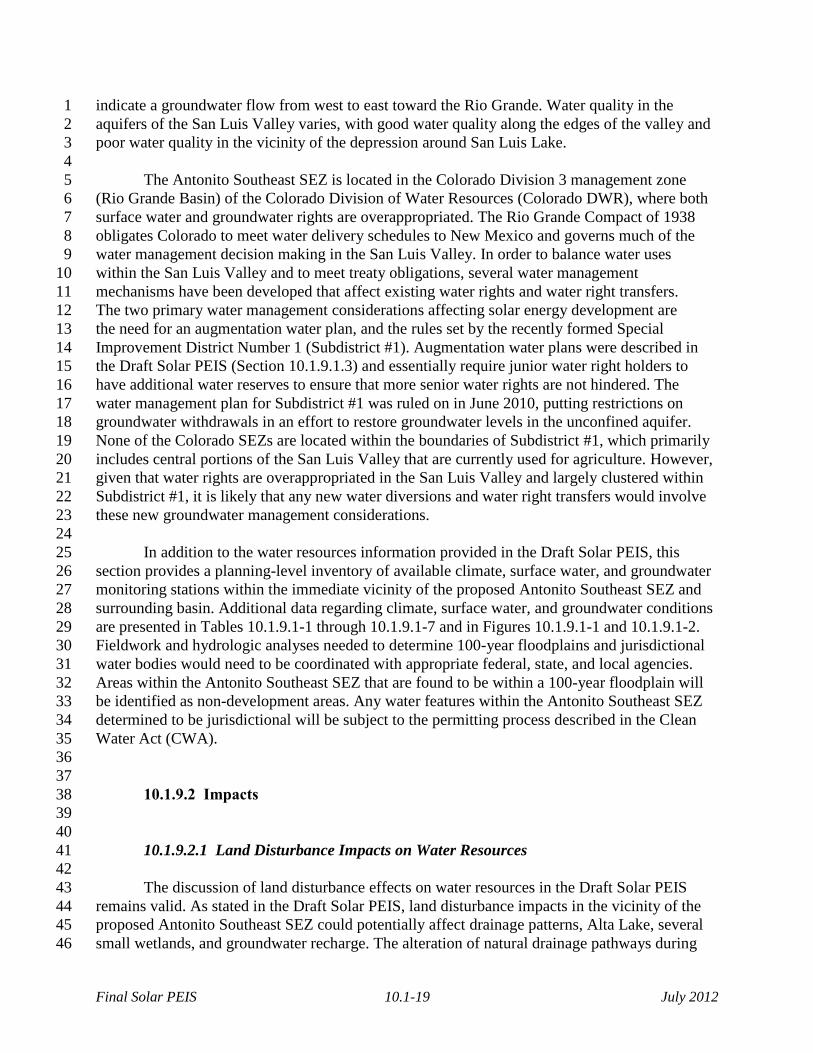
indicate a groundwater flow from west to east toward the Rio Grande. Water quality in the 1
aquifers of the San Luis Valley varies, with good water quality along the edges of the valley and 2
poor water quality in the vicinity of the depression around San Luis Lake. 3
4
The Antonito Southeast SEZ is located in the Colorado Division 3 management zone 5
(Rio Grande Basin) of the Colorado Division of Water Resources (Colorado DWR), where both 6
surface water and groundwater rights are overappropriated. The Rio Grande Compact of 1938 7
obligates Colorado to meet water delivery schedules to New Mexico and governs much of the 8
water management decision making in the San Luis Valley. In order to balance water uses 9
within the San Luis Valley and to meet treaty obligations, several water management 10
mechanisms have been developed that affect existing water rights and water right transfers. 11
The two primary water management considerations affecting solar energy development are 12
the need for an augmentation water plan, and the rules set by the recently formed Special 13
Improvement District Number 1 (Subdistrict #1). Augmentation water plans were described in 14
the Draft Solar PEIS (Section 10.1.9.1.3) and essentially require junior water right holders to 15
have additional water reserves to ensure that more senior water rights are not hindered. The 16
water management plan for Subdistrict #1 was ruled on in June 2010, putting restrictions on 17
groundwater withdrawals in an effort to restore groundwater levels in the unconfined aquifer. 18
None of the Colorado SEZs are located within the boundaries of Subdistrict #1, which primarily 19
includes central portions of the San Luis Valley that are currently used for agriculture. However, 20
given that water rights are overappropriated in the San Luis Valley and largely clustered within 21
Subdistrict #1, it is likely that any new water diversions and water right transfers would involve 22
these new groundwater management considerations. 23
24
In addition to the water resources information provided in the Draft Solar PEIS, this 25
section provides a planning-level inventory of available climate, surface water, and groundwater 26
monitoring stations within the immediate vicinity of the proposed Antonito Southeast SEZ and 27
surrounding basin. Additional data regarding climate, surface water, and groundwater conditions 28
are presented in Tables 10.1.9.1-1 through 10.1.9.1-7 and in Figures 10.1.9.1-1 and 10.1.9.1-2. 29
Fieldwork and hydrologic analyses needed to determine 100-year floodplains and jurisdictional 30
water bodies would need to be coordinated with appropriate federal, state, and local agencies. 31
Areas within the Antonito Southeast SEZ that are found to be within a 100-year floodplain will 32
be identified as non-development areas. Any water features within the Antonito Southeast SEZ 33
determined to be jurisdictional will be subject to the permitting process described in the Clean 34
Water Act (CWA). 35
36
37
10.1.9.2 Impacts 38
39
40
10.1.9.2.1 Land Disturbance Impacts on Water Resources 41
42
The discussion of land disturbance effects on water resources in the Draft Solar PEIS 43
remains valid. As stated in the Draft Solar PEIS, land disturbance impacts in the vicinity of the 44
proposed Antonito Southeast SEZ could potentially affect drainage patterns, Alta Lake, several 45
small wetlands, and groundwater recharge. The alteration of natural drainage pathways during 46

Final Solar PEIS 10.1-20 July 2012
TABLE 10.1.9.1-1 Watershed and Water Management Basin 1 Information Relevant to the Proposed Antonito Southeast SEZ 2 as Revised 3
Basin
Name
Area
(acres)b
Subregion (HUC4)a Rio Grande Headwaters (1301) 4,871,782
Cataloging unit (HUC8) Alamosa–Trinchera (13010002) 1,625,212
Cataloging unit (HUC8) Conejos (13010005) 490,998
Groundwater basin San Luis Valley 2,000,000
SEZ Antonito Southeast 9,729
a HUC = Hydrologic Unit Code; a USGS system for characterizing
nested watersheds that includes large-scale subregions (HUC4) and
small-scale cataloging units (HUC8).
b To convert acres to km2, multiply by 0.004047.
4
5 TABLE 10.1.9.1-2 Climate Station Information Relevant to the Proposed Antonito Southeast SEZ 6 as Revised 7
Climate Station
(COOP IDa)
Elevationb
(ft)c
Distance
to SEZ
(mi)d
Period of
Record
Mean Annual
Precipitation
(in.)e
Mean Annual
Snowfall
(in.)
Chama, New Mexico (291664) 7,850 36 1893–2011 21.33 107.00
Conejos 3 NNW, Colorado (051816) 7,907 9 1904–1960 7.93 21.40
Manassa, Colorado (055322) 7,690 11 1893–2011 7.27 24.80
Skarda, New Mexico (298352) 8,507 15 1942–1983 13.21 58.40
a National Weather Service’s Cooperative Station Network station identification code.
b Surface elevations for the proposed Antonito Southeast SEZ range from 7,715 to 8,035 ft.
c To convert ft to m, multiply by 0.3048.
d To convert mi to km, multiply by 1.6093.
e To convert in. to cm, multiply by 2.540.
Source: NOAA (2012).
8
9
construction can lead to impacts related to flooding, loss of water delivery to downstream 10
regions, and sedimentation in Alta Lake and wetland areas, along with alterations to riparian 11
vegetation and habitats. Within the SEZ, 17 acres (0.069 km2) have been identified as non-12
development areas, including Alta Lake and several small wetlands. 13
14
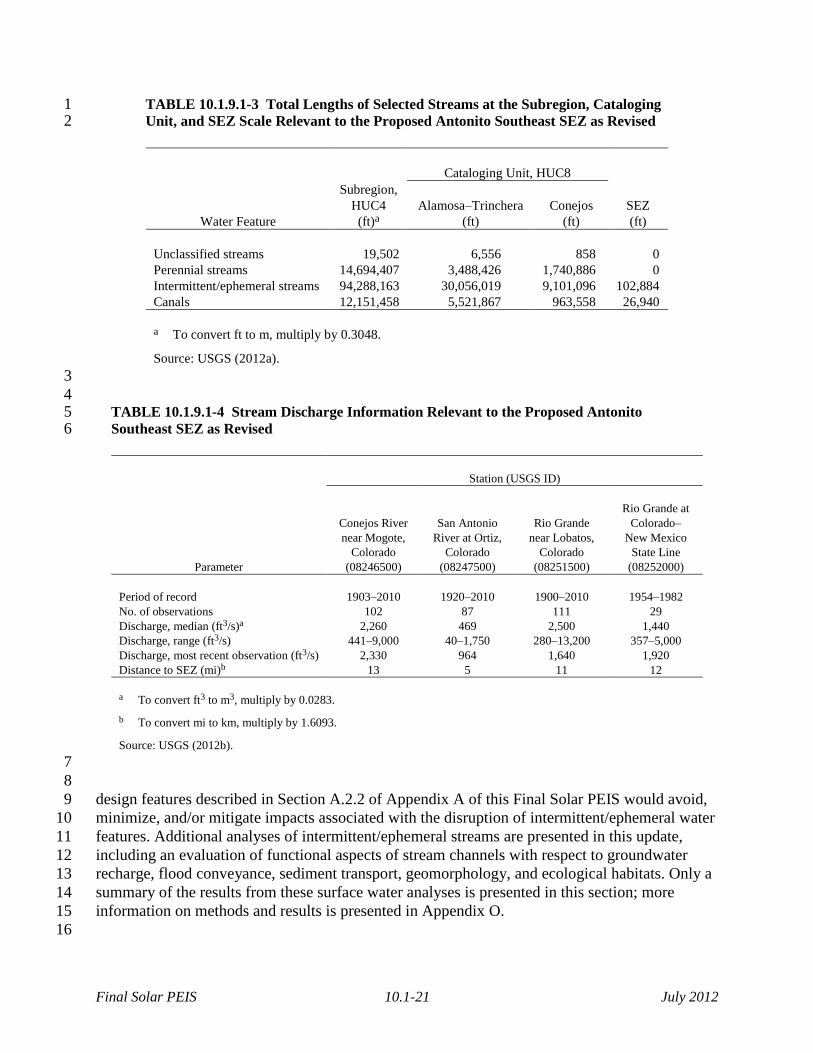
Land clearing, land leveling, and vegetation removal during the development of the SEZ 15
have the potential to disrupt intermittent/ephemeral stream channels. Several programmatic 16
Final Solar PEIS 10.1-21 July 2012
TABLE 10.1.9.1-3 Total Lengths of Selected Streams at the Subregion, Cataloging 1 Unit, and SEZ Scale Relevant to the Proposed Antonito Southeast SEZ as Revised 2
Cataloging Unit, HUC8
Water Feature
Subregion,
HUC4
(ft)a
Alamosa–Trinchera
(ft)
Conejos
(ft)
SEZ
(ft)
Unclassified streams 19,502 6,556 858 0
Perennial streams 14,694,407 3,488,426 1,740,886 0
Intermittent/ephemeral streams 94,288,163 30,056,019 9,101,096 102,884
Canals 12,151,458 5,521,867 963,558 26,940
a To convert ft to m, multiply by 0.3048.
Source: USGS (2012a).
3
4 TABLE 10.1.9.1-4 Stream Discharge Information Relevant to the Proposed Antonito 5 Southeast SEZ as Revised 6
Station (USGS ID)
Parameter
Conejos River
near Mogote,
Colorado
(08246500)
San Antonio
River at Ortiz,
Colorado
(08247500)
Rio Grande
near Lobatos,
Colorado
(08251500)
Rio Grande at
Colorado–
New Mexico
State Line
(08252000)
Period of record 1903–2010 1920–2010 1900–2010 1954–1982
No. of observations 102 87 111 29
Discharge, median (ft3/s)a 2,260 469 2,500 1,440
Discharge, range (ft3/s) 441–9,000 40–1,750 280–13,200 357–5,000
Discharge, most recent observation (ft3/s) 2,330 964 1,640 1,920
Distance to SEZ (mi)b 13 5 11 12
a To convert ft3 to m3, multiply by 0.0283.
b To convert mi to km, multiply by 1.6093.
Source: USGS (2012b).
7
8
design features described in Section A.2.2 of Appendix A of this Final Solar PEIS would avoid, 9
minimize, and/or mitigate impacts associated with the disruption of intermittent/ephemeral water 10
features. Additional analyses of intermittent/ephemeral streams are presented in this update, 11
including an evaluation of functional aspects of stream channels with respect to groundwater 12
recharge, flood conveyance, sediment transport, geomorphology, and ecological habitats. Only a 13
summary of the results from these surface water analyses is presented in this section; more 14
information on methods and results is presented in Appendix O. 15
16

Fin
al S
ola
r PE
IS
10.1
-22
July 2
01
2
TABLE 10.1.9.1-5 Surface Water Quality Data Relevant to the Proposed Antonito Southeast SEZ as 1 Revised 2
Station (USGS ID)a
Parameter
08246500
08247500
08251500
08252000
08249200
Period of record 1967–1987 1978–1986 1919–2011 1978–1982 1957–1969
No. of records 208 158 742 86 537
Temperature (°C)b 6 (0–19.5) 3 (0–25) 12 (0–210) 10.25 (0–23) 10 (0–25)
Total dissolved solids (mg/L) 70 (37–77) NAc 177.5 (73–690) NA 229 (94)
Dissolved oxygen (mg/L) 8.4 NA 8.9 (4.7–87) NA 661
pH 7.1 (6.8–8.3) NA 8.2 (6.4–9) NA 7.6 (6.6–8.9)
Total nitrogen (mg/L) <0.14 NA 0.37 (0.11–1.2) NA NA
Phosphorus (mg/L as P) 0.015 NA 0.37 (0.11–1.2) NA NA
Organic carbon (mg/L) 1.8 NA 0.06 (0.006–0.41) NA NA
Calcium (mg/L) 13 (6–16) NA 26 (10–98) NA 38 (13–88)
Magnesium (mg/L) 1.7 (1–2.7) NA 5.1 (1.3–24) NA 7.3 (1–20)
Sodium (mg/L) 2.7 (1–3.2) NA 19 (6.2–100) NA 32 (8.2–183)
Chloride (mg/L) 1.1 (0.5–2.5) NA 5.95 (1.2–33) NA 7.6 (1.5–33)
Sulfate (mg/L) 4.2 (2.41–5) NA 39.5 (7.92–320) NA 53 (15–296)
Arsenic (µg/L) 1 NA 2.95 (1–6) NA NA
a Median values are listed; the range in values is shown in parentheses.
b To convert °C to °F, multiply by 1.8, then add 32.
c NA = no data collected for this parameter.
Source: USGS (2012b).
3
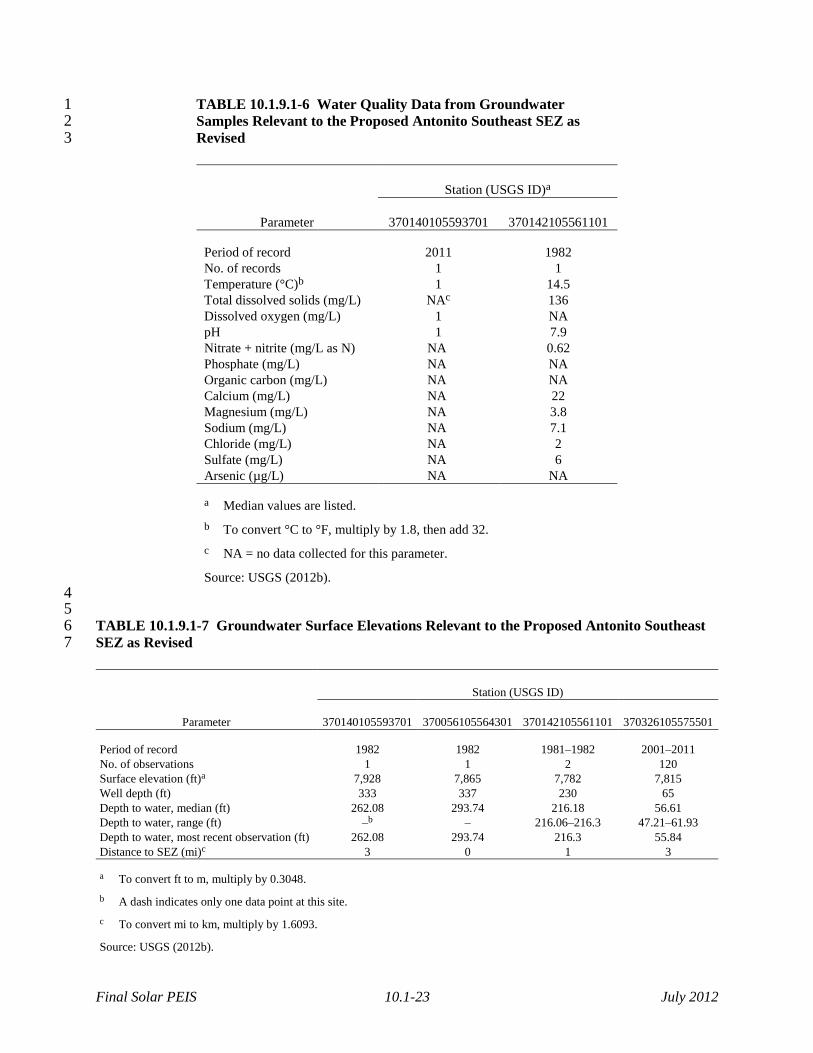
Final Solar PEIS 10.1-23 July 2012
TABLE 10.1.9.1-6 Water Quality Data from Groundwater 1 Samples Relevant to the Proposed Antonito Southeast SEZ as 2 Revised 3
Station (USGS ID)a
Parameter
370140105593701
370142105561101
Period of record 2011 1982
No. of records 1 1
Temperature (°C)b 1 14.5
Total dissolved solids (mg/L) NAc 136
Dissolved oxygen (mg/L) 1 NA
pH 1 7.9
Nitrate + nitrite (mg/L as N) NA 0.62
Phosphate (mg/L) NA NA
Organic carbon (mg/L) NA NA
Calcium (mg/L) NA 22
Magnesium (mg/L) NA 3.8
Sodium (mg/L) NA 7.1
Chloride (mg/L) NA 2
Sulfate (mg/L) NA 6
Arsenic (µg/L) NA NA a Median values are listed.
b To convert °C to °F, multiply by 1.8, then add 32.
c NA = no data collected for this parameter.
Source: USGS (2012b).
4 5 TABLE 10.1.9.1-7 Groundwater Surface Elevations Relevant to the Proposed Antonito Southeast 6 SEZ as Revised 7
Station (USGS ID)
Parameter
370140105593701
370056105564301
370142105561101
370326105575501
Period of record 1982 1982 1981–1982 2001–2011
No. of observations 1 1 2 120
Surface elevation (ft)a 7,928 7,865 7,782 7,815
Well depth (ft) 333 337 230 65
Depth to water, median (ft) 262.08 293.74 216.18 56.61
Depth to water, range (ft) –b – 216.06–216.3 47.21–61.93
Depth to water, most recent observation (ft) 262.08 293.74 216.3 55.84
Distance to SEZ (mi)c 3 0 1 3 a To convert ft to m, multiply by 0.3048.
b A dash indicates only one data point at this site.
c To convert mi to km, multiply by 1.6093.
Source: USGS (2012b).

Fin
al S
ola
r PE
IS
10.1
-24
July 2
01
2
1
FIGURE 10.1.9.1-1 Water Features near the Proposed Antonito Southeast SEZ as Revised 2 3

Fin
al S
ola
r PE
IS
10.1
-25
July 2
01
2
1
FIGURE 10.1.9.1-2 Water Features within the Alamosa–Trinchera and Conejos Watersheds, Which Include the Proposed Antonito 2 Southeast SEZ as Revised 3
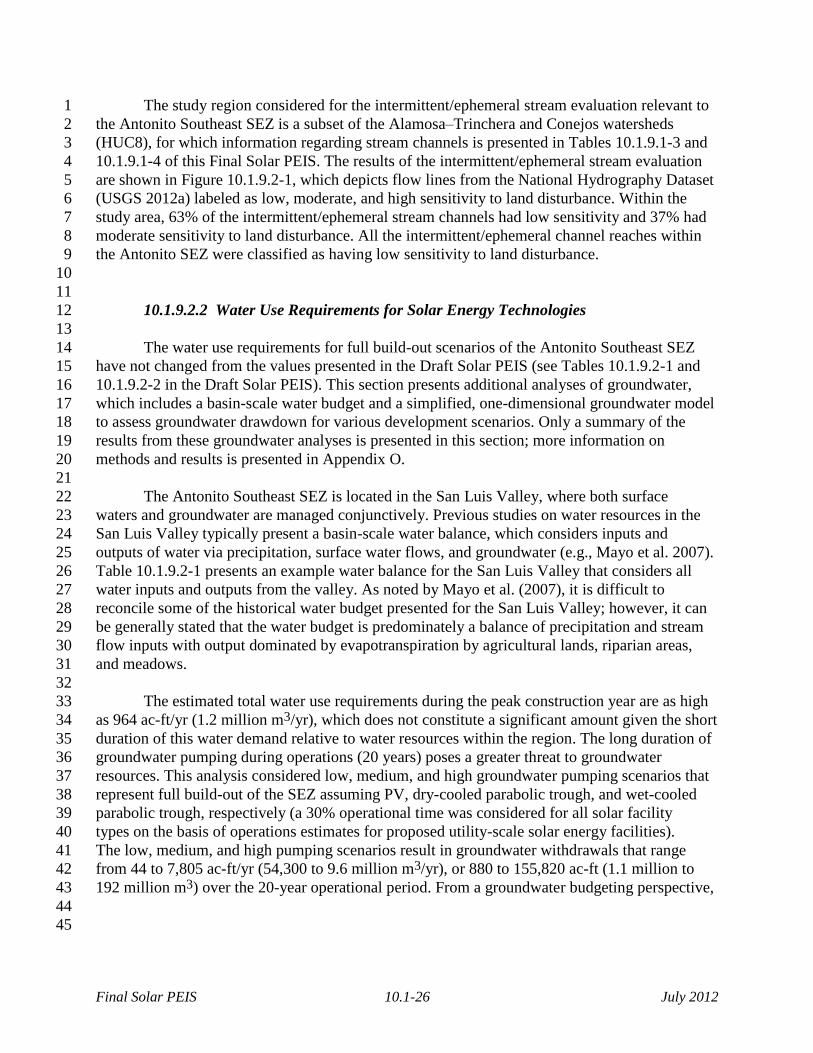
Final Solar PEIS 10.1-26 July 2012
The study region considered for the intermittent/ephemeral stream evaluation relevant to 1
the Antonito Southeast SEZ is a subset of the Alamosa–Trinchera and Conejos watersheds 2
(HUC8), for which information regarding stream channels is presented in Tables 10.1.9.1-3 and 3
10.1.9.1-4 of this Final Solar PEIS. The results of the intermittent/ephemeral stream evaluation 4
are shown in Figure 10.1.9.2-1, which depicts flow lines from the National Hydrography Dataset 5
(USGS 2012a) labeled as low, moderate, and high sensitivity to land disturbance. Within the 6
study area, 63% of the intermittent/ephemeral stream channels had low sensitivity and 37% had 7
moderate sensitivity to land disturbance. All the intermittent/ephemeral channel reaches within 8
the Antonito SEZ were classified as having low sensitivity to land disturbance. 9
10
11
10.1.9.2.2 Water Use Requirements for Solar Energy Technologies 12
13
The water use requirements for full build-out scenarios of the Antonito Southeast SEZ 14
have not changed from the values presented in the Draft Solar PEIS (see Tables 10.1.9.2-1 and 15
10.1.9.2-2 in the Draft Solar PEIS). This section presents additional analyses of groundwater, 16
which includes a basin-scale water budget and a simplified, one-dimensional groundwater model 17
to assess groundwater drawdown for various development scenarios. Only a summary of the 18
results from these groundwater analyses is presented in this section; more information on 19
methods and results is presented in Appendix O. 20
21
The Antonito Southeast SEZ is located in the San Luis Valley, where both surface 22
waters and groundwater are managed conjunctively. Previous studies on water resources in the 23
San Luis Valley typically present a basin-scale water balance, which considers inputs and 24
outputs of water via precipitation, surface water flows, and groundwater (e.g., Mayo et al. 2007). 25
Table 10.1.9.2-1 presents an example water balance for the San Luis Valley that considers all 26
water inputs and outputs from the valley. As noted by Mayo et al. (2007), it is difficult to 27
reconcile some of the historical water budget presented for the San Luis Valley; however, it can 28
be generally stated that the water budget is predominately a balance of precipitation and stream 29
flow inputs with output dominated by evapotranspiration by agricultural lands, riparian areas, 30
and meadows. 31
32
The estimated total water use requirements during the peak construction year are as high 33
as 964 ac-ft/yr (1.2 million m3/yr), which does not constitute a significant amount given the short 34
duration of this water demand relative to water resources within the region. The long duration of 35
groundwater pumping during operations (20 years) poses a greater threat to groundwater 36
resources. This analysis considered low, medium, and high groundwater pumping scenarios that 37
represent full build-out of the SEZ assuming PV, dry-cooled parabolic trough, and wet-cooled 38
parabolic trough, respectively (a 30% operational time was considered for all solar facility 39
types on the basis of operations estimates for proposed utility-scale solar energy facilities). 40
The low, medium, and high pumping scenarios result in groundwater withdrawals that range 41
from 44 to 7,805 ac-ft/yr (54,300 to 9.6 million m3/yr), or 880 to 155,820 ac-ft (1.1 million to 42
192 million m3) over the 20-year operational period. From a groundwater budgeting perspective, 43
44
45
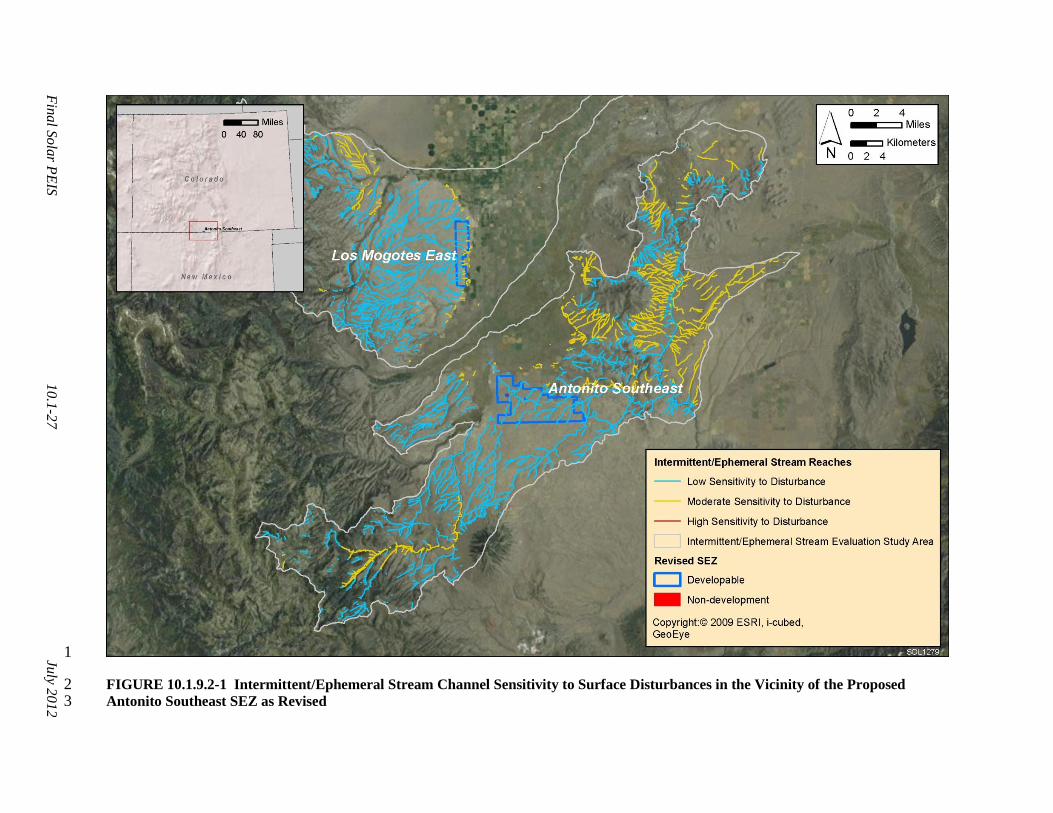
Fin
al S
ola
r PE
IS
10.1
-27
July 2
01
2
1
FIGURE 10.1.9.2-1 Intermittent/Ephemeral Stream Channel Sensitivity to Surface Disturbances in the Vicinity of the Proposed 2 Antonito Southeast SEZ as Revised 3

Final Solar PEIS 10.1-28 July 2012
TABLE 10.1.9.2-1 Water Budget for the San Luis 1 Valley, Which Includes the Proposed Antonito Southeast 2 SEZ as Revised 3
Process
Amount
Inputs
Precipitation (ac-ft/yr)a 1,086,356
Streams draining Sangre de Cristo Mts. (ac-ft/yr) 214,839
Streams draining San Juan Mts. (ac-ft/yr) 1,321,463
Groundwater underflow (ac-ft/yr) 721,535
Outputs
Evapotranspiration (ac-ft/yr) 2,245,676
Rio Grande discharge (ac-ft/yr) 332,392
Groundwater underflow (ac-ft/yr) 72,964
Groundwater pumping (ac-ft/yr)b 641,214
Groundwater storage
Storage (ac-ft) 2,026,783
a To convert ac-ft to m3, multiply by 1,234.
b Colorado DWR (2004).
Source: Mayo et al. (2007).
4
5
the high pumping scenario over the 20-year analysis period represents 8% of the groundwater 6
storage, and its annual pumping rate is on the order of 1.2% of the current annual groundwater 7
withdrawals in the basin. The amounts of estimated groundwater withdrawals for the low and 8
medium pumping scenarios do not represent significant quantities in comparison to the water 9
budget of the San Luis Valley. 10
11
Examining groundwater withdrawals with respect to a basin-scale water budget allows 12
for an assessment of potential impacts only to an order of magnitude approximation of basin-13
scale estimates of complex groundwater processes. In addition, a water budget approach ignores 14
the temporal and spatial components of how groundwater withdrawals affect groundwater 15
surface elevations, groundwater flow rates, and connectivity to surface water features such as 16
streams, wetlands, playas, and riparian vegetation. A one-dimensional groundwater modeling 17
analysis was performed to present a simplified depiction of the spatial and temporal effects of 18
groundwater withdrawals by examining groundwater drawdown in a radial direction around the 19
center of the SEZ for the low, medium, and high pumping scenarios considering pumping from 20
the upper unconfined aquifer and lower confined aquifer separately. A detailed discussion of the 21
groundwater modeling analysis is presented in Appendix O. It should be noted, however, that the 22
aquifer parameters used for the one-dimensional groundwater model (Table 10.1.9.2-2) represent 23
available literature data, and that the model aggregates these value ranges into a simplistic 24
representation of the aquifers. 25
26

Final Solar PEIS 10.1-29 July 2012
TABLE 10.1.9.2-2 Aquifer Characteristics and 1 Assumptions Used in the One-Dimensional Groundwater 2 Model for the Proposed Antonito Southeast SEZ as 3 Revised 4
Parameter
Valuea
Upper, unconfined aquifer
Aquifer type/conditions Unconfined/basin fill
Aquifer thickness (ft)b,c 100
Hydraulic conductivity (ft/day) 200
Transmissivity (ft2/day) 20,000
Specific yield 0.24
Lower, confined aquifer
Aquifer type/conditions Confined/basin fill
Aquifer thickness (ft) 500
Hydraulic conductivity (ft/day) 50
Transmissivity (ft2/day) 25,000
Storage coefficient 0.0000025
Upper and lower aquifers
Analysis period (yr) 20
High pumping scenario (ac-ft/yr)d 7,791
Medium pumping scenario (ac-ft/yr) 1,111
Low pumping scenario (ac-ft/yr) 44
a Values used for model in parentheses.
b Mayo et al. (2007).
c To convert ft to m, multiply by 0.3048.
d To convert ac-ft to m3, multiply by 1,234.
Source: Colorado DWR (2004).
5
6
Depth to groundwater in the unconfined aquifer is typically on the order of 50 ft (15 m) 7
in the vicinity of the Antonito Southeast SEZ, and the confined aquifer is on the order of 200 to 8
300 ft (61 to 91 m) below the surface. The one-dimensional groundwater modeling results for 9
the upper unconfined aquifer suggest that groundwater drawdown in the vicinity of the SEZ 10
(approximately a 2-mi [3.2-km] radius) ranges up to 60 ft (18 m) for the high pumping scenario, 11
up to 10 ft (3 m) for the medium pumping scenario, and less than 1 ft (0.3 m) for the low 12
pumping scenario (Figure 10.1.9.2-2). The extent of groundwater drawdown is primarily 13
restricted to the vicinity of the SEZ for all pumping scenarios, except the high pumping scenario, 14
which has 5 ft (1.5 m) of drawdown occurring 5 mi (8 km) away from the SEZ. The modeling 15
results for the lower confined aquifer suggest significant groundwater drawdown occurs for the 16
high pumping scenario, ranging from 30 to 80 ft (9 to 24 m) and extending more than 50 mi 17
(80 km) from the SEZ (Figure 10.1.9.2-2). The low and medium pumping scenarios have a much 18
lower impact on groundwater drawdown, from 0 to 10 ft (0 to 3 m). 19

Final Solar PEIS 10.1-30 July 2012
1
FIGURE 10.1.9.2-2 Estimated One-Dimensional Groundwater Drawdown in (a) Upper 2 Unconfined Aquifer and (b) Lower Confined Aquifer Resulting from High, Medium, and Low 3 Groundwater Pumping Scenarios over the 20-Year Operational Period at the Proposed Antonito 4 Southeast SEZ as Revised 5
6
7
8

Final Solar PEIS 10.1-31 July 2012
The comparison of water use requirements to the basin-scale water budget and the 1
one dimensional groundwater modeling gives mixed results. From a groundwater budgeting 2
perspective, the three pumping scenarios considered are not significant relative to the amounts 3
of water moved through the San Luis Valley. Groundwater modeling results suggest that the 4
high pumping scenario would have a localized groundwater drawdown effect if groundwater 5
were extracted from the unconfined aquifer, but a more significant impact extending more 6
than 50 mi (80 km) away from the SEZ if withdrawn from the confined aquifer. As stated 7
in Section 10.1.9.1, water management of the San Luis Valley is restrictive given its 8
overappropriated water rights and its obligations to maintain flows in the Rio Grande. 9
Ultimately, any proposed groundwater withdrawals for solar energy facilities would be 10
reviewed for impacts by the Colorado DWR and would be subject to the rules and court 11
decisions outlined in Case Numbers 06CV64 and 07CW52 (Colorado District Court 2010). 12
13
14
10.1.9.2.3 Off-Site Impacts: Roads and Transmission Lines 15
16
As stated in the Draft Solar PEIS, impacts associated with the construction of roads 17
and transmission lines primarily deal with water use demands for construction, water quality 18
concerns related to potential chemical spills, and land disturbance effects on the natural 19
hydrology. Water needed for transmission line construction activities (e.g., for soil compaction, 20
dust suppression, and potable supply for workers) could be trucked to the construction area from 21
an off-site source. If this occurred, water use impacts at the SEZ would be negligible. The Draft 22
Solar PEIS assessment of impacts on water resources from road and transmission line 23
construction remains valid. 24
25 26
10.1.9.2.4 Summary of Impacts on Water Resources 27
28
The additional information and analyses of water resources presented in this update agree 29
with the information provided in the Draft Solar PEIS, which indicates that the San Luis Valley 30
is a high-elevation basin, with predominately agricultural land use, and is the headwaters of the 31
Rio Grande, where surface water and groundwater processes are coupled and managed jointly. 32
Groundwater in the San Luis Valley is found both in the upper unconfined aquifer and lower 33
confined aquifer, and historical diversions of both surface water and groundwater for irrigation 34
have affected streamflows and groundwater levels. Water management plays a significant role 35
in the San Luis Valley as it pertains to ensuring river flows in the Rio Grande according to the 36
Rio Grande Compact, which is the primary responsibility of the Colorado DWR. 37
38
Disturbance to intermittent/ephemeral stream channels within the Antonito Southeast 39
SEZ should not have a significant impact on the critical functions of groundwater recharge, 40
sediment transport, flood conveyance, and ecological habitat, given the relatively small footprint 41
of the SEZ with respect to the study area, and the low sensitivity to land disturbances of 42
identified intermittent/ephemeral streams. Groundwater withdrawals pose the greatest threat to 43
water resources in the San Luis Valley. The water budgeting and groundwater modeling analyses 44
suggest that significant groundwater drawdown could occur both locally and off-site under the 45
high pumping scenario if groundwater were extracted from either the unconfined or confined 46

Final Solar PEIS 10.1-32 July 2012
aquifer. The low and medium pumping scenarios are preferable, because estimated groundwater 1
drawdown is much less. Ultimately, the process of transferring water rights established by the 2
Colorado DWR will determine how much water can be used by proposed solar facilities. As 3
stated in the Draft Solar PEIS, given the restrictive nature of water rights and the need for 4
augmentation water reserves, it would be difficult for any projects seeking an amount of water 5
more than 1,000 ac-ft/yr (1.2 million m3/yr) to be successful in obtaining the needed water rights 6
(McDermott 2010). 7
8
Predicting impacts associated with groundwater withdrawal is often difficult given the 9
heterogeneity of aquifer characteristics, the long time period between the onset of pumping and 10
its effects, and limited data. Another consideration relevant to the San Luis Valley is that the 11
transfer of water rights will likely come from the purchase of existing irrigation water rights, 12
which will result in a change in the location of the point of diversion and change land use 13
patterns in the basin, both of which can affect groundwater processes. One of the primary 14
mitigation measures to protect water resources is the implementation of long-term monitoring 15
and adaptive management (see Section A.2.4 of Appendix A). For groundwater, this requires a 16
combination of monitoring and modeling to fully identify the temporal and spatial extent of 17
potential impacts. Water management in the San Luis Valley relies on several water monitoring 18
and modeling tools developed by the Colorado DWR and the Colorado Water Conservation 19
Board (CWCB) that are a part of the Colorado’s Decision Support Systems (available at 20
http://cdss.state.co.us/Pages/CDSSHome.aspx), and these tools should be implemented with 21
respect to long-term monitoring and adaptive management strategies for solar energy 22
development occurring within the San Luis Valley. 23
24
25
10.1.9.3 SEZ-Specific Design Features and Design Feature Effectiveness 26
27
Required programmatic design features that would reduce impacts on surface water 28
and groundwater are described in Section A.2.2 of Appendix A of this Final Solar PEIS. 29
Implementing the programmatic design features will provide some protection of and reduce 30
impacts on water resources. 31
32
On the basis of impact analyses conducted for the Draft Solar PEIS, updates to those 33
analyses, and consideration of comments received as applicable, the following SEZ-specific 34
design feature has been identified: 35
36
• Groundwater analyses suggest full build-out of wet-cooled technologies is 37
not feasible; for mixed-technology development scenarios, any proposed 38
wet-cooled projects would have to reduce water requirements to less than 39
approximately 1,000 ac-ft/yr (1.2 million m3/yr) in order to secure water 40
rights and comply with water management in the San Luis Valley. 41
42
The need for additional SEZ-specific design features will be identified through the 43
process of preparing parcels for competitive offer and subsequent project-specific analysis. 44
45
46

Final Solar PEIS 10.1-33 July 2012
10.1.10 Vegetation 1
2
3
10.1.10.1 Affected Environment 4
5
Several wetlands mapped by the National Wetlands Inventory (NWI) within the 6
proposed Antonito Southeast SEZ, with a total of about 17 acres (0.07 km2), were identified 7
as non-development areas in the Supplement to the Draft Solar PEIS. 8
9
As presented in Section 10.1.10.1 of the Draft Solar PEIS, 7 cover types were identified 10
within the area of the proposed SEZ, while 26 cover types were identified within the area of 11
indirect effects, including the previously assumed transmission line corridor, and within 5 mi 12
(8 km) of the SEZ boundary. For this updated assessment, a specifically located hypothetical 13
transmission line is no longer being assumed (see Section 10.1.23 for an updated transmission 14
assessment for this SEZ). Sensitive habitats on the SEZ include wetlands and ephemeral washes. 15
Figure 10.1.10.1-1 shows the cover types within the affected area of the Antonito Southeast SEZ 16
as revised. 17
18
19
10.1.10.2 Impacts 20
21
As presented the Draft Solar PEIS, the construction of solar energy facilities within the 22
proposed Antonito Southeast SEZ would result in direct impacts on plant communities because 23
of the removal of vegetation within the facility footprint during land-clearing and land-grading 24
operations. With full development of the SEZ, approximately 80% of the SEZ would be expected 25
to be cleared. Taking the newly identified non-development area into account, approximately 26
7,770 acres (31.4 km2) would be cleared. 27
28
Overall impact magnitude categories were based on professional judgment and include 29
(1) small: a relatively small proportion ( 1%) of the cover type within the SEZ region would be 30
lost; (2) moderate: an intermediate proportion (>1 but 10%) of a cover type would be lost; and 31
(3) large: >10% of a cover type would be lost. 32
33
34
10.1.10.2.1 Impacts on Native Species 35
36
The analysis presented in the Draft Solar PEIS for the original Antonito Southeast SEZ 37
developable area indicated that development would result in a moderate impact on three land 38
cover types and a small impact on all other land cover types occurring within the SEZ 39
(Table 10.1.10.1-1 in the Draft Solar PEIS). Development within the revised Antonito Southeast 40
SEZ could still directly affect all the cover types evaluated in the Draft Solar PEIS; the reduction 41
in the developable area would result in slightly reduced impact levels on some cover types in the 42
affected area, but the impact magnitudes on all land cover types would remain unchanged 43
compared to original estimates in the Draft Solar PEIS. 44
45
46
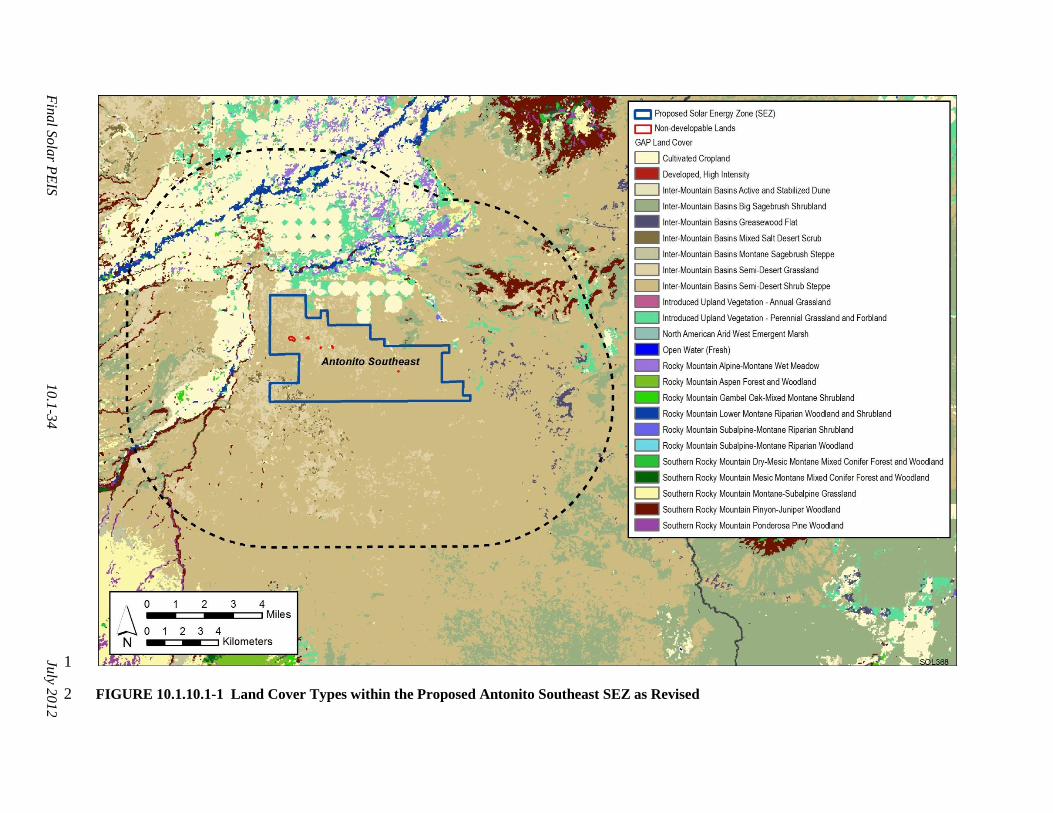
Fin
al S
ola
r PE
IS
10.1
-34
July 2
01
2
1
FIGURE 10.1.10.1-1 Land Cover Types within the Proposed Antonito Southeast SEZ as Revised 2

Final Solar PEIS 10.1-35 July 2012
Direct impacts on the NWI-mapped wetlands, such as Alta Lake, that occur within the 1
non-developable portions of the SEZ, or the previously identified transmission corridor, would 2
not occur. However, direct impacts on unmapped wetlands within the remaining developable 3
areas of the SEZ could still occur. In addition, indirect impacts on wetlands within or near the 4
SEZ, as described in the Draft Solar PEIS, could occur. 5
6
7
10.1.10.2.2 Impacts from Noxious Weeds and Invasive Plant Species 8
9
As presented the Draft Solar PEIS, land disturbance from project activities and indirect 10
effects of construction and operation within the Antonito Southeast SEZ could potentially result 11
in the establishment or expansion of noxious weeds and invasive species populations, potentially 12
including those species listed in Section 10.1.10.1 in the Draft Solar PEIS. Impacts such as 13
reduced restoration success and possible widespread habitat degradation could still occur. 14
15
16
10.1.10.3 SEZ-Specific Design Features and Design Feature Effectiveness 17
18
Required programmatic design features are described in Section A.2.2 of Appendix A 19
of this Final Solar PEIS. SEZ-specific species and habitats will determine how programmatic 20
design features are applied, for example: 21
22
• All wetland and dry wash habitats within the SEZ shall be avoided to the 23
extent practicable, and any impacts minimized and/or mitigated in 24
consultation with appropriate agencies. A buffer area shall be maintained 25
around wetlands, dry washes, and riparian areas to reduce the potential for 26
impacts on wetlands on or near the SEZ and on riparian habitats associated 27
with the Rio San Antonio, Rio de los Pinos, Conejos River, and Cove Lake 28
Reservoir. 29
30
• Appropriate engineering controls shall be used to minimize impacts on 31
wetland, dry wash, and riparian habitats, including downstream occurrences, 32
resulting from surface water runoff, erosion, sedimentation, altered hydrology, 33
accidental spills, or fugitive dust deposition to these habitats. Appropriate 34
buffers and engineering controls will be determined through agency 35
consultation. 36
37
• Groundwater withdrawals shall be limited to reduce the potential for indirect 38
impacts on wetland habitats along the Rio San Antonio or the Conejos River, 39
or on springs associated with groundwater discharge. 40
41
It is anticipated that implementation of these programmatic design features will reduce a 42
high potential for impacts from invasive species and impacts on wetlands, springs, dry washes, 43
and riparian habitats to a minimal potential for impact. Residual impacts on wetlands could result 44
from remaining groundwater withdrawal and so forth; however, it is anticipated that these 45
impacts would be avoided in the majority of instances. 46

Final Solar PEIS 10.1-36 July 2012
On the basis of impact analyses conducted for the Draft Solar PEIS and consideration of 1
comments received as applicable, no SEZ-specific design features for vegetation have been 2
identified. Some SEZ-specific design features may be identified through the process of preparing 3
parcels for competitive offer and subsequent project-specific analysis. 4
5
6
10.1.11 Wildlife and Aquatic Biota 7
8
For the assessment of potential impacts on wildlife and aquatic biota, overall impact 9
magnitude categories were based on professional judgment and include (1) small: a relatively 10
small proportion ( 1%) of the species’ habitat within the SEZ region would be lost; 11
(2) moderate: an intermediate proportion (>1 but 10%) of the species’ habitat would be lost; 12
and (3) large: >10% of the species’ habitat would be lost. 13
14
15
10.1.11.1 Amphibians and Reptiles 16 17 18
10.1.11.1.1 Affected Environment 19
20
As presented in the Draft Solar PEIS, amphibian and reptile species expected to occur 21
within the Antonito Southeast SEZ include the Woodhouse’s toad (Bufo woodhousii), fence 22
lizard (Sceloporus undulatus), gopher snake (Pituophis catenifer), western rattlesnake (Crotalus 23
viridis), and western terrestrial garter snake (Thamnophis elegans). The potential for these 24
species to occur in the SEZ has not changed, because the boundaries of the Antonito Southeast 25
SEZ have not changed. 26 27 28
10.1.11.1.2 Impacts 29
30
As presented in the Draft Solar PEIS, solar energy development within the Antonito 31
Southeast SEZ could affect potentially suitable habitats for several amphibian and reptile 32
species. The analysis presented in the Draft Solar PEIS indicated that development would result 33
in a small overall impact on representative amphibian and reptile species (Table 10.1.11.1-1 in 34
the Draft Solar PEIS). Development within the Antonito Southeast SEZ could still affect the 35
same species evaluated in the Draft Solar PEIS; however, the reduction in the developable 36
wetland and lake areas would, in particular, minimize potential impacts on amphibians. 37
Non-development in the wetland and lake areas would result in reduced (and still small) impact 38
levels on amphibians and reptiles in the Antonito Southeast SEZ compared to original estimates 39
in the Draft Solar PEIS. 40 41 42
10.1.11.1.3 SEZ-Specific Design Features and Design Feature Effectiveness 43
44
Required programmatic design features that will reduce impacts on amphibian and 45
reptile species are described in Section A.2.2 of Appendix A of this Final Solar PEIS. With 46

Final Solar PEIS 10.1-37 July 2012
implementation of required programmatic design features, impacts on amphibian and reptile 1
species would be small. 2
3
Because of the change in the developable area within the SEZ and the elimination of 4
consideration of a specific route for a new transmission line, the SEZ-specific design features 5
identified in Section 10.1.11.1.3 of the Draft Solar PEIS (i.e., Alta Lake and surrounding 6
wetlands should be avoided; engineering controls should be used to minimize impacts on aquatic 7
habitats) are no longer applicable. On the basis of impact analyses conducted for the Draft Solar 8
PEIS and consideration of comments received as applicable, no SEZ-specific design features 9
for reptiles and amphibians have been identified. Some SEZ-specific design features may be 10
identified through the process of preparing parcels for competitive offer and subsequent project-11
specific analysis. 12
13
14
10.1.11.2 Birds 15
16
17
10.1.11.2.1 Affected Environment 18
19
As presented in the Draft Solar PEIS, a large number of bird species could occur or have 20
potentially suitable habitat within the affected area of the proposed Antonito Southeast SEZ. 21
Representative bird species identified in the Draft Solar PEIS included the killdeer (Charadrius 22
vociferus), Brewer’s blackbird (Euphagus cyanocephalus), Brewer’s sparrow (Spizella breweri), 23
common nighthawk (Chordeiles minor), horned lark (Eremophila alpestris), vesper sparrow 24
(Pooecetes gramineus), western meadowlark (Sturnella neglecta), the American kestrel (Falco 25
sparverius), ferruginous hawk (Buteo regalis), golden eagle (Aquila chrysaetos), red-tailed hawk 26
(Buteo jamaicensis), short-eared owl (Asio flammeus), Swainson’s hawk (Buteo swainsoni), 27
turkey vulture (Cathartes aura), and the mourning dove (Zenaida macroura). The potential for 28
these species to occur in the SEZ has not changed because the boundaries of the Antonito 29
Southeast SEZ have not changed. 30
31
32
10.1.11.2.2 Impacts 33
34
As presented in the Draft Solar PEIS, solar energy development within the Antonito 35
Southeast SEZ could affect potentially suitable habitats of bird species. The analysis presented in 36
the Draft Solar PES for the original Antonito Southeast SEZ indicated that development would 37
result in a small overall impact on the representative bird species. Non-development in the 38
wetland and lake areas would result in reduced (and still small) impact levels on birds in the 39
Antonito Southeast SEZ compared to original estimates in the Draft Solar PEIS. The reduction in 40
the developable wetland and lake areas would, in particular, minimize potential impacts on the 41
killdeer. 42
43
44
Final Solar PEIS 10.1-38 July 2012
10.1.11.2.3 SEZ-Specific Design Features and Design Feature Effectiveness 1
2
Required programmatic design features that would reduce impacts on bird species are 3
described in Section A.2.2 of Appendix A of this Final Solar PEIS. With the implementation of 4
required programmatic design features, impacts on bird species would be reduced. 5
6
On the basis of impact analyses conducted for the Draft Solar PEIS, and consideration of 7
comments received as applicable, the following SEZ-specific design feature for birds has been 8
identified: 9
10
• If present, prairie dog colonies (which could provide habitat or a food source 11
for some raptor species) should be avoided to the extent practicable. 12
13
If SEZ-specific design features are implemented in addition to required programmatic 14
design features, it is anticipated that impacts on bird species would be small. The need for 15
additional SEZ-specific design features will be identified through the process of preparing 16
parcels for competitive offer and subsequent project-specific analysis. 17
18
19
10.1.11.3 Mammals 20
21
22
10.1.11.3.1 Affected Environment 23
24
As presented in the Draft Solar PEIS, a large number of mammal species were identified 25
that could occur or have potentially suitable habitat within the affected area of the proposed 26
Antonito Southeast SEZ. Representative mammal species identified in the Draft Solar PEIS 27
included (1) big game species: the American black bear (Ursus americanus), bighorn sheep 28
(Ovis canadensis), cougar (Puma concolor), elk (Cervis canadensis), mule deer (Odocoileus 29
hemionus), and pronghorn (Antilocapra americana); (2) furbearers and small game species: 30
the American badger (Taxidea taxus), coyote (Canis latrans), desert cottontail (Sylvilagus 31
audubonii), red fox (Vulpes vulpes), striped skunk (Mephitis mephitis), and white-tailed 32
jackrabbit (Lepus townsendii); and (3) small nongame species: the big brown bat (Eptesicus 33
fuscus), deer mouse (Peromyscus maniculatus), least chipmunk (Tamias minimus), little brown 34
myotis (Myotis lucifugus), northern pocket gopher (Thomomys talpoides), Ord’s kangaroo rat 35
(Dipodomys ordii), thirteen-lined ground squirrel (Spermophilus tridecemlineatus), and western 36
small-footed myotis (Myotis ciliolabrum). The potential for these species to occur in the SEZ has 37
not changed because the boundaries of the Antonito Southeast SEZ have not changed. 38
39
40
10.1.11.3.2 Impacts 41
42
As presented in the Draft Solar PEIS, solar energy development within the Antonito 43
Southeast SEZ could affect potentially suitable habitats of mammal species. The analysis 44
presented in the Draft Solar PEIS for the original Antonito Southeast SEZ indicated that 45
development would result in a small overall impact on all representative mammal species 46

Final Solar PEIS 10.1-39 July 2012
analyzed (Table 10.1.11.3-1 in the Draft Solar PEIS). Development within the Antonito 1
Southeast SEZ could still affect the same representative mammal species evaluated in the Draft 2
Solar PEIS; however, the reduction in the developable wetland and lake areas would result in 3
slightly reduced (and still small) impact levels compared to original estimates in the Draft Solar 4
PEIS. Based on mapped activity areas, no notable changes in the magnitude of impacts on elk or 5
mule deer activity areas result from reconfigured solar energy development within the Antonito 6
Southeast SEZ. This includes a moderate impact on elk severe winter range and pronghorn 7
summer concentration area (Tables 10.1.11.3-3 and 10.1.11.3-5 in the Draft Solar PEIS, 8
respectively). Impacts on all other elk, mule deer, and pronghorn activity areas would remain as 9
small to none (see Tables 10.1.11.3-3 through 10.1.11.3-5 in the Draft Solar PEIS). 10
11
12
10.1.11.3.3 SEZ-Specific Design Features and Design Feature Effectiveness 13
14
Required programmatic design features that would reduce impacts on mammal species 15
are described in Section A.2.2 of Appendix A of this Final Solar PEIS. SEZ-specific resources 16
and conditions will determine how programmatic design features are applied, for example: 17
18
• Prairie dog colonies shall be avoided to the extent practicable to reduce 19
impacts on species such as desert cottontail and thirteen-lined ground squirrel. 20
21
If the programmatic design features are implemented, impacts on mammal species will 22
be reduced. On the basis of impact analyses conducted for the Draft Solar PEIS, updates to the 23
analyses due to changes to the SEZ boundaries, and consideration of comments received as 24
applicable, the following SEZ-specific design features for mammals have been identified: 25
26
• Construction should be curtailed during winter when big game species are 27
present, particularly within elk severe winter range. 28
29
• Disturbance near the elk and mule deer resident population areas should be 30
avoided. 31
32
• Where big game winter ranges intersect or are within close proximity to the 33
SEZ, use of motorized vehicles and other human disturbances should be 34
controlled (e.g., through road closures). 35
36
• Development in the 253-acre (1-km2) portion of the SEZ that overlaps the 37
pronghorn summer concentration area should be avoided. 38
39
If these SEZ-specific design features are implemented in addition to required 40
programmatic design features, impacts on mammal species would be small. The need for 41
additional SEZ-specific design features will be identified through the process of preparing 42
parcels for competitive offer and subsequent project-specific analysis. 43
44
45

Final Solar PEIS 10.1-40 July 2012
10.1.11.4 Aquatic Biota 1
2
3
10.1.11.4.1 Affected Environment 4
5
Ephemeral washes and Alta Lake and its associated wetlands are the primary surface 6
water features on the Antonito Southeast SEZ. Because the boundaries of the Antonito Southeast 7
SEZ given in the Draft Solar PEIS have not changed, the amount of surface water features within 8
the area of direct and indirect effects is still valid. The following updates to the Draft Solar PEIS 9
have been identified: 10
11
• The wetlands in the SEZ (including Alta Lake) have now been identified as 12
non-development areas. 13
14
• A specific route for a new transmission line corridor is no longer assumed. 15
16
Aquatic biota present in the surface water features of the Antonito Southeast SEZ have 17
not been characterized. As stated in Appendix C of the Supplement to the Draft Solar PEIS, site 18
surveys can be conducted at the project-specific level to characterize aquatic biota, if present. 19
20
21
10.1.11.4.2 Impacts 22
23
The types of impacts from the development of utility-scale solar energy facilities that 24
could affect aquatic habitats and biota are identified in Section 5.10.3 of the Draft Solar PEIS 25
and this Final Solar PEIS. Aquatic habitats present on or near the Antonito Southeast SEZ could 26
be affected by solar energy development in a number of ways, including (1) direct disturbance, 27
(2) deposition of sediments, (3) changes in water quantity, and (4) degradation of water quality. 28
The impact assessment provided in the Draft Solar PEIS remains valid, with the following 29
update: 30
31
• Because Alta Lake and other wetlands in the SEZ have been identified as non-32
development areas, direct impacts on them would not occur. However, as 33
described in the Draft Solar PEIS, the wetlands could be affected indirectly by 34
solar development activities within the SEZ. 35
36
37
10.1.11.4.3 SEZ-Specific Design Features and Design Feature Effectiveness 38
39
Required programmatic design features applicable to aquatic biota are described in 40
Section A.2.2 of Appendix A of this Final Solar PEIS. SEZ-specific resources and conditions 41
will guide how programmatic design features are applied, for example: 42
43
• Undisturbed buffer areas and sediment and erosion controls shall be 44
maintained around Alta Lake and associated wetlands in the western portion 45
of the SEZ. 46

Final Solar PEIS 10.1-41 July 2012
• The use of heavy machinery and pesticides shall be avoided within the 1
immediate catchment basins for Alta Lake and its associated wetlands. 2
3
• Development shall avoid any additional wetlands identified during future site-4
specific fieldwork. 5
6
It is anticipated that implementation of the programmatic design features will reduce 7
impacts on aquatic biota, and if the utilization of water from groundwater or surface water 8
sources is adequately controlled to maintain sufficient water levels in nearby aquatic habitats, 9
the potential impacts on aquatic biota from solar energy development at the Antonito Southeast 10
SEZ would be small. 11
12
On the basis of impact analyses conducted for the Draft Solar PEIS and consideration of 13
comments received as applicable, no SEZ-specific design features for aquatic biota have been 14
identified. Some SEZ-specific design features may be identified through the process of preparing 15
parcels for competitive offer and subsequent project-specific analysis. 16
17
18
10.1.12 Special Status Species 19
20
21
10.1.12.1 Affected Environment 22
23
Thirty-eight special status species that could occur or have potentially suitable habitat 24
within the affected area of the proposed Antonito Southeast SEZ were identified in the Draft 25
Solar PEIS. Since publication of the Draft Solar PEIS, there have been no revisions to the 26
boundaries of the proposed SEZ; however, approximately 17 acres (0.07 km2) of wetland and 27
playa habitat within the SEZ have been identified as non-development areas. Exclusion of these 28
wetland areas from development does not reduce the number of species that could be affected by 29
development on the Antonito Southeast SEZ. 30
31
Since publication of the Draft Solar PEIS, three additional special status species 32
(Mexican spotted owl [Strix occidentalis lucida], western yellow-billed cuckoo [Coccyzus 33
americanus occidentalis], and fringed myotis [Myotis thysanodes]) have been identified that 34
could occur in the affected area based on known occurrences and the presence of potentially 35
suitable habitat. These three additional species are discussed in the remainder of this section. 36
37
Following the publication of the Draft Solar PEIS, the BLM conducted field surveys for 38
special status bat species, as well as for Gunnison prairie dog (Cynomys gunnisoni) and western 39
burrowing owl (Athene cunicularia), in the Antonito Southeast SEZ. Surveys for bat species 40
were conducted in the SEZ by using passive and active acoustic monitoring techniques at various 41
times between June 16, 2011, and October 15, 2011 (Rodriguez 2011). The big free-tailed bat 42
(Nyctinomops macrotis) was the only special status bat species recorded on the SEZ. However, 43
the documented presence of the fringed myotis (Myotis thysanodes) in the DeTilla Gulch SEZ 44
suggests that the fringed myotis could occur throughout the San Luis Valley and potentially 45

Final Solar PEIS 10.1-42 July 2012
within the Antonito Southeast SEZ. No roosting habitat for this species was observed on the SEZ 1
(Rodriguez 2011). 2
3
Field surveys for Gunnison prairie dog and western burrowing owl were conducted 4
between June 6, 2011, and September 9, 2011 (Garcia and Harvey 2011). Gunnison prairie dog 5
activity was noted in five distinct areas in the western and northern portions of the SEZ within a 6
total approximate area of 592.4 acres (2.4 km2). Burrowing owls were not recorded on the SEZ 7
during the field survey. However, burrowing owls may be associated with prairie dog colonies 8
on private land west of the SEZ and may utilize the SEZ (particularly the western portion of the 9
SEZ) for nesting and/or foraging. A single burrowing owl was seen on the ground approximately 10
5 mi (8 km) east of the SEZ on June 21, 2011 (Garcia and Harvey 2011). 11
12
13
Mexican Spotted Owl. The Mexican spotted owl was listed as a threatened species under 14
the ESA on March 16, 1993 (USFWS 1993). Critical habitat for this species was designated on 15
June 6, 1995 (USFWS 1995), but several court rulings resulted in the U.S. Fish and Wildlife 16
Service (USFWS) removing the critical habitat designation on March 25, 1998 (USFWS 1998). 17
In March 2000, the USFWS was ordered by the courts to propose critical habitat; this resulted 18
in the current designation that includes 4.6 million acres (0.02 km2) in Arizona, Colorado, 19
New Mexico, and Utah on federal lands (USFWS 2004). A recovery plan for the Mexican 20
spotted owl was published in December 1995 and later revised in June 2011 (USFWS 2011). 21
At the time of federal listing in 1993, the total population of Mexican spotted owls was 22
estimated at 2,100. 23
24
The Mexican spotted owl occurs from southern British Columbia, Canada, to central 25
Mexico. The primary habitat of the spotted owl is steep rocky canyons, although mature 26
coniferous forests are also important habitat. The spotted owl occupies closed canopy forests in 27
steep canyons with uneven-aged tree stands with a high basal area, and an abundance of snags 28
and downed logs (NatureServe 2010; USFWS 2011). 29
30
The Mexican spotted owl feeds mainly on rodents but also consumes rabbits, birds, 31
reptiles, and insects. Nest sites are in trees (typically those with broken tops), tree trunk cavities, 32
and cliffs along canyon walls. Breeding takes place in the spring (March) with egg-laying in late 33
March or early April. After a 30-day incubation period, hatching occurs and fledging takes place 34
in 4 to 5 weeks. The young depend on the adults for food in the summer and eventually disperse 35
from the nesting area in the fall (NatureServe 2010; USFWS 2011). 36
37
The Mexican spotted owl is known to occur in Conejos County, Colorado, and 38
potentially suitable habitat for this species may occur in the affected area of the Antonito 39
Southeast SEZ. Potentially suitable habitat for this species does not occur on the SEZ. However, 40
the SWReGAP habitat suitability model for the spotted owl identified approximately 4,900 acres 41
(20 km2) of potentially suitable habitat within the area of indirect effects (Figure 10.1.12.1-1; 42
Table 10.1.12.1-1). Designated critical habitat for the Mexican spotted owl does not occur in the 43
affected area. 44
45
46

Fin
al S
ola
r PE
IS
10.1
-43
July 2
01
2
1
FIGURE 10.1.12.1-1 Developable Area for the Proposed Antonito Southeast SEZ as Revised and Distribution of 2 Potentially Suitable Habitat for the Mexican Spotted Owl and Western Yellow-Billed Cuckoo 3
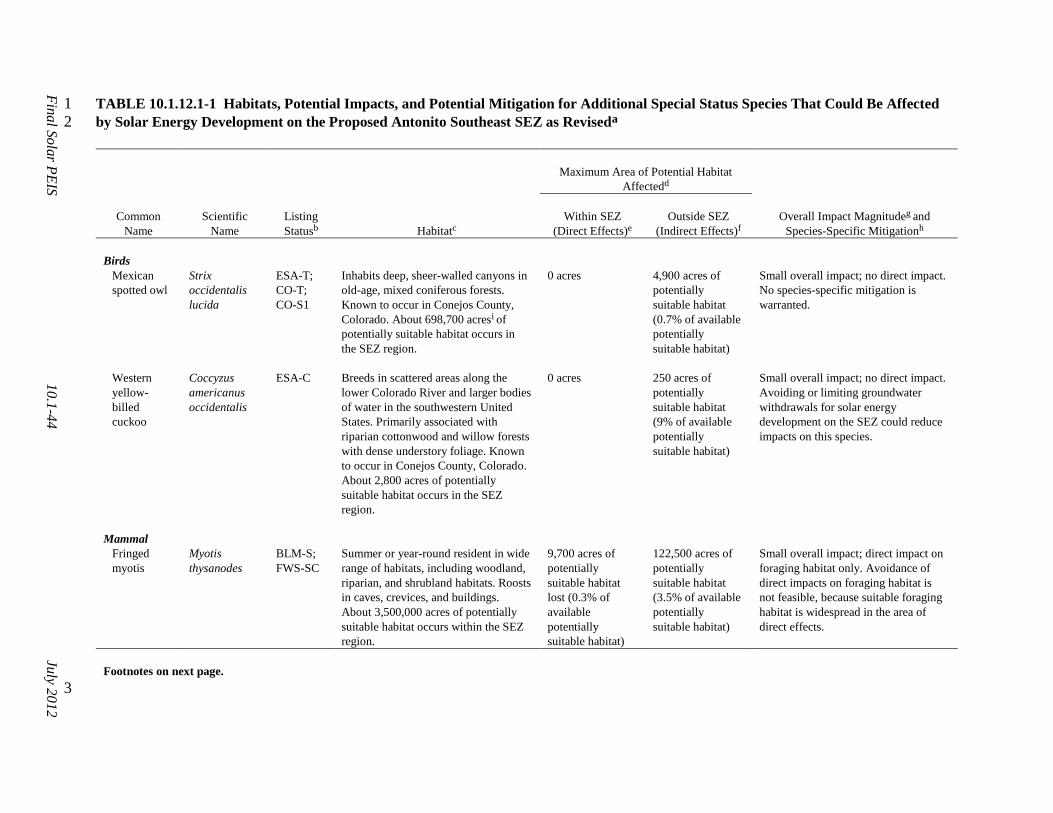
Fin
al S
ola
r PE
IS
10.1
-44
July 2
01
2
TABLE 10.1.12.1-1 Habitats, Potential Impacts, and Potential Mitigation for Additional Special Status Species That Could Be Affected 1
by Solar Energy Development on the Proposed Antonito Southeast SEZ as Reviseda 2
Maximum Area of Potential Habitat
Affectedd
Common
Name
Scientific
Name
Listing
Statusb
Habitatc
Within SEZ
(Direct Effects)e
Outside SEZ
(Indirect Effects)f
Overall Impact Magnitudeg and
Species-Specific Mitigationh
Birds
Mexican
spotted owl
Strix
occidentalis
lucida
ESA-T;
CO-T;
CO-S1
Inhabits deep, sheer-walled canyons in
old-age, mixed coniferous forests.
Known to occur in Conejos County,
Colorado. About 698,700 acresi of
potentially suitable habitat occurs in
the SEZ region.
0 acres 4,900 acres of
potentially
suitable habitat
(0.7% of available
potentially
suitable habitat)
Small overall impact; no direct impact.
No species-specific mitigation is
warranted.
Western
yellow-
billed
cuckoo
Coccyzus
americanus
occidentalis
ESA-C Breeds in scattered areas along the
lower Colorado River and larger bodies
of water in the southwestern United
States. Primarily associated with
riparian cottonwood and willow forests
with dense understory foliage. Known
to occur in Conejos County, Colorado.
About 2,800 acres of potentially
suitable habitat occurs in the SEZ
region.
0 acres 250 acres of
potentially
suitable habitat
(9% of available
potentially
suitable habitat)
Small overall impact; no direct impact.
Avoiding or limiting groundwater
withdrawals for solar energy
development on the SEZ could reduce
impacts on this species.
Mammal
Fringed
myotis
Myotis
thysanodes
BLM-S;
FWS-SC
Summer or year-round resident in wide
range of habitats, including woodland,
riparian, and shrubland habitats. Roosts
in caves, crevices, and buildings.
About 3,500,000 acres of potentially
suitable habitat occurs within the SEZ
region.
9,700 acres of
potentially
suitable habitat
lost (0.3% of
available
potentially
suitable habitat)
122,500 acres of
potentially
suitable habitat
(3.5% of available
potentially
suitable habitat)
Small overall impact; direct impact on
foraging habitat only. Avoidance of
direct impacts on foraging habitat is
not feasible, because suitable foraging
habitat is widespread in the area of
direct effects.
Footnotes on next page.
3
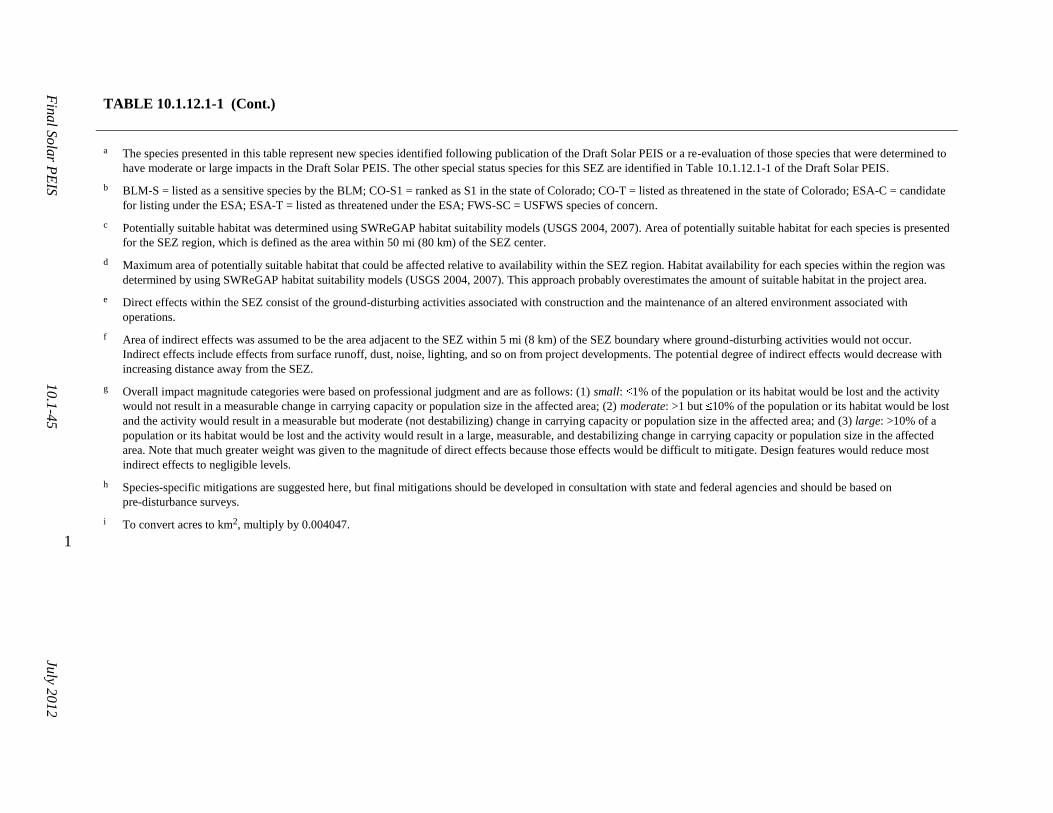
Fin
al S
ola
r PE
IS
10.1
-45
July 2
01
2
TABLE 10.1.12.1-1 (Cont.)
a The species presented in this table represent new species identified following publication of the Draft Solar PEIS or a re-evaluation of those species that were determined to
have moderate or large impacts in the Draft Solar PEIS. The other special status species for this SEZ are identified in Table 10.1.12.1-1 of the Draft Solar PEIS.
b BLM-S = listed as a sensitive species by the BLM; CO-S1 = ranked as S1 in the state of Colorado; CO-T = listed as threatened in the state of Colorado; ESA-C = candidate
for listing under the ESA; ESA-T = listed as threatened under the ESA; FWS-SC = USFWS species of concern.
c Potentially suitable habitat was determined using SWReGAP habitat suitability models (USGS 2004, 2007). Area of potentially suitable habitat for each species is presented
for the SEZ region, which is defined as the area within 50 mi (80 km) of the SEZ center.
d Maximum area of potentially suitable habitat that could be affected relative to availability within the SEZ region. Habitat availability for each species within the region was
determined by using SWReGAP habitat suitability models (USGS 2004, 2007). This approach probably overestimates the amount of suitable habitat in the project area.
e Direct effects within the SEZ consist of the ground-disturbing activities associated with construction and the maintenance of an altered environment associated with
operations.
f Area of indirect effects was assumed to be the area adjacent to the SEZ within 5 mi (8 km) of the SEZ boundary where ground-disturbing activities would not occur.
Indirect effects include effects from surface runoff, dust, noise, lighting, and so on from project developments. The potential degree of indirect effects would decrease with
increasing distance away from the SEZ.
g Overall impact magnitude categories were based on professional judgment and are as follows: (1) small: 1% of the population or its habitat would be lost and the activity
would not result in a measurable change in carrying capacity or population size in the affected area; (2) moderate: >1 but 10% of the population or its habitat would be lost
and the activity would result in a measurable but moderate (not destabilizing) change in carrying capacity or population size in the affected area; and (3) large: >10% of a
population or its habitat would be lost and the activity would result in a large, measurable, and destabilizing change in carrying capacity or population size in the affected
area. Note that much greater weight was given to the magnitude of direct effects because those effects would be difficult to mitigate. Design features would reduce most
indirect effects to negligible levels.
h Species-specific mitigations are suggested here, but final mitigations should be developed in consultation with state and federal agencies and should be based on
pre-disturbance surveys.
i To convert acres to km2, multiply by 0.004047.
1

Final Solar PEIS 10.1-46 July 2012
Western Yellow-Billed Cuckoo. The western yellow-billed cuckoo is a candidate for 1
listing under the ESA and has the potential to occur in the affected area. The western yellow-2
billed cuckoo is a neotropical migrant bird that inhabits large riparian woodlands in the western 3
United States. This species is not known to occur in Conejos County, Colorado, but it has been 4
documented in nearby counties, such as La Plata and Rio Grande Counties, Colorado. Although 5
the SWReGAP habitat suitability model for the western yellow-billed cuckoo does not identify 6
any suitable habitat for this species within the SEZ, approximately 250 acres (1 km2) of 7
potentially suitable riparian habitat occurs within the area of indirect effects along the Conejos 8
River (Figure 10.1.12.1-1; Table 10.1.12.1-1). Potentially suitable habitat may also occur in the 9
area of indirect effects along the Rio San Antonio and Cove Lake Reservoir. Additional basic 10
information on life history, habitat needs, and threats to populations of this species is provided in 11
Appendix J. 12
13
14
Fringed Myotis. The fringed myotis is a year-round resident in western Colorado, 15
where it forages in a variety of habitats including ponderosa pine woodlands, greasewood flats, 16
oakbrush, and shrublands. This species was not evaluated for the Antonito Southeast SEZ in the 17
Draft Solar PEIS. The species roosts in caves, rock crevices, or buildings. The fringed myotis 18
was not recorded on the Antonito Southeast SEZ during field surveys conducted in 2011 19
(Rodriguez 2011). However, fringed myotis was recorded on the DeTilla Gulch SEZ, suggesting 20
that the species could occur elsewhere in the San Luis Valley and potentially within the Antonito 21
Southeast SEZ. According to the SWReGAP habitat suitability model, potentially suitable 22
foraging habitat for the fringed myotis could occur on the SEZ and throughout portions of the 23
area of indirect effects (Table 10.1.12.1-1). There is no potentially suitable roosting habitat 24
(rocky cliffs and outcrops) in the area of direct effects. 25
26
27
10.1.12.2 Impacts 28
29
Overall impact magnitude categories were based on professional judgment and include 30
(1) small: a relatively small proportion ( 1%) of the special status species’ habitat within the 31
SEZ region would be lost; (2) moderate: an intermediate proportion (>1 but 10%) of the special 32
status species’ habitat would be lost; and (3) large: >10% of the special status species’ habitat 33
would be lost. 34
35
As presented in the Draft Solar PEIS, solar energy development within the Antonito 36
Southeast SEZ could affect potentially suitable habitats of special status species. The analysis 37
presented in the Draft Solar PEIS for the original Antonito Southeast SEZ developable area 38
indicated that development would result in no impact or a small overall impact on all special 39
status species (Table 10.1.12.1-1 in the Draft Solar PEIS). Because the boundaries of the 40
Antonito Southeast SEZ have not changed, development within the SEZ could still affect the 41
same 38 species evaluated in the Draft Solar PEIS; however, the reduction in the developable 42
area would result in reduced (but still small) impact levels compared to original estimates in the 43
Draft Solar PEIS. 44
45

Final Solar PEIS 10.1-47 July 2012
Field surveys were conducted for the BLM following the publication of the Draft Solar 1
PEIS to determine the potential occurrence of Gunnison prairie dog, western burrowing owl, and 2
special status bat species in the Colorado SEZs (Garcia and Harvey 2011; Rodriguez 2011). 3
Results of these surveys have documented the presence of the Gunnison prairie dog in the 4
western and northern portions of the Antonito Southeast SEZ within an area of approximately 5
592.4 acres (2.4 km2) (Garcia and Harvey 2011). In the Draft Solar PEIS, it was determined that 6
as much as 8,293 acres (34 km2) of potentially suitable habitat for the Gunnison prairie dog 7
could be directly affected by solar energy development within the Antonito Southeast SEZ, 8
resulting in a small overall impact magnitude compared to available habitat in the SEZ region. 9
Development within the revised developable area of the Antonito Southeast SEZ will not affect 10
any more potentially suitable habitat than what was presented in the Draft Solar PEIS; therefore, 11
the overall impact magnitude for the Gunnison prairie dog remains small. 12
13
The western burrowing owl was not observed on the Antonito Southeast SEZ during field 14
surveys in 2011 (Garcia and Harvey 2011). However, this species may be associated with prairie 15
dog colonies in close proximity to the SEZ and may utilize the SEZ for nesting and/or foraging. 16
In the Draft Solar PEIS, it was determined that as much as 9,700 acres (39 km2) of potentially 17
suitable habitat for the western burrowing owl could be directly affected by solar energy 18
development within the Antonito Southeast SEZ, resulting in a small overall impact magnitude 19
compared to available habitat in the SEZ region. Development within the revised developable 20
area of the Antonito Southeast SEZ will not affect any more potentially suitable habitat than 21
what was presented in the Draft Solar PEIS; therefore, the overall impact magnitude for the 22
western burrowing owl remains small. 23
24
On the basis of field surveys for special status bat species and comments received on the 25
Draft Solar PEIS, there are three additional special status species that may occur in the affected 26
area of the Antonito Southeast SEZ—Mexican spotted owl, western yellow-billed cuckoo, and 27
fringed myotis. Impacts on these species are discussed below and in Table 10.1.12.1-1. The 28
impact assessment for these additional species was carried out in the same way as for those 29
species analyzed in the Draft Solar PEIS (Section 10.1.12.2 of the Draft Solar PEIS). 30
31
32
Mexican Spotted Owl. The Mexican spotted owl is known to occur in Conejos County, 33
Colorado, and, according to the SWReGAP habitat suitability model for the spotted owl, suitable 34
habitat for the species does not occur anywhere within the Antonito Southeast SEZ. However, 35
approximately 4,900 acres (20 km2) of potentially suitable year-round habitat occurs within the 36
area of indirect effects (Figure 10.1.12.1-1). The amount of potentially suitable habitat within the 37
indirect effects area represents about 0.7% of the available suitable habitat in the region 38
(Table 10.1.12.1-1). 39
40
The overall impact on the Mexican spotted owl from construction, operation, and 41
decommissioning of utility-scale solar energy facilities within the Antonito Southeast SEZ is 42
considered small, because suitable habitat for this species does not occur in the SEZ and only 43
indirect effects are possible. The implementation of design features is expected to be sufficient to 44
reduce indirect impacts to negligible levels. 45
46
Final Solar PEIS 10.1-48 July 2012
Western Yellow-Billed Cuckoo. The western yellow-billed cuckoo is known to occur in 1
Conejos County, Colorado, and potentially suitable habitat occurs in the affected area of the 2
Antonito Southeast SEZ. According to the SWReGAP habitat suitability model, suitable habitat 3
for this species does not occur on the SEZ. However, the SWReGAP habitat suitability model 4
indicates approximately 250 acres (1 km2) of potentially suitable habitat occurs in the area of 5
indirect effects, primarily along the Conejos River (Figure 10.1.12.1-1). This indirect effects area 6
represents about 9% of the available suitable habitat in the region (Table 10.1.12.1-1). 7
8
The overall impact on the western yellow-billed cuckoo from construction, operation, and 9
decommissioning of utility-scale solar energy facilities within the Antonito Southeast SEZ is 10
considered small, because no potentially suitable habitat for this species occurs in the area of 11
direct effects and only indirect effects are possible. The implementation of design features is 12
expected to be sufficient to reduce indirect impacts to negligible levels. 13
14
15
Fringed Myotis. The fringed myotis is a year-round resident in southwestern Colorado 16
and is known to occur within the San Luis Valley. Although this species is not known to occur 17
in the Antonito Southeast SEZ, field surveys conducted in 2011 documented the presence of 18
this species in the DeTilla Gulch SEZ (Rodriguez 2011). According to the SWReGAP 19
habitat suitability model, approximately 9,700 acres (39 km2) of suitable foraging habitat 20
on the Antonito Southeast SEZ may be directly affected by construction and operations 21
(Table 10.1.12.1-1). This direct effects area represents 0.3% of potentially suitable habitat in the 22
SEZ region. About 122,500 acres (496 km2) of potentially suitable habitat occurs in the area of 23
indirect effects; this area represents about 3.5% of the available suitable habitat in the region 24
(Table 10.1.12.1-1). Most of the potentially suitable habitat in the affected area is foraging 25
habitat represented by desert shrubland. There is no potentially suitable roosting habitat (rocky 26
cliffs and outcrops) in the area of direct effects; however, it is possible for individuals to roost in 27
nearby habitats within the area of indirect effects (Rodriguez 2011). 28
29
The overall impact on the fringed myotis from construction, operation, and 30
decommissioning of utility-scale solar energy facilities within the Antonito Southeast SEZ is 31
considered small, because the amount of potentially suitable foraging habitat for this species in 32
the area of direct effects represents less than 1% of potentially suitable foraging habitat in the 33
SEZ region. The implementation of design features is expected to be sufficient to reduce indirect 34
impacts on this species to negligible levels. Avoidance of all potentially suitable foraging 35
habitats is not feasible because potentially suitable habitat is widespread throughout the area of 36
direct effects and readily available in other portions of the SEZ region. 37
38
39
10.1.12.3 SEZ-Specific Design Features and Design Feature Effectiveness 40
41
Required programmatic design features are described in Section A.2.2 of Appendix A of 42
this Final Solar PEIS. SEZ-specific resources conditions will guide how programmatic design 43
features are applied, for example: 44
45
Final Solar PEIS 10.1-49 July 2012
• Pre-disturbance surveys shall be conducted within the SEZ (i.e., area of direct 1
effects) to determine the presence and abundance of special status species 2
including those identified in Table 10.1.12.1-1 of the Draft Solar PEIS as well 3
as those identified in Table 10.1.12.1-1 in this Final Solar PEIS. Disturbance 4
to occupied habitats for these species shall be avoided or minimized to the 5
extent practicable. If avoiding or minimizing impacts on occupied habitats is 6
not possible, translocation of individuals from areas of direct effects or 7
compensatory mitigation of direct effects on occupied habitats may be used to 8
reduce impacts. A comprehensive mitigation strategy for special status species 9
that uses one or more of these options to offset the impacts of projects shall be 10
developed in coordination with the appropriate federal and state agencies. 11
12
• Disturbance of wetland and riparian habitat within the SEZ shall be avoided or 13
minimized to the extent practicable. Alta Lake and other identified wetlands 14
have been identified as non-developable areas. Pre-disturbance surveys shall 15
be conducted to determine the presence of additional wetland and riparian 16
habitat in the developable area; development of these habitats shall be avoided 17
or minimized. Adverse impacts on the following special status species could 18
be reduced with the avoidance of wetland and riparian habitats: halfmoon 19
milkvetch (Astragalus allochrous var. playanus), least moonwort (Botrychium 20
simplex), Rocky Mountain blazing-star (Liatris ligulistylis), Rio Grande chub 21
(Gila Pandora), Rio Grande sucker (Catostomus plebeius), milk snake 22
(Lampropeltis triangulum), bald eagle (Haliaeetus leucocephalu), Barrow’s 23
goldeneye (Bucephala islandica), ferruginous hawk (Buteo regalis), and 24
southwestern willow flycatcher (Empidonax traillii extimus). 25
26
• Avoiding or limiting groundwater withdrawals for solar energy development 27
on the SEZ shall be employed to reduce impacts on groundwater-dependent 28
special status species, including those species that may occur in riparian or 29
aquatic habitats supported by groundwater. These species include the 30
southwestern willow flycatcher and the western yellow-billed cuckoo. 31
32
• Consultations with the USFWS and CDOW shall be conducted to address the 33
potential for impacts on the southwestern willow flycatcher, a species listed as 34
endangered under the Endangered Species Act (ESA). Consultation would 35
identify an appropriate survey protocol, avoidance measures, and, if 36
appropriate, reasonable and prudent alternatives, reasonable and prudent 37
measures, and terms and conditions for incidental take statements. 38
39
• Coordination with the USFWS and CDOW shall be conducted to address the 40
potential for impacts on the Gunnison’s prairie dog and northern leopard frog 41
(Rana pipiens)—species that are either candidates or under review for listing 42
under the ESA. Coordination would identify an appropriate survey protocol, 43
avoidance measures, and, potentially, translocation or compensatory 44
mitigation. 45
46
Final Solar PEIS 10.1-50 July 2012
If the programmatic design features are implemented, it is anticipated that the majority of 1
impacts on the special status species from habitat disturbance and groundwater use will be 2
reduced. 3
4
On the basis of impact analyses conducted for the Draft Solar PEIS and consideration of 5
comments received as applicable, no SEZ-specific design features for special status species have 6
been identified. Some SEZ-specific design features may be identified through the process of 7
preparing parcels for competitive offer and subsequent project-specific analysis. Projects will 8
comply with terms and conditions set forth by the USFWS Biological Opinion resulting from the 9
programmatic consultation and any necessary project-specific ESA Section 7 consultations. 10
11
12
10.1.13 Air Quality and Climate 13
14
15
10.1.13.1 Affected Environment 16
17
Except as noted below, the information for air quality and climate presented for the 18
affected environment of the Draft Solar PEIS remains essentially unchanged. 19
20
21
10.1.13.1.1 Existing Air Emissions 22 23 The Draft Solar PEIS presented Conejos County emissions data for 2002. More recent 24
data for 2008 (CDPHE 2011) were reviewed for this Final Solar PEIS. The two emissions 25
inventories used different sources and assumptions. All emissions in the 2008 data were lower 26
than those in the 2002 data, and all criteria air pollutants were much lower, but volatile organic 27
compounds (VOCs) were about half of those in the 2002 data. These changes would not affect 28
the modeled air quality impacts presented in this update. 29
30
31
10.1.13.1.2 Air Quality 32 33 The calendar quarterly average National Ambient Air Quality Standard (NAAQS) of 34
1.5 µg/m3 for lead (Pb) presented in Table 10.1.13.1-2 of the Draft Solar PEIS has been replaced 35
by the rolling 3-month standard (0.15 µg/m3). The federal 24-hour and annual sulfur dioxide 36
(SO2), 1-hour ozone (O3), and annual PM10 (particulate matter with a diameter of 10 µm or less) 37
standards have been revoked as well (EPA 2011). All Colorado State Ambient Air Quality 38
Standards (SAAQS), except the 3-hour SO2 standard of 700 µg/m3, have been revoked since the 39
publication of the Draft Solar PEIS. These changes would not affect the modeled air quality 40
impacts presented in this update. 41 42 The developable area of the proposed Antonito Southeast SEZ was reduced by about 43
0.2%, from 9,729 acres (39.4 km2) to 9,712 acres (39.3 km2). This reduction was effected by 44
removing interior portions of the proposed SEZ from potentially developable areas. The 45
Final Solar PEIS 10.1-51 July 2012
boundaries of the SEZ were not changed, and distances to all receptors of interest remain the 1
same as in the Draft Solar PEIS. 2
3
4
10.1.13.2 Impacts 5
6
7
10.1.13.2.1 Construction 8
9
10
Methods and Assumptions 11
12
The methods and modeling assumptions have not changed from those presented in the 13
Draft Solar PEIS. The reduction in the developable area of the proposed Antonito Southeast SEZ 14
by less than 1% would cause only a negligible impact on modeled air quality impacts; thus air 15
quality impacts were not remodeled. 16
17
18
Results 19
20
Since the annual PM10 standard has been rescinded, the discussion of annual PM10 21
impacts in the Draft Solar PEIS is no longer applicable, and Table 10.1.13.2-1 has been updated 22
for this Final Solar PEIS. 23
24
Since the air quality impacts remain the same as those presented in the Draft Solar PEIS, 25
the discussion and conclusions in the Draft Solar PEIS remain valid.2 Predicted 24-hour PM10 26
and 24-hour PM2.5 (particulate matter with a diameter of 2.5 µm or less) concentration levels 27
could exceed the standard level used for comparison at the SEZ boundaries and in the immediate 28
surrounding areas during the construction of a solar facility. However, these high particulate 29
concentrations would be limited to the immediate vicinity of the proposed SEZ boundary and 30
would decrease quickly with distance. At the nearest residence located about 0.5 mi (0.8 km) 31
north of the SEZ, the 24-hour PM10 standard level used for comparison would be exceeded, but 32
the 24-hour and annual PM2.5 standard levels would not be exceeded at any nearby residences or 33
communities. 34
35
The conclusions in the Draft Solar PEIS concerning impacts in nearby Prevention of 36
Significant Deterioration (PSD) Class I areas remain valid. Predicted 24-hour PM10 37
concentration increments at the nearest Class I Area—Wheeler Peak WA, New Mexico— 38
2 At this programmatic level, detailed information on construction activities, such as facility size, type of solar
technology, heavy equipment fleet, activity level, work schedule, and the like, is not known; thus air quality
modeling cannot be conducted. It has been assumed that an area of 3,000 acres (12.1 km2) in total would be
disturbed continuously; thus the modeling results and discussion here should be interpreted in that context.
During the site-specific project phase, more detailed information would be available and more realistic air
quality modeling analysis could be conducted. It is likely that impacts on ambient air quality predicted for
specific projects would be much lower than those in this Final Solar PEIS.
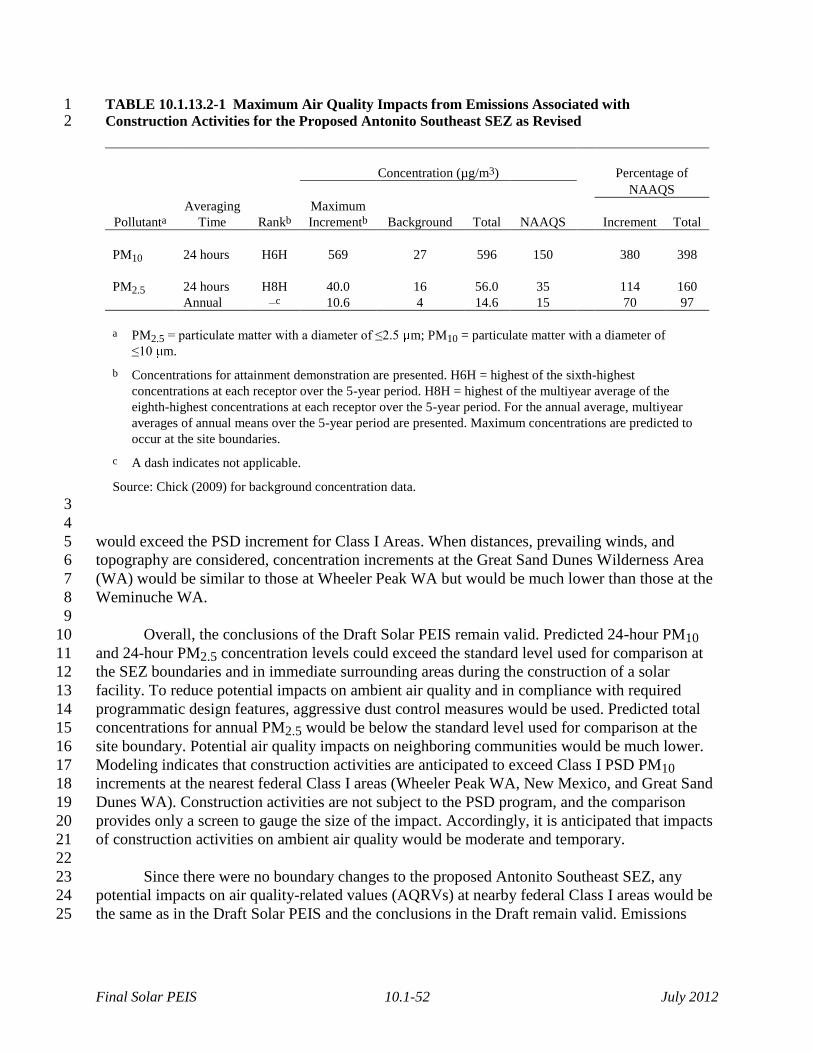
Final Solar PEIS 10.1-52 July 2012
TABLE 10.1.13.2-1 Maximum Air Quality Impacts from Emissions Associated with 1 Construction Activities for the Proposed Antonito Southeast SEZ as Revised 2
Concentration (µg/m3)
Percentage of
NAAQS
Pollutanta
Averaging
Time Rankb
Maximum
Incrementb Background Total NAAQS Increment Total
PM10 24 hours H6H 569 27 596 150 380 398
PM2.5 24 hours H8H 40.0 16 56.0 35 114 160
Annual –c 10.6 4 14.6 15 70 97
a PM2.5 = particulate matter with a diameter of ≤2.5 m; PM10 = particulate matter with a diameter of
≤10 m.
b Concentrations for attainment demonstration are presented. H6H = highest of the sixth-highest
concentrations at each receptor over the 5-year period. H8H = highest of the multiyear average of the
eighth-highest concentrations at each receptor over the 5-year period. For the annual average, multiyear
averages of annual means over the 5-year period are presented. Maximum concentrations are predicted to
occur at the site boundaries.
c A dash indicates not applicable.
Source: Chick (2009) for background concentration data.
3
4
would exceed the PSD increment for Class I Areas. When distances, prevailing winds, and 5
topography are considered, concentration increments at the Great Sand Dunes Wilderness Area 6
(WA) would be similar to those at Wheeler Peak WA but would be much lower than those at the 7
Weminuche WA. 8
9
Overall, the conclusions of the Draft Solar PEIS remain valid. Predicted 24-hour PM10 10
and 24-hour PM2.5 concentration levels could exceed the standard level used for comparison at 11
the SEZ boundaries and in immediate surrounding areas during the construction of a solar 12
facility. To reduce potential impacts on ambient air quality and in compliance with required 13
programmatic design features, aggressive dust control measures would be used. Predicted total 14
concentrations for annual PM2.5 would be below the standard level used for comparison at the 15
site boundary. Potential air quality impacts on neighboring communities would be much lower. 16
Modeling indicates that construction activities are anticipated to exceed Class I PSD PM10 17
increments at the nearest federal Class I areas (Wheeler Peak WA, New Mexico, and Great Sand 18
Dunes WA). Construction activities are not subject to the PSD program, and the comparison 19
provides only a screen to gauge the size of the impact. Accordingly, it is anticipated that impacts 20
of construction activities on ambient air quality would be moderate and temporary. 21
22
Since there were no boundary changes to the proposed Antonito Southeast SEZ, any 23
potential impacts on air quality-related values (AQRVs) at nearby federal Class I areas would be 24
the same as in the Draft Solar PEIS and the conclusions in the Draft remain valid. Emissions 25
Final Solar PEIS 10.1-53 July 2012
from construction-related equipment and vehicles are temporary and would cause some 1
unavoidable but short-term impacts. 2 3 4
10.1.13.2.2 Operations 5 6 The reduction in developable area of the proposed Antonito Southeast SEZ by less 7
than 1% reduces the generating capacity and annual power generation by a similar percentage 8
and thus reduces the potentially avoided emissions presented in the Draft Solar PEIS. 9
Updated estimates for emissions potentially avoided by a solar facility can be obtained from 10
Table 10.1.13.2-2 in the Draft Solar PEIS by reducing the tabulated emissions by about 0.18%. 11
Maximum emissions avoided would be up to 3,600 tons/yr for SO2, 4,151 tons/yr for NOx, and 12
2,690,000 tons/yr for carbon dioxide (CO2); other reductions are too small to show. These small 13
reductions would not affect the analysis presented in the Draft Solar PEIS, and the conclusion 14
presented therein that solar facilities built in the proposed Antonito Southeast SEZ could avoid 15
relatively more fuel emissions in Colorado than those built in other states with less reliance on 16
fossil fuel–generated power remains valid. 17 18 19
10.1.13.2.3 Decommissioning and Reclamation 20 21 The discussion in the Draft Solar PEIS remains valid. Decommission and reclamation 22
activities would be of short duration, and their potential impacts would be moderate and 23
temporary. 24 25 26
10.1.13.3 SEZ-Specific Design Features and Design Feature Effectiveness 27 28 Required programmatic design features that would reduce air quality impacts are 29
described in Section A.2.2 of Appendix A of this Final Solar PEIS. Limiting dust generation 30
during construction and operations is a required programmatic design feature under the BLM 31
Solar Energy Program. These extensive fugitive dust control measures would keep off-site 32
particulate matter (PM) levels as low as possible during construction. 33
34
On the basis of impact analyses conducted for the Draft Solar PEIS and consideration of 35
comments received as applicable, no SEZ-specific design features for air quality have been 36
identified. Some SEZ-specific design features may be identified through the process of preparing 37
parcels for competitive offer and subsequent project-specific analysis. 38 39 40 10.1.14 Visual Resources 41 42 43
10.1.14.1 Affected Environment 44 45 No boundary revisions were identified for the proposed Antonito Southeast SEZ; 46
however, 17 acres (0.07 km2) of non-development wetland and lake areas were identified. The 47
remaining developable area within the SEZ is 9,712 acres (39.3 km2). 48

Final Solar PEIS 10.1-54 July 2012
An updated Visual Resources Inventory (VRI) map for the SEZ and surrounding lands is 1
shown in Figure 10.1.14.1-1; it provides information from the BLM’s September 2010 VRI, 2
which was finalized in October 2011 (BLM 2011a). As shown, the VRI values for the SEZ now 3
are VRI Class II, III, and IV. The western portion of the SEZ still is VRI Class III, indicating 4
moderate relative visual values, while much of the eastern portion now is VRI Class IV, 5
indicating low relative visual values. These portions of the SEZ are located within the Antonito 6
Southeast scenic quality rating unit. This unit is identified as having low scenic quality and 7
moderate levels of sensitivity. A small portion of the SEZ remains as VRI Class II, indicating 8
high relative visual values; this part of the SEZ is located within the San Luis Hills scenic quality 9
rating unit. This unit is characterized as having high scenic quality and high sensitivity. 10
11
Within the La Jara Field Office, lands within the 25-mi (40-km), 650-ft (198-m) 12
viewshed of the SEZ contain 31,253 acres (126.5 km2) of VRI Class II lands, 36,225 acres 13
(146.6 km2) of VRI Class III lands, and 25,345 acres (102.6 km2) of VRI Class IV lands. 14
15
16
10.1.14.2 Impacts 17
18
The summary of impacts provided in the Draft Solar PEIS remains valid. In general, the 19
Antonito Southeast SEZ is located in an area of low scenic quality. Visitors to the area, workers, 20
and residents of nearby areas may experience visual impacts from solar energy facilities located 21
within the SEZ (as well as any associated access roads and transmission lines) as they travel area 22
roads. 23
24
Utility-scale solar energy development within the proposed Antonito Southeast SEZ is 25
likely to result in strong visual contrasts for some viewpoints in the San Antonio WSA, along 26
some portions of the Los Caminos Antiguos Scenic Byway, along portions of the West Fork of 27
the North Branch of the Old Spanish Trail, and where there are clear views to the SEZ for 28
residents of and visitors to the community of Antonito. Moderate visual contrast levels would be 29
expected for high-elevation viewpoints in the San Luis Hills WSA and ACEC and for portions of 30
the CTSR Corridor and CTSR Corridor ACEC. Residents and visitors to Conejos likely would 31
observe lower levels of contrasts; minimal to weak visual contrasts would be expected for some 32
viewpoints within other sensitive visual resource areas within the 25-mi (40-km) viewshed of 33
the SEZ. 34
35
Solar development on lands in the SEZ visible from and in close proximity to the West 36
Fork of the North Branch of the Old Spanish Trail has a higher potential to have visual impacts 37
on the Trail. The BLM has identified areas in the SEZ visible from and within 1 mi (1.6 km) of 38
the West Fork as potential high visual sensitivity areas, where solar development would be 39
subject to specific, additional design features that would be identified when project-specific 40
environmental analyses are conducted. In addition, the BLM has identified areas in the SEZ 41
visible from 1 to 3 mi (1.6 to 4.8 km) from the Trail as potential moderate visual sensitivity 42
areas. Solar development within these areas also would be subject to specific, additional design 43
features identified as part of a project specific analysis. 44
45
46
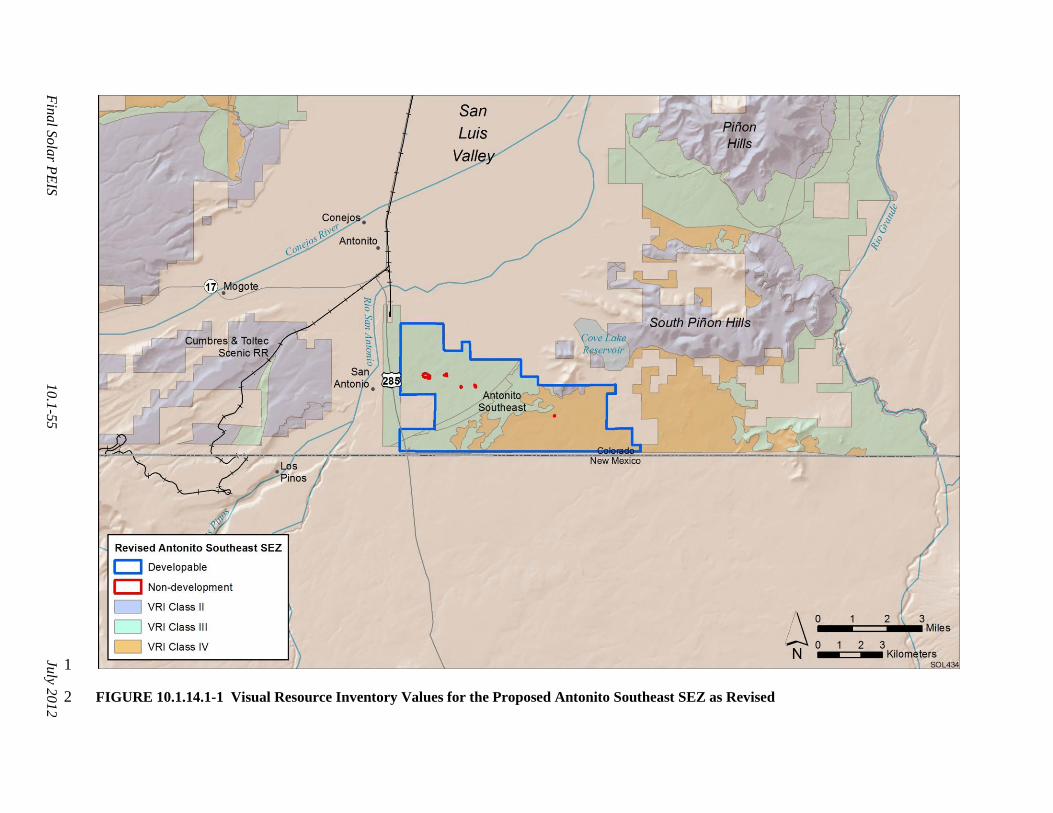
Fin
al S
ola
r PE
IS
10.1
-55
July 2
01
2
1
FIGURE 10.1.14.1-1 Visual Resource Inventory Values for the Proposed Antonito Southeast SEZ as Revised 2
Final Solar PEIS 10.1-56 July 2012
In addition, the BLM has identified areas in the SEZ visible from and within 3 mi 1
(4.8 km) of the CTSR ACEC and San Antonio WSA as potential moderate visual sensitivity 2
areas. In these areas, solar development also would be subject to specific, additional design 3
features to be identified in conjunction with project-specific analyses. 4
5
6
10.1.14.3 SEZ-Specific Design Features and Design Feature Effectiveness 7
8
Required programmatic design features that would reduce impacts on visual resources are 9
described in Section A.2.2 of Appendix A of this Final Solar PEIS. While application of the 10
programmatic design features would reduce potential visual impacts somewhat, the degree of 11
effectiveness of these design features could be assessed only at the site- and project-specific 12
level. Given the large scale, reflective surfaces, and strong regular geometry of utility-scale solar 13
energy facilities and the lack of screening vegetation and landforms within the SEZ viewshed, 14
siting the facilities away from sensitive visual resource areas and other sensitive viewing areas 15
would be the primary means of mitigating visual impacts. The effectiveness of other visual 16
impact mitigation measures generally would be limited. Utility-scale solar energy development 17
using any of the solar technologies analyzed in this Solar PEIS and at the scale analyzed would 18
be expected to result in large adverse visual impacts that could not be mitigated. 19
20
On the basis of impact analyses conducted for the Draft Solar PEIS and consideration of 21
comments received as applicable, the following proposed SEZ-specific design features for visual 22
resources have been identified: 23
24
• The development of power tower facilities should be prohibited within the 25
SEZ. The San Luis Valley is a regionally important tourist destination and is 26
an area with many small communities and numerous important historic, 27
cultural, and recreational resources. The valley contains numerous historic 28
sites, two scenic railways, two scenic highways, several wildlife refuges, 29
Great Sand Dunes NP and Preserve, the Rio Grande WSR, congressionally 30
designated WAs, the Sangre de Cristo NHA, and various other attractions that 31
draw tourists to the region. A number of these areas overlook the San Luis 32
Valley from the surrounding mountains and include elevated viewpoints that 33
would have clear views of power tower facilities in the Valley. The height of 34
solar power tower receiver structures, combined with the intense light 35
generated by the receiver atop the tower, would be expected to create strong 36
visual contrasts that could not be effectively screened from view for most 37
areas surrounding the SEZ. The effective area of impact from power tower 38
structures is much larger than that for comparably rated lower height facilities, 39
which makes it more likely that they would conflict with the growing tourism 40
focus of the Valley. In addition, for power towers exceeding 200 ft (61 m) in 41
height, hazard navigation lighting that could be visible for very long distances 42
would likely be required. Prohibiting the development of power tower 43
facilities would remove these sources of impacts, thus substantially reducing 44
potential visual impacts on the CTSR, its depot, and the associated ACEC; the 45
West Fork of the North Branch of the Old Spanish Trail; other sensitive visual 46
Final Solar PEIS 10.1-57 July 2012
resource areas as identified in the Draft Solar PEIS; the community of 1
Antonito; travelers on U.S. 285; and other residents and visitors to the San 2
Luis Valley. 3
4
• Special visual impact mitigation shall be considered for solar development on 5
lands in the SEZ visible from and within 3 mi (5 km) of the centerline of the 6
West Fork of the North Branch of the Old Spanish Trail. Solar development 7
on lands in the SEZ visible from and in close proximity to the West Fork of 8
the North Branch of the Old Spanish Trail has a higher potential to cause 9
visual impacts on the Trail. Therefore, the BLM has identified areas in the 10
SEZ visible from and within 1 mi (1.6 km) of the West Fork of the North 11
Branch of the Old Spanish Trail as potential high visual sensitivity areas, 12
where solar development would be subject to specific additional design 13
features that will be identified when project-specific environmental analyses 14
are conducted. In addition, the BLM has identified areas in the SEZ visible 15
from and within 3 mi (5 km) of the West Fork of the North Branch of the Old 16
Spanish Trail as potential moderate visual sensitivity areas, where solar 17
development would also be subject to specific additional design features that 18
will be identified when project-specific environmental analyses are conducted. 19
20
• Special visual impact mitigation shall be considered for solar development on 21
lands in the SEZ visible from and within 3 mi (5 km) of the CTSR ACEC and 22
San Antonio WSA. Solar development on lands in the SEZ visible from and in 23
close proximity to the CTSR ACEC and San Antonio WSA has a higher 24
potential to cause visual impacts on the ACEC and the WSA. Therefore, the 25
BLM has identified areas in the SEZ visible from and within 3 mi (5 km) of 26
the CTSR ACEC and San Antonio WSA as potential moderate visual 27
sensitivity areas, where solar development would be subject to specific 28
additional design features that will be identified when project-specific 29
environmental analyses are conducted. 30
31
The need for additional SEZ-specific design features will be identified through the 32
process of preparing parcels for competitive offer and subsequent project-specific analysis. 33
34
35
10.1.15 Acoustic Environment 36
37
38
10.1.15.1 Affected Environment 39
40
The developable area of the proposed Antonito Southeast SEZ was reduced by less than 41
1%, from 9,729 acres (39.4 km2) to 9,712 acres (39.3 km2). The boundaries of the SEZ were not 42
changed, and thus the information for acoustic environment remains the same as presented in the 43
Draft Solar PEIS. 44
45
46

Final Solar PEIS 10.1-58 July 2012
10.1.15.2 Impacts 1
2
Given the small reduction in the developable area of the Antonito Southeast SEZ and the 3
lack of change in the boundaries, the conclusions presented in the Draft Solar PEIS remain valid 4
except for construction and operations impacts on specially designated areas and impacts from 5
operating dish engine facilities. 6
7
8
10.1.15.2.1 Construction 9
10
Except as noted below, for impacts in specially designated areas, the assessment in the 11
Draft Solar PEIS remains valid. 12
13
On the basis of comments received and recent references as applicable, this Final Solar 14
PEIS used an updated approximate significance threshold of 55 dBA corresponding to the onset 15
of adverse physiological impacts (Barber et al. 2010) to update the analysis of potential noise 16
impacts on terrestrial wildlife in areas of special concern. As a result of this updated analysis, 17
the conclusion in the Draft Solar PEIS that wildlife would not be adversely affected has been 18
updated for this Final Solar PEIS as follows. For construction activities occurring near the 19
southwestern SEZ boundary, the estimated noise level at the boundary of the San Antonio WSA 20
in New Mexico (about 1.6 mi [2.6 km] to the southwest) would be about 37 dBA. This estimated 21
level is below the significance threshold; thus noise from construction in the proposed Antonito 22
Southeast SEZ is not anticipated to adversely affect wildlife in the nearby specially designated 23
areas. However, as discussed in Section 5.10.2 of this Final Solar PEIS, there is the potential for 24
other effects to occur at lower noise levels (Barber et al. 2011). Because of the potential for 25
impacts at lower noise levels, impacts on terrestrial wildlife from construction noise would have 26
to be considered on a project-specific basis, including site-specific background levels and 27
hearing sensitivity for site-specific terrestrial wildlife of concern. However, even with potential 28
impacts at these lower noise levels, construction noise at the SEZ would not be anticipated to 29
affect wildlife in nearby specially designated areas. 30
31
For construction activities occurring near the western SEZ boundary, the estimated noise 32
level at the West Fork of the North Branch of the Old Spanish Trail (as close as 660 ft [200 m] 33
to the west) would be about 66 dBA, which is well above the typical daytime mean rural 34
background level of 40 dBA. Accordingly, construction occurring near the western SEZ 35
boundary could result in adverse noise impacts on the Old Spanish Trail, but these impacts 36
would be temporary. 37
38
Construction within the proposed Antonito Southeast SEZ would cause some 39
unavoidable but localized short-term noise impacts on neighboring communities, particularly 40
activities occurring near the northern or western proposed SEZ boundaries, close to the nearby 41
residences. No adverse vibration impacts are anticipated from construction activities, including 42
pile driving for dish engines. 43
44
45

Final Solar PEIS 10.1-59 July 2012
10.1.15.2.2 Operations 1
2
Given the small reduction in the developable area of the proposed Antonito Southeast 3
SEZ, the assessment presented in the Draft Solar PEIS remains valid, except as noted below 4
for impacts from thermal energy storage (TES) and dish engine facilities near residence or in 5
specially designated areas. 6
7
8
Parabolic Trough and Power Tower 9
10
As stated above under construction impacts, for this Final Solar PEIS an updated 11
approximate significance threshold of 55 dBA was used to evaluate potential noise impacts on 12
terrestrial wildlife in areas of special concern. With TES operating near the southwestern SEZ 13
boundary, estimated daytime and nighttime noise levels at the boundary of the San Antonio 14
WSA in New Mexico would be about 37 and 47 dBA, respectively. These estimated levels are 15
below the significance threshold; thus noise from operations in the proposed Antonito Southeast 16
SEZ is not anticipated to considerably affect wildlife in the nearby specially designated areas. 17
However, as discussed in Section 5.10.2 of this Final Solar PEIS, there is the potential for other 18
effects to occur at lower noise levels (Barber et al. 2011). Because of these impacts and the 19
potential for impacts at lower noise levels, noise impacts on terrestrial wildlife from a parabolic 20
trough or power tower facility equipped with TES would have to be considered on a project-21
specific basis, including site-specific background levels and hearing sensitivity for site-specific 22
terrestrial wildlife of concern. 23
24
For operations of a parabolic trough or power tower facility equipped with TES near the 25
western SEZ boundary, the estimated daytime and nighttime noise levels at the West Fork of the 26
North Branch of the Old Spanish Trail (as close as 660 ft [200 m] to the west) would be about 27
49 and 59 dBA, respectively, which are significantly above the typical daytime and nighttime 28
mean rural background levels of 40 and 30 dBA. Accordingly, a solar facility with TES located 29
near the western SEZ boundary could result in adverse noise impacts on the North Branch of the 30
Old Spanish Trail. 31
32
33
Dish Engines 34
35
As stated above under construction impacts, for this Final Solar PEIS an updated 36
approximate significance threshold of 55 dBA was used to evaluate potential noise impacts on 37
terrestrial wildlife in areas of special concern. Estimated noise level from operation of a dish 38
engine solar facility at the boundary of the San Antonio WSA in New Mexico would be about 39
43 dBA. This estimated level is below the significance threshold; thus noise from operations in 40
the proposed Antonito Southeast SEZ is not anticipated to adversely affect wildlife in the nearby 41
specially designated area. However, as discussed in Section 5.10.2 of this Final Solar PEIS, there 42
is the potential for other effects to occur at lower noise levels (Barber et al. 2011). With these 43
impacts and the potential for impacts at lower noise levels, noise impacts on terrestrial wildlife 44
from a dish engine facility would have to be considered on a project-specific basis, including 45

Final Solar PEIS 10.1-60 July 2012
site-specific background levels and hearing sensitivity for site-specific terrestrial wildlife of 1
concern. 2
3
On the basis of a full build-out of the SEZ with dish engine facilities, the estimated noise 4
level at the West Fork of the North Branch of the Old Spanish Trail (as close as 660 ft [200 m] 5
to the west) would be about 55 dBA, which is well above the typical daytime mean rural 6
background level of 40 dBA. Therefore, dish engine noise from the SEZ could result in adverse 7
noise impacts on the West Fork of the North Branch of the Old Spanish Trail. 8
9
With no changes in the boundaries of the proposed Antonito Southeast SEZ, the 10
discussions of vibration, transformer and switchyard noise, and transmission line corona 11
discharge presented in the Draft Solar PEIS remain valid. Noise impacts from these sources 12
would be minimal to negligible. 13
14
15
10.1.15.2.3 Decommissioning and Reclamation 16
17
The conclusions on decommissioning and reclamation in the proposed Antonito 18
Southeast SEZ as presented in the Draft Solar PEIS remain valid. Decommissioning and 19
reclamation activities would be of short duration, and their potential noise impacts would be 20
minor and temporary. Potential noise and vibration impacts on surrounding communities would 21
be minimal. 22
23
24
10.1.15.3 SEZ-Specific Design Features and Design Feature Effectiveness 25
26
Required programmatic design features that would reduce noise impacts are described in 27
Section A.2.2 of Appendix A of this Final Solar PEIS. Implementing the programmatic design 28
features will provide some protection from noise impacts. 29
30
On the basis of impact analyses conducted for the Draft Solar PEIS and consideration of 31
comments received as applicable, no SEZ-specific design features for noise were identified. 32
Some SEZ-specific design features may be identified through the process of preparing parcels 33
for competitive offer and subsequent project-specific analysis. 34
35
36
10.1.16 Paleontological Resources 37
38
39
10.1.16.1 Affected Environment 40
41
Data provided in the Draft Solar PEIS remain valid, with the following update: 42
43
• The BLM Regional Paleontologist may have additional information regarding 44
the paleontological potential of the SEZ and be able to verify the potential 45

Final Solar PEIS 10.1-61 July 2012
fossil yield classification (PFYC) of the SEZ as Class 1 and 4/5 as used in the 1
Draft Solar PEIS. 2
3
4
10.1.16.2 Impacts 5
6
The assessment provided in the Draft Solar PEIS remains valid. Impacts on significant 7
paleontological resources are possible in those areas where the Alamosa Formation is determined 8
to be at a depth that could be affected by solar energy development. However, a more detailed 9
look at the geological deposits is necessary to determine whether a paleontological survey is 10
warranted. 11
12
13
10.1.16.3 SEZ-Specific Design Features and Design Feature Effectiveness 14
15
Required programmatic design features are described in Appendix A of this Final Solar 16
PEIS. Impacts would be minimized through the implementation of required programmatic design 17
features, including a stop-work stipulation in the event that paleontological resources are 18
encountered during construction, as described in Section A.2.2 of Appendix A. 19
20
On the basis of impact analyses conducted for the Draft Solar PEIS and consideration of 21
comments received as applicable, the following SEZ-specific design feature has been identified: 22
23
• Avoidance of PFYC Class 4 or 5 areas is recommended for development 24
within the proposed Antonito Southeast SEZ (i.e., the 4-acre [0.016-km2] 25
parcel in the north part of the SEZ). Where avoidance of Class 4 or 5 deposits 26
is not possible, a paleontological survey or monitoring would be required by 27
the BLM. 28
29
The need for and nature of additional SEZ-specific design features will depend on the 30
findings of future paleontological investigations and may be identified through the process of 31
preparing parcels for competitive offer and subsequent project-specific analysis. 32
33
As additional information on paleontological resources (e.g., from regional 34
paleontologists or from new surveys) becomes available, the BLM will post the data to the 35
project Web site (http://solareis.anl.gov) for use by applicants, the BLM, and other stakeholders. 36
37
38
10.1.17 Cultural Resources 39
40
41
10.1.17.1 Affected Environment 42
43
Data provided in the Draft Solar PEIS remain valid, with the following updates: 44
45
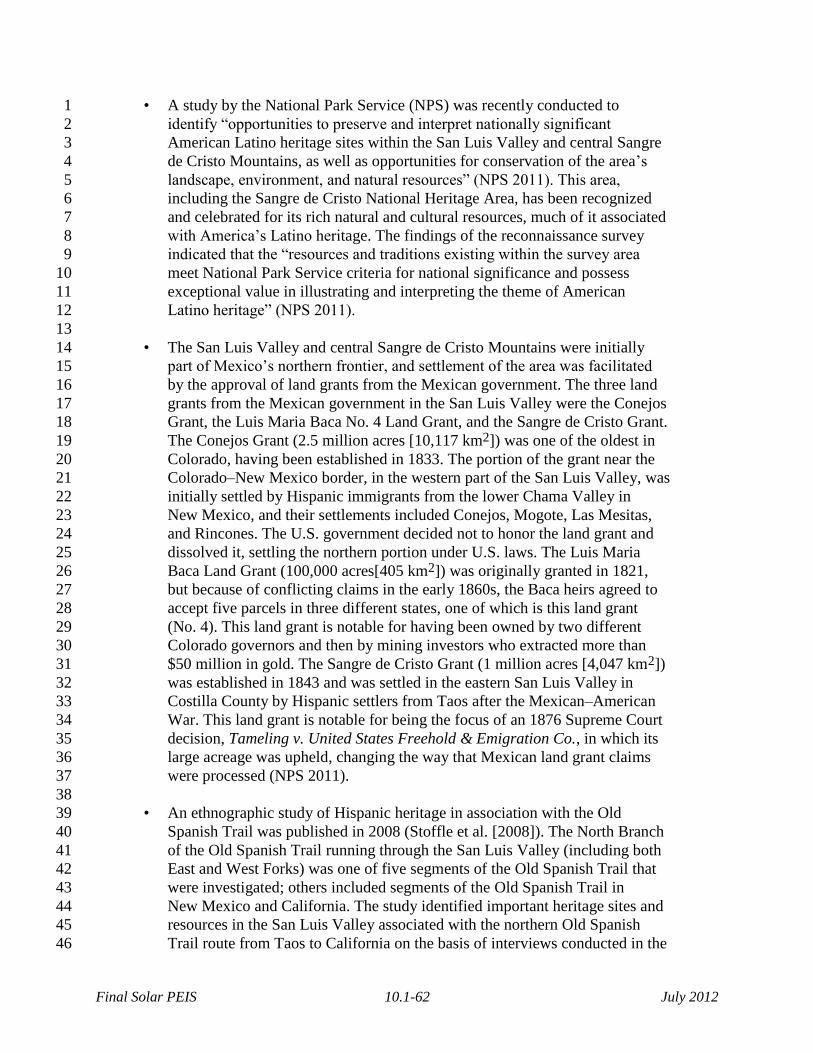
Final Solar PEIS 10.1-62 July 2012
• A study by the National Park Service (NPS) was recently conducted to 1
identify “opportunities to preserve and interpret nationally significant 2
American Latino heritage sites within the San Luis Valley and central Sangre 3
de Cristo Mountains, as well as opportunities for conservation of the area’s 4
landscape, environment, and natural resources” (NPS 2011). This area, 5
including the Sangre de Cristo National Heritage Area, has been recognized 6
and celebrated for its rich natural and cultural resources, much of it associated 7
with America’s Latino heritage. The findings of the reconnaissance survey 8
indicated that the “resources and traditions existing within the survey area 9
meet National Park Service criteria for national significance and possess 10
exceptional value in illustrating and interpreting the theme of American 11
Latino heritage” (NPS 2011). 12
13
• The San Luis Valley and central Sangre de Cristo Mountains were initially 14
part of Mexico’s northern frontier, and settlement of the area was facilitated 15
by the approval of land grants from the Mexican government. The three land 16
grants from the Mexican government in the San Luis Valley were the Conejos 17
Grant, the Luis Maria Baca No. 4 Land Grant, and the Sangre de Cristo Grant. 18
The Conejos Grant (2.5 million acres [10,117 km2]) was one of the oldest in 19
Colorado, having been established in 1833. The portion of the grant near the 20
Colorado–New Mexico border, in the western part of the San Luis Valley, was 21
initially settled by Hispanic immigrants from the lower Chama Valley in 22
New Mexico, and their settlements included Conejos, Mogote, Las Mesitas, 23
and Rincones. The U.S. government decided not to honor the land grant and 24
dissolved it, settling the northern portion under U.S. laws. The Luis Maria 25
Baca Land Grant (100,000 acres[405 km2]) was originally granted in 1821, 26
but because of conflicting claims in the early 1860s, the Baca heirs agreed to 27
accept five parcels in three different states, one of which is this land grant 28
(No. 4). This land grant is notable for having been owned by two different 29
Colorado governors and then by mining investors who extracted more than 30
$50 million in gold. The Sangre de Cristo Grant (1 million acres [4,047 km2]) 31
was established in 1843 and was settled in the eastern San Luis Valley in 32
Costilla County by Hispanic settlers from Taos after the Mexican–American 33
War. This land grant is notable for being the focus of an 1876 Supreme Court 34
decision, Tameling v. United States Freehold & Emigration Co., in which its 35
large acreage was upheld, changing the way that Mexican land grant claims 36
were processed (NPS 2011). 37
38
• An ethnographic study of Hispanic heritage in association with the Old 39
Spanish Trail was published in 2008 (Stoffle et al. [2008]). The North Branch 40
of the Old Spanish Trail running through the San Luis Valley (including both 41
East and West Forks) was one of five segments of the Old Spanish Trail that 42
were investigated; others included segments of the Old Spanish Trail in 43
New Mexico and California. The study identified important heritage sites and 44
resources in the San Luis Valley associated with the northern Old Spanish 45
Trail route from Taos to California on the basis of interviews conducted in the 46
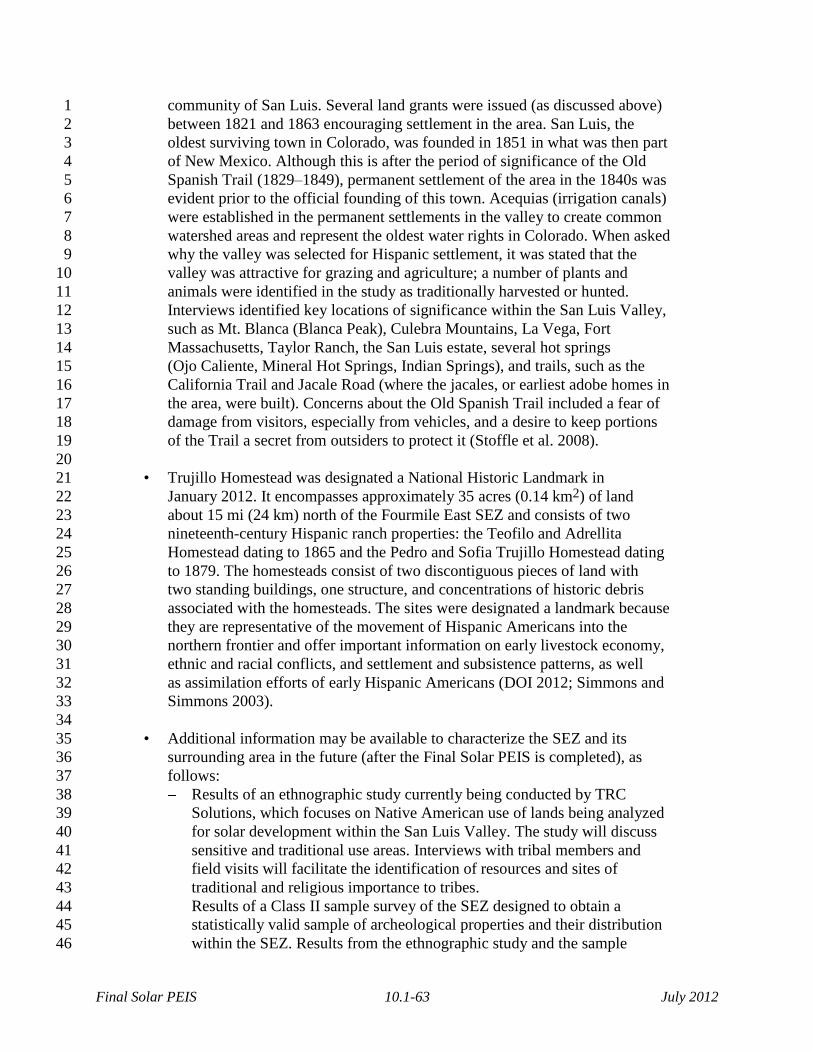
Final Solar PEIS 10.1-63 July 2012
community of San Luis. Several land grants were issued (as discussed above) 1
between 1821 and 1863 encouraging settlement in the area. San Luis, the 2
oldest surviving town in Colorado, was founded in 1851 in what was then part 3
of New Mexico. Although this is after the period of significance of the Old 4
Spanish Trail (1829–1849), permanent settlement of the area in the 1840s was 5
evident prior to the official founding of this town. Acequias (irrigation canals) 6
were established in the permanent settlements in the valley to create common 7
watershed areas and represent the oldest water rights in Colorado. When asked 8
why the valley was selected for Hispanic settlement, it was stated that the 9
valley was attractive for grazing and agriculture; a number of plants and 10
animals were identified in the study as traditionally harvested or hunted. 11
Interviews identified key locations of significance within the San Luis Valley, 12
such as Mt. Blanca (Blanca Peak), Culebra Mountains, La Vega, Fort 13
Massachusetts, Taylor Ranch, the San Luis estate, several hot springs 14
(Ojo Caliente, Mineral Hot Springs, Indian Springs), and trails, such as the 15
California Trail and Jacale Road (where the jacales, or earliest adobe homes in 16
the area, were built). Concerns about the Old Spanish Trail included a fear of 17
damage from visitors, especially from vehicles, and a desire to keep portions 18
of the Trail a secret from outsiders to protect it (Stoffle et al. 2008). 19
20
• Trujillo Homestead was designated a National Historic Landmark in 21
January 2012. It encompasses approximately 35 acres (0.14 km2) of land 22
about 15 mi (24 km) north of the Fourmile East SEZ and consists of two 23
nineteenth-century Hispanic ranch properties: the Teofilo and Adrellita 24
Homestead dating to 1865 and the Pedro and Sofia Trujillo Homestead dating 25
to 1879. The homesteads consist of two discontiguous pieces of land with 26
two standing buildings, one structure, and concentrations of historic debris 27
associated with the homesteads. The sites were designated a landmark because 28
they are representative of the movement of Hispanic Americans into the 29
northern frontier and offer important information on early livestock economy, 30
ethnic and racial conflicts, and settlement and subsistence patterns, as well 31
as assimilation efforts of early Hispanic Americans (DOI 2012; Simmons and 32
Simmons 2003). 33
34
• Additional information may be available to characterize the SEZ and its 35
surrounding area in the future (after the Final Solar PEIS is completed), as 36
follows: 37
Results of an ethnographic study currently being conducted by TRC 38
Solutions, which focuses on Native American use of lands being analyzed 39
for solar development within the San Luis Valley. The study will discuss 40
sensitive and traditional use areas. Interviews with tribal members and 41
field visits will facilitate the identification of resources and sites of 42
traditional and religious importance to tribes. 43
Results of a Class II sample survey of the SEZ designed to obtain a 44
statistically valid sample of archeological properties and their distribution 45
within the SEZ. Results from the ethnographic study and the sample 46

Final Solar PEIS 10.1-64 July 2012
inventory can be combined to project cultural sensitivity zones as an aid in 1
planning future solar developments. Identification of the integrity and 2
historical significance of the portion of the West Fork of the North Branch 3
of the Old Spanish Trail in the vicinity of the SEZ, and viewshed analyses 4
from key observation points along the Trail. If this portion of the Trail is 5
determined significant, a mitigation strategy would need to be developed 6
to address unavoidable impacts on the Trail. 7
Continuation of government-to-government consultation as described in 8
Section 2.4.3 of the Supplement to the Draft Solar PEIS and IM 2012-032 9
(BLM 2011b), including follow-up to recent ethnographic studies 10
covering some SEZs in Nevada and Utah with tribes not included in the 11
original studies to determine whether those tribes have similar concerns. 12
13
14
10.1.17.2 Impacts 15
16
Impacts on significant cultural resources are possible in the proposed Antonito Southeast 17
SEZ. The potential significance of the Taos Valley Canal, the stagecoach route, and other 18
possible historic or indigenous trail segments should be investigated further to determine whether 19
solar energy development would adversely affect these resources. Impacts on the West Fork of 20
the North Branch of the Old Spanish Trail are possible; however, further investigation is needed 21
to determine the location and integrity of portions of the Trail from which future potential 22
development in the SEZ could be viewed. Visual impacts are likely on the CTSR ACEC; 23
however, the general area is not pristine and significant development is already present in the 24
area. The assessment provided in the Draft Solar PEIS remains valid with the following update: 25
26
• Impacts on significant cultural resources and cultural landscapes associated 27
with American Latino heritage are possible throughout the San Luis Valley. 28
29
30
10.1.17.3 SEZ-Specific Design Features and Design Feature Effectiveness 31
32
Required programmatic design features that would reduce impacts on cultural resources 33
are described in Section A.2.2. of Appendix A of this Final Solar PEIS. Programmatic design 34
features will be applied to address SEZ-specific resources and conditions, for example: 35
36
• For projects in the Antonito Southeast SEZ that are located within the 37
viewshed of the West Fork of the North Branch of the Old Spanish Trail, a 38
National Trail inventory will be required to determine the area of possible 39
adverse impact on resources, qualities, values, and associated settings of 40
the Trail; to prevent substantial interference; and to determine any areas 41
unsuitable for development. Residual impacts will be avoided, minimized, 42
and/or mitigated to the extent practicable according to program policy 43
standards. Programmatic design features have been included in BLM’s 44
Solar Energy Program to address impacts in National Historic Trails (see 45
Section A.2.2.23 of Appendix A). 46

Final Solar PEIS 10.1-65 July 2012
Programmatic design features also assume that the necessary surveys, evaluations, and 1
consultations will occur. Ongoing consultation with the Colorado State Historic Preservation 2
Office (SHPO) and the appropriate Native American governments would be conducted during 3
the development of the proposed Antonito Southeast SEZ. It is likely that adverse effects on 4
significant resources in the valley could be mitigated to some degree through such efforts, 5
although not enough to eliminate the adverse effects unless a significant resource is avoided 6
entirely. 7
8
On the basis of impact analyses conducted for the Draft Solar PEIS and consideration of 9
comments received as applicable, the following SEZ-specific design features have been 10
identified: 11
12
• Development of a Memorandum of Agreement (MOA) may be needed among 13
the BLM, Colorado SHPO, and other parties, such as the Advisory Council on 14
Historic Preservation (ACHP) to address the adverse effects of solar energy 15
development on historic properties. The agreement may specify avoidance, 16
minimization, and/or mitigation measures. Should an MOA be developed to 17
resolve adverse effects on the Old Spanish National Historic Trail or the West 18
Fork of the North Branch of the Old Spanish Trail, the Trail Administration 19
for the Old Spanish Trail (BLM-NMSO and NPS Intermountain Trails Office, 20
Santa Fe) should be included in the development of that MOA. 21
22
• Additional coordination with the CTSR Commission is recommended to 23
address possible mitigation measures for reducing visual impacts on the 24
railroad. 25
26
The need for and nature of additional SEZ-specific design features will be identified 27
through the process of preparing parcels for competitive offer and subsequent project-specific 28
analysis. 29
30
31
10.1.18 Native American Concerns 32
33
34
10.1.18.1 Affected Environment 35
36
Data provided in the Draft Solar PEIS remain valid but will be supplemented in the 37
future by the results of the ethnographic study being completed in the San Luis Valley (see 38
Section 10.1.17.1). 39
40
41
10.1.18.2 Impacts 42
43
The description of potential concerns provided in the Draft Solar PEIS remains valid. 44
No direct impacts from solar energy development are likely to occur to known culturally 45
significant areas (i.e., San Luis Lakes, the Great Sand Dunes, and Blanca Peak); however, 46
Final Solar PEIS 10.1-66 July 2012
indirect visual and auditory impacts are possible. It is likely that traditional plant resources and 1
animal habitats would be directly affected with solar energy development in the proposed 2
Antonito Southeast SEZ. 3
4
5
10.1.18.3 SEZ-Specific Design Features and Design Feature Effectiveness 6
7
Required programmatic design features that would reduce impacts on Native American 8
concerns are described in Section A.2.2. of Appendix A of this Final Solar PEIS. For example, 9
impacts would be minimized through the avoidance of sacred sites, water sources, and tribally 10
important plant and animal species. Programmatic design features require that the necessary 11
surveys, evaluations, and consultations would occur. The tribes would be notified regarding the 12
results of archaeological surveys, and they would be contacted immediately upon any discovery 13
of Native American human remains and associated cultural items. 14
15
On the basis of impact analyses conducted for the Draft Solar PEIS and consideration of 16
comments received as applicable, no SEZ-specific design features to address Native American 17
concerns have been identified. The need for and nature of SEZ-specific design features would be 18
determined during government-to-government consultation with affected tribes, as part of the 19
process of preparing parcels for competitive offer and subsequent project-specific analysis. 20
Potentially significant sites and landscapes in the vicinity of the SEZ associated with Blanca 21
Peak, Great Sand Dunes, and San Luis Lakes, as well as trail systems, mountain springs, mineral 22
resources, burial sites, ceremonial areas, water resources, and plant and animal resources, should 23
be considered and discussed during consultation. 24
25
26
10.1.19 Socioeconomics 27
28
29
10.1.19.1 Affected Environment 30
31
The developable area of the proposed Antonito Southeast SEZ has changed by less than 32
1%. The socioeconomic region of influence (ROI), the area in which site employees would live 33
and spend their wages and salaries, and into which any in-migration would occur, includes the 34
same counties and communities as described in the Draft Solar PEIS, meaning that no updates 35
to the affected environment information given in the Draft Solar PEIS are required. 36
37
38
10.1.19.2 Impacts 39
40
Socioeconomic resources in the ROI around the SEZ could be affected by solar energy 41
development through the creation of direct and indirect employment and income, the generation 42
of direct sales and income taxes, SEZ acreage rental and capacity payments to BLM, the 43
in-migration of solar facility workers and their families, and impacts on local housing markets 44
and on local community service employment. Since the boundaries of the proposed Antonito 45
Southeast SEZ remain unchanged and the reduction of the developable area was small (less 46
Final Solar PEIS 10.1-67 July 2012
than 1%), the impacts for full build-out of the SEZ estimated in the Draft Solar PEIS remain 1
essentially unchanged. During construction, between 218 and 2,885 jobs and between 2
$11.6 million and $154 million in income could be associated with solar development in the 3
SEZ. During operations at full build-out, between 24 and 529 jobs and between $0.7 million and 4
$16.6 million in income could be produced. In-migration of workers and their families would 5
mean between 48 and 631 rental housing units would be needed during construction, and 6
between 7 and 134 owner-occupied units during operations. 7
8
9
10.1.19.3 SEZ-Specific Design Features and Design Feature Effectiveness 10
11
Required programmatic design features that would reduce socioeconomic impacts 12
are described in Section A.2.2. of Appendix A of this Final Solar PEIS. Implementing the 13
programmatic design features will reduce the potential for socioeconomic impacts during all 14
project phases. 15
16
On the basis of impact analyses conducted for the Draft Solar PEIS and consideration of 17
comments received as applicable, no SEZ-specific design features to address socioeconomic 18
impacts have been identified. Some SEZ-specific design features may be identified through the 19
process of preparing parcels for competitive offer and subsequent project-specific analysis. 20
21
22
10.1.20 Environmental Justice 23
24
25
10.1.20.1 Affected Environment 26
27
The data presented in the Draft Solar PEIS for the proposed Antonito Southeast SEZ have 28
not changed substantially. While there are minority populations in the Colorado or New Mexico 29
portions of the 50-mi (80-km) radius of the SEZ taken as a whole, there are no low-income 30
populations in this area (as a whole). 31
32
In the Colorado portion of the 50-mi (80-km) radius, more than 50% of the population 33
in all but one of the block groups in Conejos County consists of minority population groups, 34
together with all the block groups in adjacent Costilla County. Block groups in the cities of 35
Alamosa (Alamosa County), Monte Vista, and Del Norte (both in Rio Grande County) are also 36
more than 50% minority. In the New Mexico portion of the radius, Rio Arriba County has three 37
block groups in which the minority population is more than 20 percentage points higher than the 38
state average and one block group that is more than 50% minority. Taos County has six block 39
groups with more than 50% minority, and five block groups in the vicinity of the City of Taos 40
(Taos County) have minority populations that are 20 percentage points higher than the state 41
average. 42
43
Low-income populations in the 50-mi (80-km) radius are limited to two block groups in 44
the Colorado portion in the cities of San Luis (Costilla County) and Alamosa, both of which have 45
low-income population shares that are more than 20 percentage points higher than the state 46
Final Solar PEIS 10.1-68 July 2012
average. Figure 10.1.20.1-1 shows the locations of the low-income population groups within the 1
50-mi (80-km) radius of the SEZ. 2
3
4
10.1.20.2 Impacts 5
6
Potential impacts (e.g., from noise and dust during construction and operations, visual 7
impacts, cultural impacts, and effects on property values) on low-income and minority 8
populations could be incurred as a result of the construction and operation of solar facilities 9
involving each of the four technologies. Although impacts are likely to be small, there are 10
minority populations defined by Council on Environmental Quality (CEQ) guidelines 11
(CEQ 1997) (see Section 10.1.20.1 of the Draft Solar PEIS) within the 50-mi (80-km) radius 12
around the boundary of the SEZ. This means that any adverse impacts of solar projects could 13
disproportionately affect minority populations. Further analysis of these impacts would be 14
included in subsequent National Environmental Policy Act of 1969 (NEPA) reviews of 15
individual solar projects. Because there are no low-income populations within the 50-mi 16
(80-km) radius as a whole, there would not be impacts on low-income populations. 17
18
19
10.1.20.3 SEZ-Specific Design Features and Design Feature Effectiveness 20
21
Required programmatic design features that would reduce potential environmental justice 22
impacts are described in Section A.2.2 of Appendix A of this Final Solar PEIS. Implementing the 23
programmatic design features will reduce the potential for environmental justice impacts. 24
25
On the basis of impact analyses conducted for the Draft Solar PEIS and consideration of 26
comments received as applicable, no SEZ-specific design features for environmental justice have 27
been identified. Some SEZ-specific design features may be identified through the process of 28
preparing parcels for competitive offer and subsequent project-specific analysis. 29
30
31
10.1.21 Transportation 32
33
34
10.1.21.1 Affected Environment 35
36
The reduction in developable area of the proposed Antonito Southeast SEZ of less than 37
1% does not change the information on affected environment for transportation provided in the 38
Draft Solar PEIS. 39 40
41
10.1.21.2 Impacts 42
43 As stated in the Draft Solar PEIS, the primary transportation impacts are anticipated 44
to be from commuting worker traffic. U.S. 285 provides a regional traffic corridor that could 45
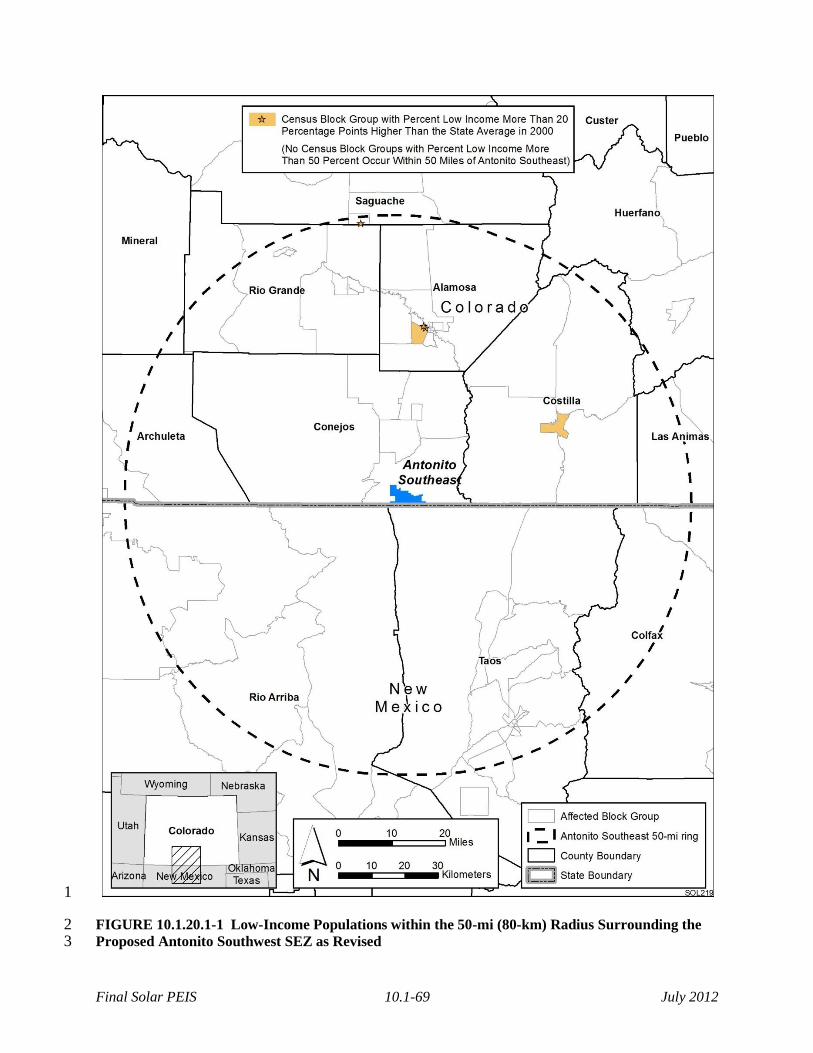
Final Solar PEIS 10.1-69 July 2012
1
FIGURE 10.1.20.1-1 Low-Income Populations within the 50-mi (80-km) Radius Surrounding the 2 Proposed Antonito Southwest SEZ as Revised 3
Final Solar PEIS 10.1-70 July 2012
experience moderate impacts for single projects that may have up to 1,000 daily workers with an 1
additional 2,000 vehicle trips per day (maximum), an increase nearly twice the current annual 2
average daily traffic (AADT) value for this route. In addition, local road improvements would be 3
necessary in any portion of the SEZ that might be developed so as not to overwhelm the local 4
roads near any site access point(s). 5
6
Solar development within the SEZ would affect public access along off-highway vehicle 7
(OHV) routes that are designated open and available for public use. Although open routes 8
crossing areas granted rights-of-way (ROWs) for solar facilities could be redesignated as closed 9
(see Section 5.5.1 of the Draft Solar PEIS), a programmatic design feature has been included 10
under Recreation (Section A.2.2.6.1 of Appendix A) that requires consideration of replacement 11
of lost OHV route acreage and of access across and to public lands. 12
13
14
10.1.21.3 SEZ-Specific Design Features and Design Feature Effectiveness 15
16
Required programmatic design features that would reduce transportation impacts are 17
described in Section A.2.2. of Appendix A of this Final Solar PEIS. The programmatic design 18
features, including local road improvements, multiple site access locations, staggered work 19
schedules, and ride-sharing, will all provide some relief to traffic congestion on local roads 20
leading to the SEZ. Depending on the location of solar facilities within the SEZ, more specific 21
access locations and local road improvements could be implemented. 22
23
On the basis of impact analyses conducted for the Draft Solar PEIS and consideration of 24
comments received as applicable, no SEZ-specific design features to address transportation have 25
been identified. Some SEZ-specific design features may be identified through the process of 26
preparing parcels for competitive offer and subsequent project-specific analysis. 27
28
29
10.1.22 Cumulative Impacts 30
31
The analysis of potential impacts in the vicinity of the proposed Antonito Southeast SEZ 32
presented in the Draft Solar PEIS is still generally applicable for this Final Solar PEIS. The 33
following sections include an update to the information presented in the Draft Solar PEIS 34
regarding cumulative effects for the proposed Antonito Southeast SEZ. 35
36
37
10.1.22.1 Geographic Extent of the Cumulative Impact Analysis 38
39
The geographic extent of the cumulative impact analysis has not changed. The extent 40
varies on the basis of the nature of the resource being evaluated and the distance at which an 41
impact may occur (thus, e.g., air quality impacts may have a greater regional extent than visual 42
resource impacts). Lands around the SEZ are privately owned, administered by the U.S. Forest 43
Service (USFS), or administered by the BLM. The BLM administers approximately 11% of the 44
lands within a 50-mi (80-km) radius of the SEZ. 45

Final Solar PEIS 10.1-71 July 2012
10.1.22.2 Overview of Ongoing and Reasonably Foreseeable Future Actions 1
2
The Draft Solar PEIS included three other proposed SEZs in Colorado: Fourmile East, 3
DeTilla Gulch, and Los Mogotes East. All of these proposed SEZs are being carried forward to 4
the Final Solar PEIS; the areas of the De Tilla Gulch, Fourmile East, and Los Mogotes East 5
SEZs have been decreased. 6
7
The ongoing and reasonably foreseeable future actions described below are grouped into 8
two categories: (1) actions that relate to energy production and distribution and (2) other ongoing 9
and reasonably foreseeable actions, including those related to mining and mineral processing, 10
grazing management, transportation, recreation, water management, and conservation 11
(Section 10.1.22.2.2). Together, these actions and trends have the potential to affect human and 12
environmental receptors within the geographic range of potential impacts over the next 20 years. 13
14
15
10.1.22.2.1 Energy Production and Distribution 16
17
The list of reasonably foreseeable future actions near the proposed Antonito Southeast 18
SEZ has been updated and is presented in Table 10.1.22.2-1. Projects listed in the table are 19
shown in Figure 10.1.22.2-1. 20
21
Xcel Energy (Public Service Company of Colorado) has submitted a transmission 22
planning report to the Colorado Public Utility Commission stating that it intends to end its 23
involvement in the proposed San Luis Valley Calumet-Comanche Transmission Project 24
(Heide 2011). The project itself has not been cancelled. 25
26
27
10.1.22.2.2 Other Actions 28
29
None of the major ongoing and foreseeable actions within 50 mi (80 km) of the proposed 30
Antonito Southeast SEZ that were listed in Table 10.1.22.2-3 of the Draft Solar PEIS have had a 31
change in their status. An additional mining and mineral processing activity is the Taos Gravel 32
Products Torres Pit, a subsurface sand and gravel products mining activity in Taos County, 33
New Mexico, approximately 35 mi (56 km) south of the SEZ. The existing Torres Pit occupies 34
51 acres (0.21 km2), and it is proposed to extend the mining operation on 84 acres (0.34 km2), all 35
privately owned land. Water is used only for fugitive dust control and is provided by an on-site 36
well (BLM 2011c). 37
38
39
10.1.22.3 General Trends 40
41
The information on general trends presented in the Draft Solar PEIS remains valid. 42
43
44
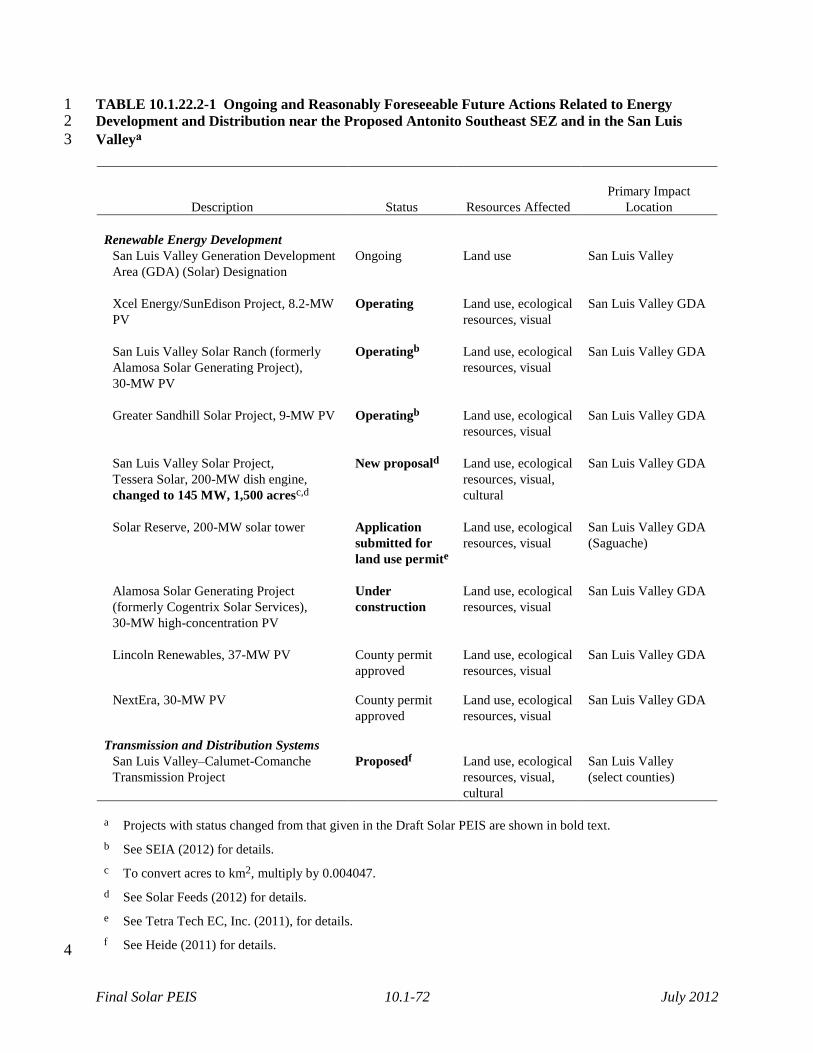
Final Solar PEIS 10.1-72 July 2012
TABLE 10.1.22.2-1 Ongoing and Reasonably Foreseeable Future Actions Related to Energy 1 Development and Distribution near the Proposed Antonito Southeast SEZ and in the San Luis 2
Valleya 3
Description
Status
Resources Affected
Primary Impact
Location
Renewable Energy Development
San Luis Valley Generation Development
Area (GDA) (Solar) Designation
Ongoing Land use San Luis Valley
Xcel Energy/SunEdison Project, 8.2-MW
PV
Operating
Land use, ecological
resources, visual
San Luis Valley GDA
San Luis Valley Solar Ranch (formerly
Alamosa Solar Generating Project),
30-MW PV
Operatingb Land use, ecological
resources, visual
San Luis Valley GDA
Greater Sandhill Solar Project, 9-MW PV Operatingb Land use, ecological
resources, visual
San Luis Valley GDA
San Luis Valley Solar Project,
Tessera Solar, 200-MW dish engine,
changed to 145 MW, 1,500 acresc,d
New proposald Land use, ecological
resources, visual,
cultural
San Luis Valley GDA
Solar Reserve, 200-MW solar tower Application
submitted for
land use permite
Land use, ecological
resources, visual
San Luis Valley GDA
(Saguache)
Alamosa Solar Generating Project
(formerly Cogentrix Solar Services),
30-MW high-concentration PV
Under
construction
Land use, ecological
resources, visual
San Luis Valley GDA
Lincoln Renewables, 37-MW PV County permit
approved
Land use, ecological
resources, visual
San Luis Valley GDA
NextEra, 30-MW PV County permit
approved
Land use, ecological
resources, visual
San Luis Valley GDA
Transmission and Distribution Systems
San Luis Valley–Calumet-Comanche
Transmission Project
Proposedf Land use, ecological
resources, visual,
cultural
San Luis Valley
(select counties)
a Projects with status changed from that given in the Draft Solar PEIS are shown in bold text.
b See SEIA (2012) for details.
c To convert acres to km2, multiply by 0.004047.
d See Solar Feeds (2012) for details.
e See Tetra Tech EC, Inc. (2011), for details.
f See Heide (2011) for details. 4
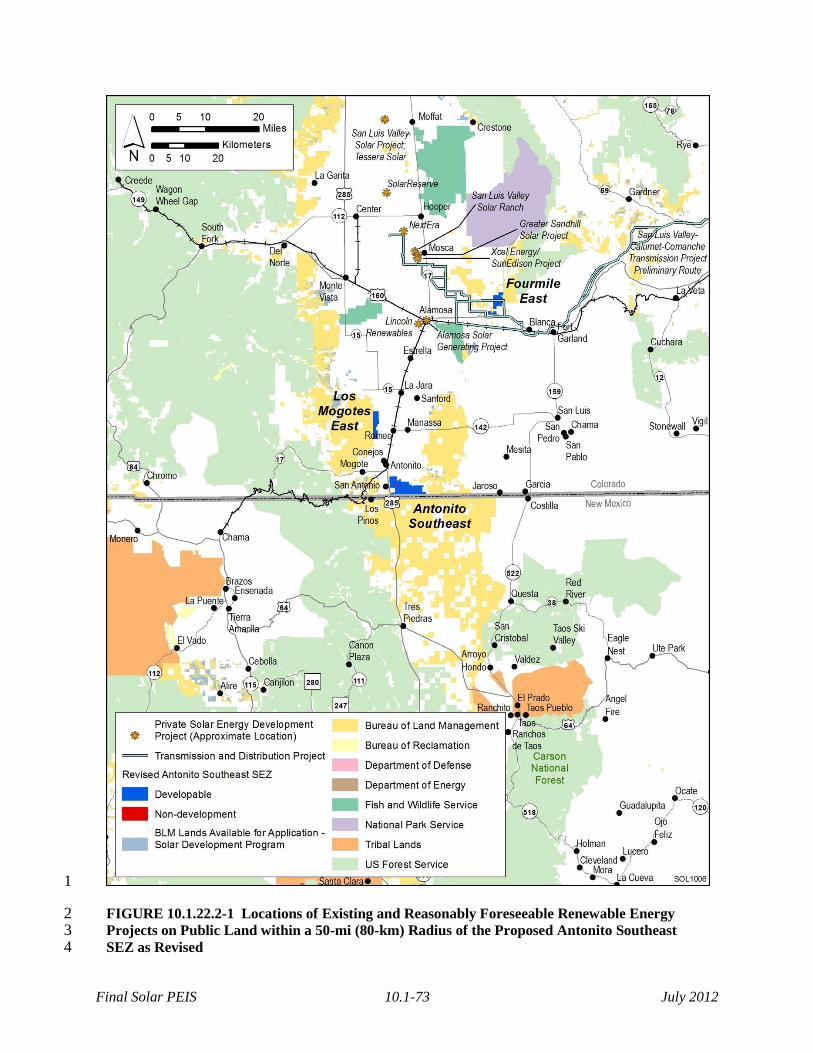
Final Solar PEIS 10.1-73 July 2012
1
FIGURE 10.1.22.2-1 Locations of Existing and Reasonably Foreseeable Renewable Energy 2 Projects on Public Land within a 50-mi (80-km) Radius of the Proposed Antonito Southeast 3 SEZ as Revised 4
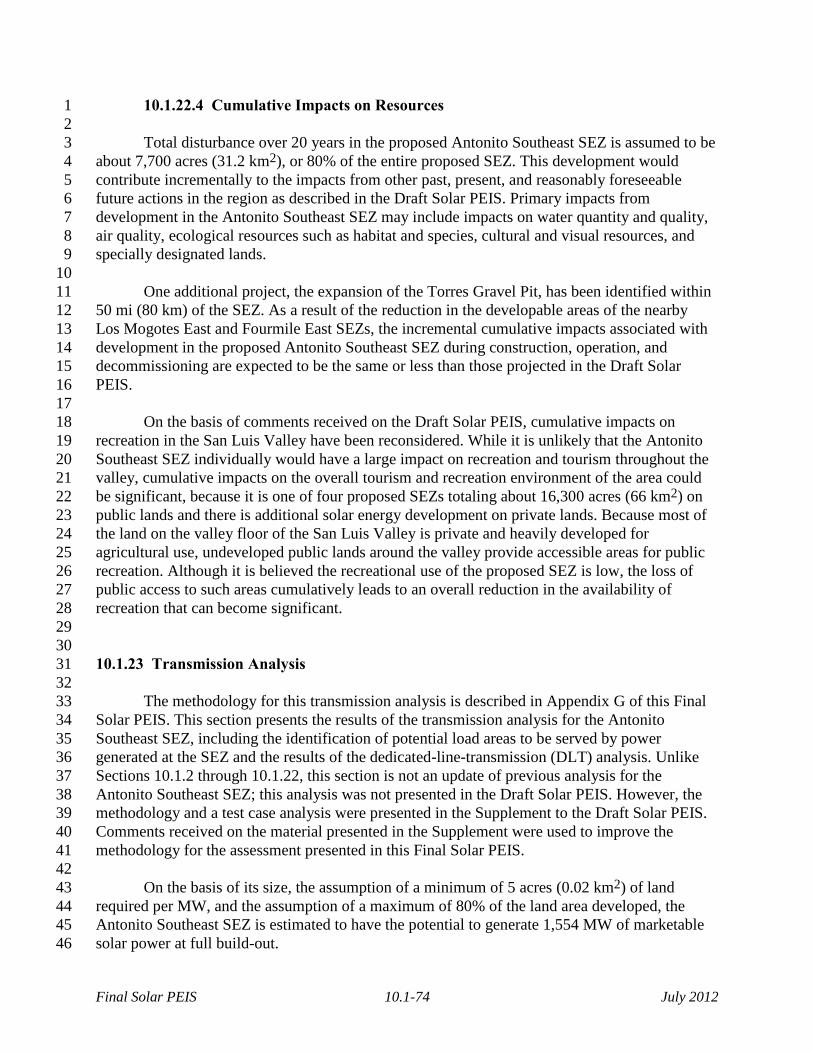
Final Solar PEIS 10.1-74 July 2012
10.1.22.4 Cumulative Impacts on Resources 1
2
Total disturbance over 20 years in the proposed Antonito Southeast SEZ is assumed to be 3
about 7,700 acres (31.2 km2), or 80% of the entire proposed SEZ. This development would 4
contribute incrementally to the impacts from other past, present, and reasonably foreseeable 5
future actions in the region as described in the Draft Solar PEIS. Primary impacts from 6
development in the Antonito Southeast SEZ may include impacts on water quantity and quality, 7
air quality, ecological resources such as habitat and species, cultural and visual resources, and 8
specially designated lands. 9
10
One additional project, the expansion of the Torres Gravel Pit, has been identified within 11
50 mi (80 km) of the SEZ. As a result of the reduction in the developable areas of the nearby 12
Los Mogotes East and Fourmile East SEZs, the incremental cumulative impacts associated with 13
development in the proposed Antonito Southeast SEZ during construction, operation, and 14
decommissioning are expected to be the same or less than those projected in the Draft Solar 15
PEIS. 16
17
On the basis of comments received on the Draft Solar PEIS, cumulative impacts on 18
recreation in the San Luis Valley have been reconsidered. While it is unlikely that the Antonito 19
Southeast SEZ individually would have a large impact on recreation and tourism throughout the 20
valley, cumulative impacts on the overall tourism and recreation environment of the area could 21
be significant, because it is one of four proposed SEZs totaling about 16,300 acres (66 km2) on 22
public lands and there is additional solar energy development on private lands. Because most of 23
the land on the valley floor of the San Luis Valley is private and heavily developed for 24
agricultural use, undeveloped public lands around the valley provide accessible areas for public 25
recreation. Although it is believed the recreational use of the proposed SEZ is low, the loss of 26
public access to such areas cumulatively leads to an overall reduction in the availability of 27
recreation that can become significant. 28
29
30
10.1.23 Transmission Analysis 31
32
The methodology for this transmission analysis is described in Appendix G of this Final 33
Solar PEIS. This section presents the results of the transmission analysis for the Antonito 34
Southeast SEZ, including the identification of potential load areas to be served by power 35
generated at the SEZ and the results of the dedicated-line-transmission (DLT) analysis. Unlike 36
Sections 10.1.2 through 10.1.22, this section is not an update of previous analysis for the 37
Antonito Southeast SEZ; this analysis was not presented in the Draft Solar PEIS. However, the 38
methodology and a test case analysis were presented in the Supplement to the Draft Solar PEIS. 39
Comments received on the material presented in the Supplement were used to improve the 40
methodology for the assessment presented in this Final Solar PEIS. 41
42
On the basis of its size, the assumption of a minimum of 5 acres (0.02 km2) of land 43
required per MW, and the assumption of a maximum of 80% of the land area developed, the 44
Antonito Southeast SEZ is estimated to have the potential to generate 1,554 MW of marketable 45
solar power at full build-out. 46
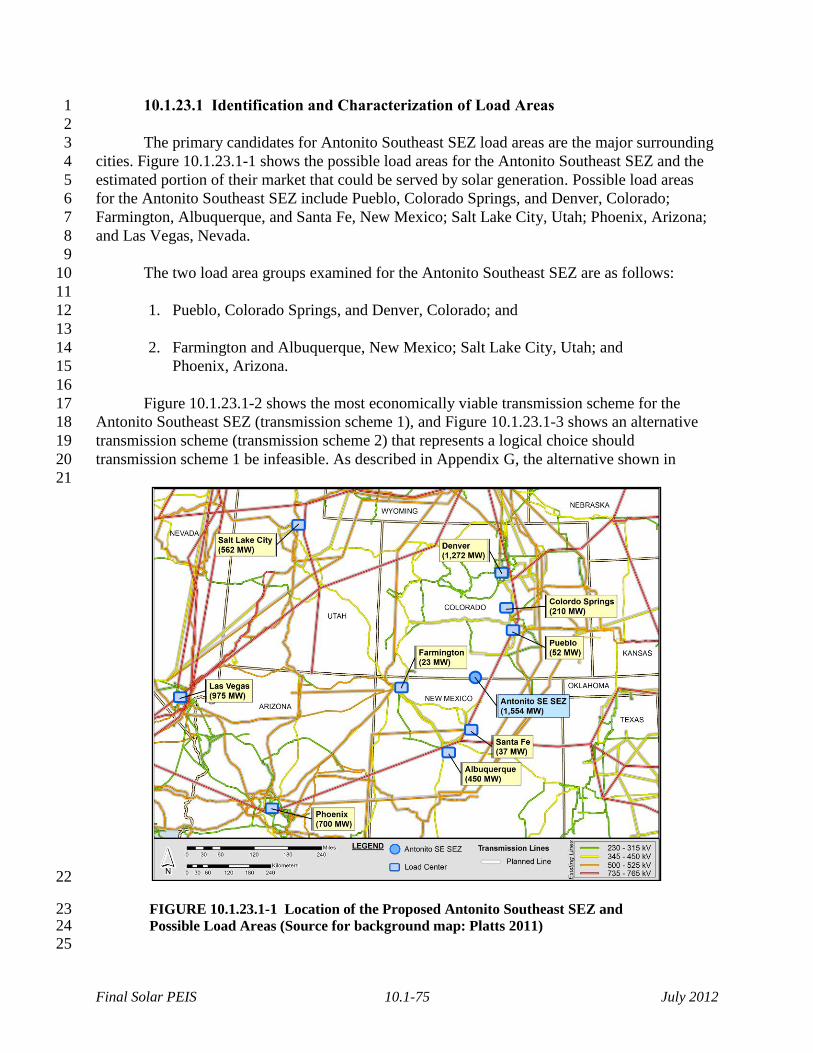
Final Solar PEIS 10.1-75 July 2012
10.1.23.1 Identification and Characterization of Load Areas 1
2
The primary candidates for Antonito Southeast SEZ load areas are the major surrounding 3
cities. Figure 10.1.23.1-1 shows the possible load areas for the Antonito Southeast SEZ and the 4
estimated portion of their market that could be served by solar generation. Possible load areas 5
for the Antonito Southeast SEZ include Pueblo, Colorado Springs, and Denver, Colorado; 6
Farmington, Albuquerque, and Santa Fe, New Mexico; Salt Lake City, Utah; Phoenix, Arizona; 7
and Las Vegas, Nevada. 8
9
The two load area groups examined for the Antonito Southeast SEZ are as follows: 10
11
1. Pueblo, Colorado Springs, and Denver, Colorado; and 12
13
2. Farmington and Albuquerque, New Mexico; Salt Lake City, Utah; and 14
Phoenix, Arizona. 15
16
Figure 10.1.23.1-2 shows the most economically viable transmission scheme for the 17
Antonito Southeast SEZ (transmission scheme 1), and Figure 10.1.23.1-3 shows an alternative 18
transmission scheme (transmission scheme 2) that represents a logical choice should 19
transmission scheme 1 be infeasible. As described in Appendix G, the alternative shown in 20
21
22
FIGURE 10.1.23.1-1 Location of the Proposed Antonito Southeast SEZ and 23 Possible Load Areas (Source for background map: Platts 2011) 24
25

Final Solar PEIS 10.1-76 July 2012
1
FIGURE 10.1.23.1-2 Transmission Scheme 1 for the Proposed Antonito 2 Southeast SEZ (Source for background map: Platts 2011) 3
4
5
transmission scheme 2 represents the optimum choice if one or more of the primary linkages in 6
transmission scheme 1 are excluded from consideration. The groups provide for linking loads 7
along alternative routes so that the SEZ’s output of 1,554 MW could be fully allocated. 8
9
Table 10.1.23.1-1 summarizes and groups the load areas according to their associated 10
transmission scheme and provides details on how the megawatt load for each area was estimated. 11
12
13
10.1.23.2 Findings for the DLT Analysis 14
15
The DLT analysis approach assumes that the Antonito Southeast SEZ will require all new 16
construction for transmission lines (i.e., dedicated lines) and substations. The new transmission 17
lines(s) would be designed to be able to directly convey the 1,554-MW output of the Antonito 18
Southeast SEZ to the prospective load areas for each possible transmission scheme. Note that the 19
combined solar market for the Pueblo, Colorado Springs, and Denver region during the initial 20
year is only about 1,534 MW (or about 20 MW short of the SEZ’s maximum output). However, 21
the total load of the region is projected to grow to 1,559 MW by the second year of the study 22
period, assuming a population load growth of 2% a year. Thus by the second year, the Denver 23
region should be able to absorb all of the SEZ’s maximum power output. The approach also 24
assumes that all existing transmission lines in the Western Electricity Coordinating Council 25
26
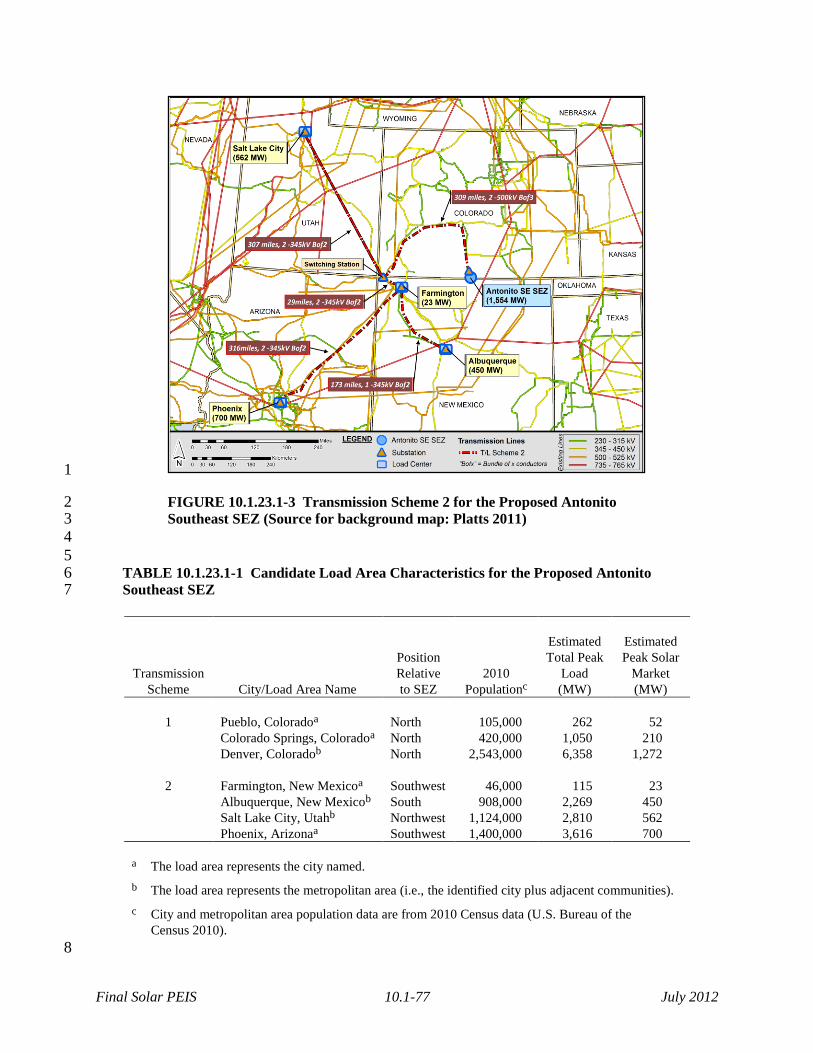
Final Solar PEIS 10.1-77 July 2012
1
FIGURE 10.1.23.1-3 Transmission Scheme 2 for the Proposed Antonito 2 Southeast SEZ (Source for background map: Platts 2011) 3
4
5 TABLE 10.1.23.1-1 Candidate Load Area Characteristics for the Proposed Antonito 6 Southeast SEZ 7
Transmission
Scheme City/Load Area Name
Position
Relative
to SEZ
2010
Populationc
Estimated
Total Peak
Load
(MW)
Estimated
Peak Solar
Market
(MW)
1 Pueblo, Coloradoa North 105,000 262 52
Colorado Springs, Coloradoa North 420,000 1,050 210
Denver, Coloradob North 2,543,000 6,358 1,272
2 Farmington, New Mexicoa Southwest 46,000 115 23
Albuquerque, New Mexicob South 908,000 2,269 450
Salt Lake City, Utahb Northwest 1,124,000 2,810 562
Phoenix, Arizonaa Southwest 1,400,000 3,616 700
a The load area represents the city named.
b The load area represents the metropolitan area (i.e., the identified city plus adjacent communities).
c City and metropolitan area population data are from 2010 Census data (U.S. Bureau of the
Census 2010).
8
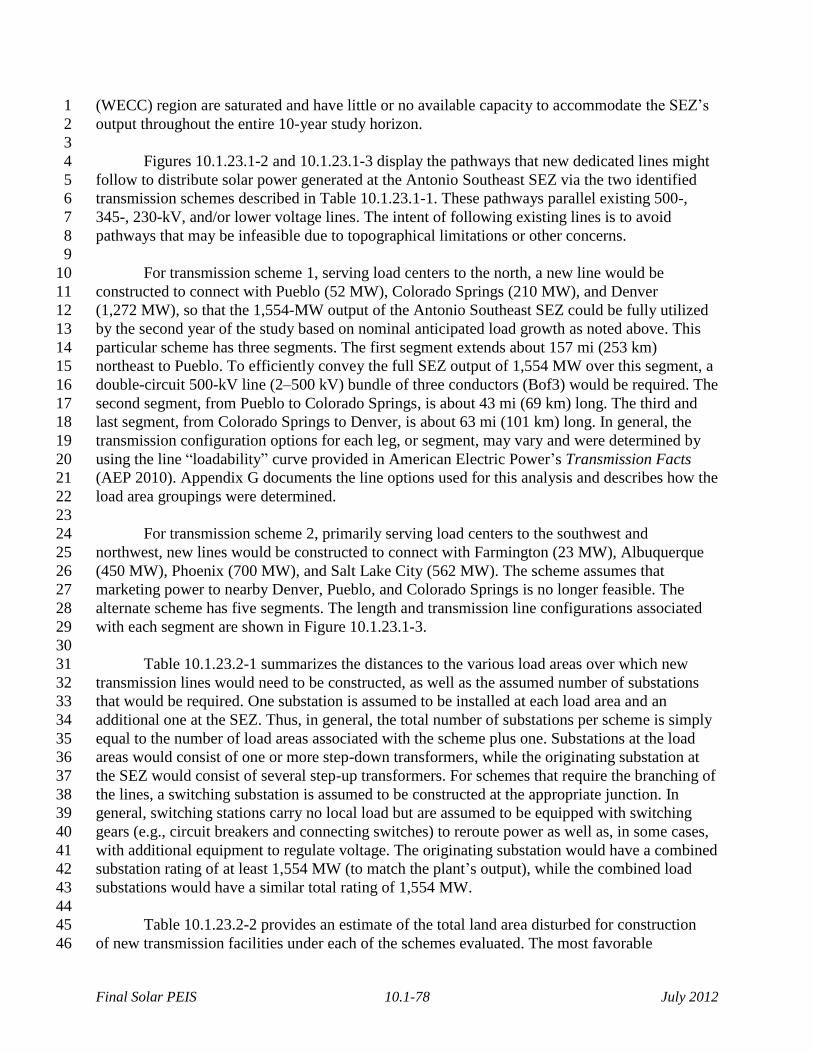
Final Solar PEIS 10.1-78 July 2012
(WECC) region are saturated and have little or no available capacity to accommodate the SEZ’s 1
output throughout the entire 10-year study horizon. 2
3
Figures 10.1.23.1-2 and 10.1.23.1-3 display the pathways that new dedicated lines might 4
follow to distribute solar power generated at the Antonio Southeast SEZ via the two identified 5
transmission schemes described in Table 10.1.23.1-1. These pathways parallel existing 500-, 6
345-, 230-kV, and/or lower voltage lines. The intent of following existing lines is to avoid 7
pathways that may be infeasible due to topographical limitations or other concerns. 8
9
For transmission scheme 1, serving load centers to the north, a new line would be 10
constructed to connect with Pueblo (52 MW), Colorado Springs (210 MW), and Denver 11
(1,272 MW), so that the 1,554-MW output of the Antonio Southeast SEZ could be fully utilized 12
by the second year of the study based on nominal anticipated load growth as noted above. This 13
particular scheme has three segments. The first segment extends about 157 mi (253 km) 14
northeast to Pueblo. To efficiently convey the full SEZ output of 1,554 MW over this segment, a 15
double-circuit 500-kV line (2–500 kV) bundle of three conductors (Bof3) would be required. The 16
second segment, from Pueblo to Colorado Springs, is about 43 mi (69 km) long. The third and 17
last segment, from Colorado Springs to Denver, is about 63 mi (101 km) long. In general, the 18
transmission configuration options for each leg, or segment, may vary and were determined by 19
using the line “loadability” curve provided in American Electric Power’s Transmission Facts 20
(AEP 2010). Appendix G documents the line options used for this analysis and describes how the 21
load area groupings were determined. 22
23
For transmission scheme 2, primarily serving load centers to the southwest and 24
northwest, new lines would be constructed to connect with Farmington (23 MW), Albuquerque 25
(450 MW), Phoenix (700 MW), and Salt Lake City (562 MW). The scheme assumes that 26
marketing power to nearby Denver, Pueblo, and Colorado Springs is no longer feasible. The 27
alternate scheme has five segments. The length and transmission line configurations associated 28
with each segment are shown in Figure 10.1.23.1-3. 29
30
Table 10.1.23.2-1 summarizes the distances to the various load areas over which new 31
transmission lines would need to be constructed, as well as the assumed number of substations 32
that would be required. One substation is assumed to be installed at each load area and an 33
additional one at the SEZ. Thus, in general, the total number of substations per scheme is simply 34
equal to the number of load areas associated with the scheme plus one. Substations at the load 35
areas would consist of one or more step-down transformers, while the originating substation at 36
the SEZ would consist of several step-up transformers. For schemes that require the branching of 37
the lines, a switching substation is assumed to be constructed at the appropriate junction. In 38
general, switching stations carry no local load but are assumed to be equipped with switching 39
gears (e.g., circuit breakers and connecting switches) to reroute power as well as, in some cases, 40
with additional equipment to regulate voltage. The originating substation would have a combined 41
substation rating of at least 1,554 MW (to match the plant’s output), while the combined load 42
substations would have a similar total rating of 1,554 MW. 43
44
Table 10.1.23.2-2 provides an estimate of the total land area disturbed for construction 45
of new transmission facilities under each of the schemes evaluated. The most favorable 46
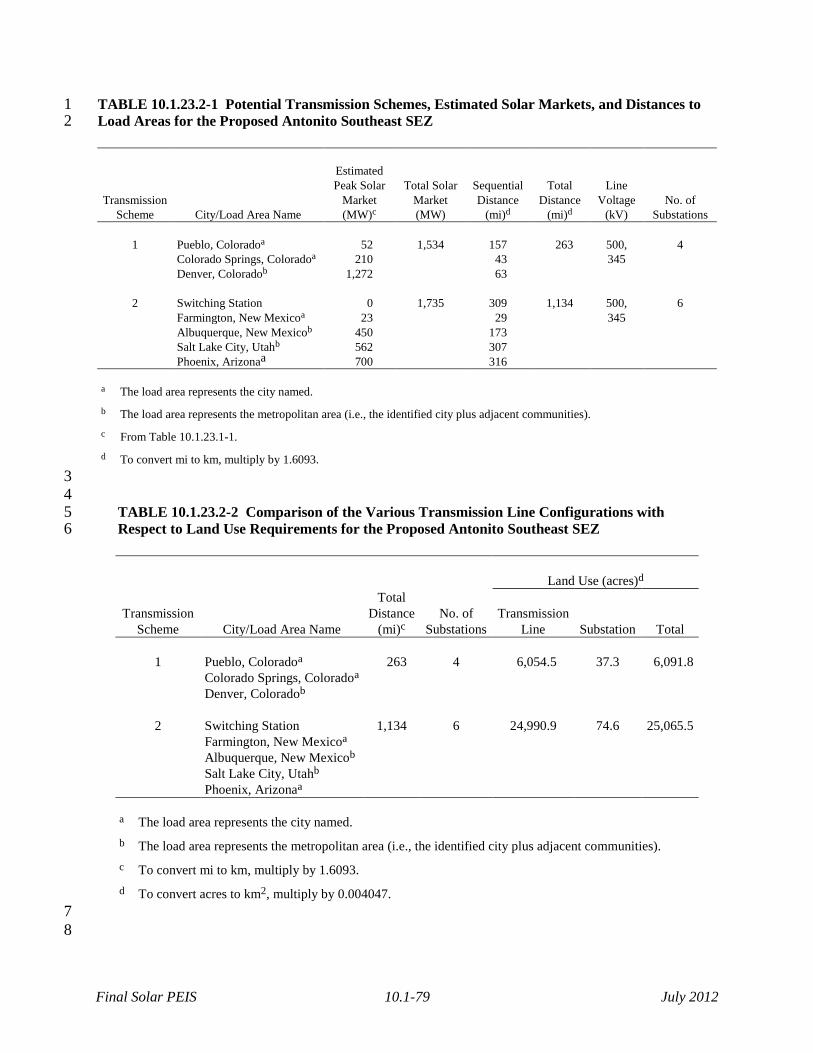
Final Solar PEIS 10.1-79 July 2012
TABLE 10.1.23.2-1 Potential Transmission Schemes, Estimated Solar Markets, and Distances to 1 Load Areas for the Proposed Antonito Southeast SEZ 2
Transmission
Scheme City/Load Area Name
Estimated
Peak Solar
Market
(MW)c
Total Solar
Market
(MW)
Sequential
Distance
(mi)d
Total
Distance
(mi)d
Line
Voltage
(kV)
No. of
Substations
1 Pueblo, Coloradoa 52 1,534 157 263 500,
345
4
Colorado Springs, Coloradoa 210 43
Denver, Coloradob 1,272 63
2 Switching Station 0 1,735 309 1,134 500,
345
6
Farmington, New Mexicoa 23 29
Albuquerque, New Mexicob 450 173
Salt Lake City, Utahb 562 307
Phoenix, Arizonaa 700 316
a The load area represents the city named.
b The load area represents the metropolitan area (i.e., the identified city plus adjacent communities).
c From Table 10.1.23.1-1.
d To convert mi to km, multiply by 1.6093.
3
4 TABLE 10.1.23.2-2 Comparison of the Various Transmission Line Configurations with 5 Respect to Land Use Requirements for the Proposed Antonito Southeast SEZ 6
Land Use (acres)d
Transmission
Scheme City/Load Area Name
Total
Distance
(mi)c
No. of
Substations
Transmission
Line Substation Total
1 Pueblo, Coloradoa 263 4 6,054.5 37.3 6,091.8
Colorado Springs, Coloradoa
Denver, Coloradob
2 Switching Station 1,134 6 24,990.9 74.6 25,065.5
Farmington, New Mexicoa
Albuquerque, New Mexicob
Salt Lake City, Utahb
Phoenix, Arizonaa
a The load area represents the city named.
b The load area represents the metropolitan area (i.e., the identified city plus adjacent communities).
c To convert mi to km, multiply by 1.6093.
d To convert acres to km2, multiply by 0.004047.
7
8

Final Solar PEIS 10.1-80 July 2012
transmission scheme with respect to minimizing the costs and area disturbed would be scheme 1, 1
which would serve the Pueblo, Colorado Springs, and Denver markets and for which the 2
construction of new transmission lines and substations is estimated to disturb about 6,092 acres 3
(24.7 km2) of land. The less favorable transmission scheme with respect to minimizing the costs 4
and area disturbed would be scheme 2. For scheme 2, the construction of new transmission lines 5
and substations is estimated to disturb a land area on the order of 25,066 acres (101.4 km2). 6
7
Table 10.1.23.2-3 shows the estimated net present value (NPV) of both transmission 8
schemes and takes into account the cost of constructing the lines, the substations, and the 9
projected revenue stream over the 10-year horizon. A positive NPV indicates that revenues more 10
than offset investments. This calculation does not include the cost of producing electricity. 11
12
The most economically attractive configuration (transmission scheme 1) has the highest 13
positive NPV and serves the Colorado cities of Pueblo, Colorado Springs, and Denver. The 14
secondary case (transmission scheme 2), which excludes one or more of the primary pathways 15
used in scheme 1, is less economically attractive and focuses on delivering power to the cities of 16
Farmington, Albuquerque, Phoenix, and Salt Lake City. 17
18
Table 10.1.23.2-4 shows the effect of varying the value of the utilization factor on the 19
NPV of the transmission schemes. The table shows that at about 40% utilization, the NPVs for 20
both schemes are positive. It also shows that as the utilization factor is increased, the economic 21
viability of the lines also increases. Utilization factors can be raised by allowing the new 22
dedicated lines to market other power generation outputs in the region in addition to that of its 23
associated SEZ. 24
25
26 TABLE 10.1.23.2-3 Comparison of Potential Transmission Lines with Respect to NPV (Base Case) 27 for the Proposed Antonito Southeast SEZ 28
Transmission
Scheme City/Load Area Name
Present Value
Transmission
Line Cost
($ million)
Present Value
Substation
Cost
($ million)
Annual
Sales
Revenue
($ million)
Present
Worth of
Revenue
Stream
($ million)
NPV
($ million)
1 Pueblo, Coloradoa 951.9 102.6 272.3 2,102.3 1,047.9
Colorado Springs, Coloradoa
Denver, Coloradob
2 Switching Station 3,362.5 205.1 272.3 2,102.3 –1,465.3
Farmington, New Mexicoa
Albuquerque, New Mexicob
Salt Lake City, Utahb
a The load area represents the city named.
b The load area represents the metropolitan area (i.e., the identified city plus adjacent communities).
29
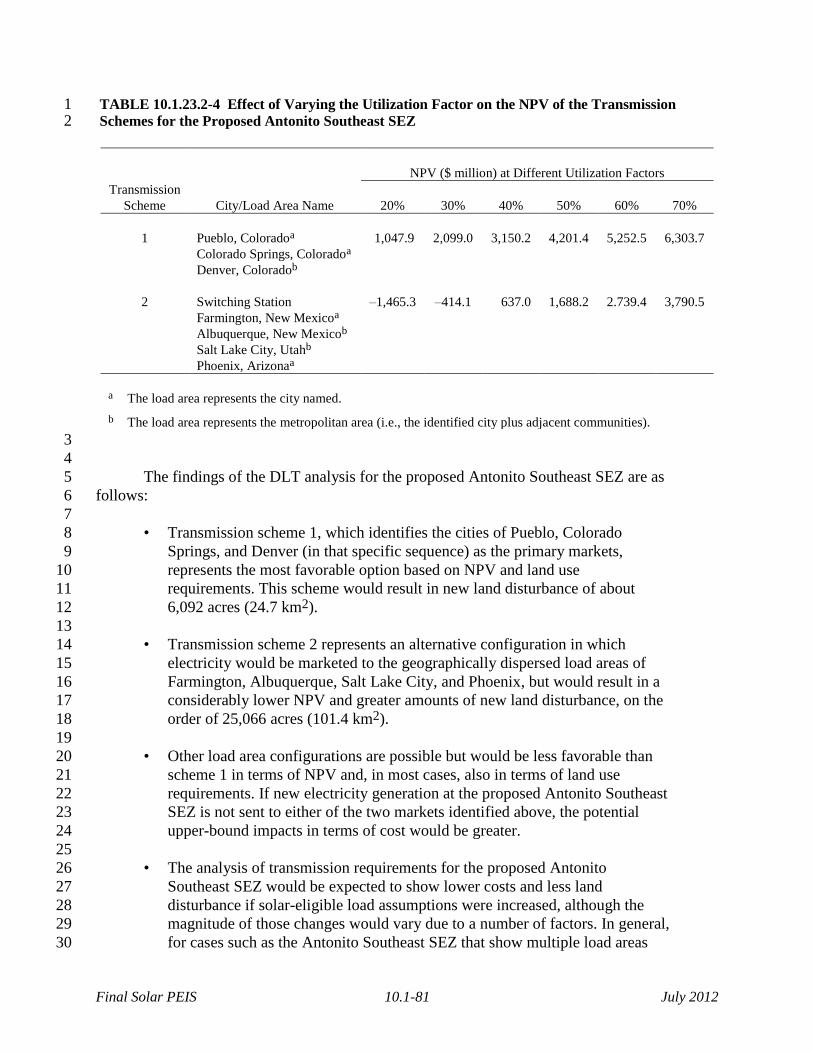
Final Solar PEIS 10.1-81 July 2012
TABLE 10.1.23.2-4 Effect of Varying the Utilization Factor on the NPV of the Transmission 1 Schemes for the Proposed Antonito Southeast SEZ 2
Transmission
Scheme City/Load Area Name
NPV ($ million) at Different Utilization Factors
20%
30%
40%
50%
60%
70%
1 Pueblo, Coloradoa 1,047.9 2,099.0 3,150.2 4,201.4 5,252.5 6,303.7
Colorado Springs, Coloradoa
Denver, Coloradob
2 Switching Station –1,465.3 –414.1 637.0 1,688.2 2.739.4 3,790.5
Farmington, New Mexicoa
Albuquerque, New Mexicob
Salt Lake City, Utahb
Phoenix, Arizonaa
a The load area represents the city named.
b The load area represents the metropolitan area (i.e., the identified city plus adjacent communities).
3
4
The findings of the DLT analysis for the proposed Antonito Southeast SEZ are as 5
follows: 6
7
• Transmission scheme 1, which identifies the cities of Pueblo, Colorado 8
Springs, and Denver (in that specific sequence) as the primary markets, 9
represents the most favorable option based on NPV and land use 10
requirements. This scheme would result in new land disturbance of about 11
6,092 acres (24.7 km2). 12
13
• Transmission scheme 2 represents an alternative configuration in which 14
electricity would be marketed to the geographically dispersed load areas of 15
Farmington, Albuquerque, Salt Lake City, and Phoenix, but would result in a 16
considerably lower NPV and greater amounts of new land disturbance, on the 17
order of 25,066 acres (101.4 km2). 18
19
• Other load area configurations are possible but would be less favorable than 20
scheme 1 in terms of NPV and, in most cases, also in terms of land use 21
requirements. If new electricity generation at the proposed Antonito Southeast 22
SEZ is not sent to either of the two markets identified above, the potential 23
upper-bound impacts in terms of cost would be greater. 24
25
• The analysis of transmission requirements for the proposed Antonito 26
Southeast SEZ would be expected to show lower costs and less land 27
disturbance if solar-eligible load assumptions were increased, although the 28
magnitude of those changes would vary due to a number of factors. In general, 29
for cases such as the Antonito Southeast SEZ that show multiple load areas 30
Final Solar PEIS 10.1-82 July 2012
being served to accommodate the specified capacity, the estimated costs and 1
land disturbance would be affected by increasing the solar-eligible load 2
assumption. By increasing the eligible loads at all load areas, the transmission 3
routing and configuration solutions can take advantage of shorter line 4
distances and deliveries to fewer load areas, thus reducing costs and land 5
disturbed. In general, SEZs that show the greatest number of load areas served 6
and greatest distances required for new transmission lines (e.g., Riverside 7
East) would show the greatest decrease in impacts as a result of increasing the 8
solar-eligible load assumption from 20% to a higher percentage. 9
10
11
10.1.24 Impacts of the Withdrawal 12
13
The BLM is proposing to withdraw 9,729 acres (39 km2) of public land comprising the 14
proposed Antonito Southeast SEZ from settlement, sale, location, or entry under the general land 15
laws, including the mining laws, for a period of 20 years (see Section 2.2.2.2.4 of the Final Solar 16
PEIS). The public lands would be withdrawn, subject to valid existing rights, from settlement, 17
sale, location, or entry under the general land laws, including the mining laws. This means that 18
the lands could not be appropriated, sold, or exchanged during the term of the withdrawal, and 19
new mining claims could not be filed on the withdrawn lands. Mining claims filed prior to the 20
segregation or withdrawal of the identified lands would take precedence over future solar energy 21
development. The withdrawn lands would remain open to the mineral leasing, geothermal 22
leasing, and mineral material laws, and the BLM could elect to lease the oil, gas, coal, or 23
geothermal steam resources, or to sell common-variety mineral materials, such as sand and 24
gravel, contained in the withdrawn lands. In addition, the BLM would retain the discretion to 25
authorize linear and renewable energy ROWs on the withdrawn lands. 26
27
The purpose of the proposed land withdrawal is to minimize the potential for conflicts 28
between mineral development and solar energy development for the proposed 20-year 29
withdrawal period. Under the land withdrawal, there would be no mining-related surface 30
development, such as the establishment of open pit mining, construction of roads for hauling 31
materials, extraction of ores from tunnels or adits, or construction of facilities to process the 32
material mined, that could preclude use of the SEZ for solar energy development. For the 33
Antonito Southeast SEZ, the impacts of the proposed withdrawal on mineral resources and 34
related economic activity and employment are expected to be negligible because the mineral 35
potential of the lands within the SEZ is low (BLM 2012). There has been no documented mining 36
within the SEZ, and there are no known locatable mineral deposits within the land withdrawal 37
area. According to the Legacy Rehost 2000 System (LR2000) (accessed in January 2012), there 38
are no recorded mining claims within the land withdrawal area. 39
40
Although the mineral potential of the lands within the Antonito Southeast SEZ is low, the 41
proposed withdrawal of lands within the SEZ would preclude many types of mining activity over 42
a 20-year period, resulting in the avoidance of potential mining-related adverse impacts. Impacts 43
commonly related to mining development include increased soil erosion and sedimentation, 44
water use, generation of contaminated water in need of treatment, creation of lagoons and ponds 45
(hazardous to wildlife), toxic runoff, air pollution, establishment of noxious weeds and invasive 46

Final Solar PEIS 10.1-83 July 2012
species, habitat destruction or fragmentation, disturbance of wildlife, blockage of migration 1
corridors, increased visual contrast, noise, destruction of cultural artifacts and fossils and/or their 2
context, disruption of landscapes and sacred places of interest to tribes, increased traffic and 3
related emissions, and conflicts with other land uses (e.g., recreational). 4
5
6
10.1.25 References 7
8
Note to Reader: This list of references identifies Web pages and associated URLs where 9
reference data were obtained for the analyses presented in this Final Solar PEIS. It is likely that 10
at the time of publication of this Final Solar PEIS, some of these Web pages may no longer be 11
available or the URL addresses may have changed. The original information has been retained 12
and is available through the Public Information Docket for this Final Solar PEIS. 13
14
AEP (American Electric Power), 2010, Transmission Facts. Available at http://www.aep.com/ 15
about/transmission/docs/transmission-facts.pdf. Accessed July 2010. 16
17
Barber, J.R., et al., 2010, “The Costs of Chronic Noise Exposure for Terrestrial Organisms,” 18
Trends in Ecology and Evolution 25(3):180–189. 19
20
Barber, J.R., et al., 2011, “Anthropogenic Noise Exposure in Protected Natural Areas: 21
Estimating the Scale of Ecological Consequences,” Landscape Ecology 26:1281–1295. 22
23
BLM (Bureau of Land Management), 2011a, Updated Final Visual Resource Inventory, prepared 24
for U.S. Department of Interior Bureau of Land Management, La Jara Field Office, La Jara, 25
Colo., Oct. 26
27
BLM, 2011b, Instruction Memorandum 2012-032, Native American Consultation and Section 28
106 Compliance for the Solar Energy Program Described in Solar Programmatic Environmental 29
Impact Statement, Washington, D.C., Dec. 1. 30
31
BLM, 2011c, Perovich Properties, Inc. DBA Taos Gravel Products Torres Pit Gravel Extraction 32
Operation, Finding of No Significant Impact and Decision Record, Aug. Available at 33
http://www.blm.gov/pgdata/etc/medialib/blm/nm/field_offices/taos/taos_planning/taos_ 34
eas.Par.63305.File.dat/TGP-Torres%20Pit%20FONSI%20DR%20August%203%202011.pdf. 35
Accessed Feb. 25, 2012. 36
37
BLM, 2012, Assessment of the Mineral Potential of Public Lands Located within Proposed Solar 38
Energy Zones in Colorado, prepared by Argonne National Laboratory, Argonne, Ill., July. 39
Available at http://solareis.anl.gov/documents/index.cfm. 40
41
BLM and DOE (BLM and U.S. Department of Energy), 2010, Draft Programmatic 42
Environmental Impact Statement for Solar Energy Development in Six Southwestern States, 43
DES 10-59, DOE/EIS-0403, Dec. 44
45
Final Solar PEIS 10.1-84 July 2012
BLM and DOE, 2011, Supplement to the Draft Programmatic Environmental Impact Statement 1
for Solar Energy Development in Six Southwestern States, DES 11-49, DOE/EIS-0403D-S, Oct. 2
3
CDPHE (Colorado Department of Public Health and Environment), 2011, 2008 Air Pollutant 4
Emissions Inventory. Available at http://www.colorado.gov/airquality/inv_maps_2008.aspx. 5
Accessed Nov. 22, 2011. 6
7
CEQ (Council on Environmental Quality), 1997, Environmental Justice: Guidance under the 8
National Environmental Policy Act, Executive Office of the President, Dec. Available at 9
http://ceq.hss.doe.gov/nepa/regs/ej/justice.pdf. 10
11
Chick, N., 2009, personal communication from Chick (Colorado Department of Public Health 12
and Environment, Denver, Colo.) to Y.-S. Chang (Argonne National Laboratory, Argonne, Ill.), 13
Sept. 4. 14
15
Colorado District Court, 2010, Case Number 06CV64 & 07CW52, In the Matter of the 16
Rio Grande Water Conservation District, in Alamosa County, Colorado and Concerning the 17
Office of the State Engineer’s Approval of the Plan of Water Management for Special 18
Improvement District No. 1 of the Rio Grande Water Conservation District, District Court, 19
Water Division No. 3. 20
21
Colorado DWR (Division of Water Resources), 2004, Preliminary Draft: Rio Grande Decision 22
Support System, Phase 4 Ground Water Model Documentation. Available at http://cdss.state.co. 23
us/Pages/CDSSHome.aspx. 24
25
DOI (U.S. Department of Interior), 2012, “Salazar Designates the Trujillo Homesteads in 26
Colorado as a National Historic Landmark,” press release, Jan. 3. Available at http://www.doi. 27
gov/news/pressreleases/Salazar-Designates-the-Trujillo-Homesteads-in-Colorado-as-a-National-28
Historic-Landmark.cfm. Assessed Feb. 22, 2012. 29
30
EPA (U.S. Environmental Protection Agency), 2011, National Ambient Air Quality Standards 31
(NAAQS). Last updated Nov. 8, 2011. Available at http://www.epa.gov/air/criteria.html, 32
Accessed Nov. 23, 2011. 33
34
Garcia, M., and L.A. Harvey, 2011, Assessment of Gunnison Prairie Dog and Burrowing Owl 35
Populations on San Luis Valley Solar Energy Zone Proposed Areas, San Luis Valley Public 36
Lands Center, Dec. 37
38
Heide, R., 2011, “Xcel Is Out, but Transmission Line Is Not,” Valley Courier, Nov. 2. Available 39
at http://www.alamosanews.com/v2_news_articles.php?heading=0&page=72&story_id=22489. 40
Accessed Nov. 20, 2011. 41
42
Mayo, A.L., et al., 2007, “Groundwater Flow Patterns in the San Luis Valley, Colorado, USA 43
Revisited: An Evaluation of Solute and Isotopic Data,” Hydrogeology Journal (15):383–408. 44
45
Final Solar PEIS 10.1-85 July 2012
McDermott, P., 2010, personal communication from McDermott (Engineer with Colorado 1
Division of Water Resources, Division 3) to B. O’Connor (Argonne National Laboratory, 2
Argonne, Ill.), Aug. 9. 3
4
NatureServe, 2010, NatureServe Explorer: An Online Encyclopedia of Life. Available at 5
http://www.natureserve.org/explorer. Accessed Sept. 9, 2009. 6
7
NOAA (National Oceanic and Atmospheric Administration), 2012, National Climatic Data 8
Center (NCDC). Available at http://www.ncdc.noaa.gov/oa/ncdc.html. Accessed Jan. 16, 2012. 9
10
NPS (National Park Service), 2011, San Luis Valley and Central Sangre de Cristo Mountains: 11
Reconnaissance Survey Report, Working Draft, U.S. Department of the Interior, Dec. Available 12
at http://parkplanning.nps.gov/document.cfm?parkID=73&projectID=39991&documentID= 13
44749. Accessed May 15, 2012. 14
15
NRCS (Natural Resources Conservation Service), 2009, Web Soil Survey, U.S. Department of 16
Agriculture, Washington, D.C. Available at http://websoilsurvey.nrcs.usda.gov. Accessed 17
Aug. 21, 2012. 18
19
Platts, 2011, POWERmap, Strategic Desktop Mapping System, The McGraw Hill Companies. 20
Available at http://www.platts.com/Products/powermap. 21
22
Rodriguez, R.M., 2011, Front Range District Bat Surveys of Solar Energy Zones within the 23
San Luis Valley, Colorado, Draft Final Report prepared by Zotz Ecological Solutions, LLC, for 24
Bureau of Land Management, Oct. 25
26
SEIA (Solar Energy Industries Association), 2012, Utility-Scale Solar Projects in the 27
United Stated Operating, under Construction, or under Development, Jan. 12. Available at 28
http://www.seia.org/galleries/pdf/Major%20Solar%20Projects.pdf. Accessed Feb. 22, 2012. 29
30
Simmons, R.L., and T.H. Simmons, 2003, National Register of Historic Places Registration 31
Form for “Trujillo Homestead,” Aug. 29, revised Nov. 24. 32
33
Solar Feeds, 2012, Tessera Submits Second Proposal for Colorado Solar Plant. Available at 34
http://www.solarfeeds.com/tessera-submits-second-proposal-for-colorado-solar-plant/. Accessed 35
Feb. 22, 2012. 36
37
Stoffle, R.W., et al., 2008, Ethnohistoric and Ethnographic Assessment of Contemporary 38
Communities along the Old Spanish Trail, Bureau of Applied Research in Anthropology, 39
University of Arizona, Tucson, Dec. 40
41
Tameliny v. U.S. Freehold & Emigration Co., 1876, 93 U.S. 644. 42
43
Tetra Tech EC, Inc., 2011, Saguache Solar Energy Project, Final 1041 Permit Application, 44
Saguache County, Colorado, Oct. Available at http://www.saguachecounty.net/images/ 45
Saguache_1041_text_2011_10_16_Final_for_submission.pdf. Accessed March 19, 2012. 46

Final Solar PEIS 10.1-86 July 2012
U.S. Bureau of the Census, 2010, American FactFinder. Available at http://factfinder2. 1
census.gov. Accessed April 6, 2012. 2
3
USDA (U.S. Department of Agriculture), 2004, Understanding Soil Risks and Hazards—Using 4
Soil Survey to Identify Areas with Risks and Hazards to Human Life and Property, G.B. Muckel 5
(ed.). 6
7
USFWS (U.S. Fish and Wildlife Service), 1993, “Endangered and Threatened Wildlife and 8
Plants; Final Rule to List the Mexican Spotted Owl as a Threatened Species,” Federal 9
Register 58:14248–14271. 10
11
USFWS, 1995, “Endangered and Threatened Wildlife and Plants; Determination of Critical 12
Habitat for the Mexican Spotted Owl; Final Rule,” Federal Register 60:29915–29951. 13
14
USFWS, 1998, “Endangered and Threatened Wildlife and Plants; Revocation of Critical 15
Habitat for the Mexican Spotted Owl, Loach Minnow, and Spikedace,” Federal 16
Register 63:14378–14379. 17
18
USFWS, 2004, “Endangered and Threatened Wildlife and Plants; Final Designation of Critical 19
Habitat for the Mexican Spotted Owl; Final Rule,” Federal Register 69:53182–53298. 20
21
USFWS, 2011, Draft Recovery Plan for the Mexican Spotted Owl (Strix occidentalis lucida), 22
First Revision, Southwest Region, Albuquerque, N.M., June. Original approval Oct. 16, 1995. 23
24
USGS (U.S. Geological Survey), 2004, National Gap Analysis Program, Provisional Digital 25
Land Cover Map for the Southwestern United States, Version 1.0, RS/GIS Laboratory, College 26
of Natural Resources, Utah State University. Available at http://earth.gis.usu.edu/swgap/ 27
landcover.html. Accessed March 15, 2010. 28
29
USGS, 2007, National Gap Analysis Program, Digital Animal-Habitat Models for the 30
Southwestern United States, Version 1.0, Center for Applied Spatial Ecology, New Mexico 31
Cooperative Fish and Wildlife Research Unit, New Mexico State University. Available at 32
http://fws-nmcfwru.nmsu.edu/swregap/HabitatModels/default.htm. Accessed March 15, 2010. 33
34
USGS, 2012a, National Hydrography Dataset (NHD). Available at http://nhd.usgs.gov. 35
Accessed Jan. 16, 2012. 36
37
USGS, 2012b, National Water Information System (NWIS). Available at http://waterdata.usgs. 38
gov/nwis. Accessed Jan. 16, 2012. 39
40
41
42
Final Solar PEIS 10.1-87 July 2012
10.1.26 Errata for the Proposed Antonito Southeast SEZ 1
2
This section presents corrections to material presented in the Draft Solar PEIS and the 3
Supplement to the Draft. The need for these corrections was identified in several ways: through 4
comments received on the Draft Solar PEIS and the Supplement to the Draft (and verified by 5
the authors), through new information obtained by the authors subsequent to publication of the 6
Draft Solar EIS and the Supplement to the Draft, or through additional review of the original 7
material by the authors. Table 10.1.26-1 provides corrections to information presented in the 8
Draft Solar PEIS and the Supplement to the Draft. 9
10
11
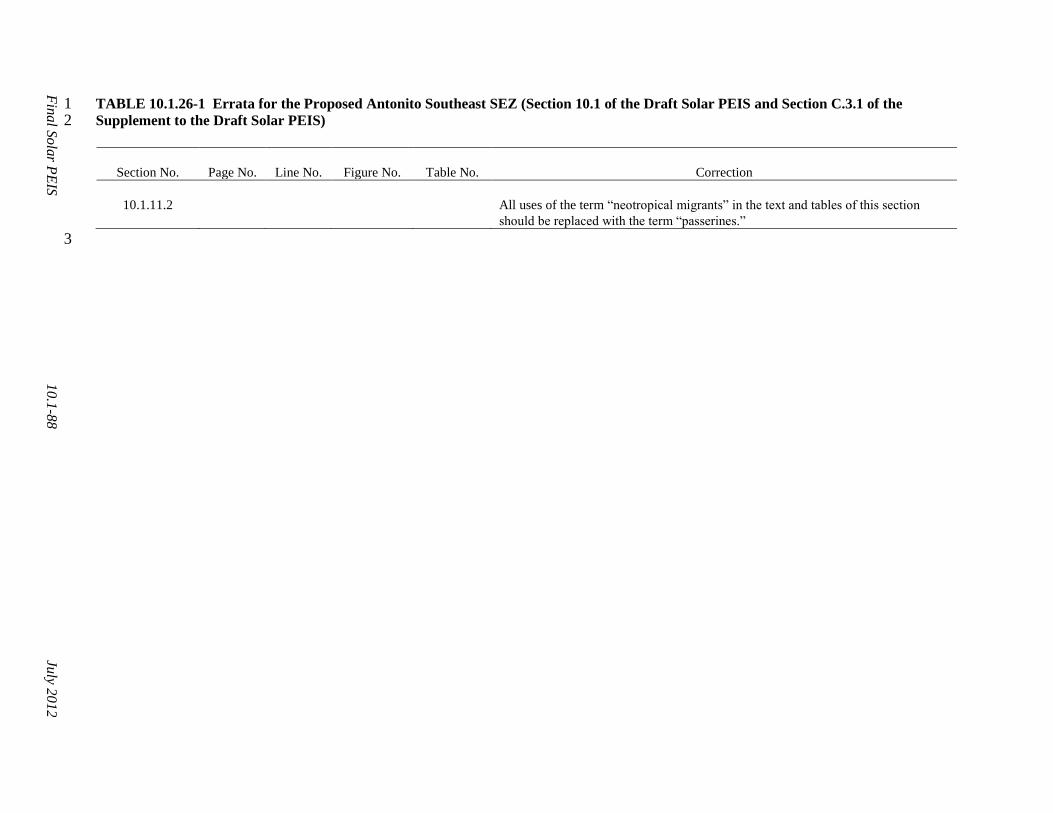
Fin
al S
ola
r PE
IS
10.1
-88
July 2
01
2
TABLE 10.1.26-1 Errata for the Proposed Antonito Southeast SEZ (Section 10.1 of the Draft Solar PEIS and Section C.3.1 of the 1 Supplement to the Draft Solar PEIS) 2
Section No.
Page No.
Line No.
Figure No.
Table No.
Correction
10.1.11.2 All uses of the term “neotropical migrants” in the text and tables of this section
should be replaced with the term “passerines.”
3