gene co-expression network analysis bmi 730 kun huang department of biomedical informatics ohio...
Post on 20-Dec-2015
228 views
TRANSCRIPT

Gene Co-expression Network AnalysisBMI 730 Kun Huang
Department of Biomedical InformaticsOhio State University

Announcement• No class this Wed• Change of schedule – miRNA lecture moved to a
later time• More time for project – only the last class is used
for presentation• Today
– lecture more relevant to the projects– Discuss possible class projects– Decide on the groups
• Decide on the project topic by next Monday – meeting with me later this week is recommended.


http://www.rithme.eu/img/storage_cost.gif

Gene Expression Microarray

Gene Networks/Pathways• Regulatory network
• Metabolic pathways
• Signaling pathways
• Protein-protein interaction networks
• Gene interaction networks
• Co-expression network
Networks/Pathways Resources• www.pathguide.org
• KEGG
• HPRD
• MIMI
• BIND
• …

Networks/Pathways in Research • Genes don’t act alone
• One gene – one disease model is not sufficient
• Need to understand how genes coordinate and work together as a system

Networks/Pathways• How to build the network?
• Manual curation – e.g., IPA
• Automatic inference from literature – e.g., NLP based method
• Inference from data – e.g., co-expression network
• Integration from multiple resources – e.g., STRING database (http://string.embl.de/)

Networks/Pathways• How to build the network?
• Manual curation – e.g., IPA
• Automatic inference from literature – e.g., NLP based method
• Inference from data – e.g., co-expression network
• Integration from multiple resources – e.g., STRING database (http://string.embl.de/)

• How to use the network?
• Functional inference
• Identify new candidate for further investigation
• Dynamical simulation
• Other types of inferences
Networks/Pathways

a
p
m
1
2
b
E2F1
E2F2
E2F3 Myc
17-5p 17-3p 18a 19a 20a 19b 92-1
c
Myc E2F
mir-17-92
Reviewed by: Coller et al. (2008), PLoS Genet 3(8): e146Figures from Dr. Baltz Agula
MicroRNA (miRNA)

Gene Co-Expression
HMMR siRNA


• Expansion– Negative correlation– Multiple breast cancer datasets– More anchor genes– …
• Is there a way to find all highly correlated genes in multiple datasets?
• Do these genes form clusters?
Gene Co-Expression Network

• Step 1: Compute pairwise PCC values
• Step 2: Weighted or unweighted?– Unweighted – need to select a cutoff on PCC – Weighted – need to consider transformation
of the data– Keep the scale-free topology
• Step 3: Identify “dense” networks (subgraphs) from the overall graph– Hierarchical clustering– Graph mining
Gene Co-Expression Network
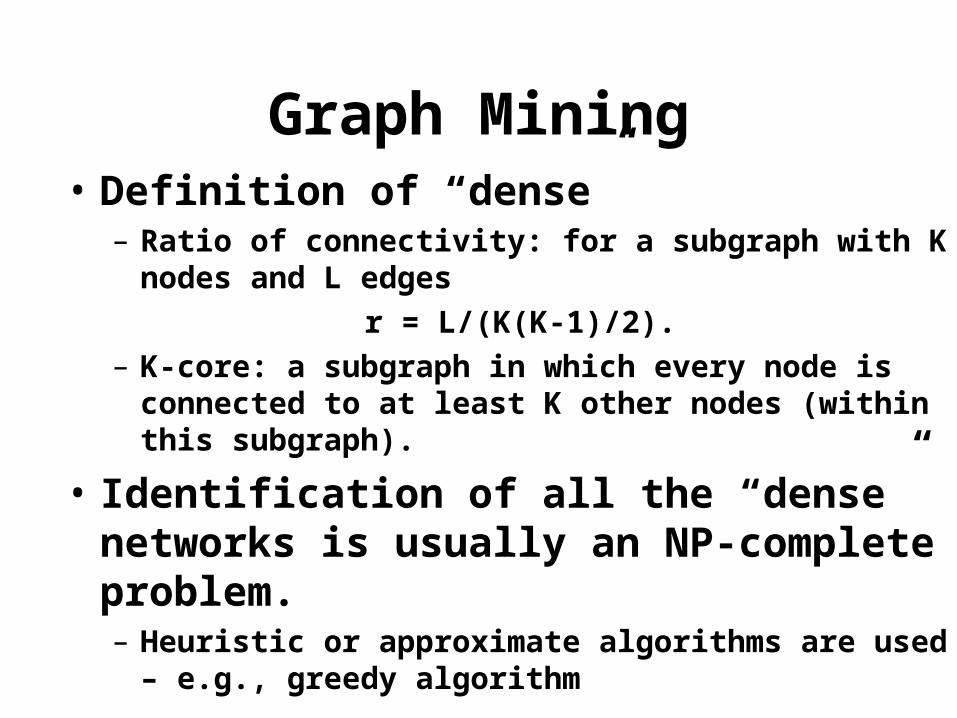
• Definition of “dense”– Ratio of connectivity: for a subgraph with K nodes
and L edges
r = L/(K(K-1)/2). – K-core: a subgraph in which every node is
connected to at least K other nodes (within this subgraph).
• Identification of all the “dense” networks is usually an NP-complete problem.– Heuristic or approximate algorithms are used – e.g.,
greedy algorithm
Graph Mining

Frequent network mining
• CODENSE
– Originally applied to yeast microarray data, later expanded to cancers
– Used for functional annotation

Data selection and correlation• Selected 23 datasets from Gene Expression
Omnibus (GEO) – Search term “human metastatic cancer”– Contain both control and tumor, # sample > 8– Only primary biopsy
• Correlation – PCC > 0.75 (really high similarity)• For CODENSE
– Edge support in at least 4 datasets– Connectivity ratio r > 40% (L > r∙n(n-1)/2)– # of nodes > 20

Results from CODENSE
• 44 networks are identified
• # of nodes: 21 ~ 74 (average 44)
• Connectivity: 0.41 ~ 0.78

Finding New Functions
Relation to BRCA1

Comparing ER- and ER+ breast cancer patients
• Estrogen receptor status is one of the key biomarkers for breast cancer prognosis (ER- indicates poor prognosis)
• Select a dataset (GSE2034, Wang et al) from GEO containing 286 samples (77 ER-, 209 ER+)
• Compare the ER- group vs ER+ group, select the networks that is most perturbed
• The network containing HMMR is most perturbed – more than half of the genes are differentially regulated

Select gene signature from a network to predict survival• Use the genes in this network as features to cluster
patients in the Rosseta data (295 breast cancer patients) and compare the survival between the two groups.
Log-rank test p < 1e-8

Possible Project Topics:1. Compare the gene expression profiles between tumor
and its microenvironment – differential expression, gene co-expression network, and tissue-tissue expression network.
2. Similarly compare the co-expression network between different types of tissues.
3. Herpes virus and cancer; predict human gene targets for virus (Herpes virus) microRNAs.
4. Gene expression “stalling” prediction using “stalling index” from ChIP-seq data for RNA polymerase II.
5. TF binding motif prediction using graph theoretical method.
6. MicroRNA co-expression network to predict microRNA transcription regulation.
7. Your own research problem …