gender differences in the relationship between risk of hypertension and fruit intake
TRANSCRIPT

Preventive Medicine 67 (2014) 154–159
Contents lists available at ScienceDirect
Preventive Medicine
j ourna l homepage: www.e lsev ie r .com/ locate /ypmed
Gender differences in the relationship between risk of hypertension andfruit intake
Hong Ji Song a, Yu Jin Paek a, Min Kyu Choi b, Hae-Jeung Lee c,⁎a Department of Family Medicine, Hallym University Sacred Heart Hospital, College of Medicine, Hallym University, Anyang-si, South Koreab Department of Family Medicine, Kangnam Sacred Heart Hospital, College of Medicine, Hallym University, Seoul, South Koreac Department of Food & Nutrition, Eulji University, Seongnam-si, South Korea
⁎ Corresponding author at: Department of Food & NSangseong-daero, Sujeong-gu, Seongnam-si, Gyeonggi-+82 31 740 7370.
E-mail addresses: [email protected], skysea@eu
http://dx.doi.org/10.1016/j.ypmed.2014.07.0160091-7435/© 2014 Elsevier Inc. All rights reserved.
a b s t r a c t
a r t i c l e i n f oAvailable online 18 July 2014
Keywords:HypertensionFruitObesityGender differences
Objective. To investigate the relationship between hypertension and fruit intake in an Asian population.Method. This studywas based on the data from 2007, 2008 and 2009 Korea National Health andNutrition Ex-
amination Survey. In the final analysis, a total of 9791 subjects (men = 3819, women = 5972) were included.Daily energy and nutrient intakes were assessed using 24-h recall. The odds ratios (ORs) for hypertensionwere assessed by using logistic regression and multivariable models.
Results. A total of 10.6% of individuals were classified as having hypertension. Compared with the lowest
quintile of fruit intake, the fifth quintile showed the lowest likelihood of hypertension (OR 0.73; 95% confidenceinterval [CI], 0.61–0.88) after adjusting for age and gender. Forwomen, the likelihood of hypertension in the 2nd,3rd, 4th and 5th quintiles of fruit intake decreased to 0.67 (95% CI, 0.34–1.30), 0.76 (0.56–1.05), 0.90 (0.67–1.22)and 0.54 (0.38–0.77), respectively, after adjusting for confounding factors (P value for trend = 0.0011). An in-verse association of fruit intake and hypertension was shown only in non-obese women. For men and obesewomen, there was no relationship between fruit intake and hypertension.Conclusion.Dietary fruit recommendation for hypertension should be taken into account togetherwith ethnicbackground, gender as well as the presence of obesity in individuals.
© 2014 Elsevier Inc. All rights reserved.
Introduction
Hypertension is a leading risk factor for vascular mortality, includingstroke, heart and renal diseases (Chobanian et al., 2003; James et al.,2014; Kalaitzidis and Bakris, 2010; Lewington et al., 2002). It is also amajor public health concern with a global prevalence of 26% in adults(Kearney et al., 2005). A reduction in cardiovascularmorbidity andmor-tality could be achieved through even a slight reduction in the meanblood pressure of this population (Bulpitt et al., 2006; Chobanian, et al,2003; Richart et al., 2011). For prevention and management of hyper-tension, The American Heart, Lung and Blood Institute recommendsadherence to the DASH (Dietary Approaches to Stop Hypertension)diet, which is a diet based on high intakes of fruits and vegetables, andlow intakes of fat and sodium (Chobanian et al., 2003; James et al.,2014). The European Society of Hypertension also recommends an in-crease in the consumption of vegetables and fruits to lower blood pres-sure (Mancia et al., 2013). Based on previous research, including
utrition, Eulji University, 553do, 461-713, South Korea. Fax:
lji.ac.kr (H.-J. Lee).
observational studies and intervention studies, evidence for bloodpressure-lowering effects of an increased consumption of vegetablesand fruits has been accepted (Boeing et al., 2012). However, one ran-domized controlled trial with a cross-over design could not providestrong enough evidence to support blood pressure-lowering effectsdue to an increase in the consumption of vegetables and fruits (Berryet al., 2010). Fresh fruits are recommended with caution in overweightpatients as their high carbohydrate content may promote weight gain(Mancia et al., 2013). In some previous studies, when data for intakeof fruits and vegetables were analyzed separately, reduction in preva-lence of hypertension from consumption of fruits was smaller and lesssignificant than that for vegetables (Alonso et al., 2004).When the asso-ciations between individual food groups that comprise the DASH dietcomponents and blood pressure were examined, individual compo-nents, with the exception of low-fat milk, had no independent relation-ship with blood pressure (Harrington et al., 2013). In a cohort study, asignificant inverse relationship between fruit and vegetable consump-tion and the risk of hypertension was shown only among participantswith low olive oil consumption (b15 g/day), suggesting a sub-additiveeffect of some food items (Nunez-Cordoba et al., 2009). If there is asub-additive effect of some food items on the protective effect of fruitconsumption with respect to hypertension, then the inverse relation-ship between the risk of hypertension and increased in fruit intake
155H.J. Song et al. / Preventive Medicine 67 (2014) 154–159
maybe different in Asian populations as food items consumed on a dailybasis vary betweenWestern and Asian countries.
Therefore, there are still areas of uncertainty concerning provision ofadvice to general Asian population to increase intakes of fruits above theusual amount. The aim of the present study was to investigate any di-rect, independent relationship between the prevalence of hypertensionand fruit intake in Asian subjects using data from Korea National HealthandNutrition Examination Survey (KNHANES), a nationally representa-tive survey conducted in the Republic of Korea.
Methods
Study population and exclusions
This study was based on the data from 2007, 2008 and 2009KNHANES, which was the 4th KNHANES provided by Korea Centersfor Disease Control and Prevention (KCDC). The 4th KNHANES databasehas been used for previous epidemiologic studies (Choi et al., 2013; Kimet al., 2013; Shin et al., 2013). The sample for KNHANES was selectedusing a stratified, multistage, cluster-sampling designwith proportionalallocation based on the National Census Registry. The 4th KNHANES da-tabasewas comprised of 4594, 9744 and 10,533 individuals, respective-ly, for a total of 24,871 participants. Subjects aged 19 to 64 years wereincluded (n = 14,334). We excluded participants using the followingexclusion criteria: a) pregnant women (n = 132), b) subjects whohad a diagnosis of or receiving treatment for hypertension (n = 1663)at the time of the survey, c) subjects with no blood pressure data(n=863) and d) subjects with no energy intake data (n= 1,728). Ad-ditionally, subjects reporting unrealistic daily total energy intakes(b500 kcal or N6000 kcal) were excluded (n= 157), as per other stud-ies with similar study designs (Thomson et al., 2011; van der Schouwet al., 2005). As a result, a total of 9791 subjects was included in thefinal analysis (men = 3819, women = 5972).
The study was conducted in accordance with the Ethical Principlesfor Medical Research Involving Human Subjects, as defined by theHelsinki Declaration. All study subjects were provided with written in-formed consent for the survey. Moreover, de-identified data wereused in the study.
Measurements
KNHANES included well-established questions to determine demo-graphic and socioeconomic characteristics of the subjects. Questionson age, gender, education level, income, physical activity, smokinghabits and alcohol consumption were incorporated. Daily energy andnutrient intakes were assessed using one 24 h recall. The height andweight of subjectsweremeasuredwith participantswearing light cloth-ing and no shoes. Body mass index (BMI) was calculated as weight (inkilograms) divided by height (in meters squared). To define obesegroup, BMI was categorized above 25 kg/m2 (Weisell, 2002). Moreover,well-trained observers manually measured blood pressure using amer-cury sphygmomanometer (Baumanometer; Baum, Copiague, NY). Hy-pertension was defined as having a systolic pressure of 140 mm Hg(or higher) or a diastolic pressure of 90 mm Hg (or higher).
Fruit intake was calculated considering fresh fruit and 100% fruitjuice intake, and 3819men and 5972womenwere categorized into sep-arate quintiles. Fruit intake was categorized into quartiles.
Alcohol consumption was categorized into four groups: non-drinker, less than once amonth, once amonth (less than heavy drinker)and heavy drinker. Smoking status was categorized into non-smoker,ever-smoker and current smoker (two groups: b1 pack per day and≥ 1 pack per day). Physical activity was categorized into four groups:no exercise with irregular walking, regular walking, regular moderate-level activity and regular vigorous-level activity.
Statistical analyses
Means and standard errors (SEs) of continuous variableswere calcu-lated in the hypertension and non-hypertension groups. Proportions ofeach covariate in categorical variables were calculated for each group.The odds ratios for hypertension of dependent variables were assessedby using logistic regression after adjusting for age and gender. Themean or proportion of BMI, fasting glucose, triglycerides, LDL-C, HDL-C, energy, sodium intake, smoking, alcohol consumption, physical activ-ity, education, income, education for hypertension and survey year (formen and women) and menopause (for women only) were different inthe hypertension and non-hypertension groups (P b 0.05). Therefore,the multivariable model was additionally adjusted for these factors.For subgroup analysis, we conducted a stratified analysis by obesity orsmoking status. We conducted a further stratified analysis by gender,obesity, and smoking status. All analyseswere performed using SAS sta-tistical software (version 9.2; SAS Institute Inc., Cary, NC).
Results
Out of 9791 participants, 10.6% were classified as having hyperten-sion. There was a significant difference in the distribution of prevalenceof hypertension and fruit intake between men and women. Obesity hasbeen considered as one of the important risk factors for hypertension(Eckel et al., 2014). Therefore, we analyzed the data in subgroups bygender and obesity (Table 1).
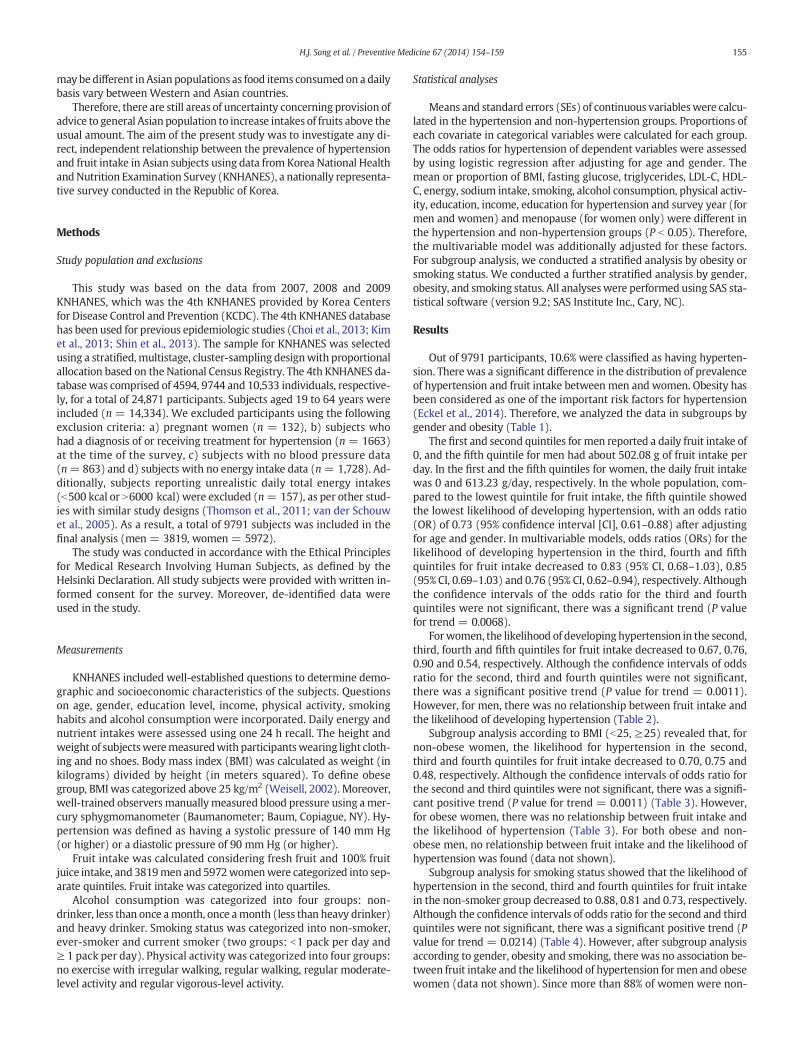
The first and second quintiles for men reported a daily fruit intake of0, and the fifth quintile for men had about 502.08 g of fruit intake perday. In the first and the fifth quintiles for women, the daily fruit intakewas 0 and 613.23 g/day, respectively. In the whole population, com-pared to the lowest quintile for fruit intake, the fifth quintile showedthe lowest likelihood of developing hypertension, with an odds ratio(OR) of 0.73 (95% confidence interval [CI], 0.61–0.88) after adjustingfor age and gender. In multivariable models, odds ratios (ORs) for thelikelihood of developing hypertension in the third, fourth and fifthquintiles for fruit intake decreased to 0.83 (95% CI, 0.68–1.03), 0.85(95% CI, 0.69–1.03) and 0.76 (95% CI, 0.62–0.94), respectively. Althoughthe confidence intervals of the odds ratio for the third and fourthquintiles were not significant, there was a significant trend (P valuefor trend = 0.0068).
Forwomen, the likelihood of developing hypertension in the second,third, fourth and fifth quintiles for fruit intake decreased to 0.67, 0.76,0.90 and 0.54, respectively. Although the confidence intervals of oddsratio for the second, third and fourth quintiles were not significant,there was a significant positive trend (P value for trend = 0.0011).However, for men, there was no relationship between fruit intake andthe likelihood of developing hypertension (Table 2).
Subgroup analysis according to BMI (b25, ≥25) revealed that, fornon-obese women, the likelihood for hypertension in the second,third and fourth quintiles for fruit intake decreased to 0.70, 0.75 and0.48, respectively. Although the confidence intervals of odds ratio forthe second and third quintiles were not significant, there was a signifi-cant positive trend (P value for trend = 0.0011) (Table 3). However,for obese women, there was no relationship between fruit intake andthe likelihood of hypertension (Table 3). For both obese and non-obese men, no relationship between fruit intake and the likelihood ofhypertension was found (data not shown).
Subgroup analysis for smoking status showed that the likelihood ofhypertension in the second, third and fourth quintiles for fruit intakein the non-smoker group decreased to 0.88, 0.81 and 0.73, respectively.Although the confidence intervals of odds ratio for the second and thirdquintiles were not significant, there was a significant positive trend (Pvalue for trend = 0.0214) (Table 4). However, after subgroup analysisaccording to gender, obesity and smoking, there was no association be-tween fruit intake and the likelihood of hypertension formen and obesewomen (data not shown). Since more than 88% of women were non-

Table 1Baseline characteristics of participants.
Men, BMI b 25 Men, BMI ≥ 25 Women, BMI b 25 Women, BMI ≥ 25
Hypertensiona
(n = 315)Non-hypertension(n = 2170)
P value Hypertension(n = 321)
Non-hypertension(n = 1013)
P value Hypertension(n = 214)
Non-hypertension(n = 4419)
P value Hypertension(n = 183)
Non-hypertension(n = 1156)
P value
Age, years 46.2 ± 0.6 40.8 ± 0.3 b0.0001 43.9 ± 0.6 41.2 ± 0.4 b0.0001 49.4 ± 0.7 39.7 ± 0.2 b0.0001 49.0 ± 0.7 44.3 ± 0.3 b0.0001Systolic blood pressure 123.7 ± 0.9 111.7 ± 0.2 b0.0001 123.5 ± 0.8 113.4 ± 0.3 b0.0001 127.0 ± 1.1 107.5 ± 0.1 b0.0001 126.4 ± 1.2 112.1 ± 0.3 b0.0001Diastolic blood pressure 82.0 ± 0.6 74.1 ± 0.1 b0.0001 84.0 ± 0.6 75.7 ± 0.2 b0.0001 83.1 ± 0.6 71.2 ± 0.1 b0.0001 82.1 ± 0.7 73.8 ± 0.2 b0.0001Body mass index (kg/m2) 22.8 ± 0.1 22.2 ± 0.0 b0.0001 27.6 ± 0.1 27.2 ± 0.1 0.0016 22.4 ± 0.1 21.5 ± 0 b0.0001 28.0 ± 0.2 27.4 ± 0.1 0.0029Fasting glucose (mg/dL) 100.2 ± 1.2 94.4 ± 0.5 b0.0001 103.4 ± 1.6 99.0 ± 0.7 0.011 100.2 ± 2.2 90.9 ± 0.2 b0.0001 100.4 ± 2.1 97.7 ± 0.7 0.1471Triglycerides 169.7 ± 7.6 131.9 ± 2.3 b0.0001 214.1 ± 9.1 183.1 ± 4.2 0.002 124.8 ± 5.6 92.9 ± 1.0 b0.0001 149.7 ± 5.8 127.4 ± 2.6 0.0005LDL-cholesterol (mg/dL) 115.2 ± 1.9 108.1 ± 0.7 0.0005 116.8 ± 2.1 116.1 ± 1.0 0.7655 124.0 ± 2.3 108.3 ± 0.4 b0.0001 127.7 ± 2.7 119.5 ± 0.9 0.0046HDL-cholesterol (mg/dL) 48.7 ± 0.7 46.9 ± 0.2 0.0112 43.4 ± 0.5 42.3 ± 0.3 0.0571 51.5 ± 0.8 52.2 ± 0.2 0.3307 48.1 ± 0.8 47.2 ± 0.3 0.2076Energy (kcal/day) 2248.9 ± 45.2 2288.1 ± 17.7 0.4288 2364.4 ± 48.3 2318.3 ± 27.2 0.4062 1572.3 ± 44.7 1677.9 ± 9.2 0.0142 1588.3 ± 48.0 1624.6 ± 18.0 0.4589Sodium (mg/day) 6044.2 ± 194.9 5917.0 ± 67.4 0.538 6204.6 ± 185.6 6259.0 ± 100.2 0.7919 3982.4 ± 175.1 4279.4 ± 38.3 0.0954 4106.6 ± 176.0 4379.8 ± 104.1 0.3133Fruits intake (g/day) 150.2 ± 16.5 166.4 ± 6.8 0.3642 158.3 ± 16.6 154.8 ± 9.1 0.8522 148.8 ± 15.1 221.7 ± 5.0 0.0014 180.3 ± 20.2 217.4 ± 10.0 0.1008Fruit intake (%)1st (Lowest) 56.8 52.1 0.4028 49.8 51.8 0.794 45.3 33.9 0.0002 43.2 40.4 0.79912nd 12.4 15.2 17.8 16.2 16.4 20.4 16.4 15.93rd 15.9 16.6 15.0 16.0 25.7 22.8 18.0 21.04th (Highest) 14.9 16.1 17.5 16.0 12.6 22.9 22.4 22.7
Smoking (%)Non-smoker 17.6 20.6 0.0786 20.2 18.5 0.5999 89.1 88.2 0.0334 92.9 88.9 0.4047Ever-smoker 36.9 30.2 33.8 31.1 2.4 5.8 3.3 5.8Current smoker, b1 pack per day 22.1 26.2 21.8 23.3 6.6 5.3 3.3 4.2Current smoker, ≥1 pack per day 23.4 23.1 24.3 27.1 1.9 0.7 0.6 1.1
Alcohol intake (%)Non-drinker 2.6 4.0 b0.0001 3.5 4.4 0.0441 19.9 12.6 b0.0001 17.6 14.6 0.0133Less than once a month 10.3 21.5 16.5 20.8 37.0 41.0 34.6 42.5Once a month — less than heavy drinker 55.8 54.8 48.3 50.6 31.8 41.6 37.9 38.2Heavy drinkerb 31.4 19.7 31.8 24.3 11.4 4.8 9.9 4.8
Physical activity (%)No regular exercise with irregularwalking
42.0 39.3 0.1383 41.5 41.9 0.2392 43.8 46.6 0.6185 37.8 42.3 0.2786
Regular walking 27.9 30.4 24.6 28.5 29.5 29.5 26.7 29.2Regular, moderate-level activity 7.1 10.4 6.7 7.5 11.4 8.9 14.4 11.0Regular, vigorous-level activity 23.1 19.9 27.2 22.1 15.2 15.0 21.1 17.4
Education (%)Elementary school 17.3 9.9 b0.0001 13.0 9.3 0.2662 30.3 11.5 b0.0001 39.6 24.5 b0.0001Middle school 15.7 10.9 10.8 10.2 16.6 9.4 18.7 16.3High school 32.7 30.6 27.9 30.3 43.6 36.3 29.7 35.4College or higher degree 34.3 48.6 48.3 50.2 9.5 42.9 12.1 23.9
Income (%)1st (lowest) 31.4 24.5 0.0198 27.9 22.4 0.0589 31.3 22.3 0.0047 28.0 28.8 0.93442nd 21.4 24.4 29.2 27.1 25.6 23.2 29.7 27.53rd 27.5 25.7 22.6 23.8 23.7 27.5 21.4 21.64th (highest) 19.7 25.4 20.4 26.7 19.4 27.0 20.9 22.2
Received hypertension education (%) 1.3 0.3 0.009 1.3 0.5 0.1482 1.0 0.1 b0.0001 1.7 0.1 0.0003Survey year (%)2007 12.7 18.3 b0.0001 14.6 17.4 0.0002 9.4 17.7 b0.0001 10.4 18.0 b0.00012008 25.1 40.4 29.9 40.3 32.7 40.5 26.8 40.12009 62.2 41.2 55.5 42.4 57.9 41.8 62.8 41.9
All data represent mean ± standard error or number (%) of participants.a Hypertension was defined as having a systolic pressure of 140 mm Hg (or higher) or diastolic pressure of 90 mm Hg (or higher).b Heavy drinker was defined as consuming alcohol twice or more per week and having at least 7 drinks/occasion for men and 5 drinks/occasion for women.
156H.J.Song
etal./PreventiveMedicine
67(2014)
154–159
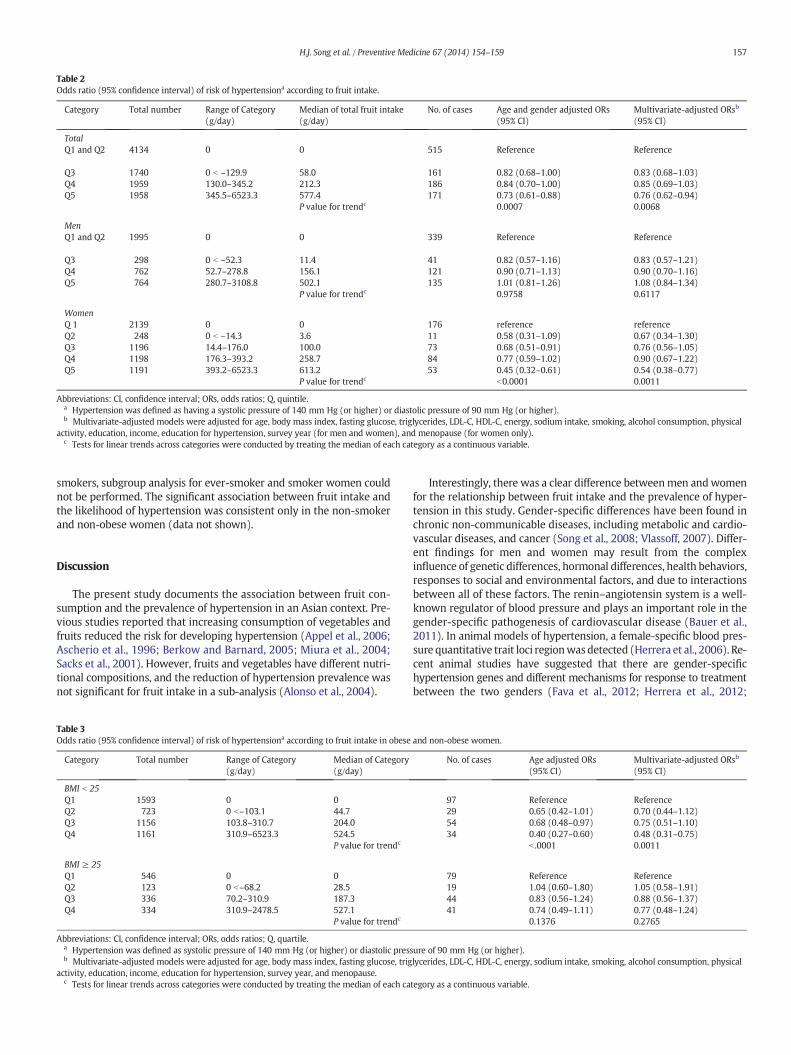
Table 2Odds ratio (95% confidence interval) of risk of hypertensiona according to fruit intake.
Category Total number Range of Category(g/day)
Median of total fruit intake(g/day)
No. of cases Age and gender adjusted ORs(95% CI)
Multivariate-adjusted ORsb
(95% CI)
TotalQ1 and Q2 4134 0 0 515 Reference Reference
Q3 1740 0 b –129.9 58.0 161 0.82 (0.68–1.00) 0.83 (0.68–1.03)Q4 1959 130.0–345.2 212.3 186 0.84 (0.70–1.00) 0.85 (0.69–1.03)Q5 1958 345.5–6523.3 577.4 171 0.73 (0.61–0.88) 0.76 (0.62–0.94)
P value for trendc 0.0007 0.0068
MenQ1 and Q2 1995 0 0 339 Reference Reference
Q3 298 0 b –52.3 11.4 41 0.82 (0.57–1.16) 0.83 (0.57–1.21)Q4 762 52.7–278.8 156.1 121 0.90 (0.71–1.13) 0.90 (0.70–1.16)Q5 764 280.7–3108.8 502.1 135 1.01 (0.81–1.26) 1.08 (0.84–1.34)
P value for trendc 0.9758 0.6117
WomenQ 1 2139 0 0 176 reference referenceQ2 248 0 b –14.3 3.6 11 0.58 (0.31–1.09) 0.67 (0.34–1.30)Q3 1196 14.4–176.0 100.0 73 0.68 (0.51–0.91) 0.76 (0.56–1.05)Q4 1198 176.3–393.2 258.7 84 0.77 (0.59–1.02) 0.90 (0.67–1.22)Q5 1191 393.2–6523.3 613.2 53 0.45 (0.32–0.61) 0.54 (0.38–0.77)
P value for trendc b0.0001 0.0011
Abbreviations: CI, confidence interval; ORs, odds ratios; Q, quintile.a Hypertension was defined as having a systolic pressure of 140 mm Hg (or higher) or diastolic pressure of 90 mm Hg (or higher).b Multivariate-adjusted models were adjusted for age, body mass index, fasting glucose, triglycerides, LDL-C, HDL-C, energy, sodium intake, smoking, alcohol consumption, physical
activity, education, income, education for hypertension, survey year (for men and women), and menopause (for women only).c Tests for linear trends across categories were conducted by treating the median of each category as a continuous variable.
157H.J. Song et al. / Preventive Medicine 67 (2014) 154–159
smokers, subgroup analysis for ever-smoker and smoker women couldnot be performed. The significant association between fruit intake andthe likelihood of hypertension was consistent only in the non-smokerand non-obese women (data not shown).
Discussion
The present study documents the association between fruit con-sumption and the prevalence of hypertension in an Asian context. Pre-vious studies reported that increasing consumption of vegetables andfruits reduced the risk for developing hypertension (Appel et al., 2006;Ascherio et al., 1996; Berkow and Barnard, 2005; Miura et al., 2004;Sacks et al., 2001). However, fruits and vegetables have different nutri-tional compositions, and the reduction of hypertension prevalence wasnot significant for fruit intake in a sub-analysis (Alonso et al., 2004).
Table 3Odds ratio (95% confidence interval) of risk of hypertensiona according to fruit intake in obese
Category Total number Range of Category(g/day)
Median of Category(g/day)
BMI b 25Q1 1593 0 0Q2 723 0 b–103.1 44.7Q3 1156 103.8–310.7 204.0Q4 1161 310.9–6523.3 524.5
P value for trendc
BMI ≥ 25Q1 546 0 0Q2 123 0 b–68.2 28.5Q3 336 70.2–310.9 187.3Q4 334 310.9–2478.5 527.1
P value for trendc
Abbreviations: CI, confidence interval; ORs, odds ratios; Q, quartile.a Hypertension was defined as systolic pressure of 140 mm Hg (or higher) or diastolic pressb Multivariate-adjusted models were adjusted for age, body mass index, fasting glucose, trig
activity, education, income, education for hypertension, survey year, and menopause.c Tests for linear trends across categories were conducted by treating the median of each ca
Interestingly, there was a clear difference betweenmen andwomenfor the relationship between fruit intake and the prevalence of hyper-tension in this study. Gender-specific differences have been found inchronic non-communicable diseases, including metabolic and cardio-vascular diseases, and cancer (Song et al., 2008; Vlassoff, 2007). Differ-ent findings for men and women may result from the complexinfluence of genetic differences, hormonal differences, health behaviors,responses to social and environmental factors, and due to interactionsbetween all of these factors. The renin–angiotensin system is a well-known regulator of blood pressure and plays an important role in thegender-specific pathogenesis of cardiovascular disease (Bauer et al.,2011). In animal models of hypertension, a female-specific blood pres-sure quantitative trait loci regionwasdetected (Herrera et al., 2006). Re-cent animal studies have suggested that there are gender-specifichypertension genes and different mechanisms for response to treatmentbetween the two genders (Fava et al., 2012; Herrera et al., 2012;
and non-obese women.
No. of cases Age adjusted ORs(95% CI)
Multivariate-adjusted ORsb
(95% CI)
97 Reference Reference29 0.65 (0.42–1.01) 0.70 (0.44–1.12)54 0.68 (0.48–0.97) 0.75 (0.51–1.10)34 0.40 (0.27–0.60) 0.48 (0.31–0.75)
b .0001 0.0011
79 Reference Reference19 1.04 (0.60–1.80) 1.05 (0.58–1.91)44 0.83 (0.56–1.24) 0.88 (0.56–1.37)41 0.74 (0.49–1.11) 0.77 (0.48–1.24)
0.1376 0.2765
ure of 90 mm Hg (or higher).lycerides, LDL-C, HDL-C, energy, sodium intake, smoking, alcohol consumption, physical
tegory as a continuous variable.

Table 4Odds ratio (95% confidence interval) of risk of hypertensiona according to fruit intake in non-, ever- and current smokers.
Category Total number Range of Category(g/day)
Median of Category(g/day)
No. of cases Age and gender adjusted ORs(95% CI)
Multivariate-adjusted ORsb
(95% CI)
Non-smokerQ1 2092 0 0 197 reference referenceQ2 919 0 b–104.5 50.8 68 0.83 (0.61–1.11) 0.88 (0.64–1.21)Q3 1497 104.6–323.5 205.2 112 0.75 (0.58–0.96) 0.81 (0.62–1.06)Q4 1502 324.2–6523.3 545.6 99 0.62 (0.48–0.81) 0.73 (0.55–0.97)
P value for trendc 0.0002 0.0214
Ever-smokerQ1 688 0 0 111 reference referenceQ2 72 0 b–14.4 4.7 10 0.89 (0.60–1.80) 1.01 (0.46–2.26)Q3 380 15.1–235.0 116.9 51 0.77 (0.54–1.12) 0.71 (0.47–1.07)Q4 381 235.6–2478.5 468.9 61 0.93 (0.66–1.32) 1.02 (0.68–1.52)
P value for trendc 0.1376 0.9831
Current smokerQ1 1329 0 0 201 reference referenceQ2Q3 327 0 b–137.2 52.0 38 0.79 (0.54–1.15) 0.72 (0.47–1.09)Q4 552 139.1–2733.0 334.1 74 0.88 (0.66–1.17) 0.93 (0.68–1.29)
P value for trendc 0.3654 0.6656
Abbreviations: CI, confidence interval; ORs, odds ratios; Q, quartile.a Hypertension was defined as having a systolic pressure of 140 mm Hg (or higher) or diastolic pressure of 90 mm Hg (or higher).b Multivariate-adjusted models were adjusted for age, gender, body mass index, fasting glucose, triglycerides, LDL-C, HDL-C, energy, sodium intake, alcohol consumption, physical
activity, education, income, education for hypertension, survey year and menopause (for women only).c Tests for linear trends across categories were conducted by treating the median of each category as a continuous variable.
158 H.J. Song et al. / Preventive Medicine 67 (2014) 154–159
Hoffman et al., 2013; Park et al., 2012). Although the epigenetic mecha-nism that results in gender-specific gene expression has yet to be discov-ered, there is accumulating evidence that demonstrates gender-specificrelationships between diverse environmental influences on placentalfunctions and the risk of disease later in life (Gabory et al., 2013).
Low potassium and high sodium intakes (He et al., 2013; Sacks et al.,2001; Zhang et al., 2013) and sodium-to-potassium intake ratio (Castroand Raij, 2013) have been reported to be associated with high bloodpressure. In a previous study, daily sodium intake of men was muchhigher than that of women, and therewas a clear independent relation-ship between high sodium intake and an increased likelihood of beingoverweight in men but not in women (Song et al., 2013). However,after adjusting for sodium intake, there was no change in the differencebetween men and women in our study.
In a previous study carried out in an Asian population, formersmokers with abdominal obesity had a higher risk for subsequent hy-pertension than current smokers (Onat et al., 2009). Therefore, we ana-lyzed the data using the smoking status of subjects and the significantassociation between fruit intake and the likelihood of hypertensionwas consistent only in the non-smoker and non-obese women.
The inverse association between higher levels of potassium intakeand blood pressure was attenuated after adjusting for major lifestyleand dietary factors (Shin et al., 2013). Therefore, the mechanism forthe inverse association of fruits for high blood pressure cannot beexplained by the high potassium intakes alone and instead, must bedue to both high potassium intakes and other gender-specific differentfactors and obesity. Women are generally more prone to pro-inflammatory status and autoimmune activation. Fruit intake might beof highest benefit through preventing enhanced low-grade inflamma-tion (Onat and Can, 2014).
Our study had several limitations. Fruit intake was estimated byusing one 24-h dietary recall. Ideally, at least three 24-h recalls wouldbe done, one on a day-off and two on working days. However, thiscould not be easily applied to a large population. To minimize thisbias, 79% of 2007–2009 KNHANES were performed on week days and21% on weekends. The other limitation was the cross-sectional studydesign using dietary recall. A randomized controlled trial design canprovide better evidence. However, a randomized controlled trial couldnot be easily applied to a large number of participants in a general pop-ulation. Considering the reliability of questionnaire-derived dietary
information and the stability of food habits over time for adults(Jensen et al., 1984), 24-h recall can serve as one of the most cost-effective and feasible replacements for a randomized controlled trialfor research using a large number of human subjects. Causal relation-ships cannot be confirmed from such cross-sectional design. Tominimize this limitation, we excluded data from people who werediagnosed with hypertension or had received treatment forhypertension.
Conclusions
Even though longitudinal studies and randomized controlled trialsare needed to confirm the relationship between fruit intake and the re-duction in hypertension risk, there is a potential opportunity to preventhypertension and improve the prognosis of hypertension, in individualswho have it, through optimal management of dietary fruit intake. Thepresent study suggested that dietary fruit recommendations for hyper-tension should consider ethnic and gender-specific differences and obe-sity. Additional studies are needed to clarify the mechanism by whichdietary fruit intake helps to lower hypertension risk.
Conflict of interest statement
The authors have no conflicts of interest.
References
Alonso, A.,de la Fuente, C.,Martin-Arnau, A.M.,de Irala, J.,Martinez, J.A.,Martinez-Gonzalez,M.A., 2004. Fruit and vegetable consumption is inversely associated with blood pres-sure in aMediterranean populationwith a high vegetable-fat intake: the SeguimientoUniversidad de Navarra (SUN) Study. Br. J. Nutr. 92, 311–319.
Appel, L.J.,Brands, M.W.,Daniels, S.R.,Karanja, N.,Elmer, P.J.,Sacks, F.M., et al., 2006. Dietaryapproaches to prevent and treat hypertension: a scientific statement from theAmerican Heart Association. Hypertension 47, 296–308.
Ascherio, A.,Hennekens, C.,Willett, W.C.,Sacks, F.,Rosner, B.,Manson, J., et al., 1996. Pro-spective study of nutritional factors, blood pressure, and hypertension among USwomen. Hypertension 27, 1065–1072.
Bauer, Y.,Hess, P.,Qiu, C.,Klenk, A.,Renault, B.,Wanner, D., et al., 2011. Identification of ca-thepsin L as a potential sex-specific biomarker for renal damage. Hypertension 57,795–801.
Berkow, S.E., Barnard, N.D., 2005. Blood pressure regulation and vegetarian diets. Nutr.Rev. 63, 1–8.
Berry, S.E.,Mulla, U.Z.,Chowienczyk, P.J., Sanders, T.A., 2010. Increased potassium intakefrom fruit and vegetables or supplements does not lower blood pressure or improvevascular function in UKmen andwomenwith early hypertension: a randomised con-trolled trial. Br. J. Nutr. 104, 1839–1847.

159H.J. Song et al. / Preventive Medicine 67 (2014) 154–159
Boeing, H.,Bechthold, A.,Bub, A.,Ellinger, S.,Haller, D.,Kroke, A., et al., 2012. Critical review:vegetables and fruit in the prevention of chronic diseases. Eur. J. Nutr. 51, 637–663.
Bulpitt, C.J., Peters, R., Staessen, J.A., Thijs, L.,De Vernejoul, M.C., Fletcher, A.E., et al., 2006.Fracture risk and the use of a diuretic (indapamide SR) +/− perindopril: a substudyof the Hypertension in the Very Elderly Trial (HYVET). Trials 7, 33.
Castro, H., Raij, L., 2013. Potassium in hypertension and cardiovascular disease. Semin.Nephrol. 33, 277–289.
Chobanian, A.V.,Bakris, G.L.,Black, H.R.,Cushman, W.C.,Green, L.A., Izzo Jr., J.L, et al., 2003.Seventh report of the Joint National Committee on Prevention, Detection, Evaluation,and Treatment of High Blood Pressure. Hypertension 42, 1206–1252.
Choi, B.,Yeum, K.J.,Park, S.J.,Kim, K.N.,Joo, N.S., 2013. Elevated serum ferritin and mercuryconcentrations are associated with hypertension; analysis of the Fourth and FifthKorea National Health and Nutrition Examination Survey (KNHANES IV-2, 3, 2008–2009 and V-1, 2010). Environ. Toxicol. http://dx.doi.org/10.1002/tox.21899 (2013Aug 9).
Eckel, R.H., Jakicic, J.M., Ard, J.D.,Hubbard, V.S., de Jesus, J.M., Lee, I.M., et al., 2014. 2013AHA/ACC guideline on lifestyle management to reduce cardiovascular risk: a reportof the American College of Cardiology/American Heart Association Task Force onPractice Guidelines. Circulation 129, S76–S99.
Fava, C., Ricci, M.,Melander, O.,Minuz, P., 2012. Hypertension, cardiovascular risk andpolymorphisms in genes controlling the cytochrome P450 pathway of arachidonicacid: a sex-specific relation? Prostaglandins Other Lipid Mediat. 98, 75–85.
Gabory, A.,Roseboom, T.J.,Moore, T.,Moore, L.G.,Junien, C., 2013. Placental contribution tothe origins of sexual dimorphism in health and diseases: sex chromosomes and epi-genetics. Biol. Sex Differ. 4 (5-6410-4-5).
Harrington, J.M.,Fitzgerald, A.P.,Kearney, P.M.,McCarthy, V.J.,Madden, J.,Browne, G., et al.,2013. DASH diet score and distribution of blood pressure in middle-aged men andwomen. Am. J. Hypertens. 26, 1311–1320.
He, F.J.,Li, J.,Macgregor, G.A., 2013. Effect of longer-term modest salt reduction on bloodpressure. Cochrane Database Syst. Rev. 4, CD004937.
Herrera, V.L., Tsikoudakis, A., Ponce, L.R.,Matsubara, Y.,Ruiz-Opazo, N., 2006. Sex-specificQTLs and interacting loci underlie salt-sensitive hypertension and target organ com-plications in Dahl S/jrHS hypertensive rats. Physiol. Genomics 26, 172–179.
Herrera, V.L.,Pasion, K.A.,Moran, A.M.,Ruiz-Opazo, N., 2012. Dahl (S × R) congenic strainanalysis confirms and defines a chromosome 5 female-specific blood pressure quan-titative trait locus to b7 Mbp. PLoS One 7, e42214.
Hoffman, M.J., Flister, M.J.,Nunez, L.,Xiao, B.,Greene, A.S., Jacob, H.J., et al., 2013. Female-specific hypertension Loci on rat chromosome 13. Hypertension 62, 557–563.
James, P.A.,Oparil, S.,Carter, B.L.,Cushman,W.C.,Dennison-Himmelfarb, C.,Handler, J., et al.,2014. 2014 evidence-based guideline for the management of high blood pressure inadults: report from the Panel Members Appointed to the Eighth Joint National Com-mittee (JNC 8). JAMA 311, 507–520.
Jensen, O.M., Wahrendorf, J., Rosenqvist, A., Geser, A., 1984. The reliability ofquestionnaire-derived historical dietary information and temporal stability of foodhabits in individuals. Am. J. Epidemiol. 120, 281–290.
Kalaitzidis, R.G.,Bakris, G.L., 2010. Prehypertension: is it relevant for nephrologists? Kid-ney Int. 77, 194–200.
Kearney, P.M.,Whelton, M., Reynolds, K.,Muntner, P.,Whelton, P.K.,He, J., 2005. Globalburden of hypertension: analysis of worldwide data. Lancet 365, 217–223.
Kim, H.I.,Song, Y.,Kim, W.Y.,Lee, J.E., 2013. Association of adherence to the seventh reportof the Joint National Committee guidelines with hypertension in Korean men andwomen. Nutr. Res. 33, 789–795.
Lewington, S.,Clarke, R.,Qizilbash, N.,Peto, R.,Collins, R., Prospective Studies Collaboration,2002. Age-specific relevance of usual blood pressure to vascular mortality: a meta-analysis of individual data for one million adults in 61 prospective studies. Lancet360, 1903–1913.
Mancia, G., Fagard, R.,Narkiewicz, K., Redon, J., Zanchetti, A., Bohm, M., et al., 2013. 2013ESH/ESC guidelines for the management of arterial hypertension: the Task Force forthe Management of Arterial Hypertension of the European Society of Hypertension(ESH) and of the European Society of Cardiology (ESC). J. Hypertens. 31, 1281–1357.
Miura, K.,Greenland, P., Stamler, J., Liu, K.,Daviglus, M.L.,Nakagawa, H., 2004. Relation ofvegetable, fruit, and meat intake to 7-year blood pressure change in middle-agedmen: the Chicago Western Electric Study. Am. J. Epidemiol. 159, 572–580.
Nunez-Cordoba, J.M., Alonso, A., Beunza, J.J., Palma, S., Gomez-Gracia, E., Martinez-Gonzalez, M.A., 2009. Role of vegetables and fruits in Mediterranean diets to preventhypertension. Eur. J. Clin. Nutr. 63, 605–612.
Onat, A.,Can, G., 2014. Enhanced proinflammatory state and autoimmune activation: abreakthrough to understanding chronic diseases. Curr. Pharm. Des. 20, 575–584.
Onat, A.,Ugur, M.,Hergenc, G.,Can, G.,Ordu, S.,Dursunoglu, D., 2009. Lifestyle andmetabol-ic determinants of incident hypertension, with special reference to cigarettesmoking: a longitudinal population-based study. Am. J. Hypertens. 22, 156–162.
Park, S.,Liu, X.,Davis, D.R.,Sigmund, C.D., 2012. Gene trapping uncovers sex-specific mech-anisms for upstream stimulatory factors 1 and 2 in angiotensinogen expression. Hy-pertension 59, 1212–1219.
Richart, T., Thijs, L.,Nawrot, T., Yu, J., Kuznetsova, T., Balkestein, E.J., et al., 2011. Themetabolic syndrome and carotid intima-media thickness in relation to the para-thyroid hormone to 25-OH-D(3) ratio in a general population. Am. J. Hypertens.24, 102–109.
Sacks, F.M.,Svetkey, L.P.,Vollmer, W.M.,Appel, L.J.,Bray, G.A.,Harsha, D., et al., 2001. Effectson blood pressure of reduced dietary sodium and the Dietary Approaches to Stop Hy-pertension (DASH) diet. DASH—Sodium Collaborative Research Group. N. Engl. J.Med. 344, 3–10.
Shin, D., Joh, H.K.,Kim, K.H., Park, S.M., 2013. Benefits of potassium intake on metabolicsyndrome: The Fourth Korean National Health and Nutrition Examination Survey(KNHANES IV). Atherosclerosis 230, 80–85.
Song, H.J.,Kim, H.J.,Choi, N.K.,Hahn, S.,Cho, Y.J.,Park, B.J., 2008. Gender differences in gas-tric cancer incidence in elderly former drinkers. Alcohol 42, 363–368.
Song, H.J.,Cho, Y.G.,Lee, H.J., 2013. Dietary sodium intake and prevalence of overweight inadults. Metabolism 62, 703–708.
Thomson, J.L.,Tussing-Humphreys, L.M.,Onufrak, S.J.,Connell, C.L.,Zoellner, J.M.,Bogle,M.L.,et al., 2011. Simulated reductions in consumption of sugar-sweetened beverages im-proves diet quality in LowerMississippi Delta adults. Food Nutr. Res. 55. http://dx.doi.org/10.3402/fnr.v55i0.7304 (Epub 2011 Oct 17).
van der Schouw, Y.T., Kreijkamp-Kaspers, S., Peeters, P.H., Keinan-Boker, L., Rimm, E.B.,Grobbee, D.E., 2005. Prospective study on usual dietary phytoestrogen intake and car-diovascular disease risk in Western women. Circulation 111, 465–471.
Vlassoff, C., 2007. Gender differences in determinants and consequences of health and ill-ness. J. Health Popul. Nutr. 25, 47–61.
Weisell, R.C., 2002. Body mass index as an indicator of obesity. Asia Pac. J. Clin. Nutr. 11(Suppl. 8), S681–S684.
Zhang, Z.,Cogswell, M.E.,Gillespie, C., Fang, J., Loustalot, F.,Dai, S., et al., 2013. Associationbetween usual sodium and potassium intake and blood pressure and hypertensionamong U.S. adults: NHANES 2005–2010. PLoS One 8, e75289.