gender differences in executive departure
TRANSCRIPT

Gender Differences in Executive Departure
Rachel Landsman∗
Bucknell University
October 22, 2019
Abstract
The underrepresentation of women in top-management positions has receivedsubstantial attention within the economics literature. Studies focusing on executivedeparture largely show that female executives exhibit higher departure rates. How-ever, existing studies do not test whether this difference is explained by differences inability. This study uses exogenous changes in firm performance to examine the po-tential role of ability in generating differential departure rates. I show that, followingindustry-wide contractions, the overall departure rate for female executives increasesby approximately 2 percentage points while no change is observed in the departurerate for male executives. The data show that ability differences do not drive thedifference in departure rates and also suggest that the gap is not explained by dif-ferences in fertility, early retirement, the glass cliff, differences in external hire rates,or female start-ups. I argue that one remaining channel that is consistent with theobserved gender difference in departure rates is misplaced blame (e.g., attributionbias) on female executives.
Keywords: gender, executive departure, corporate governance
∗Bucknell University. Department of Economics, One Dent Drive, Lewisburg, PA 17837. Email:[email protected]

1 Introduction
Over the past fifty years, the U.S. has seen substantial progress in narrowing the
gap in the representation and compensation of women in the labor market (Bailey and
DiPrete, 2016). However, a pervasive gender gap still persists at the top of the income
distribution (Guvenen et al., 2014). One area that is especially conspicuous is the gap
among top executives at publicly traded firms. A large body of research documents that
women are generally paid less than their male counterparts and are underrepresented
in top management positions.1 Many explanations have been put forth to explain the
underrepresentation of women at this level. Explanations include gender differences in
preferences (e.g., fertility and family ties) and ability; discrimination and organizational
barriers such as masculine work culture and exclusion from social networks (Kark and
Eagly, 2010); and, more recently, it has been argued that behavioral differences such as
differences in willingness to compete and confidence (Niederle and Vesterlund, 2007) as
well as differences in negotiation (Babcock and Laschever, 2003) contribute to the gap.
While these are certainly important components to the underrepresentation of women
in top management positions, they tend to focus only on differences in entry. It is not
enough, however, to facilitate women’s entry; we must also focus on their retention. A
smaller set of studies focuses on exactly that (Becker-Blease et al., 2016, 2010; Gayle et al.,
2012; Guest, 2016). Overall, the results consistently demonstrate that female executives
exhibit higher departure rates than male executives. While the existing papers explore
a variety of factors that may be correlated with the gender gap in departure, none of
the studies provide evidence that allows us to rule out the simplest explanation for this
observed difference: gender differences in ability.
This paper examines whether the observed gender differences in executive departure
can be explained solely by gender differences in ability. To address this, I construct an
instrument for firm performance that strips away the ability component and examine
1See for instance Kark and Eagly (2010) or Blau and Kahn (2016) for review.
1

whether the gender gap in departure responds to exogenous changes in firm perfor-
mance.
This instrument is constructed using industry mean performance (with the own-firm
removed) to instrument for firm performance, as is done in the relative performance
evaluation literature (Fee et al., 2015; Guay et al., 2014; Jenter and Kanaan, 2006, 2015),
and is used to estimate the effect of firm performance on gender differences in departure
probability. Given that this instrument is exogenous from executive ability within a firm,
it allows identification of whether gender differences from departure are coming from
factors outside of ability.
Using matched employer-employee data of S&P 1500 executives, and focusing pri-
marily on industry contractions, the results show that following an exogenous decline
in firm performance, the gender gap in executive departure rates increases by around 2
percentage points. Further, there is no effect on the departure rate for male executives,
suggesting this increase in the departure rate gap is driven solely by an increase in fe-
male departure rates. Given a base departure rate for female executives of 13.6%, and a
gender gap in departure rates of 2.2 percentage points, this amounts to approximately
a 15% increase in the departure rate for female executives and a 90% increase in the
departure rate gender gap following industry contractions.
Because the gender difference in departure rates is affected by exogenous changes
in firm performance, this shows that the gender gap in executive departure cannot be
explained by women’s under performance alone. As such, it is not sufficient for policies
focused on closing the gender gap in departures to simply target improving women’s
leadership skills. Instead, policies should target the underlying mechanisms that are
driving the gender gap.
Given this result, the remainder of the paper explores alternative mechanisms and
provides compelling evidence to rule them out. Specifically examined are the following:
gender differences in fertility, early retirement, external hiring, the glass cliff (whereby
2

women may be in more tenuous positions to begin with), and female start-ups. Sup-
ported with findings from the literature, in addition to the data, it is clear that none of
these potential mechanisms is likely to be driving the observed treatment effect.
One may ask, if none of the above mechanisms are driving the effect, what could
remain? One possibility that remains consistent with the results in this paper is the
conjecture of gender differences in misplaced blame.2 While I am unable to identify
this mechanism with the existing data, this mechanism would also align with existing
literature that shows female executives’ pay decreases more than that for male executives
following negative firm performance, whereas the opposite pattern emerges following
positive firm performance (Selody, 2010; Albanesi et al., 2015).
The rest of this paper proceeds as follows: in section 2, I provide an overview of the
executive labor market, and discuss related literature on executive departures. In section
3, I discuss the data used in this study and how variables are coded. In section 4, I
discuss my methodology. Section 5 presents the main results, while section 6 explores
potential first-order mechanisms for the observed treatment effect. In section 7, I discuss
blame as an alternative explanation for gender differences in departures. Finally, section
8 concludes.
2 Related Literature
2.1 The Executive Labor Market
Before discussing the details of the gender gap in executive departure rates, we must
first define what constitutes a top executive position. Top executives are the highest
ranked executives in a company and belong to the top management team (TMT) within
2Examples of misplaced blame include attribution bias in which the board misattributes poor firmperformance from industry shocks as being due to ability when the executive is female. Another possibil-ity could be self-attribution bias in which female executives more frequently misattribute failures that areoutside their control to internal factors.
3

the organization. As defined in (Castanias and Helfat, 1991), and in (Hambrick and
Mason, 1984), a TMT consists of the CEO, and the senior executives that report directly
to the CEO. These positions are typically at or above the level of vice president, including
titles such as CFO, COO, etc.
According to Murphy (1999), the majority of top executive positions have pay pack-
ages with four distinct components in common. These components are a minimum
salary, a performance-based yearly bonus, the option to purchase stocks at a discounted
rate – which is particularly prevalent among U.S. executives, often comprising more of
an individual executive’s total compensation than their minimum salary – and an incen-
tivization scheme for encouraging long-term performance. Furthermore, unlike typical
at-will employees, who comprise the low- and mid-level ranks of a company, top ex-
ecutives will usually have formalized contracts, lasting a certain number of years and
stipulating the details of the above components, as well as potential severance packages.
Given these characteristics, particularly the existence of a formalized contract with
severance, these positions will prove much more resilient to downsizing in times of
economic downturn. According to Cameron et al. (1993), downsizing may encom-
pass eliminating individuals or work assignments, organizational restructuring, partial
dissolution, and full dissolution of the company. As discussed in Krishnan and Park
(1998), when downsizing occurs, top management teams have the tendency to replace
executives perceived as underperforming, rather than simply eliminating their positions
entirely. As such, the reasons behind a top executive’s dismissal are more likely to be
focused on the perception of the difference in their ability versus the abilities of their
peers than they are to be focused on the simple redundancy of her position. This is
perhaps self-evident, given that TMT positions are necessary for the operation of a firm
regardless of size. As such, they cannot easily be made redundant.
4

2.2 Executive Departure
A number of factors have been shown to affect executive departure. Most obviously, it
has been documented that executive departure is linked to the executive’s performance –
e.g., Homroy (2015), Guay et al. (2014). Involuntary departures have also been attributed
to the adaptability of executives to long term industry shocks, such as changes in the
industry concentration, with generalists having lower involuntary departure following
such shocks than other executives (Guay et al., 2014).
Gender is also contributing factor to executive departure, with female executives
exhibiting both higher voluntary and involuntary departure rates (Becker-Blease et al.,
2010, 2016; Gayle et al., 2012; Guest, 2016). The gender gap in departure rates tends to
be largest in smaller firms, firms with smaller boards, and firms with fewer independent
directors (Becker-Blease et al., 2010). However, the effect is not necessarily limited to
such firms. In fact, the gender difference in departure rates has significant effects on the
representation and compensation of women in executive positions (Gayle et al., 2012;
Becker-Blease et al., 2016). This effect is great enough that Gayle et al. finds that the
commonly documented gender difference in executive pay can be largely explained by
these differences in executive departure.
Concordantly, researchers have been interested in exploring whether improving fe-
male representation among board members may help reduce this departure rate gap.
It is unclear, however, whether increases in female leadership helps to attenuate the
gender gap in departure rates. While some evidence suggests increased female repre-
sentation on the board of directors leads to a decrease in the gender gap in departures
(Becker-Blease et al., 2010, 2016), conflicting findings in Guest (2016) suggest that im-
proved female leadership at the CEO or board level does not reduce the gender gap in
departure. While it is important to identify factors that may help reduce the gender gap
in departures, a first order question is whether this gap in departures can be rational-
ized by differences in ability alone. If the answer is ‘yes,’ then effecting organizational
5

change to reduce female departure rates is covering the hole rather than repairing it. In-
stead, research should focus on identifying factors such as systemic and institutionalized
pressures which may be impacting women’s ability.
To my knowledge, this is the first study to explore whether the observed gender
differences in departure can be fully explained by gender differences in ability. Along
with addressing this, my study contributes by investigating other, previously unexplored
mechanisms that may contribute to gender differences in departure.
3 Data
3.1 Data Overview
This study uses data from Standard and Poor’s Execucomp database of the S&P 500,
S&P MidCap 400, and S&P SmallCap 600 companies. Execucomp is an annual dataset
that is compiled by S&P Capital IQ using each included company’s annual DEF14a proxy
statement filed with the SEC. Execucomp contains compensation data on up to fifteen
of the top executives within each firm in a given year, as determined by the executives’
annual total compensation.3 Commonly seen top executive officer titles within the sam-
ple include CEO, CFO, COO, President, Executive VP, and chairman of the board. This
dataset contains unique executive and firm identifiers, allowing executives to be tracked
if they move from one Execucomp company to another. In addition to providing in-
formation on annual executive compensation, Execucomp provides details on executive
gender, title, and age. I merge Execucomp with Compustat data for more detailed firm
level information and with data from the Center for Research in Security Prices data for
annual stock returns values, my primary measure of firm performance.
3DEF 14a SEC proxy statements require the firm to list the CEO, CFO, and top 3 non-CEO non-CFOexecutive officers (determined by total compensations) that were employed as of the end of the fiscal year.Firms also must include up to 2 non-CEO, non-CFO executives that would have been listed had they beenemployed by the end of the fiscal year. Some firms choose to report more executives than the numberrequired by the SEC.
6

I restrict the sample to only include data from 1998 to 2015 due to the low num-
ber of female executives prior to 1998 and incomplete data from 2016 forward. As in
Selody (2010), observations with missing data or negative observations for total com-
pensation are dropped from the sample. Also restricted from the sample are executives
with missing age data, a reported current age below 18, missing gender data, firms that
have missing data on annual stock returns, firms with missing data on the number of
employees, and all firms whose industry is classified as “other” per the Fama-French
48 industry classifications (Fama and French, 1997). Finally, in order to identify tenure
for the executives in the sample, executives that appear as a top executive within the
firm prior to 1997 are excluded. Tenure is measured as the number of years in which
an executive appears among the top executives at the firm, as defined by the firms’ SEC
proxy statement.4 Doing this allows for the identification of tenure for all executives in
the sample without incurring any left censoring of this variable. One caveat of this ap-
proach is that it creates a measure of tenure that does not identify an executive’s overall
tenure as an employee within the firm, but rather their tenure as a top executive within
the firm.
The final sample consists of 84,998 executive-firm-year observations. Within this sam-
ple, there exist 2,278 unique firms, 19,626 unique executive-firm pairs, and 18,504 unique
executives. Thus, only a small portion of executives within the sample appear at mul-
tiple firms. Focusing on female executives, there are 6,846 executive firm-year observa-
tions with 1,805 unique female executive-firm pairs and 1,717 unique female executives.
Thus, female executives comprise approximately 8.05% of the executive-firm-year obser-
vations, 9.2% of the executive-firm pairs, and 9.3% of the unique executive observations.
The share of female executives observed in the sample is higher than the 4.5% observed
in Becker-Blease et al. (2010); however, representation of women in top executive po-
4Execucomp provides start date information for a subset of executives in the sample; however, thisvariable is often not reported. As a robustness check, I repeat the primary analysis including executiveswith earlier start dates. The results are largely unchanged by relaxing this restriction. See the robustnesschecks subsection in section 2.5.
7
sitions has increased over time.5 Looking instead at studies using slightly more recent
data, we can see that 9% is quite comparable to that observed in other samples using
a more similar date range. For instance, Selody (2010) finds between 7 to 8% of top
executives were female between 2004 and 2008.
3.2 Identifying Executive Departures
While Execucomp includes some departure dates in their data, the reporting of this
information was never mandatory. Furthermore, Execucomp stopped collecting this
information entirely after 2009. As a result, departure date information in Execucomp
is largely incomplete prior to 2009 and nearly non-existent following 2009 (Stefanescu
et al., 2015).6 Thus, I construct an alternative measure of departure using the method
described in Guay et al. (2014). An executive is flagged as having departed firm f in year
t (DEPART) if the following two conditions are met: they are not listed as an executive
at firm f for years t + 1 and t + 2; and the executive did not lose their job as a result of
the firm shutting down.
The primary goal of this study, however, is to identify which factors may be contribut-
ing to differences in involuntary departure rates between male and female executives.
Unfortunately, identifying involuntary departures poses its own set of challenges. Rea-
sons behind executive departures are largely kept private, and — except under extreme
circumstances — all departure events are generally referred to as resignations, without
indication as to whether they were voluntary. Methods of coding involuntary departures
in previous studies range from treating all departures as voluntary — unless they can
be identified with a specific news event — to the other extreme: coding all departures as
involuntary, unless given strong evidence to suggest otherwise. Given the sparse nature
of news reports on executive resignation events, many researchers that rely on using
5Focusing on my sample, only 4.6% of executives were female in 1998 compared to over 8% by 2008.6Execucomp also provides reasons for departure on the executives they flag as having departed. These
categories are quite coarse; they are limited to “deceased,” “retired,” “resigned,” and “unknown.”
8

news reports employ some version of the Parrino (1997) algorithm that dictates how to
handle departure events for which no news article exists. One shortcoming of relying on
news articles to categorize turnover is that news reporters may be subject to biases, as
argued in both Fee et al. (2015) and Jenter and Lewellen (2010). In particular, Fee et al.
(2015) argues that reports may be more likely to suggest a resignation was forced when
the firm performance is negative, regardless of the actual reason for departure.
Potential biases on behalf of news reporters can become even more problematic when
introducing the additional dimension of gender. For instance, a media analysis focused
on news coverage of CEOs during times of transition found that the framing of stories
is much more likely to attribute blame to the CEO when she is female (The Rockefeller
Foundation and Global Strategy Group, 2016). In this instance, we have to be concerned
not only with reporters having a greater inclination to report forced resignation when
firm outcomes are negative; we must also be concerned with how any inherent gender
biases on behalf of the reporters shade their news reports.
In light of potential biases that can be introduced through relying on media reports,
I instead rely on a modified method from Fee et al. (2015), in which an executive is
flagged as having “involuntarily” departed (INVOLUNTARY) if they satisfy the con-
ditions for having departed (DEPART) and they do not reappear as a top executive at
another Execucomp firm within two years of departure.7 This measure attempts to rule
out executive turnover from voluntary job changes by executives (e.g., lateral or upwards
movements). This measure is not able to rule out executives that voluntarily leave the
labor market. As such, in section 2.6 of this chapter, I explore the possibilities of fertil-
ity or early retirement. As an additional robustness check, I also construct a measure,
INVOLUNTARY2, that includes the same restrictions as INVOLUNTARY, but does not
mark as involuntarily departed the small set of executives that Execucomp has identified
7The differences between using a one year and two year restriction for reappearance are small (refer totable 2.1). Using 2 years is a slightly more conservative definition, as it allows for any friction executivesmay experience in job transition and reduces the likelihood that executives taking leave for fertility reasonswill be marked as departed.
9

as having departed due to being retired or deceased.8
3.3 Firm Performance
In order to identify gender differences in executive departure that are exogenous
from executive ability, I construct an instrument for firm performance. For a given firm
f , the instrument is equal to the mean performance of all firms in firm f ’s industry with
firm f removed from the average. Thus, this instrument represents the average industry
performance for firm f ’s peers defined at the industry level. Industries are defined using
the Fama-French 48 industry classification (Fama and French, 1997).
Firm performance is measured using the firm’s annual stock return as retrieved from
CRSP. Stock returns are one of the most commonly used performance measures in stud-
ies of executive compensation and departure – e.g., Becker-Blease et al. (2010), Fee et al.
(2015), Guest (2016), Jenter and Kanaan (2015). Unlike accounting-based measures, stock
returns are more unpredictable and exhibit less mean reversion. As such, when using
them as a measure, we do not need to account for lagged values of performance in
our models. Stock returns are also an attractive performance measure because previous
studies have shown that they are more predictive of executive turnover than accounting-
based measures (Fee et al., 2015; Jenter and Kanaan, 2015). To adjust for the fact that
stock return data has substantial outliers, I apply a log transformation.
3.4 Summary Statistics
In this section, I explore the differences and similarities between the personal and
firm attributes of executives by gender. Perhaps unsurprisingly, male and female execu-
tives differ in their average age, length of tenure as an executive, and rank within their
firm as determined by relative compensation. As seen in table 2.1, male executives are
8I choose to use INVOLUNTARY instead of INVOLUNTARY2 as my main measure of departure,given the possibility for bias if the missing data on departures in Execucomp is non-random.
10

Table 1: Summary Statistics
Mean Female Mean Male Diff.
Age 54.17 57.36 3.20∗∗∗
Tenure as Top Executive (Years) 6.29 7.13 0.84∗∗∗
Rank (1 is highest) 3.80 3.19 -0.61∗∗∗
Depart (%) 0.15 0.13 -0.02∗∗∗
Involuntary (%) 0.15 0.12 -0.02∗∗∗
Involuntary2 (%) 0.14 0.11 -0.03∗∗∗
Annual Stock Return (%) 0.17 0.18 0.01Number of Employees (Thousands) 19.69 18.46 -1.22∗
Industry Downturns (%) 0.27 0.26 -0.00
N (Executive-Firm-Year) 6848 78152Unique Executives 1717 16787
Notes: Tenure is measured as the number of years the executive is listed as a top executive at thefirm. Rank is the executives relative rank within the firm as determined by total compensation.An executive is listed as having departed in a given year if they do not return to the firm for twoconsecutive years. An executive is listed as Involuntary in a given year if they satisfy the criteriafor depart and do not reappear at any Execucomp firm within two years. An executive is listedas Involuntary2 in a given year if they satisy the criteria for Involuntary and they are not markedas retired or deceased. * p < .10, ** p < .05, *** p < .01.
older, have longer tenure as a top executive, and are higher ranked than female execu-
tives in the sample. These results are largely consistent with findings in previous studies
– e.g., Bertrand and Mullainathan (2001). Interestingly, while earlier studies found that
female executives were more likely to be employed at smaller firms (Bertrand and Mul-
lainathan, 2001), I find that female executives work at slightly larger firms.9
Importantly, however, there are not striking differences by gender in firm perfor-
mance. While average annual returns seen by female executives is slightly lower than
that seen by male executives, this difference is not statistically significant, suggesting
that there are not substantial differences in the success of firms within the sample that
employ male and female executives. Additionally, male and female executives do not
experience different exposure rates to industry downturns.
9In addition to controlling for the number of employees to address the gender differences I observe infirm size, in my robustness checks I run a regression restricting the sample only to those firms that reportbetween 4 to 6 executives in Execucomp (the most commonly observed range). The results largely remainunchanged.
11

Turning to the different measures of departure used in this study, there is a gender
gap in executive departure as expected, given existing literature. The departure rate
for female executives is approximately 3 percentage points higher than that for male
executives. While an average departure rate of around 13% may seem high, this is quite
close to other studies that look at CEO or executive departure. For instance, Jenter and
Kanaan (2015) finds an annual CEO departure rate of 10.25% in their 1993-2009 sample;
Guay et al. (2014) finds an annual CEO departure rate of 12% in their 1992 to 2008
sample; and Fee et al. (2015) finds an 11% annual CEO departure rate in their 1991-2007
sample. Keeping in mind that non-CEO executive departure rates tend to be somewhat
higher than CEO departure rates, an average departure rate of 13% for top executives
seems consistent with earlier studies.10
The difference in DEPART and INVOLUNTARY gives the unconditional reappear-
ance rate for executives in the sample. The fact that this value is 1% suggests that only a
small portion of the executives in the sample that depart reappear again at another Ex-
ecucomp firm.11 In fact, conditional on having departed, only around 7% of executives
secure a new position with an Execucomp firm within two years of departure. While a
conditional reappearance rate of 7% (or an unconditional reappearance rate of 1%) seems
quite low, this is consistent with findings in existing studies. Gayle et al. (2012) finds
an unconditional reappearance rate of 2% among top executives, while Fee et al. (2015)
finds the CEO reappearance rate as a top executive conditional on having departed is
5.46%.
10This study’s departure rates are not comparable to Becker-Blease et al. (2010) due to the fact thatthey did not account for the missing departure data in Execucomp and thus only looked at Execucompreported departures.
11There are no significant gender differences in the likelihood of reappearing at another Execucompfirm conditional on having departed. 7% of departing male executives reappear and 6.2% of departingfemale executives reappear. These differences are not significant according to a two-sided t-test (p=0.29).
12

4 Methodology
Before discussing the details of the gender gap in executive departure rates, we must
first define what constitutes a top executive position. Top executives are the highest
ranked executives in a company and belong to the top management team (TMT) within
the organization. As defined in (Castanias and Helfat, 1991), and in (Hambrick and
Mason, 1984), a TMT consists of the CEO, and the senior executives that report directly
to the CEO. These positions are typically at or above the level of vice president, in-
cluding titles such as CFO, COO, etc. Unlike low-ranked employees and even middle
management that can be downsized and their work reassigned to other employees, top
executive positions are not disposable or interchangeable in the same sense. As such,
dismissal decisions of TMT executives are unlikely to be due to cost-cutting by the board
and are instead based on observed performance of top executives, as measured via firm
performance.
Therefore, one method to identify whether the observed gender differences in exec-
utive departure are coming solely from differences in ability, is to strip away the ability
component of firm performance and see if the exogenous portion of firm performance
is still correlated with the departure of executives. To do this, I rely on the empirical
framework created by the relative performance evaluation literature — i.e., Holmstrom
(1982), Jensen and Murphy (1990), Bertrand and Mullainathan (2001), Jenter and Kanaan
(2006).12
Suppose that the performance for firm f , y f , is a function of the firm’s ability (and
thus the top management team’s ability) a f , a firm-specific noise parameter u f , and an
12Under the relative performance evaluation (RPE) theory, optimal incentive schemes should dependonly on the ability and/or actions of executives; any variation in industry level performance should befiltered out, and thus should not affect incentives. Papers focused on testing RPE construct instrumentsfor firm performance that are exogenous from ability and look at how changes in instrumented firmperformance affect various measures of executive incentives (e.g., bonuses, dismissals, etc.).
13

industry wide noise parameter o, represented as follows.
y f = a f + o + u f
If ability is the only factor leading to gender differences in departure, variation in firm
performance that occurs at the industry level (i.e., variations in o) are exogenous from
ability for any given executive within the firm and thus should not lead to different
performance evaluations for male versus female executives. In other words, industry
performance (with the own-firm removed) should be orthogonal to the interaction be-
tween gender and involuntary executive departure within a firm. Note that this method
relies on the assumption that the firm’s actions do not affect the performance of indus-
try peers; Jenter and Kanaan (2015) uses the same data set that I do and finds that this
assumption holds.13
Given that we see a higher departure rate among female executives, I am especially
interested in what happens to the gender difference in departures following contractions
firm performance. Looking at the relationship between departures and a continuous
measure of exogenous performance interacted with gender will show whether there
is a stronger relationship between exogenous performance and departures for females
versus males. This measure will not, however, directly show whether there are higher
departures for females relative to males as a result of negative exogenous changes in
performance. As such, much of the analysis in this study focuses on the relationship
between departures and a binary measure of exogenous performance. By allowing the
binary measure of performance to equal one only when the annual return is negative, it is
possible to identify whether we specifically observe an increase in the gender difference
13The authors argue that were a firm’s actions to affect the performance of industry peers, then thereturns to industry performance for that firm should differ from returns for a firm that does not affectindustry peer performance. Small firms within an industry are least likely to have an effect on the perfor-mance of industry peers whereas large firms are most likely to affect industry peer performance. Jenterand Kanaan (2015 shows that there is no difference to the returns for large versus small firms within anindustry. Bertrand and Mullainathan (2001) also provides evidence in favor of this assumption.
14
in departure rates following industry contractions.
I focus on this measure because the change from an increase in annual stock value
to a decrease relative to the prior year is a rather natural and salient cut-off. A large
literature within pyschology and behavioral economics on loss aversion demonstrates
that the disutility individuals experience from a loss is typically larger than the utility
experience from an equally sized gain.14. As such, boards and investors may be more
responsive to losses in firm value (as evidenced by a negative annual stock return) than
gains. For robustness, I later consider an alternative definition of a negative shock to be
instances where predicted firm performance is below the average industry mean perfor-
mance across all years in the sample. This alternative definition can be motivated by a
reference-dependence utility model in which the reference point is based on expectations
about performance (Koszegi and Rabin, 2006). I show that the economic and statistical
significance persists under this alternate specification.
More formally, I estimate departure probability for a given excutive at a firm within
a year as a function of the executive’s gender, an indicator for whether firm perfornace is
negative, the interation between gender and an indicator for negative performance, and
additional controls. Letting i represent executives, f represent firms, d industries, and t
years, the estimating equaltion can be defined as follows.
departi, f ,t = β0 + β1NEG f ,t + β2Fi + β3NEG f ,t × Fi + θXi,f,t + δt + ϕd + εi, f ,t
Fi is a dummy variable that takes the value of 1 if the executive is female, NEG f ,t is a
dummy variable that equals 1 when the firm’s annual return is negative, and Xi,f,t is a
vector of controls for executive i at time t.15 Standard errors are clustered at the industry
14Loss aversion was first introduced in seminal work by Kahneman and Tversky(1979). For a recentreview of the loss aversion literature see DellaVigna(2009) or Marzilli Ericson and Fuster(2014)
15Controls include the number of employees within the firm, the executive’s rank in the firm as de-termined using the executive’s annual compensation relative to the other top executives within the firm,tenure as a top executive within the firm, and age. I include time fixed effects and industry fixed effectsin all specifications except those without controls.
15

level to account for the fact that performance is highly correlated across firms within a
given industry. If gender differences in departure stem solely from differences in ability,
once we instrument for our measure of firm performance and its interaction with gender,
we should find β3 = 0. If, however, β3 6= 0, then the gender difference in executive
departures is at least partially coming from a factor other than gender differences in
ability.
Because firm performance is a function of both executive ability and exogenous fac-
tors, I instrument for negative firm performance using an indicator for when own-firm-
removed industry performance is negative. As is standard when dealing with an intera-
tion between an exogenous variable (Gender) and an endogenous variable (negative firm
performance), I use the interaction between the exogenous variable and the instrument
for the endogenous variable as an instrument for the interaction term. That is, I use
the interaction between gender and an indicator for when own-firm-removed industry
performance is negative to instrument for the interaction between gender and negaative
firm performance. More formally, for a given firm f in year t with n firms in the industry
let own-firm-removed industry performance for firm f , per f ormanceIndustryf ,t be defined
as follows:
per f ormanceIndustryf ,t =
1n− 1 ∑
j∈Industy f ,ts.t.j 6= fper f ormancej,t
From this definition, 1{per f ormanceIndustryf ,t < 0} is used as an instrument for NEG f ,t
and its interaction with executive gender is used as an instrument for NEG f ,t × Fi. Al-
though the endogenous variables used are both binary treatment variables, I employ a
garden variety 2SLS methodology. This is the reccomended course of action suggested
by Angrist (2009).
16

5 Results
5.1 Main Result
Before discussing the main regression output, I first look at Figure 2.1, which plots
the relationship between predicted firm performance (as computed using the first stage
regression) and my preferred measure of executive resignations that excludes executives
who move to new firms (i.e. INVOLUNTARY). This figure shows that, while departure
rates increase for both male and female executives when firm performance is predicted to
be negative, males only experience a 1.3 percentage point increase in departure whereas
females experience a 3.8 percentage point increase in departure. Although this figure
is suggestive of female executives having a higher likelihood of departure as a result of
industry contractions, it does not control for any differences in executive characteristics
or firm characteristics. Thus, to better understand the effect of industry contractions on
gender differences in executive departure, we need to turn to our second stage regression
results.
Table 2.2 presents the results from a 2SLS regression in which I instrument for neg-
ative firm performance and its interaction with gender. The first three columns report
results from the second stage regression using my preferred measure of departure as the
dependent variable. Across these three columns, regardless of whether we have neither
controls nor fixed effects, only fixed effects, or both controls and fixed effects, the esti-
mated gender gap in departure following downturns (measured by Negative X Female)
remains quite stable.16 Furthermore, the remaining two columns report results using
my alternate two measures of departure. For all three measures of departure, female
executives are predicted to have a higher overall resignation rate than male executives
16Interestingly, the same is not true for male executives. While the male departure rate is predictedto increase following downturns in column 1, this effect is no longer significant after adding year andindustry fixed effects. One potential interpretation for this is that male executives experience increasedrates of departures following overall recessions; however, they do not experience increased departure ratesfrom industry-specific downturns.
17

Figure 1: Departure by Gender and Exogenous Performance
18

Table 2: Departure Probability:Results of Second-Stage Regressions
(1) (2) (3) (4) (5)Involuntary Involuntary Involuntary Depart Involuntary2
Negative 0.023∗∗∗ 0.017 0.018 0.017 0.021(0.005) (0.020) (0.018) (0.020) (0.018)
Negative X Female 0.050∗∗ 0.051∗∗ 0.050∗∗ 0.037∗ 0.056∗∗∗
(0.022) (0.021) (0.020) (0.020) (0.020)
Female 0.012 0.007 0.003 0.008 0.001(0.008) (0.007) (0.007) (0.008) (0.007)
Year FE No Yes Yes Yes YesIndustry FE No Yes Yes Yes YesControls No No Yes Yes YesN 84998 84998 84998 84998 84998
Notes: Negative is a dummy variable that equals 1 when firm performance is negative and is instru-mented for using a dummy variable that equals one when industry peer performance is negative. Con-trols include executive age, rank, tenure, and number of employees. Robust standard errors (clustered atthe industry level) are reported in parentheses. * p < .10, ** p < .05, *** p < .01.
following industry downturns. We can also see that overall departure rates for female
executives are positive and significant. This matches what is shown in Figure 2.1.
Focusing now on my preferred measure of departure and specification in column
3, the estimated coefficients suggest that overall resignation rates for female executives
are similar to that for male executives. When firm performance is negative however,
the resignation probability of female executives increases by around 5 percentage points
more than male executives. Recall from table 2.1 that, as measured by INVOLUNTARY,
the average departure rate for female executives is 15%. Thus, the estimated increase in
departure rates of female executives during contractions is both statistically significant
and economically significant.
Recall, INVOLUNTARY does not code as departed those executives that leave their
job and move to another Execucomp firm; INVOLUNTARY2 includes the same restric-
tions as INVOLUNTARY, but does not code as departed those executives that Execu-
comp flags as being retired or deceased. Thus, INVOLUNTARY2 is a tighter definition
19

of departures. In contrast, DEPART codes all executives that leave their job as departed.
Thus, DEPART is a looser measure of departure than INVOLUNTARY. Looking across
column 4 and column 5 of Table 2.2, the estimated treatment effect decreases in mag-
nitude under the looser measure of departure and increases in magnitude under the
tighter measures of departure. This suggests that the increase in female departure rates
does not appear to be being driven by voluntary job changes. I am not, however, unable
to rule out other voluntary explanations for the increase in departures (such as leaving
the market to become a stay-at-home mom). I explore these alternative explanations in
more detail in section 2.6.
Regardless of whether the increase in the gender gap in departures following ex-
ogenous decreases in firm performance is being driven by voluntary or involuntary
departures, the fact that we see the gender gap in departures increasing following an
exogenous change in firm performance allows us to conclude that the gender gap in
departures is not driven solely by gender differences in ability. In section 2.6, I will
discuss potential mechanisms that may be driving this effect. For the remaining dis-
cussion, unless stated otherwise, I will focus on my preferred measure of departure,
INVOLUNTARY.
5.2 Robustness Checks
I conduct a number of robustness checks in which I vary the specification, the sam-
ple restrictions, and check for omitted variable bias. Overall, the results are largely
unchanged. In this subsection, I briefly discuss the robustness checks conducted and
their findings.
The main specification in this study only allows for a discrete jump in departure rates
following negative firm performance. One question is whether the results will change if
an interaction between the continuous measure of performance and gender is included.
Table 2.3 presents results from this specification and shows that the relationship is indeed
20
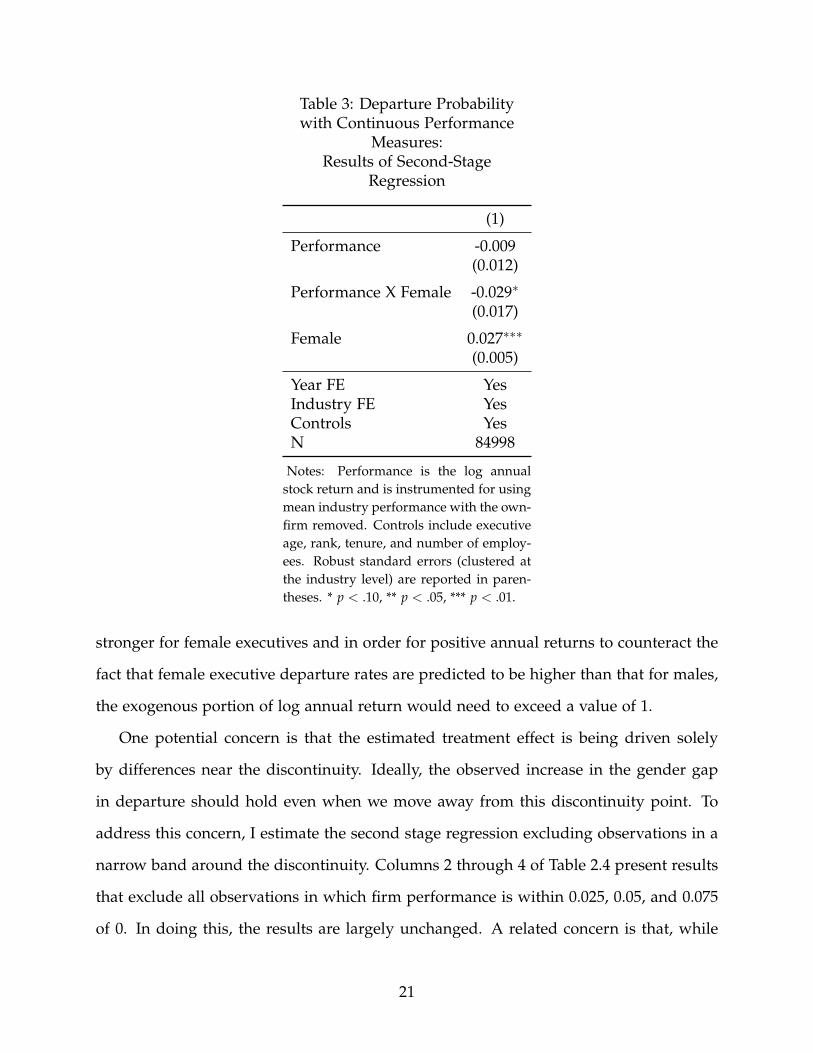
Table 3: Departure Probabilitywith Continuous Performance
Measures:Results of Second-Stage
Regression
(1)
Performance -0.009(0.012)
Performance X Female -0.029∗
(0.017)
Female 0.027∗∗∗
(0.005)
Year FE YesIndustry FE YesControls YesN 84998
Notes: Performance is the log annualstock return and is instrumented for usingmean industry performance with the own-firm removed. Controls include executiveage, rank, tenure, and number of employ-ees. Robust standard errors (clustered atthe industry level) are reported in paren-theses. * p < .10, ** p < .05, *** p < .01.
stronger for female executives and in order for positive annual returns to counteract the
fact that female executive departure rates are predicted to be higher than that for males,
the exogenous portion of log annual return would need to exceed a value of 1.
One potential concern is that the estimated treatment effect is being driven solely
by differences near the discontinuity. Ideally, the observed increase in the gender gap
in departure should hold even when we move away from this discontinuity point. To
address this concern, I estimate the second stage regression excluding observations in a
narrow band around the discontinuity. Columns 2 through 4 of Table 2.4 present results
that exclude all observations in which firm performance is within 0.025, 0.05, and 0.075
of 0. In doing this, the results are largely unchanged. A related concern is that, while
21

zero is a natural and salient cut-off to use when defining negative performance, other
cut-offs may also be worth considering. Column 5 presents results from a regression that
redefines a negative shock to being instances in which performance is below historic
mean returns. In other words, the cutoff is moved from being at zero to being at the
overall mean historic return. While the treatment effect decreases some in magnitude, it
remains both economically and statistically significant. This suggests that the results are
not being driven only by large differences around the discontinuity nor are they being
driven by the choice of cut-off.
Concerns may also arise regarding sample restrictions. Recall that in the primary
specification, executives that have a start year as an executive that is before 1997 are
excluded from the sample. Column 2 of table 2.5 shows that after relaxing this assump-
tion, the effect remains economically and statistically significant. As an additional test,
recall that there exist some gender differences in firm size and that the number of re-
ported executives varies some by firm. One concern stemming from this is that there
may be differences in the firing behavior of large versus small firms that are driving the
treatment effect. To address this, column 3 of Table2. 5 shows that that the primary
treatment effect persists even when the sample is restricted to only include firms that
report between 4 to 6 executives (the range into which most firms fall).
Finally, I check for selection on unobservables stemming from omitted variables. Ex-
ecucomp does not provide information on the background of executives. To address
this, I first compare the primary regression to one without controls. Adding controls
does not have a large effect on the estimated treatment effect. To more rigorously test
for the robustness of the results, I use the method detailed in Oster (2016) to test how
much variation in departures would need to be explained by unobservables in order to
reduce the treatment effect to zero. The standard rule of thumb is to carry out this esti-
mation with the assumption that the maximum possible R-squared (if all unobservables
are included) is 1.3 times the R-squared observed in the regression with controls. Using
22

Table 4: Sensitivity of Departure Probability to Measure of Industry Shocks:Results of Second Stage Regressions
(1) (2) (3) (4) (5)Baseline Exclude Exclude Exclude Alternate
+/-.025 +/-.05 +/-.075 Cut-Off
Negative 0.018 0.023 0.025 0.028(0.018) (0.018) (0.018) (0.018)
Negative X Female 0.050∗∗ 0.042∗ 0.043∗∗ 0.040∗
(0.020) (0.022) (0.022) (0.021)
Female 0.003 0.009 0.008 0.010 0.007(0.007) (0.008) (0.008) (0.008) (0.008)
Below Average 0.007(0.014)
Below Average X Female 0.032∗
(0.017)
Year FE Yes Yes Yes Yes YesIndustry FE Yes Yes Yes Yes YesControls Yes Yes Yes Yes YesN 84998 80343 75789 71452 84998
Notes: Columns 2 through 4 exclude observations with predicted performance in the specificedinterval around 0. Column 5 reports results from a regression in which the definition of anegative shock is changed to be instances in which predicted performance is below the overallindustry mean performance with the own-firm removed. Negative is a dummy variable thatequals 1 when firm performance is negative and is instrumented for using a dummy variablethat equals one when industry peer performance is negative. Below Average is a dummy variablethat equals 1 when predicted performance is below the overall industry mean performance withthe own-firm removed. Controls include executive age, rank, tenure, and number of employees.Robust standard errors (clustered at the industry level) are reported in parentheses. * p < .10,** p < .05, *** p < .01.
23

Table 5: Additional Robustness Tests: Results ofSecond-Stage Regressions
(1) (2) (3)Baseline Include Firms with
Pre-1997 4-6 Executives
Negative 0.018 0.021∗ 0.000(0.018) (0.011) (0.017)
Negative X Female 0.050∗∗ 0.042∗∗ 0.048∗∗
(0.020) (0.018) (0.020)
Female 0.003 0.004 0.001(0.007) (0.007) (0.007)
Year FE Yes Yes YesIndustry FE Yes Yes YesControls Yes Yes YesN 84998 118982 72653
Notes: Negative is a dummy variable that equals 1 when firm perfor-mance is negative and is instrumented for using a dummy variable thatequals one when industry peer performance is negative. Controls in-clude executive age, rank, tenure, and number of employees. Robuststandard errors (clustered at the industry level) are reported in paren-theses. * p < .10, ** p < .05, *** p < .01.
24

this rule of thumb, estimates suggest that unobservables would need to explain over
160 times more variation in departures than observables in order to render the treat-
ment effect null. As a more conservative test, I repeat the Oster test but instead assume
the maximum possible R-squared is 1. Using this maximum R-squared, unobservables
would need to explain 4.74 times more variation in departures than observables. Given
that the standard cutoff for this test is 1, I can confidently reject the hypothesis that the
treatment effect is being driven by omitted variable bias.
6 Mechanisms
So far, I have demonstrated that the gender gap in executive departure increases
following industry downturns, and that this increase is driven solely by a change in the
departure rate of female executives. Given that industry performance is exogenous from
executive ability, the data suggest that this increase is not due to gender differences in
ability.
This section discusses alternative explanations for the observed treatment effect.
Given that the measure of departures used cannot rule out voluntary departure from the
market of Execucomp firms, I first test whether fertility preferences or early retirement
can explain the increases in gender gap in departures following industry contractions.
Neither fertility nor early retirement appear to explain this increase. Next, I consider
whether differences in hiring conditions might account for the increased rate of female
departures and demonstrate that this also does not appear to be driving the observed
effect. The subsequent section then discusses differences in attribution bias or blame as
a plausible remaining explanation.
25

6.1 Fertility
In order to consider the total effect industry contractions may have on fertility behav-
ior of female executives, we must separately consider the substitution and income effect.
An industry-wide contraction will likely affect existing female executives’ pay through
reduced bonuses, as well as reduced stock values. This reduction in pay will reduce the
relative cost of leaving the industry for child-rearing purposes and thus, via the substi-
tution effect, executives will shift away from work and towards child-rearing. However,
the decrease in pay will also reduce the overall income of executives and thus, via the
income effect, will cause executives to work relatively more. Depending on whether the
income or substitution effect dominates, we could see industry contractions increase,
decrease, or not change the rate of departure for fertility reasons of female executives.
Looking at the relationship between the overall labor market and economic fluctua-
tions, it seems unlikely that we would see an increase in fertility decisions by executives
during industry contractions. Overwhelmingly, studies focused on the relationship be-
tween business cycles and fertility find that fertility rates decrease during recessions and
are thus pro-cyclical (refer to Jones and Schoonbroodt (2016), Schneider (2015) for stud-
ies using recent data, and Sobotka et al. (2011) for an extensive survey of earlier studies).
Furthermore, Schaller (2016) finds that the substitution effect is weakest among high-
skilled women, suggesting that fertility rates should decline most among these women
during economic contractions. Thus, in order for fertility to explain the increase in fe-
male executive departure rates during industry contractions, female executives would
need to differ substantially from not only the average female worker, but also from the
average high-skilled female worker.
The data provides further evidence against fertility being the primary mechanism
behind the observed gender difference in departure rates. If female executives depart
more for fertility reasons during economic contractions, then there should be a signifi-
cant decrease in the magnitude and significance of the treatment effect when the sample
26

Table 6: Subsample Analysis using Older Executives:Results of Second Stage Regressions
(1) (2) (3) (4)Baseline Age > 40 Age > 45 Age > 51
Negative 0.018 0.019 0.015 0.022(0.018) (0.019) (0.020) (0.025)
Negative X Female 0.050∗∗ 0.049∗∗ 0.058∗∗∗ 0.088∗∗∗
(0.020) (0.021) (0.021) (0.031)
Female 0.003 0.004 0.004 -0.002(0.007) (0.008) (0.008) (0.012)
Year FE Yes Yes Yes YesIndustry FE Yes Yes Yes YesControls Yes Yes Yes YesN 84998 82643 75415 56500
Notes: Negative is a dummy variable that equals 1 when firm performance isnegative and is instrumented for using a dummy variable that equals one whenindustry peer performance is negative. Controls include executive age, rank,tenure, and number of employees. Robust standard errors (clustered at the in-dustry level) are reported in parentheses. * p < .10, ** p < .05, *** p < .01.
is restricted to exclude younger executives that are more likely to be making fertility
decisions. Table 2.6 presents results when the sample is restricted to executives over the
age of 40 (column 2), over the age of 45 (column 3), and over the average menopausal age
of 51 (column 4). Contrary to what one would expect if economic contractions are lead-
ing women to become stay-at-home moms, the effect of downturns on female executive
departure remains both economically and statistically significant.
As additional tests for fertility as a mechanism, I explore the overall trends for execu-
tives by gender at the market level and look at what happens around the two recessions
observed in the sample (2001 and 2007-2009). If fertility is driving the increase in de-
partures during downturns, then the share of entrants that are women should decrease
during recessions, as women move away from the labor market for fertility. Figure 2.2
shows that this is not occurring and that, if anything, the share of female entrants in-
creased during the recessions. One may also expect to see the age of female entrants
27

increase during recessions as younger women choose not to enter the market for fertil-
ity reasons; however, as Figure 2.3 demonstrates, there is not a consistent relationship
between the change in the age of female entrants across the two observed recessions. Fi-
nally, the average age of departing female executives decline during recessions if women
in their fertile years leave the labor market. Figure 2.4 shows that there is no consis-
tent relationship between the age of departing or non-departing female executives and
recessions.
Figure 2: Percentage of Female Entrants by Year
Overall, the data do not provide any evidence that is consistent with the fertility
mechanism driving the treatment effect. Given the lack of evidence in favor of the
fertility mechanism, in combination with the fact that existing literature suggests fertility
is pro-cyclical, fertility does not appear to be the main factor driving increased female
departure during industry downturns.
28

Figure 3: Average Age of Entrants by Year and Gender
29
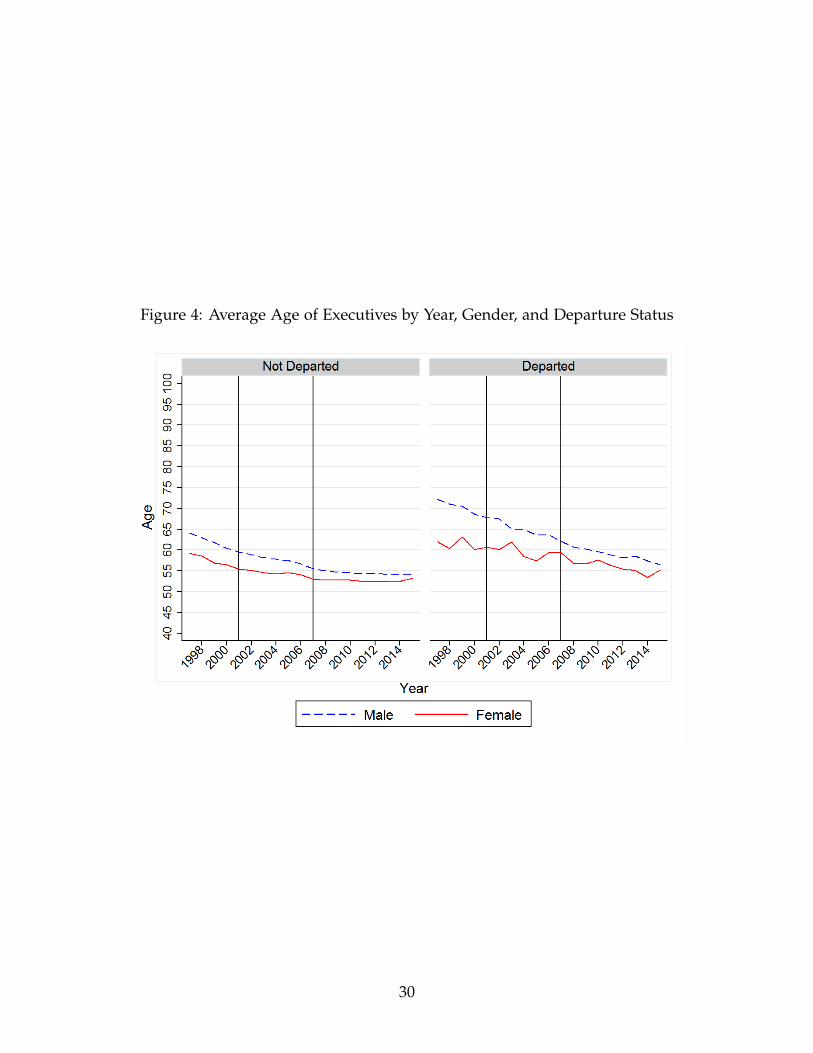
Figure 4: Average Age of Executives by Year, Gender, and Departure Status
30

6.2 Early Retirement
Another possibility is that the observed increase in female departure rates following
downturns is coming from early retirement by female executives. As with fertility, we
need to consider both the income and substitution effects of industry downturns. While
industry downturns will reduce the relative price of early retirement (as discussed in
the fertility section), they also reduce the overall income of executives. In order to be
the mechanism driving increased female departures for during downturns, it would
need to be the case that the substitution effect dominates the income effect for female
executives at retirement age, but not for male executives at retirement age. Furthermore,
pension payments for CEOs and top executives are based on pay around the point of
retirement. Liebersohn (2016) shows that executives take this into account when timing
their retirements and, as a result, retirement among executives is lower during economic
contractions relative to expansions.
Despite the fact that early retirement does not appear to be a likely explanation for
the observed treatment effect given the results in Liebersohn (2016), I investigate it in
more detail via subsample analysis and observation of trends for executives by gender
at the market level. As a first step, I consider what happens to the gender gap in de-
partures following downturns when I restrict the sample to executives below retirement
ages. If early retirement is the mechanism driving increased female departures follow-
ing downturns, the treatment effect should be reduced in magnitude and significance.
As Table 2.7 shows, this does not occur. Restricting the sample to executives below the
classic retirement age of 65 or the younger age of 60, we see that the treatment effect
persists, suggesting early retirement is not the mechanism driving the increased gender
gap in executive departures.
To provide additional evidence against the early retirement mechanism, recall that
we did not see any systematic relationship between executive age and recessions (Figure
3 and Figure 4). Thus, there is no evidence that early retirement is driving the increase
31

Table 7: Subsample Analysis using YoungerExecutives:
Results of Second Stage Regressions
(1) (2) (3)Baseline Age < 65 Age < 60
Negative 0.018 0.017 0.015(0.018) (0.017) (0.019)
Negative X Female 0.050∗∗ 0.049∗∗ 0.054∗∗∗
(0.020) (0.022) (0.019)
Female 0.003 0.000 -0.003(0.007) (0.007) (0.006)
Year FE Yes Yes YesIndustry FE Yes Yes YesControls Yes Yes YesN 84998 73608 60443
Notes: Negative is a dummy variable that equals 1 when firmperformance is negative and is instrumented for using a dummyvariable that equals one when industry peer performance is nega-tive. Controls include executive age, rank, tenure, and number ofemployees. Robust standard errors (clustered at the industry level)are reported in parentheses. * p < .10, ** p < .05, *** p < .01.
32

in female departure rates during downturns.
6.3 Glass Cliff
Another possible explanation for the gender differences in executive departure dur-
ing downturns is the glass cliff. This term was first introduced in Ryan and Haslam
(2005), in response to an article in The Times, which suggested that female leaders nega-
tively affect firm performance. Ryan and Haslam refute this claim and argue that women
are more likely to be appointed into leadership positions during times of market contrac-
tions when firm performance relative to other firms is poor. Thus, female leaders have a
higher likelihood of being appointed to more tenuous positions. Ryan and Haslam refer
to this phenomenon as the glass cliff.17
While several studies have found evidence of the glass cliff phenomenon (e.g., Kulich
et al. (2015); Mulcahy and Linehan (2014); Haslam and Ryan (2008)), there is also evi-
dence suggesting that it may not persist in all settings and may be dependent on the
sampling population and definition of “crisis” within a firm (Adams et al., 2009; Cook
and Glass, 2014; Hennessey et al., 2014). Furthermore, much of the research on the glass
cliff phenomenon focuses on female board members and CEOs. Thus, while it is possi-
ble the glass cliff is contributing to the gender differences in departure, it is also possible
that the glass cliff is not a strong presence within the population of all top executives at
publicly traded US firms.
To explore whether the glass cliff is driving the increase in departure probability of
female executives during downturns, I restrict my attention to the subsample of execu-
tives that were hired when firms were doing better than their industry peers (i.e., when
the residual from the first stage regression is positive), and also to the subsample of ex-
ecutives that were hired when firms were doing better than their industry peers for two
17Reasons for the glass cliff phenomenon include a desire to signal change to investors (Kulich et al.,2015), selection bias (Haslam and Ryan, 2008), and implicit stereotypes that female executives are betterin times of crisis – also known as, “think crisis – think female” (Ryan et al., 2011).
33

Table 8: Subsample Analysis using Executives Hired when Firm isPerforming Well Relative to Peers: Results of Second-Stage Regressions
(1) (2) (3)Baseline Industry-Adjusted Industry-Adjusted
Return Positive Return Positivewhen Hired when Hired
and Prior Year
Negative 0.018 0.040∗∗ 0.050∗
(0.018) (0.017) (0.028)
Negative X Female 0.050∗∗ 0.085∗∗∗ 0.079∗∗
(0.020) (0.026) (0.031)
Female 0.003 -0.010 -0.014∗
(0.007) (0.007) (0.009)
Year FE Yes Yes YesIndustry FE Yes Yes YesControls Yes Yes YesN 84998 51376 35111
Notes: Negative is a dummy variable that equals 1 when firm performance is negativeand is instrumented for using a dummy variable that equals one when industry peerperformance is negative.. Controls include executive age, rank, tenure, and numberof employees. Robust standard errors (clustered at the industry level) are reported inparentheses. * p < .10, ** p < .05, *** p < .01.
consecutive years. These subsamples represent the set of executives that are least likely
to be glass cliff hires for females, and thus we should no longer observe the treatment
effect if the glass cliff is driving the results. Table 2.8 shows that this is not the case.
Even among the set of executives hired in firms that are doing relatively well, female
executives’ departure probability increases during downturns.
As a secondary test of whether the glass cliff hypothesis is driving the treatment
effect, I consider a subsample of executives with longer tenure. Given that glass cliff
executives are hired into more tenuous positions, one may expect that their expected
tenure is much shorter than that of non-glass cliff hires. As such, the effect of industry
downturns on female departures should be weaker among executives with longer tenure.
This subsample analysis is slightly trickier to interpret, because executives with longer
34
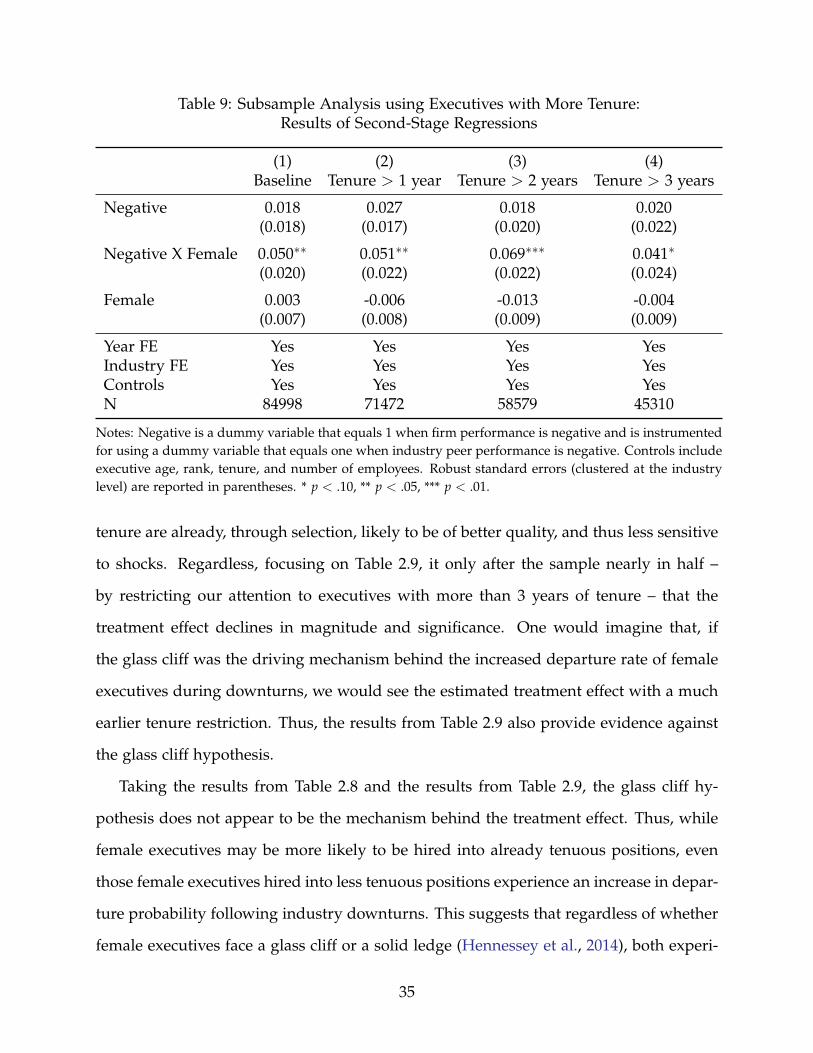
Table 9: Subsample Analysis using Executives with More Tenure:Results of Second-Stage Regressions
(1) (2) (3) (4)Baseline Tenure > 1 year Tenure > 2 years Tenure > 3 years
Negative 0.018 0.027 0.018 0.020(0.018) (0.017) (0.020) (0.022)
Negative X Female 0.050∗∗ 0.051∗∗ 0.069∗∗∗ 0.041∗
(0.020) (0.022) (0.022) (0.024)
Female 0.003 -0.006 -0.013 -0.004(0.007) (0.008) (0.009) (0.009)
Year FE Yes Yes Yes YesIndustry FE Yes Yes Yes YesControls Yes Yes Yes YesN 84998 71472 58579 45310
Notes: Negative is a dummy variable that equals 1 when firm performance is negative and is instrumentedfor using a dummy variable that equals one when industry peer performance is negative. Controls includeexecutive age, rank, tenure, and number of employees. Robust standard errors (clustered at the industrylevel) are reported in parentheses. * p < .10, ** p < .05, *** p < .01.
tenure are already, through selection, likely to be of better quality, and thus less sensitive
to shocks. Regardless, focusing on Table 2.9, it only after the sample nearly in half –
by restricting our attention to executives with more than 3 years of tenure – that the
treatment effect declines in magnitude and significance. One would imagine that, if
the glass cliff was the driving mechanism behind the increased departure rate of female
executives during downturns, we would see the estimated treatment effect with a much
earlier tenure restriction. Thus, the results from Table 2.9 also provide evidence against
the glass cliff hypothesis.
Taking the results from Table 2.8 and the results from Table 2.9, the glass cliff hy-
pothesis does not appear to be the mechanism behind the treatment effect. Thus, while
female executives may be more likely to be hired into already tenuous positions, even
those female executives hired into less tenuous positions experience an increase in depar-
ture probability following industry downturns. This suggests that regardless of whether
female executives face a glass cliff or a solid ledge (Hennessey et al., 2014), both experi-
35

ence a precipitous drop when the ground starts to shake.
6.4 External Hires
There exists some evidence that, conditional on being appointed to a CEO position,
females are more likely to come from an external appointment than males. In a sample
of CEOs from 2004 to 2015, 77% of male appointments were internal, whereas only
68% of female appointments were internal (Study, 2016). Expanding to the set of all
top executives, however, the picture is less clear. Quintana-Garcıa and Elvira (2017)
finds that, in a sample of technology firms, female executives are actually less likely to
be externally hired than male executives. In contrast, Fernandez-Mateo and Fernandez
(2016) finds that, in a proprietary sample of firms that rely partially on an external hiring
agent, female executives are more likely to be externally hired. One could expect that
this may lead to those executives having weaker internal networks and thus being more
exposed to exogenous declines in firm performance.
There is mixed evidence on whether being externally hired is detrimental to exec-
utive success. While on the one hand, externally hired executives tend to experience
higher starting compensation than internal hires (Bidwell, 2011), this benefit is generally
limited to males (Brett and Stroh, 1997; Dreher et al., 2011). In fact, Quintana-Garcıa
and Elvira (2017) argues that externally hired female executives may fare worse with
respect to compensation than internally hired female executives due to more discretion
in pay setting for external hires. It is unclear, however, to what extent the results in
Quintana-Garcıa and Elvira (2017) will generalize to executive departure, given that the
disadvantage they find for female external hires stems from gender differences in pay-
setting behavior.
Focusing more narrowly on departures, neither Dikolli et al. (2014) nor Yonker (2016)
find a significant relationship between being externally hired and departure probability.
In contrast, Guay et al. (2014) finds that externally hired CEOs experience higher overall
36

involuntary departure; importantly, however, this study also finds that externally hired
CEOs are less likely to involuntarily depart following exogenous industry shocks. Thus,
if anything, being externally hired would suggest a decrease in the departure probability
following industry downturns.
Considering the overall literature on gender differences in external hire rates and the
literature on the impact of being externally hired on labor market outcomes, it seems
unlikely that differences in external hiring could be driving the gender differences in
departure rates. Specifically, it is unclear whether, when considering all top executives,
there exists a gender difference in external hire probabilities. It also appears that, even
conditional on being an external hire, negative exogenous shocks to firm performance
should at worst have no effect on the departure rates of external hires.
Unfortunately, identifying internal versus external hires in the sample is difficult.
For many executives within the sample, there is missing information on when they first
joined their company.18 Importantly, however, looking at executives fin the sample for
whom I do have information on their join year, I do not observe an overall difference
between male and female executives in the likelihood of being an external hire; 55.4% of
males are externally hired whereas 53.7% of females are externally hired.19 Thus, taking
this in conjunction with the existing literature, this seems to be an unlikely mechanism
for the observed treatment effect.
6.5 Female Start-Ups
One may also think a factor driving the observed treatment effect is a preponderance
of female executives leaving their current positions to create their own startups during
downturns. The argument would be that, due to the downturn, their salaries, pensions,
18Within the sample, this information is missing for 71.9% of the executives and is missing more oftenfor female executives (76.4%) than male executives (71.5%).
19I observe a higher share of being externally hired for female CEOs that closely matches the Study(2016).
37

and other perquisites are smaller, and the opportunity cost of leaving their current job
is therefore reduced. However, in order for this explanation to be likely, the substitution
effect of leaving one’s job during a downturn to pursue a startup would have to outweigh
the income effect of the downturn. Furthermore, (Ewing Marion Kauffman Foundation,
2017) finds no evidence of a higher number of female-created startups during recessions
relative to the number of male-created startups. Therefore, it seems unlikely that the
treatment effect is being driven by female executives leaving their positions to create
startups during downturns.20
7 Misplaced Blame
If the increase in departure rates among female executives following downturns is
not due to differences in leadership ability, fertility, retirement, the glass cliff, or dif-
ferences in external hire rates, what could explain this treatment effect? One remaining
explanation that is consistent with the results presented within this study, and supported
by related findings within the literature on gender differences in labor market outcomes,
is misplaced blame.
It may be the case that boards incorrectly attribute poor firm performance to execu-
tive ability when the executive is female. In other words, it is possible boards may have
a higher likelihood of committing fundamental attribution errors when performance is
poor and the executive in question is female.21 Misplaced blame could also manifest
20One may also be tempted to think that the increased departure rates for female executives duringdownturns could be attributed to gender differences in the size of golden parachutes – the pension andseverance payments top executives receive upon termination. This relies on the argument that the boardwould choose to eliminate an executive’s position as a cost-cutting measure during downturns. However,as discussed previously, unlike other positions, TMT are unlikely to be made redundant. As such, it isunclear what benefit firing an existing executive simply to replace them would serve.
21Existing literature on attribution bias has demonstrated this phenomenon with respect to perceivedleaders whereby individuals exhibit tendencies to over-attribute the role of the leader in both positiveand negative exogenous outcomes (Weber et al., 2001). Attribution bias may also manifest more in badtimes and more often among outsiders (such as among women in top corporate roles during downturns)(Selody, 2010).
38

not as the result of attribution bias from the board, but rather via female executives be-
ing held to different performance standards (and thus punished more readily) relative
to male executives. This could lead to female executives being blamed for outcomes
they could not reasonably have control over or have foreseen. It may also be that the
misplaced blame does not stem directly from the board, but could instead stem from
CEO’s being more likely to use female executives below them as scapegoats for poor
performance. When considering the latter possibility, it is relevant to refer to the find-
ings discussed in Finkelstein et al. (2009) that suggest performance does not provide a
complete explanation for executive turnover. Indeed, Finkelstein et al. (2009) conclude
powerful but underperforming CEOs will shift blame to their TMT executives, result-
ing in the replacement of those executives rather than the CEO. This behavior may also
extend to gender whereby female executives may be blamed more often than males.
There are existing results that provide some evidence in support of women more fre-
quently receiving misplaced blame. Selody (2010) and Albanesi et al. (2015) demonstrate
that female executives’ pay decreases more following negative changes in firm perfor-
mance than does the pay for male executives, whereas male executive pay increases more
than female pay following positive changes in firm performance. Selody (2010) further
documents that male executives’ bonuses increase more following exogenous increases
in firm outcomes than do bonuses for female executives. Not only has research docu-
mented gender asymmetries in the extent to which executives are penalized or rewarded
for their performance, there is also recent evidence documenting how women may be
more harshly punished for blatant misconduct. Looking at financial advisors instead of
executives, Egan et al. (2017) finds that women are more likely to be terminated for mis-
conduct than men, despite the fact that women are less likely to engage in misconduct
and are less likely to be repeat offenders. These results suggest that male and female
employees receive differential treatment for successes and failures.
It is also possible that the differences in blame may not stem from the board or CEO,
39
but may instead be due to gender differences in self-attribution bias. Experimental eco-
nomics literature has not found gender differences in the direction of asymmetric updat-
ing within ego-relevant tasks – e.g., Eil and Rao (2011), Ertac (2011), Mobius et al. (2014).
However, looking instead to the psychology literature, several studies show women are
more likely to attribute failure to internal factors and success to external factors, while
men behave in the opposite manner – e.g., Deaux (1979), Deaux and Emswiller (1974).
This difference in self-attribution behavior may cause female executives to take the blame
for failures that are outside of their control, and thus lead to increased departure.
Identifying blame as a mechanism for increased departure, and separating attribu-
tion error on behalf of the board from attribution error on behalf of executives, is not
possible given the existing data set. Thus, while the results are consistent with blame as
a possible mechanism, I cannot rule out other mechanisms. Future research may wish
to use experimental methodology in order to address these questions.
8 Conclusion
The underrepresentation of women in top-management positions has received sub-
stantial attention within the economics literature. While most studies have focused on
differences in entry into management positions, a smaller set of studies have instead
looked at departure. These studies have largely shown that female executives exhibit
higher departure rates.
Why is it that female executives exhibit higher departure rates than male executives?
One can think of many possible answers to this question. Perhaps the simplest explana-
tion would be gender differences in ability. In order to test for this, one must examine
gender differences in departure resulting from exogenous changes in firm performance.
In this study, I use exogenous changes in firm performance to rule out the ability
channel and show that gender differences in departure still persist. Specifically, using
40

industry performance as an instrument for firm performance, I show that following
industry-wide contractions, the overall departure rate for female executives increases by
approximately 5 percentage points, while no change is observed in the departure rate
for male executives. This increase in departure cannot be explained by differences in
fertility, early retirement, the glass cliff, or differences in external hire rates. I argue
that one remaining channel that is consistent with the observed increase in departure
rates is misplaced blame (e.g., attribution bias, self-attribution bias, or unreasonable
performance standards).
While the results are consistent with a blame hypothesis, other competing mecha-
nisms may remain. As such, one avenue for future related research is using experimental
methodology to test the blame hypothesis and separate out self-attributed blame from
external blame.
41

References
Adams, S. M., Gupta, A., and Leeth, J. D. (2009). Are female executives over-represented
in precarious leadership positions? British Journal of Management, 20(1):1–12.
Albanesi, S., Olivetti, C., and Prados, M. J. (2015). Gender and dynamic agency: Theory
and evidence on the compensation of top executives. Working Paper.
Babcock, L. and Laschever, S. (2003). Women Don’t Ask: Negotiation and the Gender Divide.
Bailey, M. J. and DiPrete, T. A. (2016). HHS Public Access. The Russell Sage Foundation
Journal of the Social Sciences : RSF, 2(4):1–32.
Becker-Blease, J. R., Elkinawy, S., Hoag, C., and Stater, M. (2016). The Effects of Executive,
Firm, and Board Characteristics on Executive Exit. Financial Review, 51(4):527–557.
Becker-Blease, J. R., Elkinawy, S., and Stater, M. (2010). The Impact of Gender on Volun-
tary and Involuntary Departure. Economic Inquiry, 48(4):1102–1118.
Bertrand, M. and Mullainathan, S. (2001). Are CEOs Rewarded for Luck? The Ones
Without Principals Are. The Quarterly Journal of Economics, 116(3):901–932.
Bidwell, M. (2011). Paying More to Get Less: The Effects of External Hiring versus
Internal Mobility. Administrative Science Quarterly, 56(3):369–407.
Blau, F. D. and Kahn, L. M. (2016). The Gender Wage Gap: Extent, Trends, and Explana-
tions. NBER Working Paper Series, 21913:1–75.
Brett, J. M. and Stroh, L. K. (1997). Jumping Ship: Who Benefits From an External Labor
Market Career Strategy? Journal of Applied Psychology, 82(3):331–341.
Cameron, K. S., Freeman, S. J., and Mishra, A. K. (1993). Downsizing and redesigning
organizations.
42

Castanias, R. P. and Helfat, C. E. (1991). Managerial Resources and Rents. Journal of
Management, 17(1):155–171.
Cook, A. and Glass, C. (2014). Women and Top Leadership Positions: Towards an Insti-
tutional Analysis. Gender, Work and Organization, 21(1):91–103.
Deaux, K. (1979). Self-evaluations of male and female managers. Sex Roles, 5(5):571–580.
Deaux, K. and Emswiller, T. (1974). Explanations of successful performance on sex-
linked tasks: What is skill for the male is luck for the female. Journal of Personality and
Social Psychology, 29(1):80–85.
DellaVigna, S. (2009). Psychology and economics: Evidence from the field. Journal of
Economic Literature, 47(2):315–372.
Dikolli, S. S., Mayew, W. J., and Nanda, D. (2014). CEO tenure and the performance-
turnover relation. Review of Accounting Studies, 19(1):281–327.
Dreher, G. F., Lee, J.-Y., and Clerkin, T. A. (2011). Mobility and Cash Compensation: The
Moderating Effects of Gender, Race, and Executive Search Firms. Journal of Manage-
ment, 37(3):651–681.
Egan, M. L., Matvos, G., and Seru, A. (2017). When Harry Fired Sally: The Double
Standard in Punishing Misconduct.
Eil, D. and Rao, J. M. (2011). The good news-bad news effect: Asymmetric processing
of objective information about yourself. American Economic Journal: Microeconomics,
3(2):114–138.
Ertac, S. (2011). Does self-relevance affect information processing? Experimental ev-
idence on the response to performance and non-performance feedback. Journal of
Economic Behavior and Organization, 80(3):532–545.
43

Ewing Marion Kauffman Foundation (2017). 2017 Kauffman Index of Startup Activity
Ewing Marion Kauffman Foundation. Technical report.
Fama, E. F. and French, K. R. (1997). Industry costs of equity. Journal of Financial Eco-
nomics, 43(2):153–193.
Fee, C. E., Hadlock, C. J., Huang, J., and Pierce, J. R. (2015). Robust Models of CEO
Turnover: New Evidence on Relative Performance Evaluation.
Fernandez-Mateo, I. and Fernandez, R. M. (2016). Bending the Pipeline? Executive
Search and Gender Inequality in Hiring for Top Management Jobs. Management Sci-
ence, 62(12):3636–3655.
Finkelstein, S., Hambrick, D., and Cannella, A. (2009). Strategic leadership: Theory and
research on executives, top management teams, and boards.
Gayle, G.-L., Golan, L., and Miller, R. A. (2012). Gender Differences in Executive Com-
pensation and Job Mobility. Journal of Labor Economics, 30(4):829–872.
Guay, W., Taylor, D. J., and Xiao, J. J. (2014). Adapt or Perish: Evidence of CEO Adapt-
ability to Industry Shocks.
Guest, P. M. (2016). Executive Mobility and Minority Status. Industrial Relations,
55(4):604–631.
Guvenen, F., Kaplan, G., and Song, J. (2014). The Glass Ceiling and the Paper Floor:
Gender Differences among Top Earners, 1981-2012. National Bureau of Economic Re-
search Working Paper Series, pages 1981–2012.
Hambrick, D. C. and Mason, P. A. (1984). Upper Echelons: The Organization as a Re-
flection of Its Top Managers. Academy of Management Review, 9(2):193–206.
44

Haslam, S. A. and Ryan, M. K. (2008). The road to the glass cliff: Differences in the
perceived suitability of men and women for leadership positions in succeeding and
failing organizations. Leadership Quarterly, 19(5):530–546.
Hennessey, S. M., MacDonald, K., and Carroll, W. (2014). Is there a ”glass cliff or a
solid ledge for female appointees To the Board of Directors? Journal of Organizational
Culture, Communications & Conflict, 18(2):125–139.
Holmstrom, B. (1982). Moral hazard in teams. Bell Journal of Economics, 11(2):74–91.
Homroy, S. (2015). Are CEOs replaced for poor performance? Effects of takeovers and
governance on CEO turnover. Scottish Journal of Political Economy, 62(2):149–170.
Jensen, M. C. and Murphy, K. J. (1990). Performance pay and top-management incen-
tives. Journal of political economy, 98(2):225–264.
Jenter, D. and Kanaan, F. (2006). CEO Turnover and Relative Performance Evaluation.
Jenter, D. and Kanaan, F. (2015). CEO Turnover and Relative Performance Evaluation.
The Journal of Finance, 70(5):2155–2184.
Jenter, D. and Lewellen, K. (2010). Performance-induced CEO turnover.
Jones, L. E. and Schoonbroodt, A. (2016). Baby busts and baby booms: The fertility
response to shocks in dynastic models. Review of Economic Dynamics, 22:157–178.
Kahneman, D. and Tversky, A. (1979). Prospect Theory: An Analysis of Decision under
Risk. Econometrica, 47(2):263–292.
Kark, R. and Eagly, A. H. (2010). Gender and Leadership: Negotiating the Labyrinth. In
Handbook of Gender Research in Psychology, pages 443–468.
Koszegi, B. and Rabin, M. (2006). A Model of Reference-Dependent Preferences. The
Quarterly Journal of Economics, 121(4):1133–1165.
45

Krishnan, H. A. and Park, D. (1998). Effects of Top Management Team Change on Perfor-
mance in Downsized US Companies. Management International Review, 38(4):303–319.
Kulich, C., Lorenzi-Cioldi, F., Iacoviello, V., Faniko, K., and Ryan, M. K. (2015). Signaling
change during a crisis: Refining conditions for the glass cliff. Journal of Experimental
Social Psychology, 61:96–103.
Liebersohn, C. J. (2016). The Cyclicality of Executive Turnover.
Marzilli Ericson, K. M. and Fuster, A. (2014). The Endowment Effect. Annual Review of
Economics, 6(1):555–579.
Mobius, M. M., Niederle, M., Niehaus, P., and Rosenblat, T. S. (2014). Managing Self-
Confidence. Working Paper.
Mulcahy, M. and Linehan, C. (2014). Females and Precarious Board Positions: Further
Evidence of the Glass Cliff. British Journal of Management, 25(3):425–438.
Murphy, K. J. (1999). Chapter 38 Executive compensation. Handbook of Labor Economics,
3 PART(2):2485–2563.
Niederle, M. and Vesterlund, L. (2007). Do Women Shy Away From Competition? Do
Men Compete Too Much? The Quarterly Journal of Economics, 122(3):1067–1101.
Oster, E. (2016). Unobservable Selection and Coefficient Stability: Theory and Evidence.
Journal of Business & Economic Statistics, pages 1–18.
Parrino, R. (1997). CEO turnover and outside succession: A cross-sectional analysis.
Journal of Financial Economics, 46(2):165–197.
Quintana-Garcıa, C. and Elvira, M. M. (2017). The Effect of the External Labor Market
on the Gender Pay Gap among Executives. ILR Review, 70(1):132–159.
46

Ryan, M. K. and Haslam, S. A. (2005). The glass cliff: Evidence that women are over-
represented in precarious leadership positions. British Journal of Management, 16(2):81–
90.
Ryan, M. K., Haslam, S. A., Hersby, M. D., and Bongiorno, R. (2011). Think crisis–think
female: The glass cliff and contextual variation in the think manager–think male
stereotype. Journal of Applied Psychology, 96(3):470–484.
Schaller, J. (2016). Booms, Busts, and Fertility Testing the Becker Model Using Gender-
Specific Labor Demand. Journal of Human Resources, 51(1):1–29.
Schneider, D. (2015). The Great Recession, Fertility, and Uncertainty: Evidence From the
United States. Journal of Marriage and Family, 77(5):1144–1156.
Selody, K. (2010). Is the Risk Worth the Reward for Top Female Executives?
Sobotka, T., Skirbekk, V., and Philipov, D. (2011). Economic recession and fertility in the
developed world.
Stefanescu, I., Wang, Y., Xie, K., and Yang, J. (2015). Pay Me Now ( and Later ): Pension
Benefit Manipulation before Plan Freezes and Executive Retirement.
Study, C. S. (2016). CEO Success Study. Technical report.
The Rockefeller Foundation and Global Strategy Group (2016). Does the media influ-
ence h ow we perceive women in leadership ? CEOs and gender : a media analysis.
Technical report.
Weber, R., Camerer, C., Rottenstreich, Y., and Knez, M. (2001). The illusion of leadership:
Misattribution of cause in coordination games. Organization Science, 12(5):582–598.
Yonker, S. E. (2016). Geography and the Market for CEOs. Management Science, 63(3):609–
630.
47