gemstone and gold marketing forsmall scale mining in tanzania
TRANSCRIPT
•
•
International Business Initiatives
GEMSTONE AND GOLDMARKETING FOR SMALL SCALE
MINING IN TANZANIA
FINAL REPORT FOR PHASE IUSAID Equity and Growth through Economic Research
Trade Policy Studies
ECONOMIC AND SOCIAL RESEARCH FOUNDATION(ESRF)
TAN DISCOVERYand
INTERNATIONAL BUSINESS INITIATIVES(IBI)
April 14, 1998
1530 Key Blvd, suite 714Rosslyn, Va 22209
Tel. 703 525-2277 Fax 703 525-2211email: [email protected]
•
•
ii
ACKNOWLEDGMENTS
The team that conducted this study comprised Rogers Sezinga (TanDiscovery), Lucie ColvinPhillips (IBI), Haji Semboja and Godius Kahyarara (ESRF). The Policy Advisory Committee thatsupervised it comprised, in their individual capacities, the Commissioner of Mines Gray .Mwakalukwa, Director of the ESRF Professor Samuel Wangwe, Chairman of the Chamber of MinesSamuel Lwakatare, and several representatives of the government and academic community. Thestudy was funded by United States Agency for International Development (USAID) under theEquity and Growth through Economic Research Trade Policy cooperative agreement(EAGER/Trade), through subagreements by the primary recipient, Associates for InternationalResources and Development (AIRD), with IBI and ESRF. To the people in all of theseorganizations, and the friends, miners, brokers, dealers and Ministry of Energy and Mineralsrepresentatives who so graciously contributed their time and thoughts to this effort, we say aheartfelt thanks. They deserve most of the credit for the study, but none of the blame. The viewsrepresented here are those ofthe authors, not of the US or Tanzanian governments or any of theiragencies. Any errors or omissions are the responsibility of the authors.
iii
Table of Contents
Executive Summary '. . . . . . . . . . . . . . . . . . . . . . . . .. v
1. INlRODUCTION 11.1 Background . . . . . . . . . . . . . . . . . . . . . . . . . . . . . . . . . . . . . . . . . . . . . . . . . . . . . . . . . .. 11.2 Government Objectives for the Sector . . . . . . . . . . . . . . . . . . . . . . . . . . . . . . . . . . . . .. 21.3 Purpose of this Study 31.4 Methodology . . . . . . . . . . . . . . . . . . . . . . . . . . . . . . . . . . . . . . . . . . . . . . . . . . . . . . . . .. 5
1.4.1 The consultative process . . . . . . . . . . . . . . . . . . . . . . . . . . . . . . . . . . . . . . . .. 51.4.2 Field interviews and data collection 51.4.3 Review of available literature 7
2. MARKETING FOR SMALL SCALE MINING IN TANZANIA. . . . . . . . . . . . . . . . . . . . . .. 112.1 Background of Mineral Marketing in Tanzania .. . . . . .. . . . . . . . . . . . . . . . . . . . . .. 112.2 Structure and Characteristics of the Market. . . . . . . . . . . . . . . . . . . . . . . . . . . . . . . .. 12
2.2.1 Economic Geography of Mineral Markets . . . . . . . . . . . . . .. . . . . . . . . . .. 122.2.2 The Marketing Chain 12
2.3 Profiles of the Participants in the Minerals Markets ~ . . . . . . . . .. 152.3.1 Mine Workers 152.3.2 Claim holders 182.3.3 Brokers 202.3.4 Master Dealers 24
2.4 Factors influencing prices of gold and gemstones 26
3. SECONDARY ECONOMIC ACTIVITIES IN MINING COMMUNITIES 293.1 The Impact of Various Economic·Activities in Mining Areas 30
4. ECONOMIC EVALUAnON OF THE GEM AND GOLD TRADES. . . . . . . . . . . . . . . . . . .. 334.1 Economic Analysis . . . . . . . . . . . . . . . . . . . . . . . . . . . . . . . . . . . . . . . . . . . . . . . . . . .. 33
4.1.1 Methods Used 334.1.2. Results 394.2.3. Contribution to GDP from Mining Using the Income Method .. . . . . . . .. 48
4.3. Foreign Exchange and Minerals Marketing 494.3.1 Impact of Minerals Exports on FOREX Earnings 494.3.2 Impact of Exchange Controls and Currency Fluctuations on the Trade 49
4.4 Revenue Implications of Employment and Income Generated in Artisanal Mining .. 504.5 Policies Favouring Value Added Activities 514.6 Negative Externalities from Artisanal Mining . . . . . . . . . . . . . . . . . . . . . . . . . . . . . .. 53
5. OPPORTUNITIES AND CONSTRAINTS IN MINERALS MARKETING ..... . . . . . . . . .. 555.1 Opportunities. . . . . . . . . . . . . . . . . . . . . . . . . . . . . . . . . . . . . . . . . . . . . . . . . . . . . . . .. 55
5.1.1 Balanced Development of Modern and Artisanal Mining 555.1.2 Competing with Kenya 575.1.3 Developing downstream value-added activities 58
5.2 Constraints and their policy implications . . . . . . . . . . . . . . . . . . . . . . . . . . . . . . . . . .. 595.2.1 The fiscal regime 59

iv
5.2.1.1 High and unpredictable tax levels 595.2.1.2 Many different taxes, payable to different authorities. . . . . . . . . . . . . . .. 595.2.1.3. Fears of future taxation 605.2.1.4. Cumbersome and unclear tax payment procedures 605.2.1.5 An inequitable taxation system 60
5.3 Asymmetric information and the skills gap 60504 Bureaucracy and cumbersome procedures in the marketing of minerals 635.5 Lack ofenforcement of marketing regulations 0 635.6 Financial constraints o. 645.7 Lack ofIndependent Appraisals ofValue 645.8 Smuggling 0 ••••••••••••••••••••••••••••• 0 ••••• 0 •• 0 •••••• 0 ••••••••••• 0 65
5.8.1 Motives for Smuggling o ••••••••••••••• 0 •••• 0 .0 ••••••••••••••••• 655.8.2 Why Kenyan dealers offer a better market. 0 • 0 0 • 0 ••••••••••••••••••• 665.8.3 Nationality and smuggling 0 ••• 0 • 0 0 • • • • • • • • • • • • • • • • • •• 67
6.RECOMMENDAnONS FOR BEITER INTEGRATED MINERAL MARKETS. . . . . . . . .. 696.1 General Recommendations 0 ••••••••••••••••• 0 • • • • • •.• • • • • • • • • • • • • •• 696.2 Government Ministries 0 0 0 0 0 • • • • • • • • • • • • • • • • • • • • • • • • • • • • • • • • • • • • • • •• 716.3 Financial Services 0 • 0 •• 0 ••••••••• 0' •••••••••• 0. • • • • • • • • • • • • • • • • •• 746.4 Mineral Markets Promotion 0.0 •••••••••••••••••••••••••••••••••••••••••• 756.5 Improve Socioeconomic Situation in Mining Communities. . . . . . . . . . . . . . . . . . . .. 766.6 Balance the Interests and Activities of Fonnal and Artisanal Mining .. 0 •• 0 •••••• 0 76
ANNEX 1 .. 000 ••••••••••••••••• 0 ••••••••••••••••••••••••••••••••••• 0 0 ••••••••• 79ANNEX 2 0.0 •••••••••••••••••••••••••••••••••••••••••••••••••• 0 •• 0.0 ••••••• : •• 81ANNEX 3 .. 00 ••••••••••••••••••••••••••••••••••• 0 •••••••••••• 0 0 0 0 0 0 ••••••••••• 89ANNEX 4 0.0 •••••••••••••••••••••••••••••••••••••••••••••••••• 0.00 ••••••••••• 101ANNEX 5 0 •••••••••••••••••••••••••••••••••••••••• 0.00 ••••••••••• 113ANNEX 6 0 0 •••••••••••••••• 0 0 ••••••••••• 115BIBLIOGRAPHY 0 •• 0 0 • • • • • • • • • • • • • • • • • • • • • • • • • • • • •• 119
v
Executive Summary
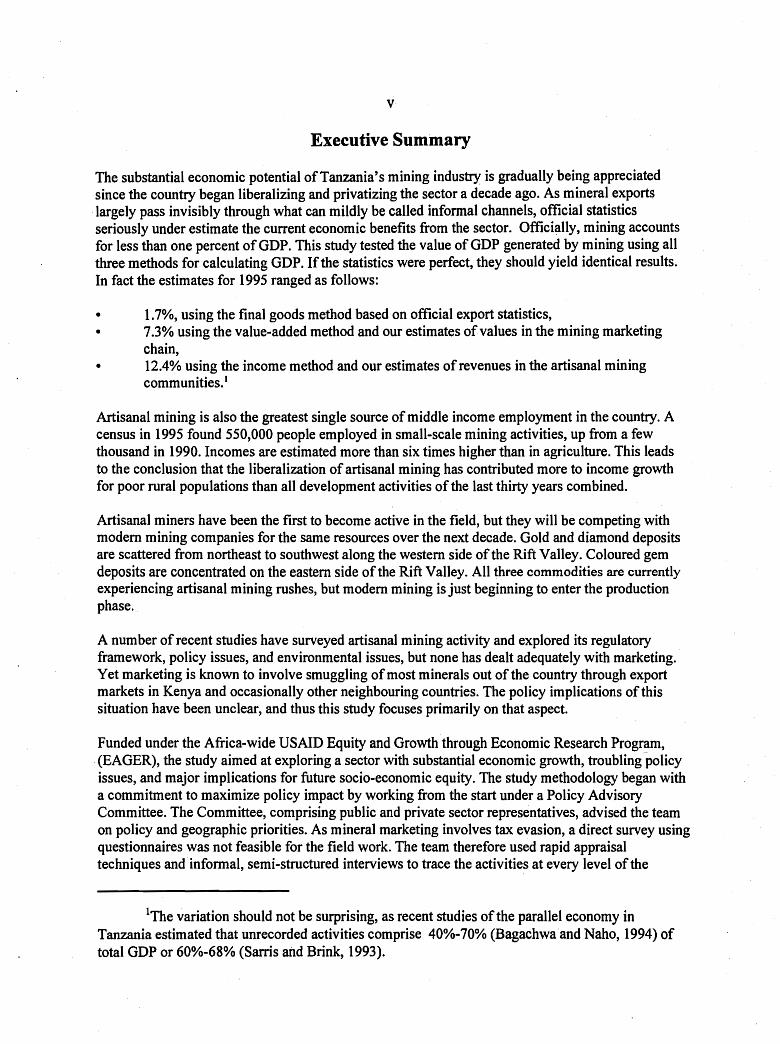
The substantial economic potential of Tanzania's mining industry is gradually being appreciatedsince the country began liberalizing and privatizing the sector a decade ago. As mineral exportslargely pass invisibly through what can mildly be called informal channels, official statisticsseriously under estimate the current economic benefits from the sector. Officially, mining accountsfor less than one percent of GOP. This study tested the value of GOP generated by mining using allthree methods for calculating GOP. If the statistics were perfect, they should yield identical.results.In fact the estimates for 1995 ranged as follows:
• 1.70/0, using the final goods method based on official export statistics,• 7.30/0 using the value-added method and our estimates ofvalues in the mining marketing
chain,• 12.40/0 using the income method and our estimates of revenues in the artisanal mining
communities. 1
Artisanal mining is also the greatest single source of middle income employment in the country. Acensus in 1995 found 550,000 people employed in small-scale mining activities, up from a fewthousand in 1990. Incomes are estimated more than six times higher than in agriculture. This leadsto the conclusion that the liberalization of artisanal mining has contributed more to income growthfor poor rural populations than all development activities of the last thirty years combined.
Artisanal miners have been the first to become active in the field, but they will be competing withmodern mining companies for the same resources over the next decade. Gold and diamond depositsare scattered from northeast to southwest along the western side of the Rift Valley. Coloured gemdeposits are concentrated on the eastern side of the Rift Valley. All three commodities are currentlyexperiencing artisanal mining rushes, but modem mining is just beginning to enter the productionphase.
A number of recent studies have surveyed artisanal mining activity and explored its regulatoryframework, policy issues, and environmental issues, but none has dealt adequately with marketing.Yet marketing is known to involve smuggling ofmost minerals out of the country through exportmarkets in Kenya and occasionally other neighbouring countries. The policy implications of thissituation have been unclear, and thus this study focuses primarily on that aspect.
Funded under the Africa-wide USAID Equity and Growth through Economic Research Program,.(EAGER), the study aimed at exploring a sector with substantial economic growth, troublingpolicyissues, and major implications for future socio-economic equity. The study methodology began witha commitment to maximize policy impact by working from the start under a Policy AdvisoryCommittee. The Committee, comprising public and private sector representatives, advised the teamon policy and geographic priorities. As mineral marketing involves tax evasion, a direct survey usingquestionnaires was not feasible for the field work. The team therefore used rapid appraisaltechniques and· informal, semi-structured interviews to trace the activities at every level of the
lThe variation should not be surprising, as recent studies of the parallel economy inTanzania estimated that unrecorded activities comprise 40%-70% (Bagachwaand Naho, 1994) oftotal GDP or 60%-68% (Sarris and Brink, 1993).
vi
marketing chain. This allowed the team to estimate the proportions of commodities followingdifferent routes and to understand the logic of the participants. The price data provided was used toanalyse the relative benefits gained by Tanzania and Kenya from the trade in the north. Only thenorthern half ofthe country could be covered with the one-year grant available. Thus the major gemrush area in the south, where 250,000 miners were active by 1995, remains for further study.
The results from the north were nonetheless important. They showed that 95% of the gold and atleast 60% of the gemstones currently go overland, mainly through Kenya, for export. Because mostof the value added is in the mining and the early stages ofthe marketing, Tanzania neverthelessgains the most economic benefit. An estimated 77% of value-added from gold and 71% ofvalueadded from gemstones stays in Tanzania. The total value of gold and gemstone exports is, by a lowestimate, US$69 million, and by a high estimate US$299 million per year over the last couple ofyears. Better estimates are expected to be made in subsequent phase of the study.
The employment and income effects of mineral liberalization have been striking. The numbersemployed at least part-time in mining have increased from a few thousand in 1990 to 330,000 in1993 and 550,000 in 1995. Their earnings are at least six times the reservation wage in agriculture,and the income pyramid extends considerably higher than in agriculture. In a country with only 1.2million salaried jobs, this has increased the number of people with middle incomes by 46% in just afew years.
Opportunities and constraints in this sector are numerous and complicated. The main opportunitiesfor continued growth with equity are three.
(l) Preserving a balance between modem mining and artisanal mining, or, expressedanother way, between capital intensive and labour-intensive mining.
(2) Attracting more of the trade to Tanzania from current market circuits in Kenya.(3) Promoting upstream and downstream value-added activities in Tanzania.
Attempts to levy transaction taxes, too many and at too high rates, are primarily responsible fordriving trade into Kenya. Other constraints among Tanzanian dealers include insecurity, undercapitalization, cumbersome and extremely bureaucratic procedures, and lack of information, skills,and infrastructure. The weight of historical market connections is also important, as Nairobi hasbeen the centre of gem and gold trading in the region for decades.
The study recommends that transaction taxes be eliminated except for royalties. Royalties arejustified to finance proper stewardship of depleting resources, if they are actually used for thatpurpose. They must, however, be at a bearable rate. We estimate this to be 1.1% to 1.5 % for goldand 2%-3% for gemstones.
Also recommended is the zoning of reserved mining areas for artisanal mining, with artisanal minershaving second choice of reef mining sites and first choice for alluvial mining.
1.1. Background
The substantial economic potential of Tanzania's mining industry is increasingly being appreciatedsince the country began liberalizing and privatizing the sector a decade ago. The comprehensiveeconomic reforms adopted in the mid 1980s have led to the liberalization ofthe mining sector,followed by a dramatic increase in private sector participation in mineral trade and production.According to the official statistics, it still contributes only about 1 percent ofthe GDP, and roughly20/0 of the total export earnings. These figures, however, seriously underestimate the value ofcurrentmining and related activities, as artisanal mining of gold, coloured gems and diamonds and therelated marketing mainly lies within the informal sector. Employment and income growth in themining sector are also on the rise and a census in 1995 found that 550,000 people were employed inthe sector (Tan Discovery, 1996). There are only 1.2 million total salaried jobs in Tanzania, whichmeans that the mining sector has added another 46% of middle income jobs to the total employment,mostly in the last five years. No other sector has made a similar contribution to social well-being andincome distribution. These jobs may be at risk, however, as more formal mining investments aredeveloping rapidly.
Official statistics also do not reflect the potential that Tanzania has in the mining sector, as reserveshave not been systematically evaluated. Recent studies show that the sector has an immediatepotential for rapid growth in the next few years (Intra governmental Export Strategy Task Force,1995).
1.1.1 Mineral Geology
Tanzania has a rich mineral resource base. Geological mapping, exploration and mining activitiesdating back to the early twentieth century culminated in the first comprehensive geological andminerals survey in 1958, which is still a classic (Harris, 1958). This was recently updated for thegovernment (Ministry of Energy and Minerals, ed. Brian Hester, .1992, 1995). Artisanal miners andmajor companies, however, are both interested in gold, diamond, and coloured gems. The gold anddiamond reserves have been well documented in UNDP-sponsored studies and studies sponsored byprivate mining companies. Commercially, viable deposits are scattered along the western side of theRift Valley, gold in the greenstone belts of the Archean craton and diamonds in the hundreds ofKimberlite pipes throughout the same geographic area.
Gold mining activity is concentrated in three major areas, but activity often shifts as old depositsbecome less profitable and new ones are found. The main gold areas include the following:
• the Lake Zone gold fields, south and east ofLake Victoria, up to the Kenya border. The mostactive sites are Geita, Bulyanhulu near Kahama, Irambe, Sekenke, Kilima Fedha, Serengeti,Nyambegena, Buzroba, Matinje, Musoma and Tarime (north Mara).the Lupa area in Chunya District of Mbeya Region near the Zambia border. The most activemining sites are Saza, Makongolosi, Ntumbi, Chunya, Lupa-Sira, Sengambi, Mabadaga andIyai.Mpanda, with six active mining areas: D-reef, Magamba, Kapanda, Kitisunga, Ibindi, andSikitiko.
1
new sites at Lukalasi in Mbinga district, Kitowero in Liwale district and Buma in Manyonidistrict.
The major diamond mining areas are in northern Tanzania, around Shinyanga, Mwananga, Mabukiand Mwanza. Williamson Diamond Mine is the only formal mining operation, but diamonds worth anestimated $13 million to $16 million per year (VethouseIUSAID, 1995) are produced by artisanalminers and exported, mostly through informal channels.
Commercially exploitable deposits ofcoloured gems tend to be found on the eastern side ofthe RiftValley. They also were originally discovered and exploited by individuals and small companies. Theyare now the subject of a mining rush comparable to that of Brazil in the 1980s. This geographicregion hosts two gemstones unique in the world, Tanzanite and green garnet (called Tsavorite inKenya, for the Tsavo area in which it was originally found). The only known deposit ofTanzanite inthe world lies near Merelani, in northern Tanzania between Arusha and Moshi. This is a brilliant butslightly brittle gemstone ranging in colour from pale violet to deep blue-violet. It was popularized byTiffany's in the late 1970s, and commanded a peak priceofUS$2500 per carat by 1983. Morerecently rare and precious Alexandrites, previously known only in Sri Lanka, have been found insouthern Tanzania near Tunduru. There are extensivedeposits of ruby (Morogoro and Umba River),sapphire, garnet, tourmaline (Umba River and Tunduru), emerald, chrysoberyl and other semiprecious gems (Tunduru).
1.2 Government Objectives for the Sector
The government has set the following objectives for the mining sector (Ministry of Energy andMinerals, 1997):
(1) to maximize fiscal and export earnings; and
(ii) to raise the contribution of the sector to total country GDP to at least 10% by the year2025.2
To attain these objectives, the government has recently commissioned a number of studies of themining sector, and sought support in the form ofa US$12 million five-year World Bank technicalassistance programme.
The government is also committed to make the mineral sector's development more regionally andglobally competitive and more efficient. It seeks to attract more of the production to formal exportchannels. This· is an attempt to make the sector more flexible and withstand both internal and externalchanges that might affect its progress.
It is envisaged that the mineral sector will substantially contribute towards income generation,employment creation, social and economic infrastructural development -- particularly for the rural
2This target is based on official statistics, which currently peg minerals exports at slightlyunder 2 percent ofGDP. The current study estimates that minerals exports actually comprise tenpercent or more ofGDP already, hidden by the fact that they do not go through official channels. Ahigher target·could therefore be set.
2
areas, and increase foreign exchange earnings and government revenue. In order to achieve themineral sector objectives, increased private sector participation in the mineral sector's developmentand reduction of the government's direct involvement in mineral production activities are beingemphasized. The government, however, shall continue to maintain the promotional and regulatoryrole in directing the activities of the mineral sector.
Factors that impede the effectiveness of the private sector in the country's mineral development, suchas the lack of stable fiscal and non-fiscal incentive packages, the institutional and legal framework,and the relevant financial and technological arrangements are being addressed. New mineral policyand mineral development strategies have been prepared and are being reviewed with a view to issuinga new Mining Code in 1997.
1.3. Purpose of this Study
This study is funded by USAID's Equity and Growth through Economic Research program, TradePolicy Component (EAGERffrade). This is an Africa-wide demand-driven policy researchprogramme, designed to fund studies that facilitate policy reforms aimed at accelerating growth whilepreserving socio-economic equity. This study, like others in the program, focuses on a sector withhigh potential growth that is currently inhibited by policy uncertainties during a transition from astatist to a market-oriented economy. It seeks to determine the policyframework most likely toenhance growth and socio-economic equity (in this case, mainly employment). At the same time, itrecognizes the need to maintain government revenues, so the fiscal implications of each policyrecommendation are analyzed. As policies must be politically feasible, this study has not beenconducted in isolation like many research projects. A Policy Advisory Comt:Jlittee comprising stakeholders from the public and private sectors has worked with the research team from the start. Theirinput and that of a larger body of stake-holders to be consulted through subsequent workshops will becritical in shaping the final recommendations of the study.
Specifically however, the study aims at exploring the nature and characteristics of the existingmineral market in Tanzania since it has been singled out as the main cause of poor performance ofthe mining sector. Back in the 1960s after the Arusha Declaration of 1967, the state nationalized mostmining. Private sector participation in minerals marketing was minimized and a parastatal monopolyfor mining and minerals marketing was created.
That monopoly was ended in 1987, but since then, the macroeconomic policy framework has beencited as a source of mineral marketing problems. Miners and dealers say that the fiscal regime,interest rate and exchange rate policies, unstable investment policies have hampered new investment.The artisanalnature of the mining activities has also been responsible for poor performance of themining sector in the country. Some artisanal claims and marketing operations are legal, but othersshade into parallel markets. Production and trade of minerals has been shrouded in secrecy, makingdetailed assessment of both performance and prospects exceedingly difficult. Miners do not readilyreveal the quantity they produce, and similarly mineral dealers are not prepared to give the actualfigures on what they export.
Since the end of the monopoly, some steps have been taken to create a legal private marketingsystem. For gem and diamond dealers, a partially viable legal framework is in place, but small-scalegold miners currently have no legal buyers for their ore. From 1990 to 1995, the Bank ofTanzania
3
and the state-owned National Commercial Bank operated a gold-buying scheme, but withdrewfrompurchasing gold after incurring substantial trading losses. There had been minor trading lossesthroughout, as bank personnel were not experienced in gold assaying and relied on assay results fromtheir buyers in London for final pricing. In the end a large shipment adulterated gold was bought,bankrupting the system and convincing the government to withdraw from state operated schemes.
Private gold dealers were allowed to register after this, but the conditions of registration haveincreasingly become less attractive. Those who registered the first year did not renew the secondyear. A new group registered, but they, too, did not renew the second year. Now (as ofJanuary 1997),there have been no legal gold exports for six months, although exports continue through parallelmarkets. Commercial banks, joint venture mining companies and licensed dealers are all interested increating buying programmes, but current fiscal practice makes it temporarily unfeasible. TheMinistry ofEnergy and Minerals is aware ofthe problem, and is seeking to establish a regulatoryframework that will provide for reliable buyers to be able to operate in Tanzania.
A substantial portion of the minerals produced in Tanzania is thus smuggled, mainly through Kenya,but also through Mozambique, Burundi, Rwanda, Uganda and other neighbouring countries. Theresult is that Tanzania's tax revenues from precious minerals are declining even as the miningactivity grows. There is also concern, noted by Export Strategy Task Force, that the foreign exchangethat is earned stays outside the formal banking system. The Task Force identified this as a majorissue to be studied. .
The Ministry ofEnergy, Minerals and Water has, with World Bank funding, funded a baseline studyto survey small-scale miners and their activities in all major mining areas in the country. The study,conducted by Tan Discovery, was presented and discussed at a workshop in Dodoma involvingrepresentatives of the Ministry, the Tanzania Chamber of Mines, as well as gem and gold dealers andminers.
The present study was c~>nceived and designed based on that workshop, where a consensus wasreached on what areas needed further research. The preliminary report provided little quantitativedata. In particular, there was no clear picture of gold and gem marketing systems. For the minerspresent at the workshop (as for dealers and government),·marketing was a top priority.
The government wanted a better understanding ofcurrent market operations in this sector. It isconcerned that the s~uggling currently going on in the mineral sector adversely affects. the overallcountry's economy especially with regard to the trade balance and the government budgetperformance. There was a large and visible channel through Kenya, but unofficial exports fromTanzania directly to Thailand and other Asian and Middle Eastern markets were also thought to besubstantial.
To create a competitive marketing system, Tanzania has to know how markets operate inneighbouring countries in comparison to the workings of its own markets. Tanzania has attempted tolevy royalties and export taxes on gold and gems, without realizing that neighbouring Kenya profitedfrom this by offering dealers tax free exports. Mozambique has recently entered the picture with verylow taxation on exported gems. Our hypothesis is that Tanzania has to compete for the trade, as itwill naturally seek the most advantageous market. With such easily concealed merchandise and vastopen borders, it is not cost-effective to suppress smuggling by force of law.
4
1.4 Methodology
1.4.1 The consultative process
An integral part of the study approach has been to work in consultation with a Policy AdvisoryCommittee comprising relevant policy makers from both the public and private sectors. The researchteam was mobilized at ESRF in August 1996 and a policy-makers' Advisory Committee wasimmediately constituted to guide the study. It comprises individuals who work in the Ministry ofEnergy and Minerals, the Tanzania Revenue Authority; the Tanzania Chamber of Mines; theTanzania Mineral Dealers' Association (TAMIDA) and the Federation of Miners Associations ofTanzania (FEMATA), all ofwhom serve in their individual, not official, capacities on the PolicyAdvisory Committee. It met in August 1996 to inaugurate the study and advise on the first field worktrip, which took place in the northern zone in August and September 1996. It met again in January1997 before the second field work trip, to the Lake Zone gold producing area, and met a third time inconnection with the EAGER workshop held in Dar es Salaam in August 1997.
1.4.2 Field interviews and data collection
The team used rapid rural appraisal methods to interview participants at every level of the marketingchain. The country was divided into four interior zones that include the main gold, diamond andcolored gem producing areas. Dar es-Salaam and Zanzibar constitute a fifth zone, important for theirrole in marketing, not for mining itself. The first two zones were canvassed in August and November1996. The remaining zones we hope to cover in a second phase of the research.
Key informant interviews were held with mining and other local officials throughout the zonescovered, and at the national level. We interviewed and collected data from officials in the Ministry ofEnergy and Minerals, the World Bank Minerals Sector Project, and the Tanzania Revenue Authority.We spoke with five representatives of international mining companies interested in Tanzania. At thelocal level we interviewed leaders of the mining community, mining associations, minerals zonalofficers, police, migration officers, and leaders of national professional associations involved inmining and marketing. Semi-structured interviews were conducted with miners and traders at alllevels of the chain, extensively in Tanzania and more lightly in Kenya. This proved the most usefulform of information collection, as participants nearly always refused to answer formal questionnaireson their marketing practices. The team agreed upon a set of topics to be covered with each type ofactor in the chain, and held semi-structured individual and small-group interviews, following aspecific set of topics, b~t without a formal questionnaire. In most cases the team took notes duringthe interviews. Whenever the team believed that this made the interviewees less forthcoming, notetaking was deferred. During evening feedback sessions the team compared notes and highlighted thekey ideas coming from each interviewee. Focus groups were held when possible, for example withthe mine claim-holders of Tanga Region and with the brokers ofArusha Region.This allowed us toestimate the proportions of commodities following different routes and to understand the logic of theparticipants. The price data provided was used to analyse relative benefits to Tanzania and Kenyafrom the trade.
• The sample interviewed
The sampling pattern involved both geographic and socio professional stratification. In the two initialfield trips, the team interviewed over 300 people in two ofthe five zones into which we divided the
.5

country, including 20 master dealers, 123 mine owners, 50 brokers and 64 officials and miningcommunity leaders. Wholesale dealers, goldsmiths and jewelers in Dares Salaam were alsointerviewed, as were, for comparative purposes, dealers and officials in Kenya and Ghana.
In Tanga Region, all leaders of the Regional Miners Association (REMA) were interviewed. In theUmba River area, in addition to brokers of various types, six mining village leaders wereinterviewed. In Arusha, the major gem marketing town, we covered all types of participants in themineral market. We interviewed the top six dealers, who together dominate the market, and otherlicensed dealers for a total of 18 of the 62 master dealers in Arusha. Leaders ofTanzania MineralDealers Association were interviewed, the chairman and other members. In addition, all leaders ofRegional Mines Association in Arusha were interviewed, and 40 out ofthe 3,000 brokers active inArusha. Out of several operators in the area, fifteen medium scale traders and operators in othereconomic activities than mining were interviewed. The zonal mines officer ofArusha, ArushaRegional Police commander and officers ofTanzania Revenue Authority. Officers ofthe formerTanzania Gemstones Industries (TGI) in Moshi were interviewed. In Dodoma several claim holdersand mine workers in gold mines at Nzunguni were interviewed, as were several mineral claimholders, brokers, master dealers operators in mineral marketing. In Shinyanga we interviewed twomajor diamond dealers, and a regional mines officer.
Generally, the topics covered included m'arketingproblems, followed by a history ofthe participants'role in the market. This included:
~ the prices they paid and received at each point for each type and quality of goods;~ their estimate of how many goods were going to which markets from their operating base;~ the estimate of their price margins from one point to another, ofmonthly income or income
from each buying trip, and their operating costs;~ how the person got started in the mining sector, how much initial capital they had and from
where, how they built their capital, what risks and losses they had experienced, andwhether/where they had invested any gains;
~ their proposals for improving minerals marketing;~ relationships with relevant government departments.
The team also interviewed persons involved in auxiliary activities, such as retail shops, restaurants,bars, hotels, transport and other services, to determine the variety ofactivities that existed and insome case to study the monthly net incomes. It was not possible to conduct a proper quantitativesurvey, nor to create account balance sheets.·We therefore present this information in case-studyformat and do not attempt to quantify its global economic impact.
Since mining activities are spread throughout the interior zones ofthe country, a problem ofgeographic coverage presented itself from the start. Time and funding were important limitations.Time considerations included the fact that the government is considering a new Mining Law in 1997,the first major revision since 1979, and the input from this study would be most useful the faster itwas available. Another factor was the one-year time limit and modest funding cap on USAIDEAGER/Trade research grants, which obliged the team to produce a report based on the first twozones rather than completing the field work before drafting a report. The Policy Advisory Committeerecommended that the study team begin with the most important mining areas, but try to cover all ofthe major producing and marketing sites. The country was divided into five zones, to be covered insuccessive fieldwork trips:
6
(I) the northern zone, including the getri-bearingand trading areas ofTanga, UmbaRiver, Korogwe, Kilimanjaro, Moshi, Merelani and Arusha;
(ii) the lake zone, including the gold, diamond and gem mining areas of Mwanza,Tarime, Singida and Shinyanga;
(iii) the central zone, including Morogoro, Songea, Mpanda, Kigoma and Chunya;
(iv) the southern zone, including Tunduru and the surrounding Ruvumu River gem rusharea, plus the market towns of Mbeya and Mtwara; and
(v) Dar es-Salaam and Zanzibar Island.
Only the first two zones could be covered with the funds available for the first phase ofthe project.A second phase EAGERffrade grant will be proposed to enable the fieldwork to extend to theremaining three zones, to allow the economic analysis to explore fiscal and foreign-exchangeimplications of the trade and to fund workshops on the results.
Three sets of economic analyses were conducted during the study, as described in Chapter 4 anddetailed in Annex 3. The first analyses the impact of the mineral trade on the actual macro-economicsituation ofTanzania, including the impact of the liberalization of minerals trading on employment,income distribution and economic growth (GDP). It also examines the effects of smuggling on GDPand foreign exchange. Two main macro economic calculations are undertaken. First is the impact ofundeclared mineral exports on under valuation ofthe GDP, and on the undervaluation ofthe portionof GDP generated by mining. As precious minerals are almost entirely exported, the balance of tradeindicated in the official statistics is also substantially understated, as most of these exports areundeclared. It is known in mineral trade circles that these exports generate foreign exchange used tofinance imports. This helps to explain how Tanzania has managed to record an increasingly largenegative trade balance for many years, without a corresponding devaluation of its currency (whichfloats freely). Consumption of imports is clearly higher than official exports could finance.
The second calculates the value-added from trade at each step in the marketing chain. This allowedus to estimate the distribution of economic benefits from northern Tanzanian mining between Kenyaand Tanzania. Our results showed that an estimated 95% ofgold and 60% of gems are smuggled outthrough Kenya. Most policy-makers in Tanzania tend to assume that an equivalent.portion ofeconomic benefit is lost to the Tanzanian economy. This turns out not to be true. When the reservevalue of minerals and the value-added from mining and the portion of the trade that takes place inTanzania are cumulated, the great majority of the economic benefit rebounds to the Tanzanianeconomy.
Finally, to analyse the competitiveness of Tanzania's business climate, a microeconomic model wasbuilt of the costs of doing business as a gem dealer. It shows how the tax structure and relative costsof capital favour the growth of business in Kenya rather than in Tanzania.
1.4.3. Review of available literature
A review ofthe literature conducted in the course ofthe study found that Tanzania's artisanal andsmall-scale mining sector is relatively well documented, but there is a dearth of comparative studies
7
on artisanal mining elsewhere in the world. Even in Brazil, Thailand and Ghana where such mining isthriving, there are only minor references in mining journals.
The US Bureau of Mines published two studies that allow Tanzania's new minerals industry to be putin perspective: Mineral Industries ofAfrica: 1993 International Review and World Gold: A MineralsAvailability Appraisal. (1994) The World Resources database maintained by World ResourcesInstitute is also a reference.
Previous literature on artisanal mining in Tanzania includes a series ofworldwide studies andworkshops fmanced by the World Bank, as well as surveys designed to attract mineral investment toTanzania. Background geological mapping and information is the third type of literature, mentionedabove in the introduction. In addition to the Harris·and Hester geological surveys, work by Kimambo(1984) gives a brief description of Tanzania mineral potential and various mining developmentactivities from the late 1950s to the mid 1970s. Another study reviewing mining operations andsocio-economic aspects from the late 1930s to early 1990s was done by Chachage (1994). Itexamined the mining industry and accumulation in Tanzania, and a critique ofthe relationshipbetween artisanal miners and formal mining companies.
There has been new interest in the mineral sector with the introduction of major changes in thesocioeconomic policies of the country in the mid eighties. Several studies have reviewed thecountry's mineral resources and made recommendations to improve the sector's performance. Astudy was commissioned by the Ministry of Energy and Minerals in 1994 as preparatory work for theMineral Sector Development Project funded by the World Bank.(Engineering Associates and TanDiscovery, 1994). The study examined at length the problems facing mineral sector development inTanzania. It signalled small-scale mining, training, environmental issues as areas needing furtherstudy.
Another group of studies aimed to attract and guide large scale mining investors. Examples of theseare: "Opportunities for Mineral Resource Development" (Hester, 1991 and 1996), and "The MineralSector in Tanzania" (Vethouse, 1996). These studies both provide summaries of the rich mineralresource base ofTanzania as well as the licensing procedures, the existing fiscal regime and otherinvestment incentives. Hester's work provides,details of specific mineral potential areas andgovernment efforts to support mining investors. The Vethouse Associates study, funded by USAID,provides an independent assessment ofthose efforts and makes recommendations to improve theexisting legal and regulatory framework.
From the mid-1980s to the present time, the activities of artisanal and small-scale miners haveincreased considerably from few thousand miners to a community of more than 550,000 people.This development was followed by a number of studies addressing various sub-sectoral issues. In1994, UNDP financed studies of "Small-Scale Mining in Tanzania," the first part involved aTechnical Assessment (Hollaway 1994) and the other part concentrated on the InstitutionalFramework (Lwakatare, 1994). There was another UNDP study, "Export Development andPromotion of Mineral Resources" (Twum & Kanza, 1992) which reviewed existing data on thecountry mineral resources and made some practical recommendations on the problems facing themineral markets.
8
Comparative information has come largely through'WorldB~k efforts, as academic and technicalmining literature is remarkably silent on artisanal mining. In April, 1994, the World Bank organizeda Round Tab.1~ in Washington on Artisanal and Small Scale Mining with the aim of formulating aglobal "Comprehensive Strategy Towards Artisanal Mining."(World Bank, 1995,1996) Severalpapers where presented including a study on "Artisanal Mining in Tanzania" (Tan Discovery 1994)which mainly covered the organizational and socio-economic aspects. The round table deliberationsalso included the "Harare Guidelines for the Development of Small-Scale Mining," (UNDP 1992)and the past experiences in addressing the issues of the sub-sector. Roundtable speakers noted thatseveral million people worldwide earn a living from artisanal mining. They produce an estimated 20percent of the gold, 40 percent of the diamonds and nearly all of the gemstones mined in Africa. Thephenomenon is also widespread in Latin America, although Brazil's famous small miners aregradually being squeezed out by international mining companies. They produce 50 percent ofBrazilian gold today, against 70 percent some years ago.
In connection with the launch of its World Bank-funded mining sector reform, recently Tanzania'sMinistry of Energy and Minerals commissioned a detailed study of the small-scale sub-sector inTanzania. "The Baseline Survey and Development Strategy for artisanal and small scale miningprogramme" (Tan Discovery 1996) provides basic data and strategies on institutional, organizational,mining and processing, marketing, environmental and socio-economic aspects. The study did notcover some important issues on mineral markets which could help to influence policy changes inlegal and fiscal regimes to improve mineral markets.
None of these studies directly addressed marketing operations and related policy issues. This is thereason for the focus of the current study.
9
2.1 Background of Mineral Marketing in Tanzania
Mineral marketing processes and structures can be traced back to the colonial era. In the 1930s, agold rush in the Lupa area stimulated minerals exploration in many areas. Small reef miners withsome capital and equipment obtained from other economic sectors emerged and joined in theproduction and marketing ofgold.
Africans pressured the colonial government to grant them licenses because they were victims of lowwages and poor conditions. They had experience working in mines which at that time were under thesettlers and other European miners. A product sharing scheme allowed retired European civilservants, known as "verandah prospectors," to exploit artisanal mines in the late 1930s, contributingto the development of loose mineral marketing. The official market dominated mineral tradingalthough there were some reported cases of smuggling. By the end of the colonial period mineralproducts were contributing over 10% to the total export earnings.
After independence, the government continued to issue prospecting licenses on individual bases, butencouraged small operators to form mining cooperatives. Some of these cooperatives, such as LupaGold Diggers Association, which was formed in 1963, played a key role in both the mining andmarketing of gold from small scale miners. Later on, however, many mining properties were takenover by Greek nationals who also dominated the sisal industry.
Mineral trading was regulated by a 1965 mineral trading ordinance and a gold ordinance.Commercial banks supported mineral trading through the provision of credit facilities and mineralcustody service. Smuggling was minimal and most of the exports were handled by the few wellestablished companies. The main ones were Umba Ventures for Mining and Export of ColouredStones and Williamson Diamond Mines.
After the Arusha Declaration in 1967, most of the mining companies were nationalized. Thegovernment formed Tanzania Gemstone Industries Company (TGI) in 1972, with a monopoly inmining purchasing, producing and exporting coloured gemstones. In 1973, the government formedthe State Mining Corporation (STAMICO) which had the responsibility of overseeing thedevelopment of the mining sector, including new exploration and the operation of nationalizedmines.
STAMICO also became the parent company of TGI. From 1970 to the mid-1980s, the mineralexport performance was most unsatisfactory, as there was a drastic fall in gold exports and a gradualdecline in diamond exports. The exportation of gold, for example, dropped from 500 kg in 1969 to 20kg in 1971.
The comprehensive economic reforms introduced as part of economic recovery programmes ofthemid-1980s led to liberalization of the minerals markets through the issuing of mineral dealerslicenses to private operators in 1987. Soon after, mineral exports started to increase. The Bank ofTanzania established a gold buying system through the National Commercial Bank in 1990. Officialexports of gold accelerated to a peak ofUS$40,380,000 in 1992, from to US$I,152,057 in 1989. The
11

buying system was bankrupted by a scam in 1994 however, and subsequently discontinued. Since .1995, there has been inadequate provision for the legal purchase of gold in the country, and mostproduction has been marketed through the informal channels in Kenya.
By 1994 the currency was allowed to float freely and importers were allowed to use their ownsources of foreign exchange. Minerals markets began to flourish in Tanzania, and the influx ofcapital spurred new exploration. Plots in the Merelani Tanzanite mines were allocated to smallminers in two phases in 1995 and 1996, creating a surge in production there. Simultaneously. in thefar south, the Ruvuma River valley, which forms the border with Mozambique, was found to beextraordinarily rich in coloured and precious gemstones of many varieties. This set off a mine rushthat has brought over 250,000 people into that isolated enclave, and created a regular/traffic ofchartered flights, ocean freighter service and overland trips.
2.2 Structure and Characteristics of the Market
2.2.1 Economic Geography of Mineral Markets
The surveys found four levels in most of the minerals markets, namely the mining area, the primarymarket, the secondary market and the export market. Each of these has its own features. Buyers atone level of the market are sellers at the next level. Price margins between one level and the next canbe substantial, particularly when the volume of goods handled is low. The four levels are almostidentical for coloured stones and gold but the diamond market skips the primary market and in mostcases its secondary market is the export market. The more valuable the goods sold, the more likelysellers are to try to skip one or more links in the normal marketing chain and keep the mark upthemselves.
2.2.2 The Marketing Chain
• Market level one: The mining area
The first sale of raw gems or gold ore often takes place immediately at the mining sites. At thismarket stage, mine workers and small brokers are the main participants. The organization of artisanalmining favours this arrangement. Tanzanian mine workers refuse to work on salary, preferring theprevailing system of production sharing between worker and the mine claim holder and/or pit owner.Mine workers can market their official shares openly in nearby mining towns, but they'often secretvaluable finds and market these stolen goods to mine brokers directly at the mine.
• Market level two: The primary market
In mining villages a short distance from the mines one finds primary markets where·production entersquasi legal channels. Sales are legal, but, for reasons explained further on, most of the brokers at thislevel are not licensed. The degree of market activity in mining villages depends mainly on thequantity and quality of the recovered minerals. The main participants in this marketlevel are brokers'and small brokers. The latter frequently shuttle between the mining sites and the primary market.
On local market days mine workers are also active, selling small parcels of good quality stones.Master dealers and large scale brokers from major towns and even outside the country frequentlyvisit mining villages. The government banned foreigners from mining areas in 1996, but the
12

exclusion is difficult to enforce. Sometimes, participants in other economic activities living in themining villages and towns, such as retail shop keepers, barbers, owners of guest houses, bars, andothers also sometimes participate in this market stage. The market size varies considerablydepending on the type of mineral production and the level of international demand. When productionis high and dealers have received international orders, market volume swells quickly. In typicalmining villages there can be 3 to 5 long-distance brokers and several small mine brokers. In areaswhere production is small and uncertain, there are few visible signs of the trade. This was notedduring the survey at Mabuki diamond mining village, where currently brokers do not staypermanently in the village as they used to do. Trade is still taking place, but only through occasionalvisits by brokers. On the other hand, in thriving mining towns such as Merelani there were anestimated 3000 small brokers and 50 long-distance brokers.
• ~arketlevelthree: regionalmmarkettolVDs
Regional market towns are where most mineral dealers have established permanent offices. The mainmarket for both gems and gold throughout the region is Nairobi, but several Tanzanian towns aretrying to compete and other regional towns also have a role. The centre for the Tanzanian gem tradeis Arusha, although Mtwara in the south and Dar es Salaam also serve as regional gem markets.Mwanza, and Tarime are major gold markets, and Shinyanga dominates the diamond trade. Dar esSalaam also handles some ofthe gold trade, although most of it continues to Zanzibar for export.
In such markets, the existing infrastructure and facilities allow for easy export and access to foreignbuyers. These market towns need to have good road access, airports and telecommunications, whichare essential for dealers to communicate with their international buyers. The major participants inthese markets are master dealers, brokers, organized small-scale miners. Some illegal mineral tradersthat one could qualify as full time smugglers are based here. Legitimate dealers and brokers, thosewho usually try to abide by the law, also export through Kenya on some occasions, as it is sometimesthe only way to do business. There is some specialization in the coloured gem market, particulardealers who buy mainly one type of stone. Most dealers, however, put out buy orders whenever theyhave an international buyer for a particular type of stone.
Arusha market is the major gem centre in the country handling high quality goods suitable forfaceting. Products traded include Tanzanite from nearby Merelani, tourmaline from Tanga andArusha, green garnet from Arusha and Kilimanjaro and rhodolite from Tanga, Morogoro and Arusha.
Dar es Salaam is also a secondary market of minerals in the country. This market handles the largestvariety ofproducts, minerals of various types and qualities from different mining areas of thecountry. Some of the major mineral types traded in the market are:• ruby and sapphire from Morogoro, Tanga and the southern regions;• alexandrite and chrysobel of all sizes and grades from Mtwara, Ruvuma, and Lindi;• red gamet, rhodolites, tourmaline, amethyst, emerald and aquamarine;• gold and diamonds, mainly from the central and southern zones.
Tanga was once the major gemstone centre, particularly in the early 1970s. Now the market is lessactive. It has two master dealers, neither ofwhich is very active, and a number of informal brokers.Tanga now serves as a transit point for materials from other parts of the country that are smuggledinto Kenya. Most of the minerals traded in Tanga originate from Umba valley mining area which is
13

situated in the same region. The important minerals traded in this market are sapphire, ruby and alltypes ofgarnet and tourmaline. During the survey, it was also observed that most ofthe me?iumgrade ruby from Morogoro is either marketed here or smuggled via Tanga to Kenya. SapphIre boughtin Tanga is later marketed in Dar es Salaam before it is exported, while tourmaline and garnet aremarketed through Arusha for export. The interviews conducted during the survey revealed that somegold from Singida and Dodoma is marketed in Tanga.
Mwanza is the major secondary market for minerals from the central and lake zone mining areas.Gold is the main commodity traded there. It is collected from the Regions of Singida, Shinyanga,Dodoma, Tabora, Mwanzaand Kagera. Participants estimated that 9S% of the gold is traded on theparallel market in Mwanza and later smuggled to neighbouring countries. It is sold in Nairobi,Mombasa, Nakuru, and Isibani, all Kenyan towns. Another route for gold from Mwanza is throughDar es Salaam and then Zanzibar. Soine diamonds from Mwabuki are sold in the Mwanza market andforeign diamond buyers occasionally visit the market.
Shinyanga town is famous in East Africa for t~e informal trading ofgem diamonds. Most ofthediamonds traded in this market are obtained from Maganzo mining village, including stolen materialsfrom the Mwadui diamond mine, Nyanghwale in Kahama and Mabuki in Kwimba. With theexception ofofficials sales from Mwadui Williamson Diamond Mine, most ofthe goods are fromartisanal miners and are marketed through informal channels. Field work interviews indicated thatforeign buyers obtain diamonds straight from local traders in and around Shinyanga town. Goodsfrom Shinyanga are then transported through Dar es Salaam or Mwanza and smuggled out.
Nairobi has been the main regional market for gems and gold since Tanzania attempted to nationalizemining in the 1960s. Its markets grew rapidly as mining activity increased in all countries in theregion in the 1980s an~ 1990s. Foreign buyers like it because air access is easy, dealers stock alltypes of products in good quantities, comfortable accommodations are available at reasonable prices,and their business can be done in relative security. Local sellers cited similar factors for taking theirproduce there. Prices are sometimes, but not always better. Even when they are not better, there is theadvantage that dealers will buy quickly all types and qualities of goods, so a broker can be in and outin a single day. Northern Tanzanian mining areas are geographically closer to Nairobi than to Dar esSalaam, and the road networks are considerably better. Security is reportedly a little better than inTanzania, although it is clearly better for Kenyan brokers than for Tanzanians.
Nairobi alone was estimated by one of its dealers to have about 300 active dealers. A significantnumber of them are well organized, well capitalized and have family ties in the business that spangenerations and continents. This gives them an advantage in market knowledge and contacts,something that many Tanzanian dealers lack. Some S4 major gem dealers are listed in the Nairobitelephone directory, together with eight minerals dealers. Many have multiple lines, reflecting thefact that international gem dealing requires intensive telecommunications. The Kenyan mineraldealers association had some 8S members before it became inactive a few years back. Some of themajor dealers interviewed in this study were not listed in the telephone directory, nor did theyparticipate in the dealers' association, which rends more credible the verbal estimate of300 activedealers.
In addition to a portion ofTanzania's precious minerals, Nairobi markets handle. some artisanaldiamonds and gold from Eastern Zaire, sapphires from Rwanda and smaller quantities ofgems andgold from throughout the Rift Valley area. This area, extending from Tanzania to southern Ethiopia
14

increasingly constitutes a regional market. Dealers throughout the region compete to buy theproduction, which flows wherever the trade is well organized and relatively secure. Kenya has somegem and gold mining of its own, but its main advantage has come through creating a free market forregional production. Imports are welcomed and pass untaxed, although not always without .harassment from officials. Export formalities in Nairobi are well organized, and, for establisheddealers, done on secure premises. Some Tanzanian production also goes through Mombasa, Kenya'smain coastal port.
• Market level four: Export markets
The export market is the final stage ofthe four market levels and normally it depends on the locationof transactions as well as the destinations ofthe purchased minerals. The export market can appearin several forms. The market can appear when a foreign buyer is purchasing from a dealer or duringgemstone show. Destinations of most of the mineral products has been to the processing centres,mainly in Asia, or directly to the major end users in USA, Japan and Europe.
Tanzania is presently a major new actor in international coloured gem markets, and a very small actorin world diamond and gold markets. Tanzania's garnets, sapphires, rubies, emeralds, tourmalinesmostly go to Thailand, Sri Lanka or mainland China for heat treatment and cutting. There, rubiesfrom Burma and Thailand, sapphires from Sri Lanka, Thailand and Australia, and emerald fromBrazil, Colombia, Zambia, Madagascar are co-mingled. While it is technically possible to determinethe mine origin of such stones, in practice they may be listed as being of Thai-origin in USA,Japanese, Singaporean, Hong Kong, or European jewelry markets. Lower quality market cutting atthe mass production level is increasingly being transferred from Thailand to mainland China, wherelabour costs are lower. Cutting operations also exist in India, mainly for emeralds and diamonds; inBelgium and Israel for diamonds; and on a smaller scale, in all developed countries.
Japan and Europe are the leading retail markets for top quality precious stones, including diamonds,Alexandrites and best grade Tanzanites. The US, however, is the largest market overall as massproduction and mass marketing technologies have been combined to create fine jewelry that lieswithin the reach of middle and lower-income households.
2.3 Profiles of the Participants in the Minerals Markets
The main participants in the market are mine workers, miners, brokers, informal mineral traders andmaster dealers. While the patterns described above represent typical market operations, participantsat any of the levels can and do come together and trade. Small brokers can playa role at any level. Inaddition to buying directly at the mines, there is a variety of small broker in most markets whoaccompanies the seller, helps him value his goods, and find a buyer. The roles and viewpoints of eachtype of participant in the market are described below.
2.3.1. Mine Workers
• Classification and profile
Mine workers are mainly young men from rural areas, although there are also older men, men fromurban areas and some women engaged in the actual digging. Some operate seasonally, returning totheir farms to sow and harvest their crops. Others work with targets, having in mind to get a certain
15

amount of income for a dowry or to go into business. Increasingly, however, mining is a year-roundactivity and one with an attractive career path. Successful mine workers become brokers, then dealersor mine claim holders. The may go into business in a mining related trade or service, while keeping ahand in mining. Pit and shaft mining is dirty, dangerous work. Most of the workers encountered insuch sites were men 18 to 30 years old. In alluvial mining, however, where the work is lessdangerous, one finds some women and older men participating in mining activities.
The reservation wage of these mine workers is difficult to calculate, as one would have to calculate ashadow wage based on the opportunity cost of their time and the shared costs of food a lodgingprovided by mine owners and/or more successful coworkers during the unproductive times.According to workers' testimony, however, the mine worker's position is a coveted one that a youngman must work his way into. He will work at manual labour jobs in the mining community longenough to build the savings and friendships necessary to join a mine workers' group.
We therefore took the daily wage ofa manual labourer in a mining area as a shadow reservationwage. This was found to average 2000 to 3000 TSH per day.
Mining operations ignore the existing legal framework in matters pertaining to issues like earningsand working conditions, as is the case for artisanal mining throughout the world. The rate ofaccidents at work is alarming. In Merelani informants claimed that an average ofone mine workerdies every week because of unsafe working conditions. Pit owners cannot properly superviseoperations in shaft mines because it is not safe for them to go down themselves. The pit ownersinterviewed at Merelani for example admitted that they cannot control the number ofworkers whooperate in their pits. They indicated that initially, before a pit starts to supply minerals, about 50workers ~an be operating but as soon as it starts producing, the number ofworkers in one pit caneven reach 150.
• The role of mine workers in the gemstone and gold market
Mine workers are among the main participants in the mineral market and are very active at the firststage ofthe market, as sellers at the mine sites or nearby villages. They are the primary source ofillegally traded minerals. They have an interest in getting the materials that they steal, above andbeyond their agreed shares, out of the area as quickly and quietly as possible. Mine workers were alsofound illegally mining claims which owners have left unattended for a long time. This was mainlyobserved in the Umba Valley, a sapphire mining area; Maganzo, a diamond mining area; and Sekenkeand Matinje, gold mining areas.
Sometimes mine workers are forced to sell their legitimate product to the nearest broker because theyare in need of immediate cash, for buying items like soaps, food and others. Most of the brokers arenot licensed. Many are Kenyans and could not get a license. Others, Tanzanian citizens, find thelicensing procedures too cumbersome and of little practical use. At Merelani, for example,researchers witnessed hundreds of brokers, many clearly from neighbouring Kenya, are activelybuying minerals from mine workers and taking them overland to Nairobi.
16
• Market power and size
While gold markets in Tanzania are fairly stable, gem markets are quite volatile. The value of roughgems varies so widely that few participants in the market can have a clear idea of the internationalprice a piece would bring. For all but the top gem quality material, demand for particular types ofgems within Tanzania depends on periodic orders that the major dealers receive from theirinternational buyers. Thus domestic demand is sporadic and only loosely related to internationaldemand. Therefore, while the workings of supply and demand for commodities are understood in .gold markets, participants think of gem markets in terms ofvariations in their personal bargainingpower. Bargaining is involved in all sales, and is sometimes quite lengthy process. The market sizeand power of mine workers is influenced by both the type and quality of the recovered minerals, theflow of information, and the number of buyers and sellers in the mining area. In areas where there isa free flow of market information and where buyers are many, mine workers possess market powerand also have a wide market for their products. In the Umba river mining area, for example, it wasobserved that buyers in the mining area are generally few and for certain types of minerals themarket is very thin. Hence some of the miners, through middlemen or themselves, are forced to crossthe border and look for markets outside the country. Mine workers in Umba valley mining area thinkof themselves as operating in a buyers' market with little market power.
This however, was not found to be the case in the Merelani mining area. There are thousands of bothlegal and illegal buyers at Merelani mining area. Even international buyers have ready access to thismining area and go there to buy stones. Unlike the Umba valley mining area, at Merelani there areseveral infonnal marketing centres within the mining area where both small and large brokers makedirect contact with the mine workers. These are known as 'Vijiweni,' which in Kiswahili designates astreet comer meeting place. The market volume is substantial here, driven by a surge in supply.Prices are declining rapidly, which confuses many in the mining business. For most stones a surge insupply would be a bonanza, as international demand and therefore prices are little influenced by localproduction in Tanzania. For Tanzanite, however, this is the only source and the surge in productioncaused international prices to collapse. Therefore, despite the presence of many buyers, workers inMerelani are not experiencing what they would call a sellers' market. In contrast, the sudden goldproduction in Nyangotho village in Tarime has shifted the broker's market power to the mineworkers, giving them a sense of market power.
• Mine workers' preparation for the market
Given the volatility of gem markets, participants try to adopt strategies to ensure better operation inthe market. At every level participants seek knowledge about how to value stones, and a financialcushion sufficient to let them offer their stones to several buyers. This usually requires either time ortravel. Mine workers lack market knowledge and equipment required to check the quality, weight andother chara~teristics and to assess the value of the stone. Moreover, they are usually short of cashand sometimes in debt. To a large extent, they depend on the service of the middlemen-provided byother participants in the market as elaborated in other parts of this section.
Ignorance of value assessment techniques is not a problem confined to mine workers. Theysometimes try to gain an advantage by playing on the ignorance of buyers. Neophyte buyers may begiven less time to observe the stone and duped by quality and value claims. During the survey, it wasnoted that the majority of inexperienced diamond buyers in Maganzo and Mabuki have been the
17

victims of such practice. The other strategy is to clean or oil their stones using various methods so asto improve the appearance of quality.
• Mine workers' concerns
The mine workers are not satisfied by current market arrangements. They feel that markets arelocated too far away. The fact that they cannot travel forces them to trade in the mining area marketwhich offers them less profit. Some ofthe mine workers interviewed suggested that secondarymarkets must have networks near the mining areas, either by sending their agents or opening offices,so as to reduce the number of stages and corresponding middlemen through which mineral materialspass. These mine workers however recognize the role played by the brokers and small brokers,especially in the buyers' market like Umba Valley and Mabuki.
2.3.2 Claim holders
• Classification and profIle
Claim holders are the other group of sellers at the first level of the marketing chain. Most claimholders are mature men with some capital and some standing in the community. A few earned theircapital and gained experience through mining, but many come from other sectors. A few arewomen or young men. How actively involved they are in the operation of their mines variesgreatly. Some claim holders are actively involved in the mining and marketing of their mineralswhile others sublet their titles to pit owners and financiers, who oversee the mining and marketingof the minerals produced and give commission to claim owners. It has been observed that instead ofpaying salaries to their workers, claim holders share what is produced with their workers at the endof production in such a way that they retain between 30% and 40% of the official production.
Claim holders would like to formalize their operations. Many said that the first thing they would doif they could afford it is put the workers on a salaried basis and increase security. A few claimholders with substantial working capital have been able to establish larger operations that use somemodern equipment and mining methods. In international mining parlance these would be classifiedas small-scale mining, while the hand operated mining that is more widespread is classed asartisanal.
The general pattern of mines visited on the field trips involved the use of simple tools, andsometimes primitive techniques of mining. With shovels, picks and explosives miners dig in alldirections, following hunches, indicative related mineral occurrences and actual veins. Often theresulting pits and shafts are unsafe. Multiple pits throughout an area scar the natural landscape andmercury used to refme gold compounds the environmental damage. This has especially beenobserved at Merelani and at the Maganzo and Mabuki diamond mining areas, and Misigiri andNzuguni gold mining areas.
Only a few medium-sized formal mines are operating in Tanzania. All are under foreignmanagement, although some are joint ventures with Tanzanian partners. Samax is mining graphitein Merelani, and presumably the Tanzanite that lies embedded in it, although its gem production is
18

not known. Williamson Diamond Mine has returned to production as an Anglo Am.ericansubsidiary. A few joint ventures in coloured gems also exist.
• The role of claim holders in the marketing of mineral products
Claim holders play an important role in the mineral market. They are the main sellers to masterdealers. Some miners are also master dealers so they export their products directly without passingthrough brokers. These are the major suppliers to the official market. This, however, does not meanthat all that is possessed by the miners is sold in the official market. The marketing route issometimes determined by those who support their production. Claim holders who receive substantialfinancial assistance either from local master dealers or Kenyan or other foreign dealers are expectedto sell their products to those who contribute in one way or another during production. This is themain· reason that miners may sell outside the official market. When the claim holders receivefmancial assistance from smugglers or master dealers located outside the country, they are generallyobliged to sell to the unofficial market.
In terms of market information, it was observed that these participants at least possess relevantinformation on the market situation, unlike the mine workers. Market information is a valuable assetwhich is normally exchanged at cost. Some miners assist their workers by providing them withinformation or a market for their stones. How closely mine owners are able to supervise their minesaffects how much of the production they actually see and market. When they are lax and have notrustworthy supervisor in the mine itself, only a small amount of their real production remains forthe official market.
• Preparation for the market
Claim holders' access to market information and ability to market their produce effectively varieswidely. Miners need to cobble, clean and sort their stones by size, shape and quality. In the case ofgold, they purify the ore to accepted market standards. The small-scale gem claim holders generallysell to local dealers, so their information needs and preparation of stones for market are limited. Thefew who are themselves dealers have to meet much stricter standards of sorting for the exportmarket. Organized claim holders have facilities necessary for preparing their mineral products formarketing. Gold miners use mercury retorts, and gem miners gemological testing kits, and weighingtools.
• Claim holders' costs
The cost of claim holders can be divided into marketing and production costs. Marketing costs differamong the claim holders depending on how they handle their marketing. Claim holders who sellthrough brokers pay them a commission, normally 10 percent of the sale price. Those who do theirown marketing have the same costs as brokers, mainly transportation and the opportunity cost oftheir own time. Those who commute between mining areas and market towns in any case, oftenmaintain a home with telephone and/or office facilities in town for their mining or other businesses.They probably do better by doing their own marketing, but no one keeps adequate accounts todetermine this. It may be mainly a psychological effect, as the unpredictable nature of preciousminerals sales creates mistrust and a strong incentive to retain personal control.
19

Apart from the marketing costs, claim holders also face production costs. This again differs amongthe claim holders depending on the type of mining operation. Small-scale miners in alluvial areasincur less costs than pit and shaft mining operations. Their main costs are labor, transportation andtheir own accommodations in mining areas, often a guest house. Again accounting systems arevirtually unknown, so hard figures could be gleaned only through long, intensive survey research.The only figure commonly known is the amount of start-up capital one'needs to go into a particularline of work in mining. For alluvial mine claim holders, start-up capital was estimated at aboutTSH.5oo,OOO. Small scale claim holders with semi-mechanized operations mining undergroundneed substantially more. At Merelani, it was possible to get some estimates on the production costs.According to the interviews there it was noted that where the Tanzanite occurs fairly close to thesurface, one could start production with a minimum of TSHIO million. In areas such as the recentlyopened block B where production requires a shaft mining down to about 200 m, between TSH50100 million are required. These costs of production have implications in the marketing process.When such costs are high, they affect both the volume and price of the production. The aircompressors and excavation equipment required are imported from abroad. Claim holders complainthat no local dealer provides them, and no credit is available for their purchase. All infonnantsagreed that it would be better to have shops selling mining equipment locally.
• Claim holders' concerns
High operating costs for mining, lack ofa reliable market, and unpredictable prices are among thepriority concerns of claim holders. Others are a lack of financial support from formal sources and aninappropriate tax regime, which they regard as offering little incentives for them to expand theproduction and marketing oftheir minerals.
2.3.3 Brokers
• Classification and profile
Many types of brokers participate in the minerals markets. Those who buy in mining areasor villagesand sell in secondary market towns are considered dealers by the law. Sometimes they are using theirown capital, but often they are collection agents for master dealers based in town, buying with thedealer's capital or not paying the seller until the stone is sold. They are granted a different type oflicense from master dealers, who are authorized to export. It is customary, however, to refer to them asbrokers, and in fact the roles of one type of broker or dealer may vary from one transaction to another.
The other main type of small brokers are really commission agents, guiding sellers to buyers inexchange for a 10 percent commission from the seller. Sometimes they collect another 5-10% from thedealer, if they come by after the sale and the dealer agrees that it was a good deal. These brokers maytransport the goods for the seller, but they do not actually buy the stones as they have insufficientcapital. Such commission.agent brokers operate both in the mining areas and in the secondary markettowns. None are licensed, as this type of work is not recognized by the law. The fact that the practiceis so widespread, however, is evidence that their services are badly needed.
Licensing is very limited among dealers and brokers not involved in overseas exports, in part becausecurrent regulations were designed without taking into account·how they operate. In Arusha alone,
20

active brokers are estimated between 3,000 to 4,000, ofwhich only 100 are licensed. The Governmentso far has not put into place regulations to formalize the activities of gold brokers.
Brokers can also be classified on the basis of nationality, i.e., Tanzanian and non-Tanzanian brokers.It was found during the interviews that there are many foreigners who are active in the mineral market,mainly acting as brokers. Most of these are acting for dealers who are based in their country oforigin.Most of them are Kenyans. At Merelani, it is estimated thatover 500 Kenyan brokers are based there.They can pass themselves off as Tanzanians, as they come from ethnic groups living on both sides ofthe border, namely Masai, Luo, Kamba, Taiga, and Kurya. Sometimes are known personally to befrom Kenyan villages, others can be recognized by their accent. Since English is the national languagein Kenya and is used in the schools, whereas in Tanzania Kiswahili plays that role, Kenyans aresometimes informally recognized by the fact that their English is better.
It is also possible to categorize brokers in terms of the size of their working capital as large, medium,and small.
(i) Small-scale brokers
These are small traders operating within the mining areas and mostly serving the middleman's roleof linking various participants in the market. Sometimes they are hired by medium scale brokersfrom urban centres to act as informers or/and security personnel. Most of these have workingcapital ranging between TSH.I0,000 and TSH. 50,000. There were about 3,000 total villagebrokers at Merelani trading markets. About 500 of these were foreigners, passing as Tanzanians,mostly Masai and Luo. The other important centre at which these small scale brokers are found is intown especially in areas where master dealers are found. In Arusha for example such brokers gatherat the OTTU building, where many miners and dealers have offices.
There are fewer small brokers in gold compared to gemstones. In most of the gold mining areasvisited, the number of small brokers ranged between 10-35 depending on the intensity of miningproduction. They work mainly as collection agents, buying for dealers.
(ii) Medium and large-scale brokers
These are typically urban based traders although some are based in the mining areas~ Brokers withworking capital ranging between TSH.l,OOO,ooO and TSH.5,000,OOO can be classed as mediumsized, whereas the largest brokers have over TSH.5,OOO,OOO in working capital. During theinterviews in Arusha it was noted that there are about 30 to 40 medium scale brokers at Merelanimining area. Some are foreigners, mostly Kenyans. In Shinyanga, there are about seven mediumand three large scale diamond brokers while in Mwanza there are 15 large scale gold brokers.
Local brokers operate in mining areas and travel to cities (Arusha, Moshi, Tanga, Dar es Salaam,Nairobi and Mombasa) to sell their mineral collections. These medium scale brokers can control theproduction and supply of mineral product since some are also claim holders. They have access tothe finance capital needed in the production as well as in the trade business. While some operate inthe official and formal market, others concentrate on parallel market activities. These also are in aposition to influence export channels of the purchased minerals as they can sell their products toofficial dealers or to smugglers. The decision to sell to either official master dealers or to smugglers
21
is influenced by domestic net prices offered, fmancial credit facilities, the legal framework,government policy and behaviour. Legal local brokers have lower price offers compared to theircounterparts, the ille'gal foreign brokers.
• The role of brokers in the market
The role of brokers in the market is mainly influenced by the categorization already given above.There are brokers who are acting as agents dealers, so they take the materials directly to the buyerswho then give them money to purchase the stones or gold. In such a situation, the brokers typicallyprovide middleman,services. The other possible case is when brokers have been working forsmugglers, both local and foreign. It is believed that most foreign brokers have been playing this role.They visit the mining areas, buy precious minerals at a higher price than the prevailing market priceand go back to their countries with gemstones, diamonds and gold. Sellers are happy to get suchbrokers because in comparison to local brokers they offer better prices.
The other important role of the brokers is that they act as middlemen between the mine 'workers andbrokers above or deal directly with master dealers. This role of middlemen is very crucial given thenature ofthe market. Like some other imperfect markets, the mineral market under observation isfeatured by middlemen who facilitate the workings of the market by helping to match the buyers andsellers. When brokers act as middlemen, they play an important role in providing the relevantinformation to buyers and/or sellers to execute whatever sales contracts are involved and to helpguarantee that goods are of proper quality and that the buyer pays the seller promptly and fully.Normally, a seller or purchaser is expected to pay a commission to the middleman handling thetransaction. During the interviews in Tanga an Arusha, it was observed that sometimes the middlemanare paid 10% of the total sales, or the amount agreed upon through negotiations. The other possibilityis that transaction costs in such an arrangement are taken care of through the setting ofdifferent pricesat various market levels (the middleman pocket the difference). These transaction costs as well asprice differences to some extent affect the final price and demand.
• Brokers' costs
Interviews indicated that brokers required substantial operating capital. The actual availability ofcapital differed depending on the brokers' collection networks and the efficiency of their commissioncollections. Small-scale brokers usually require between TSH.I 0,000-TSH.SOO,OOO in operating funds.We found about 10 percent of the brokers interviewed operating at a middle level, with TSH.l,OOO,OOOto TSH.S,OOO,OOO in operating capital. A very few large scale brokers reach TSH.l 0,000,000 and abovein operating capital. These large scale brokers are mostly those acting as agents of master dealerslocated in either Arusha or Nairobi.
Brokers try to minimize their expenses in order to devote nearly all of their funds to purchases. Veryfew have personal vehicles. They generally travel by bus for long distances and bicycle taxi or foot inand around the mining areas. When they go to Nairobi, unless they are based in Nairobi or the dealerpays their hotel room they will try to conduct their business in a single day and return. Brokers considerit a big advantage that they can sell all of their goods inNairobi, be paid in cash and return to Tanzaniain a single day. Tanzanian dealers, being themselves undercapitalized, will often ask brokers to waitfor payment~anywhere from a few hours to several months. In Arusha, brokers tolerate this to a certainextent, because many have someone with whom they can stay. Many brokers will not trade in.Dar es
22
Salaam, however, because they encounter the same delays in both selling all of their material andgetting paid for it. It is too costly to stay there, and too costly to go back and forth.
Transportation costs are a major marketing expense at every level, although they vary according to themeans of transport chosen by the operator. Brokers who were interviewed in the Umba mining area forexample indicated that those who move to Kenya market were estimating the cost of hiring a bicyclewhich they normally use in the ''panya'' route, at between TSH.2,000- TSH.3,000. From Merelani, onthe other hand, brokers spend about TSH.! ,000 - TSH.! ,500 to take a bus from Merelani to Arushatown. When the brokers reach Arusha they incur additional transportation costs by hiring a taxi to getaround town. They explained this as a means to escape police harassment and extortion. They wouldwalk if they could do so safely. In Tarime, it was revealed that it costs TSH.! ,400 for a broker to crossthe border to the Kenya market. To the market at Isibani in Tanzania, the same trip from Mwanza costsabout TSH.20,000.
License fees are not an insurmountable cost in themselves, but the conditions imposed by the licensesmake it impossible to do business profitably. Brokers, for example, are required to pay a minimum ofTSH.! 0,000 per month as license fees. When they try to obtain the license, however, they are assessedarbitrarily estimated business taxes and obliged to meet other requirements, such as group inspectionsof their premises, that expose them to extortion. The licenses are good only in one region, whereas thework nearly always requires them to operate in more than one region. The license is valid only sixmonths, which means time consuming travel and delays have to be confronted regularly. It has to beobtained inDar es Salaam, far from the mining areas, where transport and accommodations areextraordinarily expensive.
• Preparation for the market
Valuation, cropping, cleaning and sorting are operations brokers perform in addition to their workbuying and selling. Brokers are ill equipped to take a scientific approach to valuation. Many have smallscales, but few have fibre lights that would let them detect inclusions and flaws in the gems. None of thebrokers, and only a few ofthe master dealers, have had formal gemological training. They try to judgeclarity and colour with the naked eye.· The Masai brokers have at Merelani have a unique cooperativesystem of brokering, and 5 to 20 members of the cooperative buying group will each examine the stonebefore the group comes up with an agreed upon quality and price.
Some gem brokers clean their stones using water or other solvent materials which they think willimprove the appearance of their products. They also sort the products by size and quality if they areable. Many Arusha dealers will buy only gem quality stones, so the second quality material has to go toNairobi. But often the broker will get a better overall price by combining the 1st and 2nd quality goods ina single package. He has to know his buyer's requirements. grading them quality wise.
Preparation of gold for market involves purification. Large scale gold brokers seek the assistance of agold smith in improving purity to above 95%. There are complaints however that dealers do come upwith different standards in terms ofweight and quality when they use their scientific equipment. Thebrokers interviewed feared that sometimes they got cheated by the dealers.
23

• Brokers' concerns
Brokers are faced with a number of problems which increase the transaction costs ofdoing business,and limit their ability to grow. Licensed brokers, for example, are not comfortable with the proceduresfor acquiring a license and the operating conditions imposed upon them. Brokers find it very difficultto make a license follow-up in Dar es Salaam while their operations are based far away. During theprocess they waste a lot ofmoney and time. They would thus like to have these licenses issued in theirareas ofoperation or at least at regional headquarters. The other concern of licensed brokers is thecondition that they should operate within a specified area. Mining production is highly variable, andthey need the flexibility to move from an area where production is declining or the market is saturatedto areas where production is good.
The other concern ofbrokers is security, and in particular government failure to protect their business.They see no value in having a business license, because unlicenced operators are not penalized byauthorities. In fact, by trying to get a license they increase their exposure to arbitrariness andharassment by officials, sometimes to theft or extortion by the authorities.
Brokers are also faced with the problem of lack ofcredit facilities. According to most ofthe brokersinterviewed,·the lack ofworking capital seriously limits their operations. Tanzanian brokers complainthat foreign brokers are well financed and they can offer higher prices to the sellers, and are hence in abetter position to buymore good quality materials. Gold and diamond brokers have complaints thatthey fail to formalize their activities due to an inappropriate tax system and cumbersome licensingprocedures.
2.3.4 Master Dealers
• Classification and profde
Master dealers can be categorized according to their mode of operation. Some operate individually,and among these, operating regulations distinguish between foreign nationals and Tanzanians. Othersoperate on a joint venture basis, usually involving local and foreign partners. Over 50% of thedealers are registered as joint ventures.
One can also classify dealers based on whether they participate in mineral production or not. Thereare some dealers who are also miners themselves so that they also participate in production. It is alsopossible to, classify the dealers according to whether they fmance mining activities or not. There aremaster dealers who actively finance miners so they have a direct link to certain production pits.
Lastly, master dealers can be categorized according to the size of their operations. There are six largemaster gem dealers who have been in business for a long time and are well known in both domesticand export markets. There are several dozen small-scale master dealers, who are sometimesnewcomers in the mineral business. Some are only occasionally active.
• The role of master dealers in the market
Master dealers have a key role in the mineral market because they are the major formal buyers in thelocal market and sellers in the foreign market. They buy from different levels of the domestic market,
24

usually from brokers or claim holders, but sometimes even from mine workers directly. Nearly all ofthe artisanal production that passes through the official channels is handled by these dealers. Anotherrole played by master dealers in the market, therefore, is that they are the main source of revenuecollected in this sector in the form of tax. Formal mines have negotiated tax exemptions, and goodsthat go directly to visiting international buyers or Kenyan dealers escape taxation.
As sellers, master dealers mainly sell to the export market, a market to which they gain access invarious ways. They may sell through foreign buyers who visit their offices, or during gem shows,both local and international, or by sending a parcel directly to the export market. Sometimes theypersonally travel to these external markets.
Through the exportation of minerals, dealers connect the domestic mineral market to the worldmarket. At this stage, dealers are faced with a different situation. Firstly, not all dealers can operatecomfortably in this market. Many dealers lack sufficient market information to operate effectively.They may be taken advantage of by foreign buyers. Others have more experience and contacts,.inspire more trust, have more business acumen, and invest in the necessary market information andskills development. These are generally doing well in the market, although everyone occasionallyreported setbacks such as thefts, failure to collect payments, trading at a loss and or being unable tofmd a buyer for certain goods.
• Master dealers' concerns
Master dealers complain that almost all of the tax burden in the sector falls on them. While the sectorseem to have a lot of people who are very active in various stages of production and marketing, themajority do not pay tax. The only option for the master dealers is to shift at least part of the burdenby reducing the prices they pay when buying. This in tum has an effect on the overall market. Itdiscourages those who sell to dealers and makes them look for better prices somewhere else,especially in the unofficial market. The master dealers interviewed in Arusha were complaining aboutthis heavy burden of tax they carry on behalf of the other participants in the sector. They all see thisburden as very detrimental to the mineral market, because those who smuggle get higher benefitscompared to those who pass the official channels. The other problem is that neighboring countrieshave either lower tax rates or no tax, which creates a competitive disadvantage for those tradinglegally in Tanzania. Lack of financial services and cumbersome export procedures are also among theconcerns of master dealers.
• Master dealers'· costs
Master dealers incur substantial operating costs, unlike brokers. These are simulated in the economicanalysis below. The main ones are the costs of maintaining vehicles, a staff, an office, and travelingand telephoning regularly overseas.
• Market power and market size for the master dealers
Price determination as far as these master dealers are concerned depends on whether a dealer isbuying or selling. In the first case as a buyer, a dealer will be in a domestic market buying frombrokers and miners. At this level, master dealers in Arusha, for example, possess power in themarket vis-a-vis brokers. Their main advantages are market information, for they have a large stock
25

of information on both local and foreign markets, in contrast to other participants in the market. Theyhave more ability to judge the quality of stones. Sellers often have to trust their judgment. Anotherfactor is that they are better capitalized, and so have more staying power. The type and quality of theminerals traded also affects the power that a master dealer has in both local and foreign marketsespecially in the case of diamonds or other unique and high quality minerals. Gold dealers, on theother hand, are disadvantaged in the sense that their ability to influence the market price isinsignificant. Hence, they see themselves as having less market power.
Master dealers selling gems in international markets are weak compared to their situation as buyers inthe domestic market. The stock of knowledge that these master dealers have on the export marketdiffers substantially. A few are very knowledgeable and well connected, but most have very limitedinformation on the export market. To a large extent, the export market for various types of mineralsis a buyers' market and local master dealers have less influence in determining prices. This is trueeven for Tanzanite, over which Tanzania could theoretically have a monopsony market. This canpartly be explained by the fact that there are many other sources of supply to these export marketsdue to smuggling.
2.4 Factors influencing prices ofgold and gemstones
As the world's coloured gem markets are fairly open, prices fluctuate with variations in supply anddemand. The same is less true of gold and precious gems (diamond and Alexandrites), where cartelshave sought with some success to maintain a market share large enough to stabilize prices. Colouredgem prices fluctuate more immediately with changes in supply and demand. For certain colouredgems, one can see the effect of surges in supply at each level, with a major new strike havingrepercussions at the mine level and other successive higher levels. Similarly on the demand side, risingor declining world prices and the demand for certain goods, mainly Tanzanites, are reflected down themarket chain. When demand is high the dealers receive orders from their buyers, pass them on to theirorders to brokers, and on down to the mine level. When orders are off, mining may even stop, only toresume when a new order comes in for that type of stone. This reflects the lack of capital for miningoperations. It also shows that artisanal mining is far more flexible than formal capital'-intensive mining,where production and marketing need to be continuous to amortize the equipment.
In a mining area when a rich lode of gems is struck, prices rise in the beginning when the first fewbrokers to arrive create competition. If supply continues strong, prices decline rapidly as the marketresponds to the glut. Continuing strong surges in supply have affected gem prices in regional markettowns and even on international markets. Two major surges in gem supply took place in the last fiveyears. Both first led to price rises, then to price declines. The first surge came with the discovery in1992, of rich and diverse alluvial gem deposits in the Ruvumu River basin around Tunduru in southernTanzania. The mine rush that followed attracted international attention and drew dealers from all overthe world. The response was perhaps particularly rapid because this came at a time when world gemmarket, news was just beginning to be broadcast over the Internet, as well as through traditional dealers'telephone and fax network. Soon dealers were taking charter planes and making regular weekly flightsinto what had previously been quite an isolated area.
In the first volatile years, local miners did not know the difference in value between alexandrite, whichis quite rare in the world market, and the more common gamet, ruby, sapphire and other semi-preciousstones they were finding. A single good alexandrite bought for a few thousand Tanzanian shillings
26
could fetch US$50,OOO in Asian markets. Until the Tundtiru discoveries, Sri Lanka had been the majorworld source ofalexandrite. Sri Lankan dealers, some ofwhom had been stocking alexandrite tomaintain its high value, were concerned to see this new supply flooding Thai and Japanese markets.They estimate that current prices for alexandrite are 40% below those in effect before the Tundurudiscoveries. Meanwhile, miners and brokers in Tunduru learnt to recognize alexandrite and raised theirprices. Margins between buying and selling prices are therefore narrower now throughout themarketing chain. Sapphire prices also have declined in the world markets, but Tanzanian productionhas been only one of several new sapphire areas to come into production.
A similar surge in Tanzanite production has contributed to a depression in that market, both locally andin the world market. Tanzanite is produced in only one known area in the world, a few square milesnear the mining town of Merelani (also spelt Mirerani). The parastatal Tanzania Gemstone Industries,based in Moshi, had mined it until the early 1990s. Then the mining area was divided into four largeblocks, A, B, C and D. Block D was allocated, in plots 200 x 200 meters, to small-scale miners in 1993.It quickly began attracting world attention for its high quality stones, leading initially to a strongdemand and rising world prices.
This led to pressure from thousands of miners who had not received plots in the first distribution. BlockB was then allocated in October 1995 in much smaller plots, 50 meters by 50 meters. The productionsurge from Block B in 1996 occurred at a time when all trading was suspended in Tanzania in order toreorganize and issue new regulations, from January through March 1996. The entire productiontherefore went to Nairobi. There a glut quickly developed and dealers panicked after a short while,fearing that oversupply would cause the top quality stones that they had previously stocked to losevalue. They began off-loading stock in Thailand and the US. This led to a worldwide market crash in1996. Prices declined to half or less their previous year's value in some cases. Top quality colour A 1gram stones are now selling for US$130-150/gram in the USA. Margins are minimal in Tanzania,Nairobi, Bangkok, the US and Idar Oberstein in Germany. The world markets seem to remaindepressed for. Tanzanite, but there are occasional signs that growing demand is picking up the slack.The Tucson Gem Show in the first week of February each year is the world-recognized indicator ofmarket trends.
• Demand
New supplies of rubies, sapphires, emeralds, tourmalines and garnets from Tanzania have emerged at atime when the demand for low-cost, semi-precious stones for the mass market in North America wasexpanding rapidly. TV and mail marketing has extended the "real gemstone" market to within the reachofmiddle-class household budgets, and demand is growing steadily. In Asia, mass production ofcalibrated cut stones reduced the final costs ofjewelry, as did mass production of gold and silvercastings. These international market trends favour the continued profitability of marketing Tanzaniangemstones, even though there is strong competition from different types of gemstones coming fromBurma, Brazil, Thailand, Madagascar and other emerging gem mining areas.
The move to mass production, on the other hand, reduces the margins on both cut stones and jewelry,making it harder for smaller producers such as Tanzania to enter the cutting and jewelry productionmarkets.
The world retail market for semi-precious gems has been growing steadily in volume. Price margins,however, have gotten narrower, so the increase in value is less marked. Fashion trends also cause
27

different coloured stones to be in demand from year to year. In 1995, for example, preference for thetraditionally popular gemstones such as rubies, sapphires and emeralds declined in favour of citruscoloured garnet, peridot and other semi-precious stones. Seeing that prices for rubies were declining,while supply was increasing, the International Coloured Gem Association mounted a publicitycampaign to promote rubies in 1996. It met with some success in increasing demand, and it will beinteresting to see whether demand continues to grow in the aftermath.
Market knowledge and current information greatly influence the ability ofparticipants in the market toprofit or lose from their operations. Access to information varies greatly, depending on which level ofthe market a participant works. The stock of information available in the market has been alsoinfluenced by the mechanism through which information flows and'the cost of acquiring relevantinformation. In the mineral market, participants who take initiatives to invest in information have beenfound to have greater advantage in terms ofmarketpower and even in determining the price.
Many master dealers who were visited, for example, were found to spend significant amounts ofmoneyin telecommunication services such as telex, faxes, telephones, publications and other informationservices. Traveling abroad and attending shows is another way ofacquiring information and againsome participants are readyto incur costs for or attending such shows making visits. During the fieldwork the team observed that participants who lack access to telephone communications are weak actorsin the market. They cannot acquire information directly and either have to depend on other participants'decisions or act on their own and risk losing in the market.
The quality of the material produced strongly affects the price, as shown in Table 1 above. Top qualitystones command prices many times the value of the same stone of lesser quality. Low quality materialssell poorly, or, often in Tanzania not at all. At present, forces ofdemand and supply lead to radicalswings in gem values.
28...

Artisanal mining creates new communities. Some are transient camps that last only as long as thelocal· lode. Others mature into towns, some of which have better infrastructure than the originalcommunities onto which they are grafted. On existing local farming communities, the first economiceffect of such a new settlement is usually increased demand for food and other goods and services.Local farmers benefit briefly, but often the population grows more rapidly than the local food supply.The result is localized inflation in the prices of food and other basic services. The aged and othernon-producing families in nearby communities suffer particularly from this inflation, as it exacerbatestheir poverty.
The communities visited during the fieldwork, however, had all matured into relatively wellfunctioning towns. Many secondary economic activities were taking place in them. They include thefollowing:
~ businesses such as groceries, butchers, beverages, retail and wholesale shops, andstreet food vending;
~ suppliers of mining equipment, fuel and transport service;
~ services such as restaurants, bars, guest houses, barbering and beauty salons,laundries, and
~ dispensaries, nursery schools and other social services.
The owners of these services are mainly members of the mining community. The capital required toestablish these activities in mining areas was found to have been obtained from mining activities. Theowners interviewed indicated that they had built up some capital while mining or trading minerals,and invested in a business to have a more stable income. In the Umba mining area, for example,people said that when production in mining is high, retail shops at Kalalani are closed because shopkeepers all leave for Kenya to market their stones.
Women participate in most of these activities and sometimes are assisted by their children. Menparticipate when they are down on their luck in the mines, and they are trying to raise some funds totide them over until they can resume mining or trading. In Matinje gold mining areas near Dodoma,some mine workers farm during the peak agricultural season, either on their own farms or aslabourers on neighboring farms. This was also found to be the case at Mabuki (in Mwanza) andMaganzo diamond areas (in Shinyanga).
Lack infrastructure was mentioned by participants in various economic activities in mining areas asthe major problem facing them. Roads, for example are in terrible conditions of disrepair and duringrain seasons are sometimes impassable, which makes such economic activities extremely difficult toundertake in these mining areas,' Electricity is not available except for the rare owners of dieselgenerators. Telephones are unknown in most mining areas, so dealers travel with expensiveradiophones. Even Arusha, the main gem-trading and tourist center, is very poorly served. There is a
29
long waiting list for telephones, and those who have telephones fmd access to Dar es Salaam orelsewhere in Tanzania quite difficult. International access is better, but extraordinarily costly.
Mining areas also lack police stations and other security services. This is considered to be a majordrawback in developing businesses in the mining areas. In Merelani for example traders said that itis risky to do business as there is not a single police post in town. Thug attacks pose a threat.
Health and education services are also inadequate in the mining areas. It is important for thegovernment to improve such infrastructure and services, or let private companies do so, as this is thekey to healthy and sustainable artisanal mining sector development.
3.1 The Impact of Various Economic Activities in Mining Areas
As mining communities grow they create a demand for goods and services. New businesses arefounded, and the availability of goods and services in tum encourages more people to settle in thetown. Master dealers, for example, appeared to have offices only where the infrastructure was fairlygood. They tend to be in towns, not directly in mining areas, although the largest mining towns arean exception. In Merelani, a mining settlement of about 30,000 people with a full range of goods andsome services, one dealer and several large brokers have established offices there, even thoughArusha is less than an hour away. Most dealers consider it safer and more practical to do businessfrom Arusha, where housing, telecommunications and other services are better. In the Kenya-bordertowns of Tarime and Nyamongo several brokers have permanent offices at the general market placewhere other commodities are sold.
The mining communities and their farming neighbors suffer from the effects of mining-inducedinflation. Prices of many items sold in the mining areas are higher than in other areas of the country.The price of a bottle of Coca Cola can be TSH.l,ooo, which is 500% higher than the normal price ofTSH.200. The result of this is that service providers make money, but those who live in or nearmining areas without benefitting from mining are driven into poverty.
In some mining areas the land is not suitable for agriculture. Areas like Kalalani, Daluni in Tanga,for example, are dry and cannot support significant agricultural activities, so people in these areashave to buy most foodstuffs. These areas are particularly affected by mining-related impoverishmentand food shortages.
Another striking feature of economic activities found in the mining areas is that they are not coveredby the tax system. Both mining itself and the secondary economic activities in mining communitiesconstitute a potential tax base that is currently untouched. Dealers consider this unfair, as they are theonly link in the mine to market chain affected by taxation. Studies of best practices in taxation,however, require analysis of the relative costs and benefits of administering taxation at the grass rootslevel and usually recommend that national taxes be collected at a single point in the chain. Localtaxation and services seemed much more appropriate in the communities visited. Tanzania iscurrently embarking on a comprehensive tax reform that will afford an opportunity to study thisquestion further. It is beyond the scope of this study.
Some illustrative income data was collected during the field work to create a more complete pictureof the economic context in which mining markets function. The Keynesian multiplier will be tested
30

and the national household budget survey will be analyzed in a subsequent phase of this study to seewhether it is detailed enough to justify further analysis.
Initial inquiries of merchants' initial capital requirements and income levels were made during therapid appraisals in the North and Central areas, notably in the two large mining towns of Merelaniand Matinje. Interviews with tailors, bar owners, retailers, wholes'alers, carpenters, shoe shiners,charcoal sellers, second hand clothes dealers, nursery school teachers, hotels and food vendorsshowed initial capital requirements ranging from 10,000 TSH (US$16.70) for a shoe shiner to200,000 TSH (US$333) for a retailer, 400,000 TSH (US$667) for a tailor shop and 1,000,000 TSH(US$I,667) for a wholesaler or 1,125,000 TSH (US$I,875) for a bar.
Reported incomes or net profit per month ranged substantially. In the 25,000-70,000 TSH (US$ 42177) range were carpenters, shoe shiners, food vendors, some retailers, second-hand clothes sellers,bicycl~ taxis, bicycle repairers, and some tailors. In the upper range, 80,000-300,000 TSH (US$ 133500) were guest house owners, nursery school owners, tailors, retailers, wholesalers, charcoalsellers, bar owners, grocers, clothes sellers and commercial farmers. The commercial farmer wasgrowing 36 ha. of maize, meeting a need of the rapidly growing community and profiting frominflated local prices caused by the influx of non-farming population.
31

4.1. Economic Analysis
Readers interested in the results of the analysis, and having limited enthusiasm for econometrics mayskip directly to section 4.2 Results.
4.1.1 Methods Used
To estimate the importance of the trade in the Tanzanian economy, we looked at all three ways ofcalculating gross domestic product (GDP). GOP can be calculated as follows:
1. as the value of fmal goods and services produced in the economy during a given time period,or
2. as the sum of value-added in the economy during a given period (where value-added by aparticular firm is equal to the value of revenue from sales minus the cost of intermediategoods), or
3. as the sum of all incomes in the economy during a given period (usually wage income, profitsand direct and indirect taxes).
In theory, all three methods should give the same answer. The price paid for. fmal goods is income toothers in the economy and so whether we look at the revenue side of the equation or the income side,we should get the same answer. The value-added approach to calculating GDP is simply a moredetailed way of accounting for the final price of the good at each stage of production. It is particularlyuseful in countries where all businesses must keep detailed accounts and disclose them annually. InTanzania, as in most developing countries, none of these national statistical calculations is evenmoderately accurate, because the necessary records are not kept at the household and firm levels. It isnot surprising, therefore, that the estimates of the importance of precious minerals done here by allthree methods yield quite different results.
To estimate the importance of the trade in the Tanzanian economy, we looked at all three ways ofcalculating gross domestic product (GDP). GDP can be calculated as (I) the value of final goods andservices produced in the economy during a given time period, or as (ii) the sum of value-added in the~conomy during a given period (where value-added by a particular firm is equal to the value of revenuefrom sales minus the cost of intermediate goods) or as (iii) the sum ofall incomes in the economyduring a given period (usually wage income, profits and direct and indirect taxes). In theory, all threemethods should give the same answer. The price paid for final goods is income to somebody in theeconomy and so whether we look at the revenue side of the equation or the income side, we should getthe same answer. Finally, the value-added approach to calculating GOP is simply a more detailed wayof accounting for the firial price of the good at each stage of production.
In practice, the three approaches may give very different answers. This is particularly true when someof the activity in an economy takes place in the informal sector. Consider the chain of productionpresented in Table 1 based on activity in the gold mining sector. Outlined below is an example of thethree ways of calculating GOP and our argument for why we think we should base estimates of the
33

contribution ofthe mining sector to GDP on the value-added approach. To make things simple we willrestrict the example to one particular transaction involving gold produced for export but the result is ageneral one. Initially, we assume that all transactions take place in the formal market. Then, we relaxthis assumption and suppose that certain portions ofthe' individual transactions take place in theinformal sector. The chain of production is as follows:
Calculation ofGDP - All Sectors Formal
Final Goods Approach
Gold Exports 1,000
Total GDP 1,000
Value-Added Approach(Millions ofTanzanian Shillings)VA Dealer 300VA Broker 100VA Mine-Broker 100VA Mine Worker 500
1,000
Income Approach
Labor IncomeProfit/LossProprietor's IncomeRental IncomeIndirect Taxes
620241
555
791,000
As expected, all three methodologies yield the same result, total GDP is equal to 1,000. Now, relax theassumption that all transaction take place in the formal sector and assume the following; 5% of finalgoods are exported through official channels, 5% ofgoods are sold to brokers through officialchannels, 95% of goods are sold to official brokers and 100% of mine-brokers and miners transactionstake place in the formal market.
Finally, realizing that only formal transactions will show up in the national accounts, we estimate GDPaccording to the three methodologies using only formal transactions.
Calculation of GDP - Accounting for Formal and Informal Sectors
Final Goods Approach
Gold Exports 50
Total GDP 50
Value-Added Approach Income Approach(Millions of Tanzanian Shillings)VA Dealer 15 Labor IncomeVA Broker 5 Profit/LossVA Mine-Broker 95 Proprietor's IncomeVA Mine Worker 475 Rental Income
Indirect Taxes590
526.0048.0511.750.253.95
590
Since only 5% of the gold in this example is exported through formal channels, the final goodsapproach method to calculating GDP wildly underestimates the contribution of the gold mining sectortoGDP. Since we know that a large portion of final sales from mining activities take place in theinformal sector, it will be important in our economic analysis to take this into account. Further, as wedemonstrate here, since both the value-added approach and the income approach provide more detailabout the composition of GDP they force us to think more carefully about each aspect of the goldmining activity and not just the final sale.
This example highlights a couple of important issues. First, the method of calculating GDP may lead toserious underestimates of the mining sector's contribution to GDPat present. For example, to the extentthat the contribution of the mining sector to Tanzania's GDP is calculated based on official exports (Le.,
34
using the final goods approach) its actual contribution at present is seriously underestimated.·Thiscould falsely lead to the belief that the mining sector is underdeveloped and a policy that wronglyencourages excess investment in the sector. Alternatively, if the income approach (or factor costapproach) is used to estimate GOP and ifmine workers are counted as part of the rural populationwhose reservation wage is estimated at 400 TSH per day then GOP is also seriously underestimated asis the contribution of the mining sector to GOP. For example, this study found that an estimated550,000 persons are involved either full or part-time in mining in 1995 and that these individuals have areservation wage of2,500 shillings a day. This implies that their daily contribution to GOP isunderestimated by 1.2 billion shillings or 1.4 million usn per day. Based on a conservative estimate ofdays worked per year of 100 this amounts to 5% of GOP.
Second, to the extent that activities in the mining sector are undeclared (or take place in the informalsector) the contribution ofthe mining sector to Tanzania's exports is also undervalued. This fact aloneis trivial since exports are a part ofGOP. However, in light of Tanzania's large trade deficit and theemphasis placed by policy-makers on reducing this deficit, the fact becomes important. The fact thatexports are being sold through unofficial channels does not mean that Tanzanian dealers are notearning foreign exchange for their exports. The movement of goods to Kenya constitutes an export, andearns foreign exchange, even though indirectly. This in fact may help to explain how Tanzania hasmanaged to record such large negative trade balances for many years without a correspondingdevaluation of its currency (which now floats freely). Consumption of imports are clearly greater thanofficial exports can finance. Traders interviewed during the study indicated that the proceeds ofminerals smuggling were used mainly to finance imports.
These are important issues because in order to determine the best policy vis a vis the mining sector, it isimportant to have a fairly clear idea of the way in which it is benefitting the economy. For example,suppose the government wants to raise tax revenue from the mining sector of the economy. Based onthe figures in Table 2, a 1% tax on the value of final exports (remember the government can only taxthose exports that go through the formal market) would yield .5 million shillings in tax revenues. Avalue-added tax of 1% would yield 5.9 million shillings in total revenues. Or, viewed in another way, avalue-added tax of only .08 percent would yield exactly the same tax revenue as a 1% tax on goldexports.
Because the way in which GOP is calculated is so important for accurate policy analysis, we,will,where possible, use all three methods of calculating GOP, the final goods approach, the value addedapproach and income approach to estimate the mining sector's actual and potential contribution to GOP.Since the type of data we have been able to collect for this project so far lends itself most readily to anaccurate estimation of GOP based on the value-added approach, our primary/initial method ofestimating GOP is based on the value-added approach. However, in attempting to estimate spilioverbenefits from mining activities, we will use the income approach.
Estimates of the contribution of the mining sector to GOP are based on the following formulas:
Tanzanian Miner: (1) VATanzania, mined = Pm *QTanzania, mined
Tanzanian Mine-Broker: (2) VATanzania, mine-broker
35
= (Pmb -Pm) *QTanzania, mine-broker
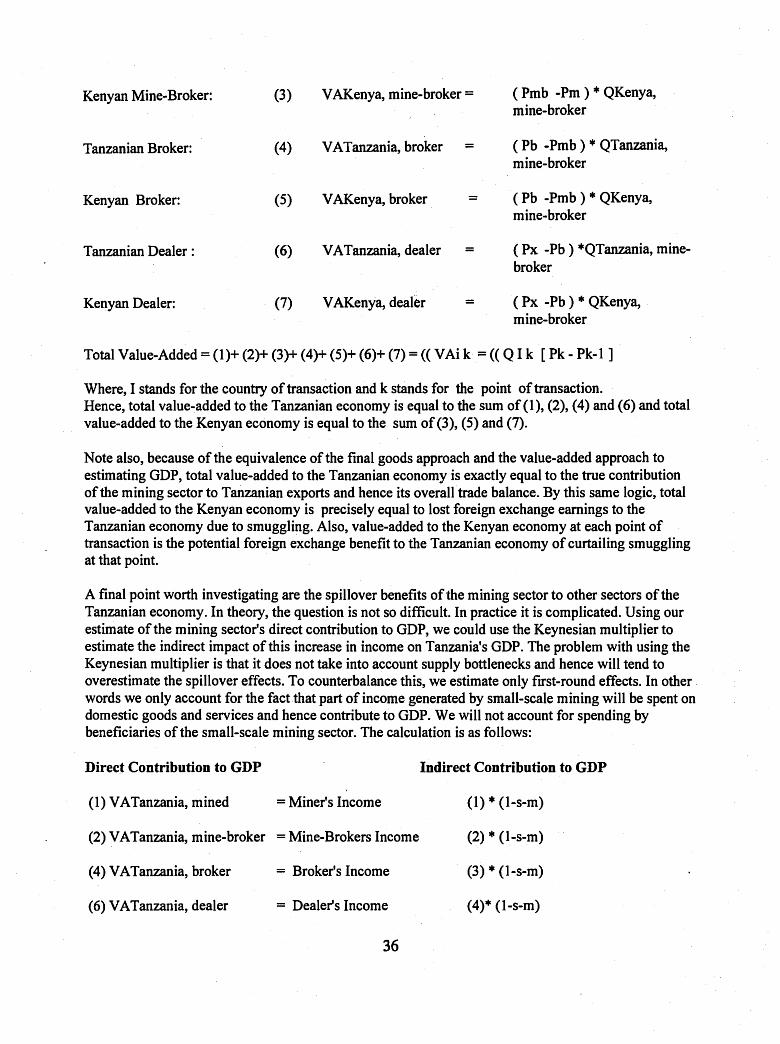
Kenyan Mine-Broker: (3) VAKenya, mine-broker = (Pmb -Pm) * QKenya,mine-broker
Tanzanian Broker: (4) VATanzania, broker = (Pb -Pmb) * QTanzania,mine-broker
Kenyan Broker: (5) VAJ(enya, broker = (Pb -Pmb) * QKenya,mine-broker
Tanzanian Dealer: (6) VATanzania, dealer = (Px -Pb) *QTanzania, mine-broker
Kenyan Dealer: (7) VAJ(enya, dealer = (Px -Pb) * QKenya,mine-broker
Total Value-Added =(1)+ (2)+ (3)+ (4)+ (5)+ (6)+ (7) =«VAi k =«Q I k [Pk - Pk-I ]
Where, I stands for the country of transaction and k stands for the point of transaction.Hence, total value-added to the Tanzanian economy is equal to the sum of(1), (2), (4) and (6) and totalvalue-added to the Kenyan economy is equal to the sum of (3), (5) and (7).
Note also, because of the equivalence of the final goods approach and the value-added approach toestimating GDP, total value-added to the Tanzanian economy is exactly equal to the true contributionofthe mining sector to Tanzanian exports and hence its overall·trade balance. By this same logic, totalvalue-added to the Kenyan economy is precisely equal to lost foreign exchange earnings to theTanzanian economy due to smuggling. Also, value-added to the Kenyan economy at each point oftransaction is the potential foreign exchange benefit to the Tanzanian economy of curtailing smugglingat that point.
A final point worth investigating are the spillover benefits of the mining sector to other sectors oftheTanzanian economy. In theory, the question is not so difficult. In practice it is complicated. Using ourestimate of the mining sector's direct contribution to GDP, we could use the Keynesian multiplier toestimate the indirect impact of this increase in income on Tanzania's GDP. The problem with using theKeynesian multiplier is that it does not take into account supply bottlenecks and hence will tend tooverestimate the spillover effects. To counterbalance this, we estimate only first-round effects. In otherwords we only account for the fact that part of income generated by small-scale mining will be spent ondomestic goods and services and hence contribute to GDP. We will not account for spending bybeneficiaries of the small-scale mining sector. The calculation is as follows:
(2) VATanzania, mine-broker = Mine-Brokers Income
Direct Contribution to GDP
(I) VATanzania, mined
(4) VATanzania, broker
(6) VATanzania, dealer
= Miner's Income
= Broker's Income
= Dealer's Income
36
Indirect Contribution to GDP
(1) * (l-s-m)
(2) * (I-s-m)
(3) * (l-s-m)
(4)* (l-s-m)
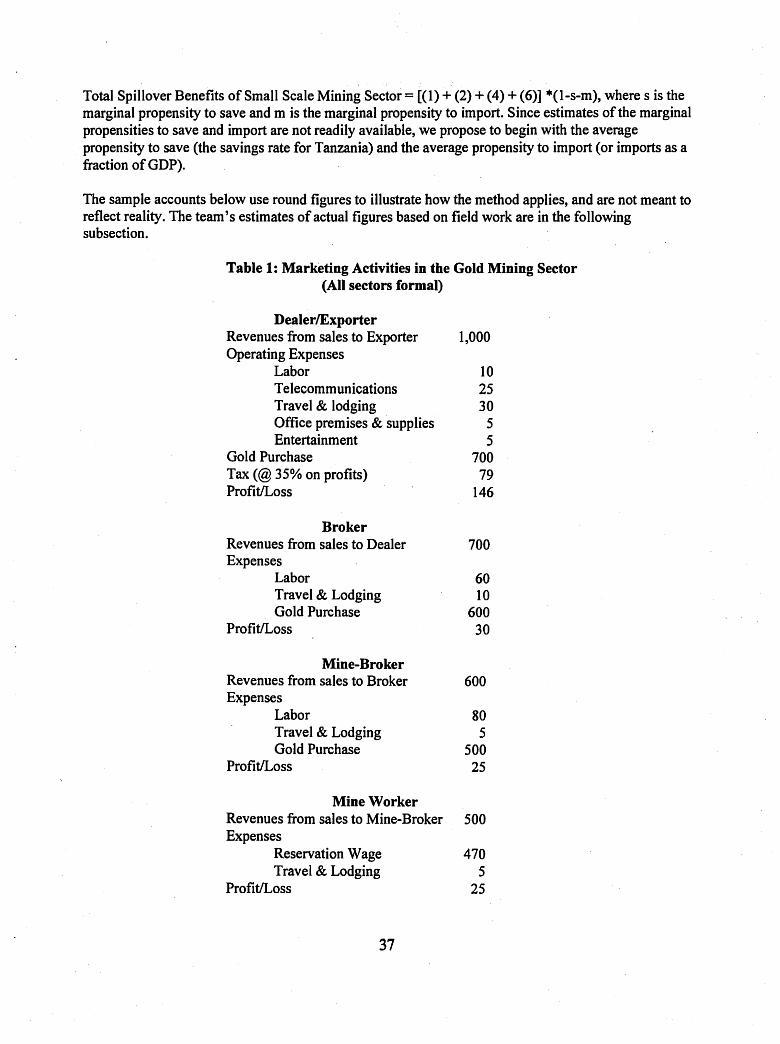
Total Spillover Benefits of Small Scale Mining Sector = [(1) + (2) + (4) + (6)] *(I-s-m), where s is themarginal propensity to save and m is the marginal propensity to import. Since estimates of the marginalpropensities to save and import are not readily available, we propose to begin with the averagepropensity to save (the savings rate for Tanzania) and the average propensity to import (or imports as afraction ofGDP).
The sample accounts below use round figures to illustrate how the method applies, and are not meant toreflect reality. The team's estimates ofactual figures based on field work are in the followingsubsection.
Table 1: Marketing Activities in the Gold Mining Sector(All sectors formal)
DealerlExporterRevenues from sales to Exporter 1,000Operating Expenses
Labor 10Telecommunications 25Travel & lodging 30Office premises & supplies 5Entertainment 5
Gold Purchase 700Tax (@ 35% on profits) 79ProfitILoss 146
BrokerRevenues from sales to Dealer 700Expenses
Labor 60Travel & Lodging 10Gold Purchase 600
ProfitILoss 30
Mine-BrokerRevenues from sales to Broker 600Expenses
Labor 80Travel & Lodging 5Gold Purchase 500
ProfitILoss 25
Mine WorkerRevenues from sales to Mine-Broker 500Expenses
Reservation Wage 470Travel & Lodging 5
ProfitILoss 25
37
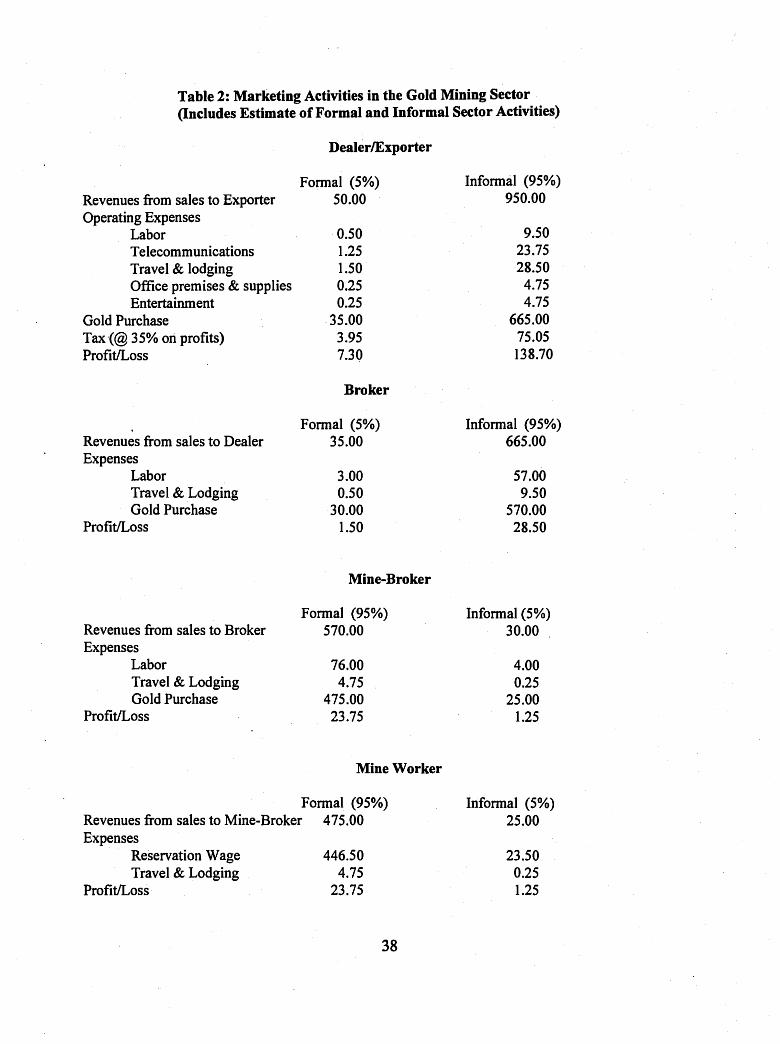
Table 2: Marketing Activities in the Gold Mining Sector(Includes Estimate of Formal and Informal Sector Activities)
DealerlExporter
Revenues from sales to ExporterOperating Expenses
LaborTelecommunicationsTravel & lodgingOffice premises & suppliesEntertainment
Gold PurchaseTax (@ 35% on profits)ProfitILoss
Revenues from sales to DealerExpenses
LaborTravel & LodgingGold Purchase
ProfitILoss
Revenues from sales to BrokerExpenses
LaborTravel & LodgingGold Purchase
ProfitILoss
Formal (5%)50.00
0.501.251.500.250.25
35.003.957.30
Broker
Formal (5%)35.00
3.000.50
30.001.50
Mine-Broker
Formal (95%)570.00
76.004.75
475.0023.75
Mine Worker
Informal (95%)950.00
9.5023.7528.50
4.754.75
665.0075.05138.70
Informal (950/0)665.00
57.009.50
570.0028.50
Informal (5%)30.00
4.000.25
25.001.25
446.504.75
23.75
Formal (95%)Revenues from sales to Mine-Broker 475.00Expenses
Reservation WageTravel & Lodging
ProfitILoss
38
Informal (5%)25.00
23.500.251.25

4.1.2. Results
The preliminary estimates of the value of precious minerals production and trading from artisanalmining show that Tanzania's macroeconomic picture has been distorted by lack of statistics on thistrade. Several macroeconomic indicators have been undervalued in official statistics, namely exports,foreign exchange earnings, GDP and middle-income emploYment.·The real economic picture inTanzania is considerably healthier than the official one, largely due to this invisible trade.
l
4.1.2.1. Final Goods Method based on Mining Production and Exports
Official production statistics show rapid but erratic growth in the last decade. They need to beanalyzed together with export figures, as the production figures are estimated mainly from exportactivity. In fact, nearly all gold, and saleable diamonds and colored gems are exported, but thefigures for officially declared exports capture only a small portion of the real exports.
Table 4. Production and Exports of Precious Minerals, by weight, 1989-19963
Mineral 1989 1990 1991 1992 1993 1994 1995
Coloured Gemstones 24,621 32,292 59,625 26,676 32,979 48,507 94,296(Kg. Produced)
Coloured Gemstones 11,389 38,700 59,625 48,938 32,979 48,507 111,404(Kg. Exported)
Gold 112 1,643 3,779 4,525 3,370 2,861 320(Kg. Produced) BOT BOT BOT BOT BOT BOT
Gold (Kg. Exported) 112 1,643 3,779 4,525 3,364 2,803 320
Diamonds (Carats 75,885 84,598 99,762 67,304 40,847 17,177 49,538produced)
Diamonds (Carats, NA 75,979 90,892 70,706 39,885 22,567 44,492Rough exported)
Diamonds (Carats, 10,276 7,947 3,214 NA NA 87 NACut exported)·
Diamonds (Carats, NA NA 648,139 8,918 73,674 1,703 NAContract sales)
Source: .Ministry ofEnergy and Minerals.
3Source: Ministry of Energy and Minerals.
39

Table 5. Declared Value of Precious Minerals Exports, 1989-1996(in '000 US$)
Mineral 1989 1990 1991 1992 1993 1994 1995
Coloured Gems 784.06 1,584.87 1,759.19 3,236.70 3,914.76 6,464.85 7,279.93
Gold 1,152.06 13,635.06 29,099.70 40,380.00 31,450.80 25,679.40 3,268.80
Diamonds 9,752.72 7,393.46 10,030.16 8,300.50 5,265.19 2,898.38 4,341.31(rough)
Diamonds (cut) 4,461.75 2,648.22 1,303.25 1,720.00 2,450.00 1,820.00
Diamonds 610.94 107.01 93.00 320.00(contract sales)
Official gold exports expanded rapidly during the period when the Bank of Tanzania was purchasing itat world market prices, then dropped off sharply after purchases stopped. In the last six months of 1996there were no official gold exports through Tanzania.
Diamond sales fluctuated sharply and shifted between rough, cut and contract sales over the years.Coloured gemstones sales grew rapidly from the moment of liberalization, particularly since thediscovery of the extraordinarily rich alluvial deposits in the Songea and Tunduru areas in the 1990s.
The total declared value of official exports of these three commodities were valued at US$ 14.89million in 1995. The declared value peaked earlier at US$ 51,917.2 million in 1992 at the height of theBank ofTanzania's gold buying experience. The 1993 value, $US 40,630.76 million, amounts to 1.7percent ofGDP that year, and 9.7 percent of exports (fob, on a customs basis). In comparison, the totalindustrial sector accounted for only 14.4 percent ofGDP and manufacturing for 4.87 percent.
.Interviewees estimated that in 1996, 60 percent of saleable gem material and 70-85 percent of the goldwas exported through unofficial channels, either through neighboring countries or directly fromTanzania, by concealment or under invoicing. (ESRF/Tan Discovery fieldwork and Tan Discovery,1996) The present study found that by the end of 1996, no gold was going through official channels,and an estimated 95 percent of it was going through Kenya. Official gold exports had dropped from4,525 kg in 1992 to a mere 320 kg in 1995, as only a few legal buyers remained in activity.
Increasingly stringent and variable tax levies have driven most of the remaining buyers out of legalbusiness. The trade quickly shi~ed in the direction of Nairobi in any case when the dominant legalmarket suddenly shut down. Closing off the market also depresses production, as artisanal mining isfinanced by sales.
40
What is the total value of gold sales? In the absence of any. reliable production or sales data, one mustmake some inferences from existing official statistics.4 Sparse, but interesting data on regionalmarkets also helps to gauge the scale of mining revenues. The one period when a fairly large portionof gold sales went through official channels was from 1990 through 1994 when the Bank of Tanzaniawas buying. Estimates of what portion of the total it succeeded in attracting, however, vary fromroughly 20 to over 100 percent. It could have exceeded total Tanzanian production, as gold fromEastern Zaire was and is known to pass through neighboring countries, including Tanzania. Aconservative assumption would be that Tanzanian gold exports, legal and illegal, since 1995 havebeen less than their peak level of 4.5 T.
A low estimate of 3 T/yr since 1995 would be based on the following assumptions:
(1) The Bank of Tanzania was attracting nearly all Tanzanian gold exports in its peak year plus somefrom neighbouring Maniema province of Congo (ex-Zaire). (Burundi, for example, was legallyexporting 11-14 T of gold per year in the late 1980s and early 1990s, mostly reported to be fromZaire, some also from Tanzania.)(2) Lack of regular revenues from gold buying has hampered mining operations and reduced totalproduction below 1992 levels.
A high estimate of 20 TIyr would be based on the hypothesis that the illegal trade predominatedeven during the period of the official buying program. Officials in the Ministry of Energy andMinerals and others knowledgeable on Tanzanian mining believe that the Bank of Tanzania attractedonly one fourth to one fifth of Tanzania's total gold exports, even in its peak year. Althoughproduction shifts from site to site, their informal tallying of production figures they claim is consistentwith the high estimate. Holding constant the influence of Congolese gold, they therefore estimate totalartisanal production at 20 T per year. This estimate assumes that production did not decline afterofficial sales stopped in Tanzania, as the market through Kenya remained reliable. In the secondphase of the study the team proposes to calculate the relationship between gold yields and mercuryconsumption, as mercury is mainly used in the initial refining of gold by artisanal miners. Mercuryimport statistics will be collected for recent years.s This may help to close the gap between low andhigh estimates of gold production.
4Most previous studies have not attempted to estimate the total value of informal sectorartisanal mining and marketing in the context of the national economy. The exception is theVethouse study (p.6). It gives an estimate of gold exports averaging 3.2 T per year for the period1990-1995, valued at US$ 40 million annually. On the same page, it estimates that 1200 claimholders, employing an average of 20 miners paid an average of $500 per month generate US$ 144million per year, more than three times official export figures. A third calculation, assuming200,000 miners earning $10,000 per year each, gives a total value of US$ 2,000 million. Both ofthe latter estimates are faulty, as mine workers are generally not paid salaries, but rather shareproduction. Many claims are idle, and many mine workers work only part of the year. Moreover,their earnings may be seriously overestimated at $500 per month.
sThe Vethouse study estimated that about 3T of mercury are consumed in Tanzania per year(no source cited), with about 500 kilos each year going into gold refining in the Lake Zone alone(source: Madini zonal office).
41

Coloured gem production, on the other hand, has experienced an extraordinary boom from 1989through the present. By 1995 official exports had multiplied tenfold in relation to their 1989 levels. Ifunofficial exports account for 60 percent of the total as our fieldwork indicated, their value in 1995would have been an additional US$ 10,920 million, bringing the total value of coloured gemstoneexports to US$ 18,850 million, even before allowance for under invoic.ing.
Summary: Value of Gold and Gemstones Exported from Tanzania in 1995
By the above estimates, the total export value of gold, diamonds and coloured gemstones produced inTanzania in 1995 were as follows:
Low estimate:
• US$ 33.33 m (gold);• US$ 20.02 m (gems) and• US$ 11.94 m (rough diamonds),• for a total of US$ 65.29 million.
Even this low estimate would make precious minerals Tanzania's fourth most valuable export, aftercoffee (1994/95 US$ 150.4 m), cotton (1994/95 US$ 105.12 m), and manufactured goods (1994/95US$ 87.0 m). If all exported through Tanzania they would increase the total value of exports by 10percent, and constitute 9 percent of the resulting total exports by value. Under presentcircumstances, where most are smuggled out before final export, they nevertheless contribute $53.5million to total real exports (see calculations below), adding 7.2 percent to official exports andcomprising 8.1 percent of the total.
High estimate:
• US$ 224.4 m (gold),• US$ 47.32 m (gems) and• US$ 28.22 m (rough diamonds),• for a total of US$ 299.9 m1yr.
This assumes 20 T of gold exported per year. For gems it assumes that 80 percent, rather than 60percent is smuggled, and that there is an average of 30 percent underpricing on declared values. Fordiamonds the field work has not yet permitted the team to study invoicing practices, so it wasassumed to be comparable to the distortions experienced by coloured gems. It will be revised in thesecond draft. At the high estimate, precious minerals would constitute 42 percent of the substantiallyincreased total export figure.
4.1.2.2. Value-Added from Mine to Market Trade; Impact of Smuggling
The goal of the field work for this study was to understand the economic, policy and geographicfactors operating at each level in the marketing chain. In this section we use. the value-added approachto evaluate the contribution of minerals trading and the effect of smuggling at different levels in thechain to GDP. Total value-added from each firm and organization in the Tanzanian economy equalsGDP at factor cost and current prices, which the Bank of Tanzania estimated at TSH 2,196.324
42

billion in 1995. In US dollars that came to $3,786.77 million, ,ofwhich minerals exports comprised 1.7percent (low estimate above) to 7.3 percent (high estimate above).
The valued-added approach to calculating GOP gives a more precise picture of the effects ofsmuggling, as a certain portion ofthe produce is diverted at several different levels in the marketingchain. Analysis of price markups at each stage in the marketing chain shows what proportion of theadded value is generated at each level. Prices of gemstones from Northern Tanzania at the mine, forexample, averaged 8-28 percent of the dealers' purchase prices in Arusha and Nairobi. This means that,from mine to export level, 73-92 percent ofthe value added contributed to GOP is generated by trading.In gold the margin is smaller, with the mine price equivalent to US$ 9.17 per gram being 83.36 percentof the sale price ofUS$ 11 per gram(Late 1996, Nairobi). Only 16.64 percent of value-added isgenerated by trading between the ~ine and the export market, while the mine price reflects the reservevalue plus the value-added contributed by mining and initial purification.
Table 6. Value-Added in the Gold Marketing Chain, Tanzania and Kenya
Tanzania VA Kenya VA
Level Price (US$/g) Volume US$/g Price (US$/g)Volume US$/g
Mine broker 7.50 100.00OR 7.50 7.50 O.OOOR 0.00
Broker 8.67 95.00Ofc 1.11 8.67 5.00CYc 0.06
Dealer 11.00 5.00Ofc 0.12 11.00 95.00CYc 2.22
Export 11.38 5.00°1c 0.02 11.38 95.00OR 0.36
8.74 2.63
76.86Ofc 23.14%
Trading margins tend to be higher and markets more volatile for gems than for gold because of therelative difficulty of valuing gems. There is also more volatility in new mining areas and with newcommodities than with established gem markets. Some extraordinary margins are recorded for thehighest value stones from Tunduru area, for example. This is typical of new markets where marketinformation is poor, but the situation cannot be expected to last long. Gradually miners, brokers anddealers all have a better idea of the value of their holdings and margins tend to become smaller andmore reliable.
Tanzanite prices are therefore a better gauge of gems contribution to GOP over the medium and longterm, as the market is better developed and margins more predictable. In May 1996 a top quality 1.0gram round stone, colour A with no inclusions fetched TSH 25,000 for the miner at Mbuguni, TSH40,000 for the mine broker at Mbuguni, TSH 48,000 for the second broker at Arusha and 60,000forthe dealer! exporter. In this case 42 percent of the domestic value added, for GDP purposes, wasgenerated through the value of the stone itself and the process of extraction. The remaining 58percent was generated by marketing: 25 percent of value added (less operating costs in each case)was generated by the mine broker, 13.3 percent by the mine to market broker, and another 20percent by the dealer.
43
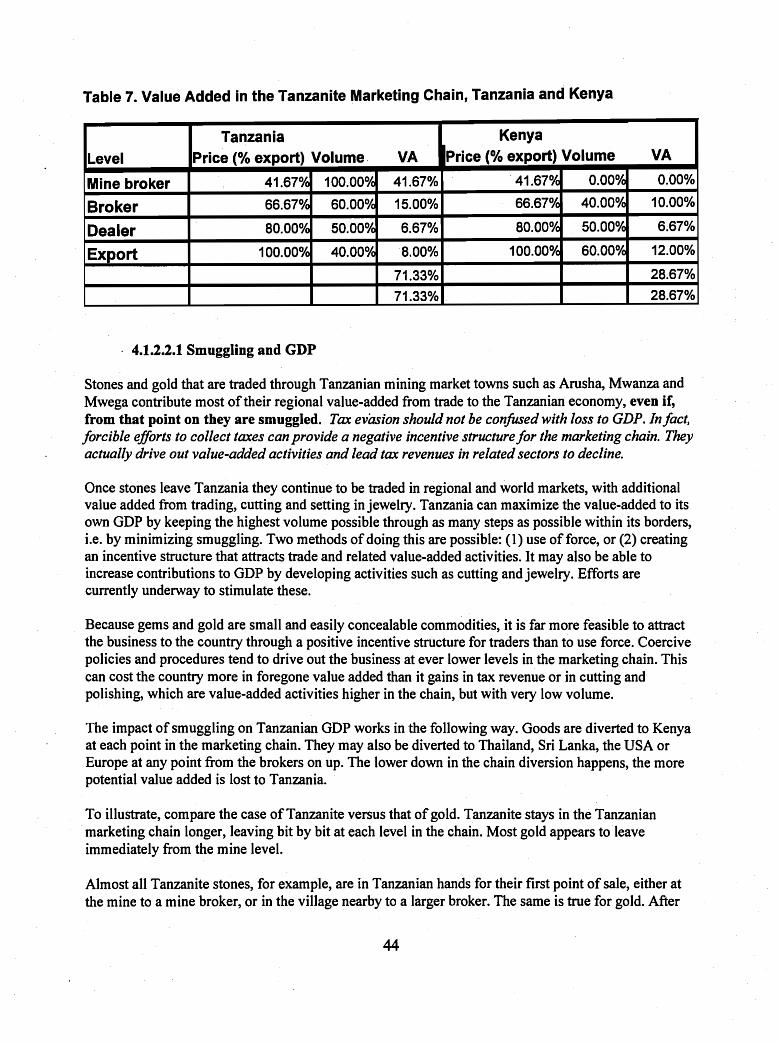
Table 7. Value Added in the Tanzanite Marketing Chain, Tanzania and Kenya
Tanzania Kenya
Level Price (% export) Volume. VA Price (% export) Volume VA
Mine broker .41.67~ 100.00~ 41.67% . 41.67~ O.OO~ . 0.00%
Broker 66.67~ 60.00~ 15.00% 66.67~ 40.00~ 10.00%
Dealer 80.00~ 50.00~ 6.67% 80.00~ 50.00~ 6.67%
Export 100.00~ 40.00~ 8.00% 100.00~ 60.00~ 12.00%
71.33% 28.67%
71.33% 28.67%
. 4.1.2.2.1 Smuggling and GDP
Stones and gold that are traded through Tanzanian mining market towns such as Arusha, Mwanza andMwega contribute most of their regional value-added from trade to the Tanzanian economy, even if,from that point on they are smuggled. Tax evasion should not be confused with loss to GDP. In fact,forcible efforts to collect taxes can provide a negative incentive structure for the marketing chain. Theyactually drive out value-added activities and lead tax revenues in related sectors to decline.
Once stones leave Tanzania they continue to be traded in regional and world markets, with additionalvalue added from trading, cutting and setting in jewelry. Tanzania can maximize the value-added to itsown GDP by keeping the highest volume possible through as many steps as possible within its borders,i.e. by minimizing smuggling. Two methods ofdoing this are possible: (I) use of force, or (2) creatingan incentive structure that attracts trade and related value-added activities. It may also be able toincrease contributions to GDP by developing activities such as cutting and jewelry. Efforts arecurrently underway to stimulate these.
Because gems and gold are small and easily concealable commodities, it is far more feasible to attractthe business to the country through a positive incentive structure for traders than to use force. Coercivepolicies and procedures tend to drive out the business at ever lower levels in the marketing chain. Thiscan cost the country more in foregone value added than it gains in tax revenue or in cutting andpolishing, which are value-added activities higher in the chain, but with very low volume.
The impact of smuggling on Tanzanian GDP works in the following way. Goods are diverted to Kenyaat each point in the marketing chain. They may also be diverted to Thailand, Sri Lanka, the USA orEurope at any point from the brokers on up. The lower down in the chain diversion happens, the morepotential value added is lost to Tanzania.
To illustrate, compare the case ofTanzanite versus that ofgold. Tanzanite stays in the Tanzanianmarketing chain longer, leaving bit by bit at each. level in the chain. Most gold appears to leaveimmediately from the mine level.
Almost all Tanzanite stones, for example, are in Tanzanian hands for their first point of sale, either atthe mine to a mine broker, or in the village nearby to a larger broker. The same is true for gold. After
44
that, however, 95 percent of gold leaves Tanzania in the hands of Tanzanian brokers who sell it inKenya. Gems follow a more diverse chain. .
From Merelani, the team estimates that 40 percent ofTanzanite is sold to Kenya-based brokers inmining towns. At this level, assuming 25 percent of total value-added is generated by mine brokers, 15percent stays in Tanzania (60 % of goods x 25% margin), while 10 percent goes to Kenya. At the nextlevel, another estimated 10 percent of Tanzanite production is sold to foreign brokers in mining ormarket towns. At the dealer level, another estimated 10 percent of goods is sold to Kenyan dealers,either because the dealer here is his agent or because it is easier to tum over the goods in Nairobi thanto find an overseas buyer.
In the above scenario, where 60 percent ofTanzanian mine production is ultimately marketed throughKenya, 73 percent of the regional value-added generated by Tanzanian small-scale gem miningnevertheless stays in Tanzania. Thirty-seven percent goes to Kenya. This is because much ofthevolume of goods traded stayed in the Tanzanian marketing chain until the higher levels. Thus, using thelow estimate of total regional export value ofgems mined in Tanzania, US$ 18.199 m, in 1995 gemscontributed an estimated US$ 10.199 m to Tanzanian GOP. Figure 1 (Annex 1) illustrates theproportional distribution ofvalue-added in a typical Tanzanite sale.
In the case of gold, since the Bank ofTanzania stopped buying in early 1995, the measures taken tolegalize private trading have not created a viable market in Tanzania. Most gold in the Lake Zone is inTanzanian hands only from the mine to the Kenyan border. Tanzanian brokers sell 95 percent just onthe other side of the border. The other 5 percent is smuggled out through Dar es-Salaam and Zanzibar.Dealers who used to trade legally find the new regulations too onerous to keep in business. The mineprice, as ofJanuary 1997, is 83.36 percent of the export price. Value added from marketing themarketing chain is 16.64 percent (now entirely unrecorded).
Overall, 77 percent of the value-added by gold mining stays in Tanzania, even when 95 percent of thegold is sold through Kenya. Using the low estimate above gold production and trading contribute $25.7million per year to Tanzanian GOP, even when 95 percent of it is exported through Kenya. Using thehigh estimate, the contribution is US$172.8 million.
4.1.2.2.2. Impact of Tax Incentives on Dealers, Business Growth and Tax Revenues
Kenya has turned "a blind eye to the import ofgems and gold, thereby attracting most of the regionaltrade. Mozambique, Rwanda and Burundi have at times tried similar approaches. This has created astrong disincentive for Tanzanian dealers, in fact a business climate in which they cannot effectivelycompete if theyfully respect tax laws.
The model business plan below (Table 8 and Text Box) shows that the incentive problem for dealers isnot just a matter of how much profit they make. The current tax structure in Tanzania would keepTanzanian dealers consistently less well capitalized than their Kenyan counterparts, giving Kenyanbased businesses more working capital. This allows them to buy more quickly and a larger range ofgem qualities. In tum it increases their market share, and decreases the market share of Tanzaniandealers. As the total benefit to the Tanzanian economy (GOP) comprises the cumulative value added ofdealers and'their clients, the Tanzanian economy loses by this approach.
45

Table 8.
Hypothetical Gem Dealerships in Arusha and Nairobi
Effect of Transaction Taxes on BUsiness Growth and Total Taxes
Arusha Nairobi NairobUArusha
Gross Sales
1995 263,424 263,424 100.00%
1996 253,869 493,338 194.33%
1997 484,738 894,276 184.49%
tost of Sales
1995 109,908 109,908 100.00%
1996 131,889 255,378 193.63%
1997 232,158 414,115 178.38%
lWorkine Capital
1/1995 40,000 40,000 100.00%
12/1995 52,159 71,435 136.96%
12/1996 42,032 135,285 321.86%12/1997 96,094 287,997 299.70%
rraxes Paid
Transaction taxes1995 17,150 0 0.00%1996 14,902 0.00%1997 18,016 0.00%Subtotal· transaction 50,068 0Corporate taxes
1995 11,932 22,311 186.98%1996 (5,453) 34,381 -630.50%1997 28,572 82,230 287.80%Subtotal corporate 35,051 138,922
Total taxes 85,119 138,922 163.21 %!Incomes
Dealers1995 20,004 20,004 100.00%1996 25,000 35,000 140.00%1997 30,000 60,000 200.00%
Employees
1995 21,996 12,000 54.56%1996 25,000 18,000 72.00%1997 30,000 32,000 106.67%
Total 1995-1997 152,000 177,004 116.45%Net Worth
12/1995 52,159 71,435 136.96%12/1996 42,032 88,645 210.90%
12/1997 95,094 135,142 142.11 %
Source: See model business DIan table 8.
46
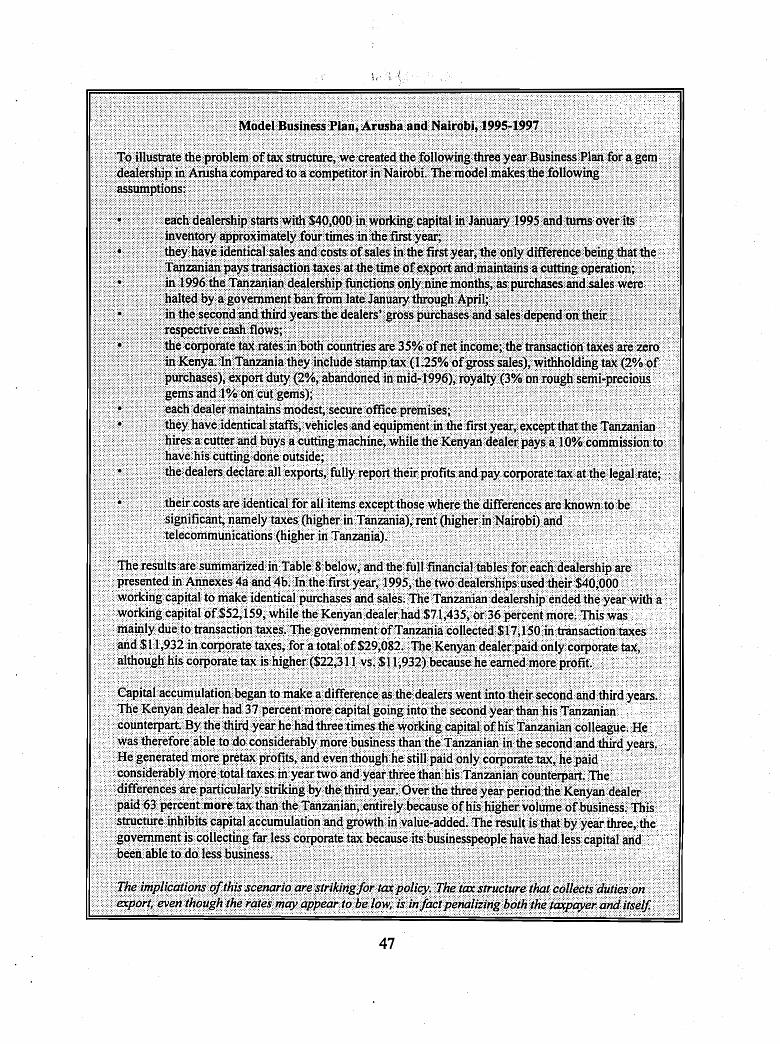
47
4~2.3. Contribution to GDP from Mining Using the Income Method
The baseline survey found 550,000 active persons living in mining towns and earning at least part oftheir income from mining (Tan Discovery, 1996). Mining towns are typically slightly segregated fromexisting indigenous villages, which is convenient for sectoral analysis. The persons counted above werenot, however, all residents of such mining villages, only those who claimed to have income directlyfrom mining. We have been unable to measure the levels of incomes directly from mining activities, asboth work and income are too sporadic for even the beneficiaries to calculate.. The reservation wage ofmenial labor in such towns, however, provides a convenient bottom line. According to our survey inAugust 1996, it was 2,000-3,000 TSWday. This was the wage earned by construction workers, shoeshiners and others too poor to work in the mines, according to their own accounts. A shoe-shine boy'snet earnings averaged TSH 1,500/d. In contrast, the reservation wage of agricultural labor in nonmining areas is about TSH 400 per day or US$19 per month (Odhiambo, Kristjanson and Kashangaki,1995). We therefore estimate that some 550,000 persons, mainly from farm households, have increasedtheir daily earning power five to seven fold for at least part of the year by moving into the miningsector. They also work more days per year, as mining is essentially a year-round activity. It shifts fromalluvial to reef and back, and is hampered by heavy rains temporarily, but continues throughout allseasons. We therefore estimate that active persons in mining communities work 200 to 250 days peryear, in contrast to the approximately 100 worked in agriculture.
These 550,000 active persons represent 3.75 percent of the entire labor force in Tanzania, and 4.4percent of the agricultural labour force.6 Eighty-six percent ofTanzanians, 12.6 million people in 1995,work primarily in agriculture. People have moved into mining from diverse occupations, althoughagriculture clearly predominates.
The average GDP (at factor cost) from agriculture generated by each member of the labour force inagticulture in 1993 was 39,963 TSH (US$ 98.67) per year. This reflects considerableunderemployment.
Using the income method of calculating GDP, we estimate that the 300,000 who worked in mining andrelated activities in 1992 contributed an average ofTSH 562,500 per active person per year to GDP(assuming 225 working days/year@ TSH 2,500/d). This would total TSH 112.5 billion added to theofficial GDP. By 1995 when the number ofactive persons had risen to 550,000, their value-addedcontribution to GDP is estimated at TSH 309.375 billion.
This is an enormous parallel economy, if these estimates are accurate. The entire agricultural sectorgenerated only TSH 365.6 billion in 1992, so artisanal mining and related activities generated anamount equivalent to 30.8 percent of all agriculture and 13.3 percent of total GDP. By 1995 officialTanzanian GDP at factor cost in 1995 was TSH 2,196.3 billion.' The additional TSH 309.375 billionfrom artisanal mining would suggest that total GDP was underestimated by 14.1 percent, and that
6projected from World Tables figures for labour force and population growth rate.
7Bank of Tanzania, Economic and Operations Report/or the year ended 30th June 1996,Dar es Salaam, ·1996, p. 71-72.
48

artisanal mining in that year contributed 12.4 percent of total GOP.B Compare this to the combinedvalue-added and final goods methods ofcalculating GOP, whereby precious minerals contributed 1.7(low estimate) to 7.3 (high estimate) of revised GOP in 1995.
4.3. Foreign Exchange and Minerals Marketing
4.3.1 Impact of Minerals Exports on FOREX Earnings
Whether exported through Kenya, through illicit Tanzanian channels, or entirely legally, through theformal banking sector, minerals generate foreign exchange. The amount of foreign exchange benefitgenerated by minerals exports is equal to the proportion of GOP generated. The same methods usedabove to calculate the proportion of GDP remaining in the Tanzanian economy also indicate themagnitude of the foreign exchange benefits. In the second phase of the study, the team proposes towork with monetary economists and the Central Bank to estimate these effects.9
Tanzania has recorded negative trade balances consistently for more than twenty years. From 1973through 1993, the average dollar value of imports of good and services exceeded exports by 127percent (World Tables, 1995). For the decade from 1983 through 1993, the average was 184 percent.Large official transfers and, to a lesser extent private transfers offset some of the imbalance,particularly from the mid 1980s on. The government budget also consistently ran a substantial deficit.In such circumstances one would expect rapid devaluation of the currency and r~pant inflation.Devaluation was indeed close to 100 percent per year in the late 1980s when imports were firstliberalized, but over the two decades, inflation in the CPI and monetary devaluation vis-a-vis the USdollar have each averaged only about 24 percent per year. Since the currency was allowed to floatfreely in 1994, devaluation has actually decreased.
4.3.2 Impact of Exchange Controls and Currency Fluctuations on the Trade
The behaviour of the exchange rate strongly affects the minerals markets in Tanzania. Oneproblematic area for traders is the gap between the official and parallel exchange rates, and another isthe transaction cost of two exchanges when exchange with the Kenyan shilling intervenes. Althoughboth Kenyan and Tanzanian shillings are supposed to be floating freely, and are exchanged inBureaux de Change, values over $10,000 are still subject to exchange rate management throughofficial channels. They receive the lower cheque dollar rate of exchange rather than the cash rate.Most of the master dealers interviewed affirmed that they have been affected by this cheque exchangerate as it makes it hard to compete with smugglers. Dealers reported a difference of 2 to 5 percent
8The number of days per year worked and the average incomes need to be the subject offurther questioning--phase two of the study should include this subject.
9The size of the entire informal sector in Tanzania has been estimated by several differentmethods. Sarris and Brink (1993), using the missing income method, estimated it at 60% to 68%of total GOP in 1985-88. With the demand-for-currency method, Bagachwa and Naho (1994)calculated that it had increased from 40-45% of GDP in the 1970s to 40-70% of GOP in the1980s. Both of these were too early to capture the mining boom.
49
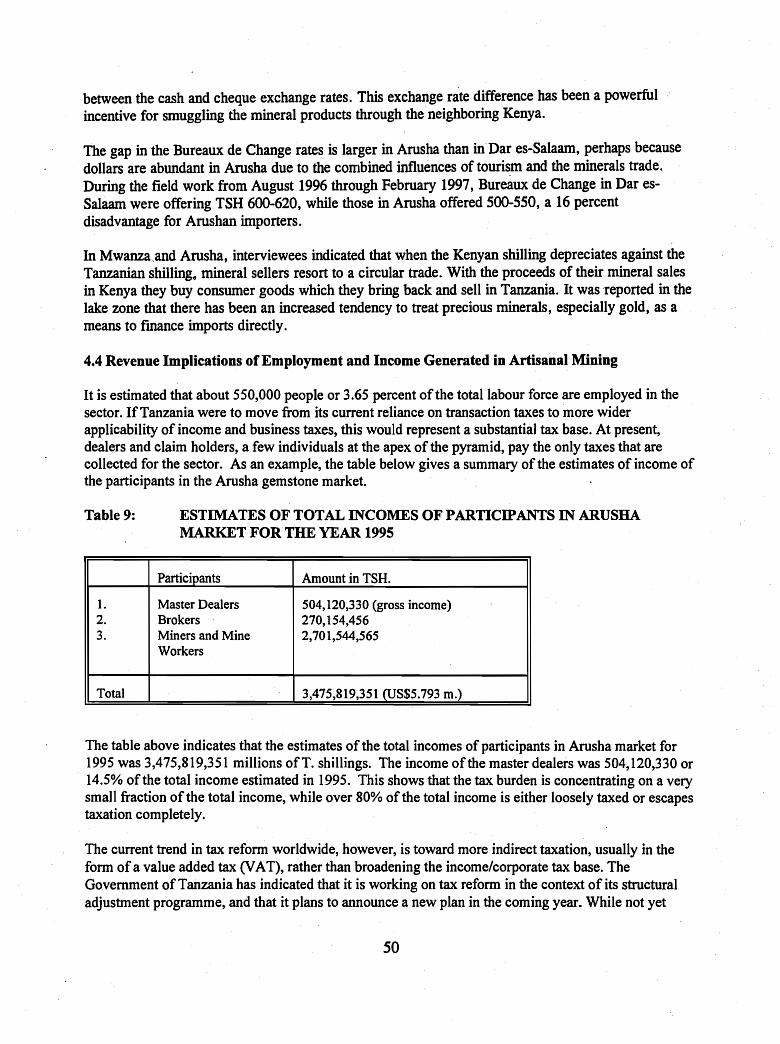
between the cash and cheque exchange rates. This exchange rate difference has been a powerfulincentive for smuggling the mineral products through the neighboring Kenya.
The gap in the Bureaux de Change rates is larger in Arusha than in Dar es-Salaam, perhaps becausedollars are abundant in Arusha due to the cODlbined influences of tourism and the minerals trade.During the field work from August 1996 through February 1997, Bureaux de Change in Dar esSalaam were offering TSH 600-620, while those in Arusha offered 500-550, a 16 percentdisadvantage for Arushan importers.
In Mwanza.and Arusha, interviewees indicated that when the Kenyan shilling depreciates against theTanzanian shilling. mineral sellers resort to a circular trade. With the proceeds of their mineral salesin Kenya they buy consumer goods which they bring back and sell in Tanzania. It was "reported in thelake zone that there has been an increased tendency to treat precious minerals, especially gold, as ameans to fmance imports directly.
4.4 Revenue Implications of Employment and Income Generated in Artisanal Mining
It is estimated that about 550,000 people or 3.65 percent of the total labour force are employed in thesector. IfTanzania were to move from its current reliance on transaction taxes to more widerapplicability of income and business taxes, this would represent a substantial tax base. At present,dealers and claim holders, a few individuals at the apex of the pyramid, pay the only taxes that arecollected for the sector. As an example, the table below gives a summary of the estimates of income ofthe participants in the Arusha gemstone market.
Table 9: ESTIMATES OF TOTAL INCOMES OF PARTICIPANTS IN ARUSHAMARKET FORmE YEAR 1995
Participants Amount in TSH.
1. Master Dealers 504,120,330 (gross income)2. Brokers 270,154,4563. Miners and Mine 2,701,544,565
Workers
Total 3,475,819,351 (US$5.793 m.)
The table above indicates that the estimates of the total incomes of participants in Arusha market for1995 was 3,475,819,351 millions ofT. shillings. The income ofthe master dealers was 504,120,330 or14.5% of the total income estimated in 1995. This shows that the tax burden is concentrating on a verysmall fraction of the total income, while over 80% of the total income. is either loosely taxed or escapestaxation completely.
The current trend in tax reform worldwide, however, is toward more indirect taxation, usually in theform ofa value added tax (VAT), rather than broadening the income/corporate tax base. TheGovernment ofTanzania has indicated that it is working on tax reform in the context of its structuraladjustment programme, and that it plans to announce a new plan in the coming year. While not yet
50
officially announced, it appears that a VAT is likely to be imposed. Provided exports are excluded, thiswould be an improvement in the business climate for the minerals trade. If minerals exports are notexcluded, it would probably drive most of the remaining legal trade underground or out of the country.The recent experience of Thailand is illustrative. This thriving center of coloured gem trading andjewelry making imposed a 7 percent VAT on all transactions last year. It set off a depression in gemmarkets, sparked several bankruptcies and caused some major foreign investors to withdraw (BangkokPost, Aug. 5, 1996 and Internet gem newsletters). Cutting was particularly affected, as it was alreadyfacing a problem of rising labour costs, and the shift of such operations to China seems to haveaccelerated. Thailand's industry appears to be surviving the effects ofthe VAT, but Tanzania'sfledgling gem sector is not so robust. The impacts of tax reform, and particularly how the VAT isapplied, need to be explored carefully in advance.
Local taxation authority is currently inadequate, as powers of taxation are concentrated in the centralgovernment. The negative externalities of mining, both artisanal and formal, are mainly experienced bylocal communities. In addition to the economic problems of mining-induced localized inflation, theseinclude strains on existing socials services such as schools and health facilities. Environmental damagein the form of unfilled pits, slag heaps and pollution of the air, soil and water supply is also mainly feltlocally. Moreover, local communities know who is mining what where, and would be much betterplaced than central government authorities to apply reasonable taxes to mining if they had the authorityto tax. With that authority should also go transparent procedures for deciding on and administering theresulting local government budgets.
4.5 Policies Favoring Value Added Activities
When one mentions value-added, policy makers generally think that upstream and downstreamprocessing activities are the subject. Calculating the economic value added generated in a year by eachstep in the marketing chain, as we did above, shows the importance of trading as a source of valueadded, and ofvolume of business rather than mark up as a source of profits. Both concepts tend to bepoorly understood by many policy-makers and even some business people. The price markup for cutstones compared to rough may be 2 to 3 times. People therefore tend to equate this with the only"value-added" activity in the chain. In fact, the vast majority ofcurrent economic value added is beinggenerated by trade, Le. collecting, sorting, buying and selling.
Volume is the main reason that trading is more profitable and generates more value-added for firmsthan cutting stones. There is a limited market for cut stones, and they must compete. with massproduction in Thailand and other lesser cutting centers. Traders have a smaller markup on rough stones,but make up for it with high volumes. The advantage is greater as one ascends the marketing chain.Small brokers may have a large margin and very low volume of transactions. Dealers rely more onvolume of transactions. Contrary to popular opinion, the most successful dealers are not those whohave the highest mark-ups. A dealer who sells one parcel per month for which he paid TSH I million,and gets TSH 1.5 million has TSH 500,000 in monthly gross profit. Another who pays TSH 1.1 millionper parcel and sells five per month at TSH 1.4 million has a monthly gross profit three times that size,TSH 1.5 million. Only the largest dealers have sufficient volume of gem quality stones to justifyinvesting in lapidary equipment and hiring a qualified cutter. .
The relationship between volume and global value-added is also very important in deciding how muchpolicy weight to put on activities such as heat treatment, faceting and polishing, of stones and finalrefinement of gold. These are often called value-added activities, with the implication that trade is not
51
adding value. They are developing gradually in Tanzania, with government encouragement.· They areareas, however, in which Tanzania can only gradually develop a comparative advantage. Some twentynew cutting machines have been imported in the last year or two, which shows that dealers are trying tolook to the future and develop the capacities needed to be competitive in processing gems. Most are notcurrently economically viable, however, and dealers must subsidize the cutting through profits on rawstones.
From an economic point ofview it is seriously misleading to regard cutting or heat treatment as themost interesting forms of ''value added" for precious and semi-precious stones. The reason is thatvolume is more important than price margins. Price margins appear high for a single stone that issuccessfully cut and sold. Unfortunately only a tiny proportion of stones can be successfully cut andsold. Two- to three-fifths ofthe raw stone weight is generally lost, so that a 1 gram raw stone yields a1-2 carat faceted stone. The waste portion could be used to make tiny calibrated stones for massproduced jewelry in Thailand. In Tanzania there is not sufficient volume, and none ofthe lapidaries docalibrated cutting. Moreover, in a certain portion ofvaluable stones, a less experienced cutter spoils thestone or gets considerably less value from it than could have been obtained, making it sell slower or notat all.
World market dealers often prefer to have stones cut close to their final selling market, so that fashioncan determine what cut to give. For the highest value stones, the most valuable cut is often to the finalbuyer or the jeweler's specifications. This argument is diminishing in weight, however, as marketinformation and fashions are increasingly globalized and rapidly communicated. International gemshows, magazines, and most strikingly the Internet now communicate changing tastes and designsaround the world. Tanzania is on.the verge of this global market, with some.few dealers trulyconnected, but most having only occasional and/or second hand exposure.
Tanzanian dealers are nevertheless, with government encouragement, gradually developing a cuttingindustry. Recently import tariffs on cutting machines and other lapidary equipment were eliminated.Negative incentives for exporting raw stones have also been created for some dealers. In March of1996, regulations were issued requiring foreign dealers stay out of mining areas, to work from towns, toestablish lapidaries and to have stones over 1 gram cut before exporting. They were also to deposit a$50,000 bond. These regulations would actually have made a dealership non-viable, particularly thebond requirement. The start-up working capital of the dealerships we modeled in Tanzania and Kenyawas only $40,000. If a dealer has to tie up $50,000 at zero interest, most will not go into that business atall. At a time when interest rates were 39%, a potential dealer would have to deduct that as theopportunity cost of his capital and count his rate of return only when it exceeded that amount. Fieldinterviews suggested that those foreigners who most wanted to stay because of long term residency orfamily relationships were accommodated by the government, either by being given permission tooperate as Tanzanians or through relaxation of the most onerous requirements. A few foreign dealers,some ofwhom had been pretending to mine in order to be well situated in the trade, decided to abandontheir operations. This deprived the sector ofcapital, but Tanzanian dealers considered it necessary toprotect their ability to compete.
Dealers who cut stones need a different set ofbuyers from the ones to whom they sell rough stones.They may actually be in competition with their traditional buyers if they start cutting. Add to this thelower volume of business for lapidary activities, the higher costs ofoperation and the lack of skilledcutters. All these factors may be overcome gradually, but the sudden obligatory transition was judgednot to be viable by most foreign dealers. From the point ofview ofthe Tanzanian national economy a
52

policy forcing dealers to undertake capital-intensive processing leads to waste of resources, capital andlabour, that could generate more value added if engaged in trading. On a voluntary basis, they arealready moving in the right direction, and can be expected to gradually develop some comparativeadvantage, particularly for the substantial local tourist market.
4.6 Negative Externalities from Artisanal Mining
Mining, whether large-scale or small, has serious negative impacts on the economy that are not directlymeasurable in the accounts of the enterprises involved. Chiefof these is environmental damage. This isa critical issue, which must be dealt with, in both small and large-scale mining regulatory frameworks.This study does not go into detail, nor attempt to quantify the costs of clean-up, as separateenvironmental and regulatory framework studies have been commissioned by the government for thatpurpose, and this study team has not had access to them. As this study finds economic benefits fromartisanal mining to the population and the national economy on a scale that was hitherto unheralded, itis important to mention the environmental costs at well.
It is sometimes argued that small-scale mining causes environmental damage that is worse than largescale mining. This is far from obvious. The environmental problems created by mining are not easilymanaged whether the operation is large or small. For artisanal mining, the environmental risks consistmainly of improper use of explosives, a landscape scarred by myriad small trenches and, in goldmining areas, mercury pollution ofair, land and water. Large-scale mining companies centralize theiroperations and fence them, so they leave one huge hole and several large slag heaps, rather than manysmall ones. They generally use cyanide to leach out gold rather than mercury. The cyanide enters thefood chain through birds, insects and small animals, however. The slag heaps, being on a scalehundreds, sometimes thousands of times greater than artisanal ones on the surface of the same area,create much greater risks of long-term acid leaching into ground water.
The environmental damage caused by small-scale mining needs to be managed primarily at the locallevel. The role of the central government can be to set environmental and safety standards and createlegal prerogatives of local communities, notably to impose an environmental tax and to enforce thestandards. For large mining operations the central government is likely to bear responsibility for bothsetting and enforcing environmental and safety standards.
53

5.1 Opportunities
Tanzania faces three major opportunities to enhance economic growth and socioeconomic equity in themining sector. One is to continue to let artisanal mining thrive and generate employment, and inparticular to protect it from being squeezed out by formal capital-intensive mining. There are means tocreate a balance between the development of formal mining and continued artisanal mining, andTanzania seems to be opting to attempt this. Without meaning to do so, however, by opening up formalmining exploration and production, Tanzania is likely to cut off the livelihoods of thousands ofartisanal miners and marketers.
A second opportunity is to attract more ofthe trade of precious minerals through Tanzania. Thisinvolves creating a business climate in Tanzania that is safe, legal and efficient-more attractive tominers, brokers and dealers than Kenya's.
A third is to develop processing, cutting, jewelry, crafts and mining service industries. Upstream anddownstream economic activities have considerable future potential, particularly if Tanzania continuesto protect artisanal mining. If international mining companies come to dominate the sector, they willmarket their minerals to the most internationally competitive markets, which today means Asia.
Minerals are depleting resources, which places a special responsibility on governments and miners toexploit them in economically and socially desirable ways. Tanzania has a rapidly growing andunderemployed labour force, so preserving room for a labour-intensive approach has a soundeconomic and social rationale.
5.1.1. Balanced Development of Modern and Artisanal Mining
The Government ofTanzania has made a series of commitments to artisanal miners to keepopportunities open to them. This is in keeping with Tanzania's tradition ofgrass roots development.Now, however, in a context of liberalized economic policies, investment promotion plans have beendeveloped and a number of exploration and production contracts signed with international miningcompanies. Interest is high, as evidenced both by the exploration underway and the attendance ofbetween 50 and 100 mining companies at promotional and policy meetings called by the Government.The most interesting geological formations reportedly have all been allocated for large-scaleexploration. Many of the current permit holders are junior mining companies specializing inexploration. If the exploration proves productive, they would normally either selJ out to large miningcompanies or go into partnership with them in order to bring mines into production.
Many of these exploration permits overlap existing artisanal and smalJ-scale mining operations, forwhich valid claims are already registered. Large firms which confirm the presence of major depositsgenerally either buyout the valid claim holders on the proposed mining site, or get a governmentcommitment to do so.
55
Buying out small claims is standard practice in mining. It poses problems for Tanzania's policy ofprotecting artisanal mining as an employment, however. The mining companies and artisanal minersare operating in a dual economy. Access to capital is the key to success for companies, but artisanalminers rely on labour-intensive methods. An international mining company can afford to offer agenerous buyout to a small claim holder. Individual claim holders can even be encouraged to negotiatea share in the mining interests or other means of continuing their own incomes. The problem is that theworkers who depend on them get no compensation, and have much less chance of finding ajob with aninternational mining company. For every mine claim holder bought out, ten to two hundred workersand their families lose their access to an important source of income.
International mining companies invited to a policy seminar in Arusha in 1996 argued for a singlemining code applicable to all types ofmining. They understand that under such an arrangement,capital-intensive mining methods will prevail. Their arguments include the following points:
• major capital investments are needed for modem mining,• modem methods are more efficient, producing higher yields and faster growth,• theft and smuggling are minimized by their tighter controls,• the health ofworkers and their families is better protected,• environmental impacts are more scientifically approached.
These are valid points, but lack an historical and socioeconomic perspective. Modem methodsdefinitely have a place in developing Tanzania's resources. They do allow companies to identify majordeposits more accurately, thereby leveraging investment capital needed to exploit them. They bringmore ore out of the earth more quickly. For the ores they process, they can obtain higher yields, whichis an important argument for a depleting resource. They could reprocess slag heaps from artisanalmining, however, and obtain equally complete exploitation of the resource.
Capital intensive mining companies do generate revenues for themselves and the government morerapidly. They do minimize random smuggling, but they themselves are the primary beneficiaries ofthose controls. The degree to which.they benefit government coffers varies greatly. Some negotiateagreements in which their investment costs are recovered very quickly in a tax sheltered period andthen sell out or abandon the mine when the deeper hard rock mining, the more expensive phase ofoperations, is reached. The next company to take over will generally negotiate new tax shelters.Negotiated agreements generally providefor royalty payments, but the governments' ability to monitorcollections is limited. Historically, the ability of governments to reallocate those revenues to the benefitof the common good is also minimal.
The health ofmodem mine workers is considerably better protected. Artisanal miners' methods andlack of overarching organization results in many accidents. Working conditions are often poor.Workers and families are poorly housed and/or separated. These problems need to be addressed.
The environmental argument is less clear. Gold production is the main concern. Artisanal miners usemercury to purify the ore; releasing traces ofthis toxic and long-lasting element into the soil, air, andsometimes water. It affects those who do the processing quite directly, and enters the food chain. Selfcontained retorques are available that recycle the mercury and prevent its escaping into the atmosphere.Miners have been slow to adopt them, however.
56

Capital intensive gold mining operations.instead generally ~reate ore heaps on top of well drained bedsand sprinkle them day and night with a cyanide solution. The solution which drains out is processed toextract the gold. This method also enters the environmental chain. Birds land on the ore heaps and diethroughout the surrounding area. They are then eaten by other animals, who also die. Another problemfrom both types of mining is the slag heaps and holes in the earth that they leave. Toxic drainage fromslag heaps can and does get into water supplies over a period of many years, despite the precautions ofactive mining companies. The slag heaps created by modern companies are generally protected fromthis at the time ofactive mining, but after the company leaves they become a public problem. The slagheaps and pits left by modern companies are larger than those of artisanal miners, by a factor ofthousands sometimes. Even after the cyanide decomposes, they create acid drainage that seeps into thewater table.
Tanzania is breaking new policy territory in trying to protect artisanal mining as a sector. Its hope isthat artisanal mining can gradually involve into small-scale formal mines. Part of the US$12 millionWorld Bank loan it has taken out will fund programs to educate artisanal miners and institutearrangements to mitigate their environmental impact. Creating a viable marketing system based onlicensed buyers and brokers will be a critical factor in the success of this effort. Miners, brokers,dealers and government must all have confidence in it.
Artisanal/small-scale indigenous mining will have a far better chance of survival if protected zones areestablished, in which international mining companies are not allowed to buyout claim-holders. Alluvialdeposits, which lie close to the surface, lend themselves to artisanal exploitation. They can be minedwith hand tools relatively safely and with less environmental impact than pit mining. This slowsproduction, but for gems that is generally a good thing. It avoids production surges that could saturatethe market.
For gold, the market-supply argument does not hold. Modern mining methods could produce gold morequickly than artisanal, and have little impact on international prices. Even for gold, however, artisanalmining of surface deposits would be a wise policy for Tanzania, particularly as an interim measure.Many countries, including Thailand and Sri Lanka, protect artisanal gem mining, but for gold this ismore rare. Ghana and Eritrea both have systems that reserve certain areas for artisanal mining andothers for modem capital intensive mining.
Tanzania, if it adopted a generous zoning plan, would maintain wide distribution of incomes frommining, instead of concentrating it in the hands of foreign mining companies and government. Sincegold is a depleting resource that maintains its value over time, exploiting it slowly benefits moreTanzanians. More generations of Tanzanians will share in the benefits, and a wider participation willlet more families benefit directly from employment and incomes in the process. In the end, capitalintensive methods will probably be adopted, as they are more efficient. Stretching out the transition,however, allows Tanzanians to accumulate savings and spreads capital throughout the society. Thiscreates the basis for a more widespread, better balanced economic development.
5.1.2. Competing with Kenya
When Tanzania's artisanal mining was liberalized over the last decade, market channels alreadyexisted to established markets, mainly through Nairobi. One ongoing challenge is to create aregulatory framework and infrastructure needed to make Tanzanian markets competitive and to attractthe mineral trade to follow the legal channels. This effort has only been partially successful, but has
57
met with many setbacks. The collapse of state monopolies created a marketing vacuum. As marketingwas shrouded in secrecy, policy-makers have had to proceed by trail and error. It. is not surprisingthat they set tax rates above those that are optimal for either. sectoral growth or revenue generation.They have had little solid information on which to base economic calculations, and no policy-maker islikely to trust a tax-payer to tell him what the market can bear in the way of tax imposition. Ministryofficials have nevertheless engaged in a continuous dialogue with dealers and other mining sectorparticipants to arrive at proposed new policies that may be more incentive-oriented.
Official statistics show declining gem, diamond and gold exports from 1992-1997 at a time whenbaseline surveys show all three sectors were booming. This suggests that despite good intentions, atleast some of the policies have not been providing the right incentives.
One should consider it a policy success that the Tanzanian government did not overreact to thissituation, did not seize on the undesirable aspects of artisanal mining as a pretext to suppress it. Thegovernment allowed artisanal mining to flourish, and to fmd regional markets when its own wereinadequate. The one brief exception was a period of three months between 28 January-l April 1996,when gem marketing was banned while the government put together a new policy.
The present study provided some key elements of the strategy needed to compete with Kenya, partly byportraying clearly what business climate is necessary for good marketing, and partly by asking brokerswhat advantages they found in selling in Kenya. The concerns can be summed up in four points: .(1)economic/tax advantages, (2) good infrastructure, (3) safety, and (4) reasonable, reliable laws.Tanzania can do much in each of these fields to increase its competitiveness.
5.1.3. Developing downstream value-added activities
The third area of opportunity is in downstream value-added activities such as gold purification, gemcutting, jewelry, crafts and mining services. Tanzanians and foreign investors are already moving todevelop various types of mineral processing. Three gold refming companies have been set up in theLake Zone, more than twenty new lapidary operations are trying to get established, Tanzanite heattreatment has become generalized, and there is small growth in a crafts and jewelry market orientedtowards Tanzania's potentially large tourist market. The policy framework has been reformed toeliminate import taxes on most of the machinery needed for such investments. Most operators,however, were found to face difficulties associated with trying to develop a comparative advantage in anew area: lack of infrastructure, poor information on suppliers and markets, difficulty incommunicating information about their products, and stiff competition from established producerselsewhere in the world.
Tanzanian efforts to develop value-added activities have concentrated a bit too much on goldpurification, gem faceting and heat treatment. Many possibilities exist for generating jobs and incomesupstream from the trade. There are, as yet, no reliable suppliers of mining and purifying equipment, orjewelry supplies. There is aD urgent need for roads, the building of which could generate thousands ofjobs. Downstream there are also many neglected opportunities, the first of which is in the localprocessing of second quality material. As only top quality material is currently marketed, the vastmajority of the gemstone mined is simply left in the mining area. Using this material for crafts and lowcost tourist items would require less technical skill than cutting grade A gemstones. Polishing tumblerscan be made available in the mining villages, and operated on a budget of less than $10 per month for
58

supplies and batteries or electricity. Polished bits of non-geIll rough can be made into necklaces,bracelets and other jewelry or crafts. The metal settings are available very cheaply, but not inTanzania.
5.2 Constraints and their policy implications
Creating an appropriate business climate for the existing players in the market networks in Tanzania isone of the keys to the future of artisanal mining. And artisanal mining can be the foundation of a widelyshared prosperity in Tanzania. This study has tried to describe the markets as they are. Every link in thechain exists for a reason, in most cases many more reasons than we have been able to analyze. Ourhypothesis is that the policy framework should begin with the reality that exists, and try to improve on it,rather than imposing an outside model. Reasonable provisions to legalize the status of each type ofparticipant, and to protect their legal operations, are still not in place.
The analysis of the participants in the mineral market made in the previous section reveals that a numberof factors are responsible for the current narrowness of the official mineral market for the small scalemining subsector in Tanzania. Both market and government failures have greatly contributed to thesefactors. Instability, inappropriateness and lack of transparency in policies, and the regulatory and legalframeworks regarding the sector are the main features of government failure. Specifically, inappropriatefiscal policies, bureaucracy and cumbersome procedures in the marketing process, lack of stability andtransparency in the rules and policies governing the marketing process, financial constraints, lack ofenforcement of both production and marketing regulations, have in one way or another contributed to thenarrowness and volatility of the minerals markets. On the other hand, poor market information, lack of·technical skills, inadequate business connections, and under-capitalization seem to be the major causesfor the weak competitive position of many Tanzanian participants. These are elaborated in the followingsubsections of this chapter.
5.2.1 The fiscal regime
5.2.1.1 High and unpredictable tax levels
Uncompetitive high and unstable tax levels were mentioned as constituting the major problem facing theminerals markets in Tanzania by almost all participants of the market interviewed. Most of theseparticipants were aware that tax rates are higher in Tanzania than in Kenya - Tanzania's majorcompetitor. Tax administration is also arbitrary and unpredictable, which increases the incentive forsmuggling.
5.2.1.2 Many different taxes, payable to different authorities
The other problem oftax system mentioned by the participants is that there are many types of taxes.They mentioned these taxes as stamp duty, withholding tax, royalties, export tax, income tax and salestax. One has to go to several different offices to process each export shipment.
59

5.2.1.3 Fears of future taxation
There is now discussion of imposing 20% VAT. Unless all exports, including precious minerals, areexempted from VAT, as is the case in Kenya, the imposition of a 20% VAT would clearly destroy whatremains of legal trade in Tanzania. One has only to factor it into the Business Plan (see Chapter Four) tosee that it bankrupts the dealer within two years, and drives the remainirig trade over to Kenya. Dealerswho establish a pattern of exports now could set themselves up for sharply increased taxes in the future ifthey declare the full value of each export shipment.
5.2.1.4 Cumbersome and unclear tax payment procedures
Sometimes the procedures of paying taxes are unclear and cumbersome. The tax rates applied to gems areoutlined in the Business Plan (Chapter Four). The various transaction taxes applied in Tanzania total8.25% on rough gems and 6.2% on cut gems. In addition there is 35% corporate tax on the annualprofits.10
The effect ofall types oftransaction taxes was illustrated in the Business Plan comparing the ability ofadealer to make his business grow and of the government to generate tax revenues from the sector inTanzania and Kenya. Both countries apply the same corporate tax rate. But Tanzania also appliestransaction taxes. This yields higher tax revenues for Tanzania in the first year of business, but deprivesthe dealer of operating capital. The result is that the Kenyan dealership grows much more rapidly.
The effect of uncertainty also has a depressing effect on precious minerals business in Tanzania. Taxrates change often, sometimes in dramatic ways that make business competition difficult or impossible.For example, during a brief period in 1996, authorities attempted to impose an additional two percent .export tax. On gold, a recent attempt to impose a transaction tax of 30% on dealers in the Lake Zonekilled what remained of legal trade in gold. The total markup between the mine and export price was only17% at the time, so there is no way that the trade could pay such a tax at any point in the chain.
5.2.1.5 An inequitable taxation system
The tax system is also viewed as inequitable and inefficient. Dealers and miners consider it inequitablebecause while 550,000 people work in the sector, only a few dealers and miners pay any tax. Miningitself escapes most taxation.
5.3 Asymmetric information and the skills gap
More up to date market knowledge and marketing skills would improve markets at every level.Participants in the market at all levels interviewed during the field trip confirmed that there is an acutelack of information and market knowledge. Participants at the pit or mining areas level of the marketknow little more about markets than what they can learn at the Vijiweni. Brokers know more about thesecondary markets, but have little technical knowledge ofgemstones. Dealers have more information
10 Kenya applies no transaction taxes on exported precious minerals, and the same35 % corporate tax on profits. Mozambique, which has a rich gem mining areadirectly adjacent to the Tunduru alluvial deposits, charges only one percent onrough gem exports.
60

about the export market, and the leading ones employ cutters t6 appraise each stone and determineexactly how it can be cut. Most locally-owned trading companies lack timely information about the worldmarket, however, and most of them have not been operating satisfactorily due to this gap of information.
Most participants do not really understand how supply and demand determine prices. They tend topersonalize each transaction and spend a lot of time negotiating deals and trying to collect paYments. Thetransaction costs are elevated as a result. Government economists need to work with ~.miningcommunity to explain, for example, how surges in supply ofTanzanite depress pric~s· on the'worldmarket. Policies which encourage more gradual production would help maintain more stable prices·internationally, and ensure that greater benefit, flow to Tanzania in the long term. The Government canplay an important role in putting in place a conducive macroeconomic, regulatory and institutional
, framework that will promote mineral marketing. It can also facilitate access to timely market information,through lower telecommunications costs, and wider availability of internet services. The dealers' .association TAMIDA could offer information services to its members, as well, including the publicationand/or radio broadcast of world gemstones/minerals' market information within Tanzania.
This study reveals that miners and mine-workers have the following characteristics:
~ they do not know what type ofgems or quality is in demand in the market. They mine and laterseek a market, or they get market information indirectly through the fact that a dealer places anorder with brokers to collect a certain stone to fill an order he has received from overseas;
they cannot properly prepare their gemstone parcels as they do not know how to sort stones byquality, or what price to seek;
they sometimes cease mining operations when local brokers stop buying a certain type of stone.The same stone might be needed in other parts of the world but producers are not in a position toknow that.
In general, miners and mine-workers lack gemological information. Miners usually pay 10% or more ofthe value of stones they market for the assistance of mineral brokers. They rely on the broker's betterknowledge of the market and his mobility to reach those markets.
Only those working in alluvial grounds can change quickly to mine other type of minerals required by themarket. This is the case for most artisanal miners in Umba Valley areas and Singida. It is difficult forthose involved in underground mining to suddenly change, because their capital investment is in one typeof mine. When the market declines, some reef miners are forced to stop mining operations until itrecovers.
Present marketing arrangements in most mining areas favour the buyer. Miners beg buyers to purchasetheir stones. In mine rush areas where there are many buyers the situation is a bit different for goodstones. Buyers of gemstones or diamonds sometimes compete to offer high prices. This is the case inMerelani and Maganzo (Shinyanga) mine sites, (Arusha Region) and sometimes in Tunduru (MbeyaRegion).
Mineral Brokers have the following characteristics:
61

Their survival in business depends on their knowledge ofthe supply and demand of a particularmineral, in particular who wants to sell, who has what to sell and who needs what to buy. Smallbrokers in mining areas maintain good contacts with mine workers and those in gem centresfrequently visit mineral dealers offices to know the type of material they need;
The gemological skills of brokers are developed by experience, not training. Success depends onthe individual's ability to analyze the quality requirements of dealers, and to learn from pastmistakes. Neither formal training nor gemological instruments are readily available;
A broker's reputation is based on his ability to bargain and his honesty, something evel)' brokerworks hard to establish;
There is a loose cooperation among brokers.. They meet at·"Vijiweni" and assist each other on anumber of issues;
One can access short-term credit from a fellow broker or exchange vital market information andsometimes lay down common strategy on issues strengthening their business. In evel)' mining ormarketing centre there are "Vijiweni" places where one can always meet brokers.
Master dealers are characterized by their need to:
~ develop contacts throughout the world who trust them to supply good quality minerals promptlyand at favorable prices;
~ gather information on the local availability and prices ofminerals.
The six most successful firms in Arusha seem to have good contacts and information. They speak dailyby telephone with their overseas contacts. It has, however, been noted that most local dealers have lessinformation about the world market and many operate only sporadically or marginally due to thisinformation gap. The high cost of overseas telephone communications in Tanzania is a serious obstacle tothe maintenance of international market contacts. Ignorance of the market caused by this information gaphas been found to reduce the earnings of the participants in the market.
Mineral dealers get most of their market information through visiting foreign buyers, by making visitsabroad to attend gem shows or when marketing to individual companies. The Internet, which has becomea major marketing tool for precious minerals trade worldwide, has just become commercially accessiblein Dar es Salaam in the last few months. One or two dealers are connected, but none was using it foractive trading. Telephone services are not yet adequate in Arusha and Mwanza - where most gem andgold dealers are located. Vel)' few dealers subscribe to international mineral journals where they monitorthe market on supply and demand ofvarious minerals. Dealers who cooperate communicate market newsto each other regularly, especially the requirements ofvisiting foreign buyers. They will pool theirmaterials, ifnecessaty, to fill an order.
62

5.4 Bureaucracy and cumbersome procedures in the marketing of minerals
It was also noted that a lot of unnecessary paper work and bureaucracy greatly contribute to thenarrowness ofthe mineral market for small scale miners in the country. These problems are mainlyencountered when one is applying for a license or involved in exporting, which is a very cumbersome andtime-consuming experience. Bureaucratic hassles have affected the size of the official market in a numberofways. There are brokers who would like to buy a license,· but operate without one because getting itrequires one or more long and expensive trips to Dar es Salaam every six months. In Tanga, brokersreported that although the official monthly fee is only TSH.l0,000, there are hidden costs estimated atTSH.300,000 before one is licensed. This was found to be the case in Arusha as well. It was everywherecited as the main deterrent to getting a license. Once a broker is operating without a license, he has less tolose by smuggling, as he is already subject to police action if stopped. This contributes in large measureto products ending up in the unofficial market.
The above bureaucratic delays constitute what economists call transaction costs. In Tanzania theyconstitute very high, if invisible business costs. Any serious businessman will always look for ways tosave time~ If it takes less time to export through the unofficial channels, then that route will be adopted.Apart from the cumbersome procedures, the interviews also revealed elements of corruption within thesector.
5.5 Lack of enforcement of marketing regulations
Lack of clarity and enforcement of regulations guiding the mineral market was also found to be amongthe major factors affecting the minerals markets in the country. It was observed in the Arusha market forexample that licensed brokers lamented that they took all the troubles of paying license fees, and otherrelated payments to acquire licenses only to find that they occasionally experienced police harassment,and unlicenced brokers often escaped it. Active brokers in Arusha only are estimated in thousands, whileonly about 100 brokers are licensed. Because of this lack ofcontrol even those who do not have licensesand would like to acquire them hesitate to do so and hence the majority of them continue to operateunofficially. Failure to control the rules and regulations has also contributed to an increase in smuggling,as most unlicenced brokers are either smugglers or agents of smugglers.
Currently, there are no official gold dealers in the Lake Victoria gold fields, although it is known thatMwanza is among the largest gold markets in East Africa. In this case, the law is not enforced, because atthe mine level, officials know that the rules are not reasonable and therefore not enforceable. There arebig brokers and (unofficial) gold dealers in the Mwanza market who have been operating freely andundisturbed. A vicious circle is established, as no one will register to formalize their business so long asthey can operate well informally.
The field survey showed that local governments in mining villages are aware of the existence of theseinformal traders and have been taxing them in different ways. For example, it was noted at Sekenke thatoper~tors in the mineral trade have to pay TSH.5,000 per month to the village government. At Mabuki,all actors in diamond mining pay a total of TSH.l00,000 as contribution to education and water services.In Kalalani, traders reported a more informal relationship, in which, when villagers need funds for a"community project, they know that they can count on the mining community.
The relative ease of this relationship suggests that if local communities had the authority to tax mining intheir territories at a reasonable level, this would be acceptable to the miners. This is an important factor
63
in tax policy, as voluntary compliance reduces the costs of administering taxation. Such taxes should beused to mitigate environmental problems and other negative externalities created by mining.
5.6 Financial constraints
Operating capital is a critical factor in the ability of a dealer to function effectively. Well capitalizeddealers have a strong competitive advantage over new ones. This is particularly a constraint forindigenous Tanzanians, most of whom have built a small capital in the brokerage field or mineralconsulting and attempted to become master dealers. If it is known that a person is active in mining, bankcredit will not be available even for well secured loans, as the profession is, and rightly so, consideredrisky. This means that nearly all participants in the trade operate with their own or family capital.
The advantages that Kenyan dealers enjoyed because of better capitalization came out in interviews.Sellers prefer to deal with them because they pay cash on the spot, and often cover hospitality costs aswell. Brokers and miners complained that, in contrast, local dealers in Arusha often lacked capital andwould agree to a price only to pay it in small installments. When dealers were filling a foreign order forshipment, their suppliers complained that payments extended over a period of months. This hamperedbrokers and miners from doing their jobs properly, as they had to stop to try to collect overdue payments.In contrast foreign buyers pay promptly.
A capital cushion could also help dealers cope with market volatility, and improve their ability to timetheir purchases and sales advantageously. Mineral markets are inherently volatile. Markets experiencerecurring of boom and slump periods. Dealers in the rarest, most valuable commodities therefore try togain enough market share to playa role in maintaining prices. They try to stock gems, which is aneffective mechanism for building savings when supply is good, and to sell during lean periods. But thisrequires a strong capital position, which most Tanzanian dealers lack. Most ofthe buyers interviewedadmitted that 1995 was marked by excess supply of minerals, especially Tanzanite, that flooded themarket, causing a fall in price by half or more in all market levels.
As Tanzanite is a unique commodity, found only on this one site, if mineral dealers had had enoughcapital they could have bought large stocks and released it slowly to maintain·international price levels.Lack ofworking capital is a problem that has also greatly affected master dealers. It is estimated that ofthe 60 plus licensed master dealers in Arusha, only 10 are active. Dealers at all levels would like accessto capital loans. To set up in business they estimate that between TSH.l0-30 million is the minimumcapital requirement. (This is why we used TSH.25 million as the start-up capital in the Business Plan.)Most dealers and some claim holders surveyed indicated that they have collateral for loans from fonnalfinancing institutions. Financial institutions, however, refuse to finance them if they know that mining isinvolved.
5.7 Lack of Independent Appraisals of Value
Government assay offices throughout much of Africa provide quite reliable certificates of gold purity, yetthey are lacking in Tanzania. This is urgently needed, as are reputable laboratories and consulting firmscapable ofestablishing the minimum value of mineral reserves at specific claims. The presence of suchinstitutions would go a long way to facilitate trading, reduce mistrust and lighten transaction costs.Moreover, financial institutions cannot be expected to lend to artisanal miners and traders until they havereliable independent appraisers of value for precious minerals.
64
5.8 Smuggling
Smuggling of precious minerals is very common in all major gold and gemstone centers, particularly inborder areas. Different routes are used by smugglers depending on the convenience, border contacts andthe size and value of the minerals. Except for a small portion which goes out through Zanzibar, lake zonegold generally goes directly across the border to the Kenyan town of Sirare.
Gems follow more varied routes:
~ Traveling by public transport across the border via Horohoro in Tanga Region involvesgemstones collected from Tanga, Morogoro and Southern regions;
The Taveta route in Kilimanjaro and Namanga border post in Arusha region are normally used bysmugglers who operate mainly in Arusha and Kilimanjaro Regions.
Parcels carried in the public transport usually have values between TSH. 300,000 to TSH. 1.5 million.The number of people involved varies from time to time. During the survey it was estimated between 2535 mineral smugglers passed through Tanga town every month to cross Horohoro by bus.
~ Private transport is used by experienced smugglers, who carry gemstone parcels valued atTSH.2.0 million and above. The cost of smuggling varies depending on the type ofassistancesmugglers have arranged at the border or how well they have hidden the gemstone parcel.
It was not possible to assess the number of people involved in this type of smuggling everymonth. It costs a smuggler US$300-US$400 to send a parcel to Nairobi from Arusha.
Minerals are also smuggled by small brokers traveling on foot, bicycles or pack animals on panyaroutes across the border. They generally carry gem parcels valued between TSH.50,000 andTSH.350,000.
5.8.1 Motives for Smuggling .
,Price and time are the key factors sellers take into account in choosing where to sell. Tanzanian sellersfind that in Kenya they have a better chance of making rapid sales in good conditions, provided byadequately capitalized dealers. As Nairobi has a bigger market with many dealers who have been inbusiness for decades, it provides sellers with certain advantages. They can sell their goods and obtaincash more quickly. They can sell medium-quality stones as well as top quality, whereas in Arushadealers buy a much smaller volume of stones that are top quality. Gold sellers find their accommodationspaid for by the buyer in Nairobi, while in Arusha they must pay their own costs. The Nairobi market alsohas more diverse and cheaper consumer goods, so traders can buy consumer goods with the proceedsfrom minerals sales and turn a cyclical profit on both. This, incidentally, increases the loss to theTanzanian GDP.
Nairobi is also closer to the northern mining areas than Dar es Salaam, and more accessible by road forminers/minerals brokers outside of Arusha. Other reasons for smuggling include fencing other stolengoods, financing imports, and tax evasion on exports and imports. Security during travel and selling is
65
also an issues of concern to sellers. According to the mining community's views, security is definitely notprovided by the "security forces." Miners and brokers who attempted to lega~ize their oper~t.ions
frequently complained that they were subject to as much or more harassment by the authorIties whenoperating legally as when not licensed. In established mining areas, the community develops informalmechanisms for ensuring security. In mine rush areas, on the other hand, problems include theft, armedrobbery and officials' taking part or all of one's goods. "
The main reasons cited by mining sector operators for the existence of smuggling are:
~ searching for better mineral markers and prices;~ avoiding official bureaucracy; .~ advantage of the presence of many foreign brokers in the mining areas;~ using the informal credit available to minerals operators; and~ low marketing costs.
Several dealers argued that the best way to increase mineral exports is for the government to review thepresent tax rates. Under-invoicing of gemstone prices is a form of smuggling where the parcel isexported officially but only a portion ofthe true"value is declared for tax assessment.
The presence ofa big number of foreign brokers in the mining areas also increases the chances of mineralsmuggling. Kenyan brokers dare not sell in Tanzania for fear of being disclosed to authorities bycompeting brokers. Also some brokers are only agents of foreign companies in Nairobi and Mombasa, sothey are required to send all the minerals purchased to their sponsors.
The presence of strong international illegal buyers in Tunduru believed to be developing a cartel· in 1995to early 1996 forced the government to intervene by issuing new trade regulations and banning foreigntraders' direct access to mining areas. Tanzanian dealers welcomed this protection from competition.Tanzanian miners and brokers, however, complained that they could sell better when they had moreaccess to international buyers.
Credit from informal sources often forces miners to sell part of their minerals product to creditors, someof whom are foreigners. This form of returning borrowed funds is unofficial. Some ofthe miningoperations, such as the underground mining ofTanzanite, are very costly to run, so miners elicit advancesfrom both local and foreign mineral dealers. Some mineral dealers also get financial support from othertraders and usually the interest is paid back in foreign currency. All these factors force some of themineral operators to smuggle minerals outside the country.
5.8.2 Why Kenyan dealers offer a better market
In Kenya,. there is no tax or VAT charged on exports; only 35% corporate tax on profits.Telecommunications are cheaper and more easily available. Roads are better to Nairobi. Mineral dealersthere have more capital and better international networks. They have accumulated capital over the years,
66

which makes them grow faster than their Tanzanian counterparts. The size of the market is larger andmore diverse, and mineral operators are more experienced. II
5.8.3 Nationality and smuggling
There seems to be a complex relationship between the nationality of traders and the economic impact ofsmuggling. The main determinant of whether a transaction helps Tanzania's GDP and current accountbalance or those of neighboring countries is where and in what currency the transaction takes place.Foreign gem dealers contributed to a substantially higher value-added from trading within Tanzania in1991-1995. The domestic market for gemstones has been depressed since the new regulations came out in1996. On the other hand, the greater capital base of foreign dealers made it possible for them to squeezeout Tanzanian dealers.
Tax compliance on the part of exporters is a more complex issue. At the broker level it has an impactmainly because Tanzanian brokers are more likely to be harassed by Kenyan police than Kenyan brokers.Many fear to travel there, although those who do are no more likely to pay Tanzanian export taxes thanKenyan brokers. None of the brokers pays taxes, with rare exceptions. Some dealers, on the other hand,pay some taxes. In the case of dealers, it seems to depend in the first instance on where the dealer'sprimary business interests are located.
Persons whose primary business interests are in Tanzania have the greatest incentive to pay taxes andconfonn to Tanzanian law. Persons whose primary business interests are in another country, on the otherhand, whether they themselves are of Tanzanian or foreign nationality, have a greater incentive to evadetaxes. In applying the 1996 regulations that set more difficult conditions for foreign dealers than fornationals, Tanzanian gem traders and the Ministry of Energy and Minerals took account of this factor. Bycommon consent, and with the support ofTanzanian dealers, several foreign nationals whose primarybusiness is located in Tanzania were exempted from the more difficult conditions and allowed to operateas Tanzanians. Foreign dealers not licensed to do business in Tanzania, however, rarely if ever payexport taxes.on their purchases.
Recently Tanzania, Kenya and Uganda got together and revived the idea of an East Africa with free tradeand potentially more complete economic cooperation. How Tanzania decides to deal with the problem offoreign brokers in minerals markets will depend in part on what is negotiated in this regional context.
11 See model in the box at the end ofChapter Four on "The Advantages ofDoingBusiness in Kenya: Comparative Model of Gem Dealer's Accounts."
67
6.1 General Recommendations
The most important policy consideration regarding artisanal mining is that liberalizing the sector has beena great success. Despite some delays and fluctuations in establishing a new policy and regulatory ,framework, the sector has grown at a rate unparalleled by any other sector in the economy. It has,moreover, generated employment and income on an unprecedented scale among the lowest incomeagricultural population in the least developed areas of the country. As the sector evolves, it will beimportant and difficult to ensure its continued vitality. There is a risk that, in the name of reform,measures may be taken that would jeopardize the continued operation of artisanal mining.
The government has, over the last year, laid down a progressive policy framework and developmentstrategy designed to promote continued growth in all forms of mining.12 It calls for a "transparent, streamlined and competitive legal and regulatory system to attract local and foreign investments in the mineralsector and encourage formal small-scale mining."13 It aims to'provide adequate incentives to foreigninvestors while maximizing government revenues and minimizing environmental damage. Most of thespecific policy recommendations currently under consideration would benefit all forms ofmining, fromformal, large-scale foreign investments to small-scale joint ventures and artisanal mining. Clearer claimboundaries, simpler procedures, the development of financial tools to facilitate mining investments, andthe provision of tax incentives will encourage all types ofminers.
Professional associations also need to playa more solid role. Riddled throughout the marketing system,raising transaction costs and participant anxiety, is a generalized problem of mistrust. Professionalassociations such as TAMIDA, the Chamber of Mines and FEMATA need to work with the governmentto consciously create an atmosphere oftrust. .
The following concrete steps are recommended:
• Attract more trade to Tanzania
Attracting more of the current trade to Tanzania should be a goal of the proposed marketing and fiscalreforms. Many policy-makers state the goal as "attracting the trade towards formal channels." The twocan be 'the same thing only if Tanzania eliminates its high transaction taxes, and adopts an incentivebased competitive legal and regulatory framework for marketing. Otherwise the two goals are incontradiction. Attempts to force the trade into legal channels in order to tax it, or to gain from theremaining foreign exchange rate differences, will actually continue to drive the trade out of Tanzania.
12
13
See The Mineral Sector Policy o/Tanzania (draft version, 12 February 1997);Ministry of Energy and Minerals, Mineral Sector Development Strategy (draft II,11 December 1996); and Proceedings o/the Workshop on Mineral SectorDevelopment Strategy, 13-15 November 1996 (working draft 04, 27 February1997).
The Mineral Sector Policy, section 4.2.2.
69
• Reverse the policy on smuggling
A major focus of this marketing study is the problem of smuggling. There are two possible responses tosmuggling. One is to enforce the law. The other is to change it. Tanzanian officials seem at present to becaught between the two. The recommendation ofthis study is that the best way to attract the trade to gothrough Tanzania is to change the law. The reasons are simple: .
(1) taxation and attempts to regulate exports are the main factor forcing the trade out throughKenya; and
(ii) it is impossible to enforce the law. Precious minerals are too easy to conceal. Like allhigh value/low volume products, they cannot be readily controlled across long, largelyun-monitored land and sea borders. .
• Remove fiscal and monetary disincentives
The main implications of the above recommendation would be in the fiscal area. The fiscal regime policyto mineral markets should aim:
• to increase government revenue;
• to attract new capital -- as investors invest and reinvest in mining and trading activities;and
• to improve the ratio ofofficial exports hence discouraging smuggling activities.
To achieve the above, there is need:
• to institute competitive and transparent tax arrangements. We believe that the greatestgrowth in the sector, and the greatest overall tax yield, would result from eliminating alltaxes and royalties on exports ofartisanal precious minerals production. This isessentially because neighbouring Kenya, which currently attracts the majority ofthetrade, imposes no taxes and facilitates the trade ofexporters instead of treating them assmugglers. To be competitive Tanzania would have to do the same thing. If it succeededand was able to attract a substantial portion of the trade into Tanzania, additional foreignexchange would be generated. The additional foreign exchange would be used topurchase imports. The tax revenues from imports would more than compensate theforgone revenue, which, in any case, is currently collected on only 5.0%-40% of preciousminerals.
• if the government opts not to test the zero export tax hypothesis, minerals taxes at exportneed to be consolidated and paid at a single point and the total tax burden must bereduced to a minimum. Mineral taxes should be competitive especially in comparison tothose applicable in neighbouring countries;
• to continue the recently enacted policy of zero tax on imports of mining, lapidary andheat treatment equipment.
70
• Remove remaining foreign exchange controls
The customs and commercial banks issue and approve export documents. The CD3 form forexports worth over $10,000 is used to restrict exporters from using the foreign exchangegenerated by their sales while they are overseas. They are ·allowed to use the FOREXeventually, but must first remit all export proceeds and exchange them at the cheque rate. Thenthey may exchange them back into FOREX, losing 2-10 percent overall. Once the right to usethe FOREX has been conceded, forcing dealers to lose money on the process is perceived as anunjust nuisance. It fosters noncompliance. Filing the CD3 form is rapid in itself, and dealersdid not complain about the filing. It probably would be wise to eliminate the repatriationrequirement and the cheque exchange rate, but keep the requirement to file the form.Internationally it has become the main means of identifying money laundering from other illicitactivities, which is always a possibility in precious minerals marketing.
In addition to the above two major policy areas, the government can do much to promote the orderlygrowth in the sector. Each of the main constraints needs to be addressed: lack of knowledge and currentmarket information; lack of capital; and cumbersome regulatory procedures.
6.2 Government Ministries
• Call for coordination
Coordination among government departments, as well as with representatives of mineral operators is veryimportant for the growth of the mineral trade. Road, power and telecommunications infrastructure, lawand order, and banking services, for example, are critical for the success of mining and depend on severaldifferent ministries.
Government departments should share information on the plans and records ofoperators in the areas ofinspection, taxes and other relevant issues. This will lower administration costs as well as reduce theunnecessary bureaucracy hampering mineral operations. The cost of poor coordination was noted in ameeting with brokers in Arusha where those with a license are as harassed by police as those without.The police refuse to recognize their licenses and sometimes arrest them without communicating with themines office. This practice has discouraged other brokers from securing licenses and hence, the deliveryof government revenue.
The Tanzania Revenue Authority, for example, should work closely with the Ministry of Energy andMinerals to streamline the revenue collection procedures. Tax assessment exercises should be clear tomineral operators and educational programmes should be carried in order to discourage informalpractices.
In Mwanza, two government officers working on separate departmental objectives drove out alllegitimate trade. The sales department of Tanzania Revenue Authority (TRA)was insisting on collecting30% of the gold purchased by gold dealers, a tax which is supposed to be paid by gold miners. The zonalmines office was reluctant to cooperate with the TRA on grounds that the exercise would discouragegovernment efforts to formalize the activities of the mineral traders. When the TRA representative triedto collect from dealers, they disappeared.
71
• Reform institutional support
A study ofthe institutional.aspects of mining was commissioned separately from this study. While thereport is· not yet official, it is likely to recommend reforms that would substantially enhance the ability ofthe precious minerals trade to function. It is clear that what is needed includes an increase in theministries' ability to administer the section: better working facilities; adequate budgets; well-trained staff;coordination among government departments; lower the administrative costs; improved law and order inmining areas and the protection of licenced miners, brokers and dealers;.an~ improved revenuecollection from a wider tax base.
• Create new regulatory institutions
New institutions are needed to support precious minerals marketing, chiefofwhich are a mineralsvaluation system and means of enforcing ethical conduct ofdealers. Thai, German and US dealersassociations have created either neutral certification services or central selling offices whose valuationsare trusted by buyers, sellers and bankers. Francophone African countries have government assaylaboratories which, for a modest fee, will provide an accurate appraisal of the purity ofgold for dealers,jewellers and even ordinary consumers. Even in countries where other institutions are corrupt, the assayoffices have remained strikingly reliable.
Gem valuation is more complex and technically demanding, as each raw stone· is unique. Options forimproving operations in this sector include either a dealer operated Central Selling Office or an officialMinerals Board would normally include representatives of the professional associations in the mineralssector as well as the relevant ministries. Having a reliable autonomous source of valuation would greatlyfacilitate the trade. It would speed sales and improve cooperation among those already·in the sector andcreate confidence among buyers. Tourists, in particular, are a logical market for Tanzanian stones, as theyhave been in Thailand. Many tourists in Tanzania hold back today because they have no way of knowingthe value of the materials being traded.
The government could also support the sector through training and promotional activities. This could bedone directly, such as the provision ofextension services to mineral operators in collaboration withdonors and interested NGOs on mineral identification and other market preparation activities and theestablishment of institutions or the introduction ofmineral market courses in existing institutions wherepresent operators can attend at a fee. It could also be done indirectly, by giving a tax credit to operatorsfor their investments in training, attending gem shows, using the internet and value-added activities.Government can also work with professional associations to provide better international mineral marketinformation and organize mineral markets at primary, secondary and export market levels at intervals andlocations agreed by the parties.
• Encourag~ fair competition
Fair competition in the mineral markets will help to increase the income of participants and stimulateproduction. Fair and unfair trade practices need to be defined in law, and enforced by both thegovernment and professional associations.
72
Competition in minerals markets is enhanced when there are many participants. There is a need for thegovernment to review the conditions for dealer licenses to enable more brokers to formalize theiractivities. The market arrangements should also be reviewed for the development of a true competitionamong the buyers.
• Improve security for legitimate operations
The services offered by.institutions like the police, customs, revenue and immigration departments areessential for the smooth growth of the mining sector. When police arrest illegal mineral brokers they helpthe government campaign for all operators to secure licenses and pay taxes. When the police harass thoseholding valid broker licenses, they end up increasing the number of people who will be dealing inminerals without licenses.
Lack of security in many mining areas, even the established ones like Merelani, has forced many mineraldealers to operate from their offices. It keeps miners from even entering their own claims. Any effort tocreate better mineral markets in the mining area should also address the issue of security.
Local safe vaults or bank branches with safe-deposit boxes are also badly needed. Miners and dealers atpresent have to ensure their own security. In the atmosphere ofgrandiose dreams and greed that prevails,this is difficult. Tanzania's tradition of peaceful cooperation and ethnic tolerance goes a long way toovercome this, but better institutions will keep it from being constantly put to the test.
• Conduct frequent inspections
The growth of the mineral trade has always being influenced by.the administrative role of governmentdepartments and the support given to mineral traders. It was observed that the procedures of claimallocation and the frequency of mine inspections influences the type of technology and productionorganization systems used by mine operators and hence the quality and volume of the gemstones, gold,and diamonds produced by small miners. In Umba Valley mining area, for example, workers invadeunattended gemstone claims and mine in an uncontrolled manner. Most of the minerals are sold to smallbrokers who smuggle them to Kenya.
These areas are those given to mining companies or individual owners who have failed to operate them.Regular mine inspections could have addressed this problem, as inactive mines revert to the state. But themine office doe& .not have sufficient operating funds to conduct regular mine inspections.Frequent inspections might also have mitigated the collapse of the Tanzanite market, which resulted fromthe allocation of hundreds of tiny plots and a scramble to produce. The size of mine plots at Block B,Merelani Tanzanite mine are only 50 ft x 50 ft. This was done in response to pressure to allocate the areato many applicants. At present, there is dangerous underground mining where several pits cross eachother in underground tunnels. Pit owners normally do not go under the pits for safety reasons and this hasresulted in the poor custody of recovered Tanzanites, which are stolen by workers and end up in brokers'hands. If minimal safety standards were enforced, the mining would have to slow some, and less of theminerals would leave the country.
• Enforce recording and diffuse market information
The present recording system of mineral purchases and exports does not allow easy data processing tomonitor the export trends of individual coloured stones, gold, and diamond. This information will enable
73

the Mineral Resources Department (MRD) staff to advise dealers and miners. No serious support tomineral trading was noted during the study. A few foreign buyers visiting the Ministry ofEnergy andMinerals are usually directed to dealers but there is no foreign market information, service or any trainingin gemology ever conducted or organized by MRD. New mineral dealers also complain the MRD wasnot in a position to advise them on how to start value-added activities or the choice ofequipment. Veryfew MRD staff' have gemological knowledge which limits the ability offield staff'to advise mineraloperators.
• Provide viable infrastructure
The Government has primary responsibility for the infrastructure, and this is a critically inadequate areafor Tanzanian mining development as well as for other investors. Roads are poor, and sometimesimpassable. Telecommunications facilities are inadequate and among the most expensive in the world.Electricity is inadequate and more costly than in neighbouring countries.
Support services such as banking and insurance are also weak. Lack of local banks and poor roadsexacerbate the security problems that plague miners and traders of precious minerals miners and traders.For lack ofviable legal export channels, shippers often cannot insure their shipments, thus extending therisk of theft throughout the entire marketing network.
• Simplify immigration procedures.
The Immigration Department can assist promotion of mineral markets by simplifying the procedure toget business visas to mineral buyers and resident permits to foreign investors and workers invalue-added activities. The department needs to be tough on illegal foreign mineral brokers presentlyoperating in mining areas. The government efforts to promote legal trade cannot be successful if thereare big numbers of foreign brokers in areas like the Merelani (Tanzanite) mine. The department canimprove its perfonnance if it works very closely with the Mines Department of the Ministry of Energyand Minerals and mining association leaders whose members are in a good position to know who is aforeigner and mineral buyer.
6.3 Financial Services
The capital available to artisanal miners and mineral market operators can be improved by: increasingthe present operators' incomes to allow them to save and invest; .fonnalizing the traditional fundingschemes; and giving financial institutions sound appraisal services to allow them to support the sector'sactivities. The needs of small scale miners for external sources of capital can be reduced if they can getfair prices for their mineral products from mineral brokers and dealers.
Joint ventures are currently the favoured means of overcoming the chronic problem of shortage ofcapital among small miners. This works for some of the people some of the time. It is not the onlysolution, however.
Two institutional innovations would greatly facilitate access to fonnal credit. One is the reliablevaluation service mentioned above. It is particularly a problem for gemstones. Many dealers andbrokers have considerable capital tied up in gemstone stocks. In well-developed mineral markets, localbanks are able to accept these as collateral because there are trustworthy appraisers.
74

The second institutional innovation that could facilitate access to credit is the establishment of neutralcredit bureaux. Tanzania, like many developing countries, has a long history of subsidized creditschemes and a corresponding plethora of banks with a high proportion of non-perfonning portfolios. Incontrast, in countries where fonnal lending schemes work, the two most important criteria for viablelending are:
(I) the borrower's history of repayment of previous loans; and
(ii) viable collateral. The new possibilities for collateral have been discussed above.
What would probably establish viable lending much faster is a computerized credit bureau. It need notdwell on past abuses, as subsidized credit tends not to be repaid anywhere in the world. The point of aneutral, computerized credit bureau is that it lets new borrowers establish a good payment historystarting from scratch. They first need to know the rules of the game; checking accounts must cover allchecks issued, and loans must be repaid punctually. All banking transactions of the individual for aspecified period of time (usually the last three years) must be declared to the credit bureau.
The credit bureau becomes a nationwide, possibly regional, repository ofcredit and bankinginformation on individual bo"owers. Borrowers can start with a small loan and repay it promptly. Theyare then eligible for a larger loan. As loans become really substantial, the habit oforderly repaymenthas become established.
6.4 Mineral Markets Promotion
The performance of minerals markets in Tanzania can be transformed by improving the knowledge ofparticipants, creating competitive markets, improving the services of supporting institutions and beingaggressive to penetrate into new mineral markets.
• Provide training
It is essential for the government, mining associations and donors to design and conduct trainingprogrammes for interested dealers, brokers and miners on the basic gemological knowledge of theminerals they are dealing with. Mining associations, with a little better effort, could be making marketinformation flow better in both directions. For a cost of less than $1,000 they could put a web page onthe internet, as do their Thai, Sri Lankan, European, North and South American colleagues. It shouldinclude information on active local dealers and their areas of specialization so that their colleaguesthroughout the world can contact them. A gem centre in Arusha, possibly with local branches, couldserve as a library, providing mining and mineral market information to operators at a modest fee.
• Develop upstream and downstream sectors
Policies that encourage voluntary moves into these areas are constructive; those that force it failbecause they force economic operators to allocate scarce resources to less viable uses. Policies thatwould do most to facilitate the development of value added in these areas include: .
~ communicating· information about opportunities, technology and training to interestedparties;
75

developing the infrastructure required to run a business, such as roads, power supplyand telephone lines, and reducing user costs on all these inputs;
~ creating a low, uniformly enforced, and predictable fiscal framework;· and
~ facilitating the development of skilled manpower.
At present, the gemstones of Tanzania are generally exported in rough form, in contrast to gold, whichis generally refined to at least 99% purity. Rough·gems fetch a lower price per weight, although thehigher volume of business makes this trade more profitable to most dealers than the export of cutstones. The degree to which minerals extracted are subjected to further processing and/or beneficiationis largely determined by the local capacity. Government has stressed commitments by dealers to engagein lapidary and other processing, without examining their technological and fmancial capacity to do so.
Not many participants in the sector have a basic knowledge of gemology. As a result, even simpleprocessing like lapidary and cutting is not adequately performed. There have been cases wherebycustomers are not satisfied with the standard of the stones cut locally so, as a means to avoid conflictwith customers, many traders would prefer to sell rough stones. Capital allocation is also a factor. Anoven for heating sapphire costs over US$200,OOO. With that much operating capital a dealer would beamong the most active in Tanzania. He could multiply his capital several times over by trading duringthe period it would take him to learn the art of heat treating and build a network of suppliers andbuyers.
6.5 Improve Socioeconomic Situation in Mining Communities
Enhancement of local authority structures and the implementation of community development plans willimprove living conditions in the mining areas. Health, education, banking, and police services aregenerally absent in mining communities. Bringing these new communities services available in othercommunities will also help formalize most economic activities in mining communities and henceincrease the number of tax payers. In order to sustain these changes, it is proposed that localcommunities have the authority to levy taxes. Some of the revenues should be earmarked forenvironmental restoration and improvement of community social services. It is critical that theenvironmental problems be addressed, and that local communities be fully implicated in the process.They are generally the only ones who know·when miners come and go, so'they are in the best positionto enforce collection of an environmental tax and to. implement safety measures to protect the localpopulation from explosives,. a scarred landscape and mercury pollution.
6.6 Balance the interests and activities of formal and artisanal mining
Efforts to ensure better mineral market should also involve the encouragement of balance in activities ofthe formal and artisanal mining. Technical criteria and zoned reservations need to be established asefficient mineral market will need continued opportunities for artisanal mining. Ghana has paved the wayin this area, creating rapid growth in both modem and artisanal mining over the last five years. Thelargest, richest deposits tend to be developed by modern mining companies. But many reefs are toonarrow to be economically exploited. When companies narrow their claims after the prospecting phase,reserves are created for artisanal miners. ·Even in the largest reefs, if they are close to the surface, the
76

first thirty metres could be reserved for artisanal miners. International mining companies would object, asthat is the most cost effective area for their mining as well. But international companies can and do takeover areas that have been artisanally mined for centuries, and make viable profits from the deeper levels.Such a policy would not keep them from investing in Tanzania.
In contrast to reef mining where formal companies will likely take first pick, alluvial deposits shouldgenerally be reserved for artisanal mining first.
77
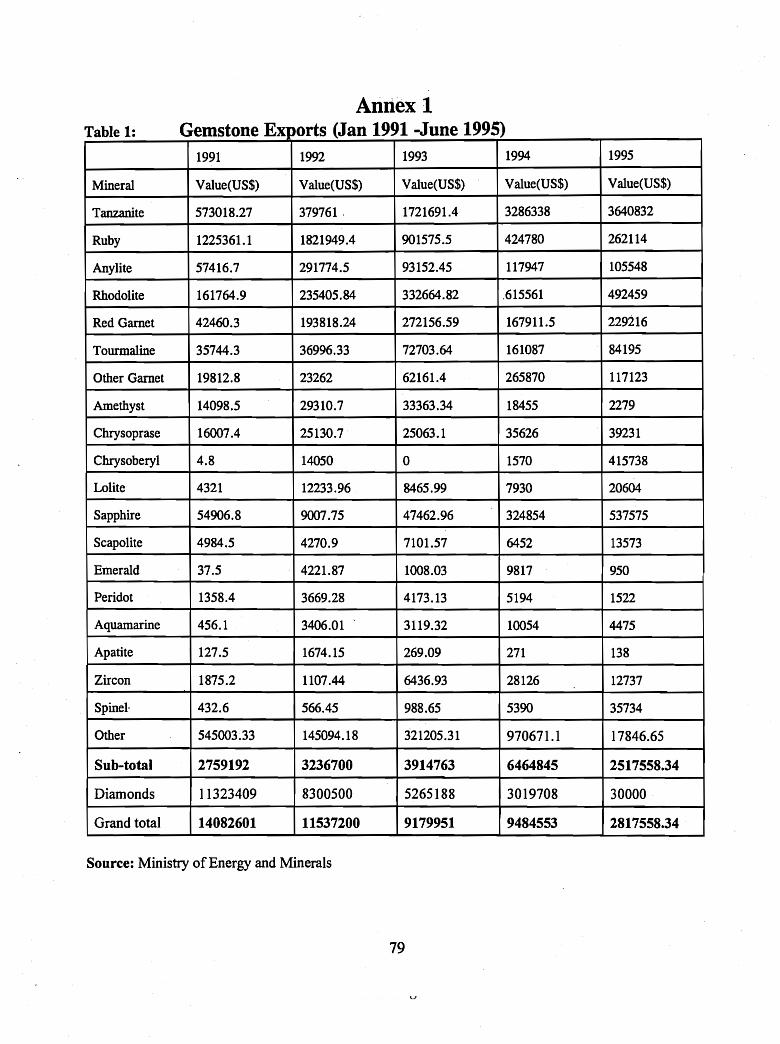
Table 1:
Annex 1Gemstone Exports (Jan 1991 -June 1995)
1991 1992 1993 1994 1995
Mineral Value(US$) Value(US$) Value(US$) Value(US$) Value(US$)
Tanzanite 573018.27 379761 ' 1721691.4 3286338 3640832
Ruby 1225361.1 1821949.4 901575.5 424780 262114
Anylite 57416.7 291774.5 93152.45 117947 105548
Rhodolite 161764.9 235405.84 332664.82 .615561 492459
Red Garnet 42460.3 193818.24 272156.59 167911.5 229216
Tourmaline 35744.3 36996.33 72703.64 161087 84195
Other Garnet 19812.8 23262 62161.4 265870 117123
Amethyst 14098.5 29310.7 33363.34 18455 2279
Chrysoprase 16007.4 25130.7 25063.1 35626 39231
Chrysoberyl 4.8 14050 0 1570 415738
Lolite 4321 12233.96 8465.99 7930 20604
Sapphire 54906.8 9007.75 47462.96 324854 537575
Scapolite 4984.5 4270.9 7101.57 6452 13573
Emerald 37.5 4221.87 1008.03 9817 950
Peridot 1358.4 3669.28 4173.13 5194 1522
Aquamarine 456.1 3406.01 . 3119.32 10054 4475
Apatite 127.5 1674.15 269.09 271 138
Zircon 1875.2 1107.44 6436.93 28126 12737
Spinel- 432.6 566.45 988.65 5390 35734
Other 54500333 145094.18 321205.31 970671.1 17846.65
Sub-total 2759192 3236700 3914763 6464845 2517558.34
Diamonds 11323409 8300500 5265188 3019708 30000 .
Grand total 14082601 11537200 9179951 9484553 2817558.34
Source: Ministry ofEnergy and Minerals
79

ANNEX 2
The Tucson 1997 Report
The Tucson Gem and Mineral Shows have been an annual event for over 30 years, and over that time, havegrown tremendously. While it started as a mineral show, Tucson became a significant gem market about 15years ago, and largely due to the AGTA (American Gem Trade Association) show, has become one ofthelargest, most important gem markets in the world today. Lasting over two weeks, the size and scope oftheTucson Gem Shows are almost impossible to comprehend. This year, to try to put the magnitude andimportance in perspective, there were no fewer than 19 different gem shows, each at a different site and eachwith at least 100 dealers represented. This means that during the first part ofFebruary, no fewer than 1,900dealers from virtually all the gem centers ofthe world were in Tucson, Arizona. The number is really muchhigher since some shows have significantly more than 100 dealers.
The largest and most important of the various shows, is still, without a doubt, the AGTA Show held at theTucson Convention Center. The AGTA Show was a particularly important show in 1997. It is always anexcellent barometer for the availability and demand for any gem species, but this year, especially forTanzanite. There were over 230 dealer exhibitors in the AGTA Gem Fair '97 from virtually every comer ofthe world, with the dominant centers represented being New York, Israel, India and Bangkok. AGTA andother show guides are included with this report.
One ofthe most important aspects ofgoing to the AGTA Show is to get a feeling ofwhat is new in the gemworld, and to get a feeling for relative availability. Any new discoveries, natural or synthetic, generally firstshow up in Tucson. This year, for instance, the new Tanzanite simulant made from quartz, was particularlysignificant.
Tanzanite was the dominant gemstone at the AGTA GemFair '97. There was far more of it, and at cheaperprices, than ever before. This was especially true for calibrated goods from Asia. The question ofwhy wasthe major point of discussion at the show. There seems to be no single reason for the current glut ofTanzanite. Among those theories offered were, however:
1. Mosha's (an Israeli claim holder) loss of control of Block "B" at Merelani. Apparently, after theowner lost control, this rich and relatively shallow area of the deposit was first divided up amongMosha's sons, each getting 100 meter x 100 meter sub-blocks. The remainder of Block "B" wasoffered as 10 meter x 10 meter sub-blocks to independent miners who ravaged the Block, producinghuge amounts of rough Tanzanite in a short period of time.
2. The Government freeze of gem dealing by Tanzanians from 28 January - 1 April 1996 opened up ahuge black market for rough minerals to be smuggled out to Nairobi, Kenya where they were thensent to India, Israel, Bangkok and the United States for cutting. There was little or no export controlin Tanzania for rough gem material. This timing coincided with the peak of production byindependents in Block "B".
3. The relative crash of a previously hungry Japanese Tanzanite market shifted Indian dealers' focusto New York in search for buyers.
81

4. Huge amounts of rough being cut into calibrated goods resulted in huge stockpiles, particularlyamong Indian dealers. With the very high interest rate that they pay on funds used to purchaseinventory, these goods had to be sold very quickly.
A result ofall ofthe above is now the commonplace offering of5,000-8,000 carat parcels in New York foras low as US$80.00/carat for mixed parcels. It is doubtful that prices this low could be obtained in Arusha.Everyone seems to be dumping their stocks. Prices on calibrated goods have dropped 30-70% in the pastyear. 14
Very fme, well-cut Tanzanite over five carats in weight seems to still be relatively rare and maintainingrelatively stable prices. The problem voiced by several suppliers, however, is that the average jeweler reallydid not differentiate much between the cheap, lower quality grades, and the larger, finer stones. This couldresult in the American market viewing Tanzanite as a very inexpensive stone, and, if not set properly, withrelatively low durability. One major outlet for the Tanzanite has been the Home Shopping Network ontelevision where Tanzanite has been set in rings and bracelets with little concern for the relative softness ofthe material. Once people realize the risks of improperly mounted Tanzanite, the reputation ofthe materialcould be dramatically marred and would be dangerous to the future of the Tanzanite market.
14 Personal communication, Doug Parker, Kuhn and Co.
82

Tanzanite Prices
The prices for Tanzanite as reported for the past five years in Jeweler's Circular Keystone, an important trademagazine, are shown in Table I and will be discussed below. Figures for finer quality Tanzanite were notavailable, although it is well known that since its discovery in 1968, the price has fluctuated dramatically.In 1970, the first Tanzanites were sold by a Los Angeles dealer, Martin Ehrman for $15.00/carat. WithTiffany's promotion of Tanzanite, the price rose to $100.00/carat by 1972, and to $300.00 to $400.00/caratin the Mid-Seventies. By 1980, large important stones were going for as high as $2000.00/carat. In the1980's Tanzanite almost disappeared until its revival in the late 1980's. At that time, fine stones at Tucsonwere bringing $600-$800/carat. Since 1991, there has been over a 10% per year decrease in the price offinegoods averaged over time. This year, the finest stones could be obtained for between $200 and $300/carat.At least one very fine 10 carat Tanzanite sold for$175.00/carat, an~ a 45 carat stone sold for about$150.00/carat.
Another significant market that should be noted opened up this year at Tucson, and that is the market for fine,undamaged crystals of Tanzanite. There were more for sale than ever before; obviously, the result of thehuge amounts ofrough being smuggled out. I was shown one crystal, weight approximately 3500 carats, andthe German dealer who had the piece was asking $200/carat assuming a 20% recovery or $170,000.00.About a dozen crystals were seen in the $25,000 to $75,000 range and literally dozens in the $5,000 or lessrange. A major market could develop for fine crystals with little cutting value if they could be recoveredwithout damage. The slightest "ding" can bring the value of a crystal down by over 50%. There was aGerman group, known by the name Bora Gems in the main Tucson Gem and Mineral Show that was held inthe Convention Center from February 13-16. This group had a significant number of crystals and a largeamount of rough, tumbled, and cabochon stones for sale. They claimed to be mining in Block "B". BoraGems was offering cabochon rough, tumbled Tanzanite and facet rough to the trade. Top quality cabochonrough in less than 100 gram lots were being offered at $5.60/gram; tumbled Tanzanite in 100 gram or lesslots were $8.40/gram for the finest grade; and facet rough in 1 gram (5 cart) sizes were $100/gram for thefinest quality. Assuming a 20% yield on the facet rough, this would suggest a cost of$1 OO/carat to the cutterfor a one carat Tanzanite of the finest grade (see Attachment A).
Table I extracted from Jeweler's Circular Keystone shows the prices for both good and fine 1carat Tanzanitesholding steady between 1990 and 1992, at between $120 and $240/carat. In 1993, both grades dropped inprice significantly to as low as $60/carat for good stones to $1 00 to $160/carat for fine stones. The price forgood quality stones stayed in this range, rising only from $100 to $125/carat for the top price for good stones
. between 1993 and 1996. During this same period, fine stones dropped from $180/carat to $240/carat in 1992,to $100 to $160/carat in 1993. The top end price for fine goods recovered in the next three years to$220/carat in 1996. It is important to note that these reported prices are the prices that retail jewelers paidto wholesalers for single stones.
The prices for larger than 1 carat stones in good to fine qualities are not recorded by JCK. However,generally speaking, the price ofa fine 5 carat or larger Tanzanite dropped from about $600 to $800/carat in1992, to $400 to $600/carat in 1993, and dropped at a rate ofabout $50/carat for the years between 1994 and1996. The "Tanzanite Work Sheet" provided by Gemtech International Corp (Attachment B) reported pricesfor "super" stones to be about $350/carat and fine stones at #$300/carat. They also reported a price of$235/carat for 1.3 carat fine rounds in January 1997 (Attachment C).
The prices observed at GemFair '97 indicated a significant drop in price for good to fine Tanzanites of allsizes. As noted above, the finest quality Tanzanites at the show could be obtained for less than $225/carat
83
and perhaps as low as $150/carat for significant stones. Calibrated stones under a carat could be purchasedfor as little as $50.00/carat.
Quality of cut is a major factor. The African cut stones tend to be cut to retain weight,at the expense ofbeauty and cost significantly less per carat. Generally, African cut stones need to be re-cut at a significantloss in weight. Stones cut in Germany and the u.S. seem to be very well cut, and are holding their value.
There is no duty of gem rough coming into the u.S. and the cut material falls under the protection ofPreferred Nation Status. If there is an export duty in Tanzanite leaving Tanzania, it is unimportant sincealmost all of the rough is being smuggled out. One dealer at the 'AGTA Show who does cut a great deal ofTanzanite rough in the u.S. stated that it costs him about $700.00 to bring out $100,000.00 in rough. It wasunclear whether this was official export with very low valuation on the rough, or bribes to officials. Thereis no way to estimate the amount ofrough leaving Tanzania, but it is obviously a huge amount over the pastyear.
84

Other East African Gemstonesat Tucson
East Africa is just beginning to realize its importance in the world gem markets. At Tucson, it was obviousthat Tanzanite has become a staple ofthe gem markets along with ruby, emerald, and sapphire as shown inmarketing pieces. Other gemstones were also in abundance. Rhodolite garnet was being offered insignificant amounts and the price of$45.00 per carat seems to be holding for average stones. Rhodolites foras low as $15.OO/carat and as high as $165.OO/carat were also observed. The Alexandrites for $2000.00/caratand cats eye chrysoberyl from Tunduru were not as abundant as last year, but were very popular. OtherTanzanian gemstonesobserved were very fine scapolites from Morogoro for $17.OO/caratand "mocha" zirconfor $15.OO/carat. Tsavorite, while popular, was present in relatively small amounts, with top 2-3 carat stonesbringing $1200-1500/carat.
85

Dealer's Comments
Dealers claim that they can choose from mixed parcels up to 5,000 carats in size for as little as $85/carat.These are good commercial stones for a middle man. Somewhere, it is felt, the middle man is getting thematerial. for about·$60/carat in order to sell it to the wholesaler for $85/carat. These. are goods that anaverage jeweler could sell well. They are having problems selling the 5,000 carat lots, so now breaking upinto smaller parcels by size and by color grade. It was reported that even the rough in Arusha is not beingsold in huge mixed lots, but rather is now color graded· into segregated lots. It was generally felt that thesuggested $60/carat price for the middle man, presumably in Asia, is lower than what they would be offeredfor in Arusha, Tanzania.
The general feeling was that the finer quality stones will be stable in price at $200-$300/carat and the poorercommercial stones could, at least temporarily, drop significantly, to 1972 levels of$1 OO/carat for 3 carat andabove stones.
There was generally a feeling of frustration at the huge supplies at unstable prices among the dealers inTucson. Everyone knows that the Merelani deposit is very limitedand should supplies cease for any reason,the commercial market could evaporate as it did in 1972 when Tiffany's lost access, and, therefore, droppedmarketing ofthe material. Ifhowever, any gem deposit in the world could be secured, it would be Merelanidue to its small size. The independent miner, however, probably would not be part of the equation.Government corruption must also be set aside. Last year, on 28 January 1996, the government forbade theTanzanians to deal in gemstones. At the same time, independent miners took over the shallow workings ofBlock "B" and produced huge amounts of material. Foreign buyers illicitly purchased. this production atblack market prices and smuggled material out. It wasn't until April 1, 1996, that Tanzanians could againdealand the situation rectified itself somewhat. If the Merelani deposit could be secured and access tightlycontrolled, the Tanzanian government would have the opportunity to develop Tanzanite as a very importantgemstone. By securing the deposit and open-pit mining using legitimate mining companies, the governmentcould control the supply, not unlike what DeBeers has done with the Diamond Producers Organization andDiamond Corp. where all production is sent to the CSO for sorting and distribution. On the other side oftheequation, the government must help develop the demand for Tanzanite by international advertising andmarketing. In doing so, it would be controlling both the supply and demand for Tanzanite and insure itsmarket stability as long as supplies last. No one has ever estimated the resources ofthis very limited and veryunique deposit.
86
Conclusions to Annex 2
The AGTA 1997 Show Guide has on page 54 a promotion ofTanzanite as "a fashion-forward stone forcustomers who crave something different". The AGTA GemFair '97 was larger and more elaborate thanever with over 230 dealers from all over the world. It is, and since its inception, has been, a key indicatorofgem market trends, prices, new materials, new synthetics and treatments, and availability. This year,the most significant observation was the incredibly rich supply of Tanzanite and the aggressive marketingby suppliers to help sell Tanzanite. For the first time since its discovery in 1968, Tanzanite was one ofthe most common gemstones in the show and it was readily being promoted along side of ruby, sapphire,and emerald as a "staple" of the business.
Ofthe approximately 230 dealers in the GemFair, about 25 had inventories ofTanzanite at the showexceeding 1,000 carats. One dealer, named Heskia, boasted over 10,000 carats in his inventory with avalue of over $2,000,000.00 Another, Bill Barker, estimated that he had 4,000 carats at the show. Giventhese numbers, if we attempt to estimate the total number of carats at the AGTA GemFair '97, we wouldhave to say that a very conservative estimate would be 25 dealers times 1,000 carats each or at least25,000 carats of Tanzanite. One very important new product that was offered at the Gem Fair was a verybelievable Tanzanite stimulant made of artificially colored quartz (See Gems and Gemology). This willundoubtedly show up in places like Nairobi, Arusha and Dar, and be very attractive, especially tounsuspecting tourists.
87

ANNEX 3Gem Dealer in Arusha
89

Gem Dealer in Arusha
1.0 Executive Summary
Arusha
Business Plan Highlights
$500,000
$400,000
$300,000
$200,000
$100,000
$0
$-100,000'----------'------'-------"
El Sales
bI Gross margin
Q Net Profit·
5.2.1 Sales Forecast
1995 1996 1997
Total Sales by Month in Year 1
$25,000
$20,000
$15,000
$10,000
$5,000
$0'----------'_---1...-------'_---1...-------'_---1...-------'_---1...-------'-----'---'-----'"
Jan Feb Mar Apr May Jun Jul Aug Sep Oct Nov Dec
Page 1

Gem Dealer in Arusha
Table 5.2.1: Sales Forecast
Sales 1995 1996 1997Ruby Cabochon, kg rough $47,424 $56,909 $113,818Ruby gem, gm cut to karats $36,000 $43,200 $86,400Almondite gamet, kg rough 1st qual $36,000 $43,200 $86,400Green tourmaline, gem 1gm size $9,600 $11,520 $23,040Tanzanite, col. A, cut >1 k $18,000 $10,000 $25,000Tanzanite col A, gm rough $67,200 $30,000 $32,000Rhodololite gamet, gm rough $7,200 $8,640 $17,280Sapphire, 1st qual, 1 gm size $18,000 $21,600 $43,200Sapphire, parcel mixed, 2nd qual $24,000 $28,800 $57,600Other $0 $0 $0Total Sales $263,424 $253,869 $484,738
Cost of sales 1995 1996 1997Ruby Cabochon, kg rough $23,712 $28,454 $56,908Ruby gem, gm cut to karats $12,000 $14,400 $28,800Almondite garnet, kg rough 1st qual $21,000 $25,200 $50,400Green tourmaline, gem 1gm size $2,796 $3,355 $6,710Tanzanite, col. A, cut >1k $4,800 $5,760 $12,500Tanzanite col A, gm rough $24,000 $28,800 $25,000Rhodololite garnet, gm rough $3,600 $4,320 $8,640Sapphire, 1st qual, 1 gm size $6,000 $7,200 $14,400Sapphire, parcel mixed, 2nd qual $12,000 $14,400 $28,800Other $0 $0 $0Subtotal Cost of Sales $109,908 $131,889 $232,158
6.4 Personnel Plan
Table 6.4: Personnel Plan
Job titleDealersBuyers, staff and guardsCutterOtherSubtotal
7.0 Financial Plan
7.1 Important Assumptions
Table 7.1: General Assumptions
1995$20,004$12,000$9,996
$0$42,000
1996$25,000$14,000$11,000
$0$50,000
1997$30,000$18,000$12,000
$0$60,000
1995 1996 1997Short Term Interest Rate 39.00% 30.00% 25.00%Long Term Interest Rate 35.00% 28.00% 22.00%Payment days 1 1 1Inventory Turnover 4 4.00 4.00Tax Rate Percent 35.00% 35.00% 35.00%Expenses in cash% 100.00% 100.00% 100.00%Sales on credit 75.00% 75.00% 75.00%Personnel Burden % 15.00% 15.00% 15.00%Note: Ratios in assumptions are used as estimators and may therefore have different values than ratios calculated in the
ratios section.
Page 2
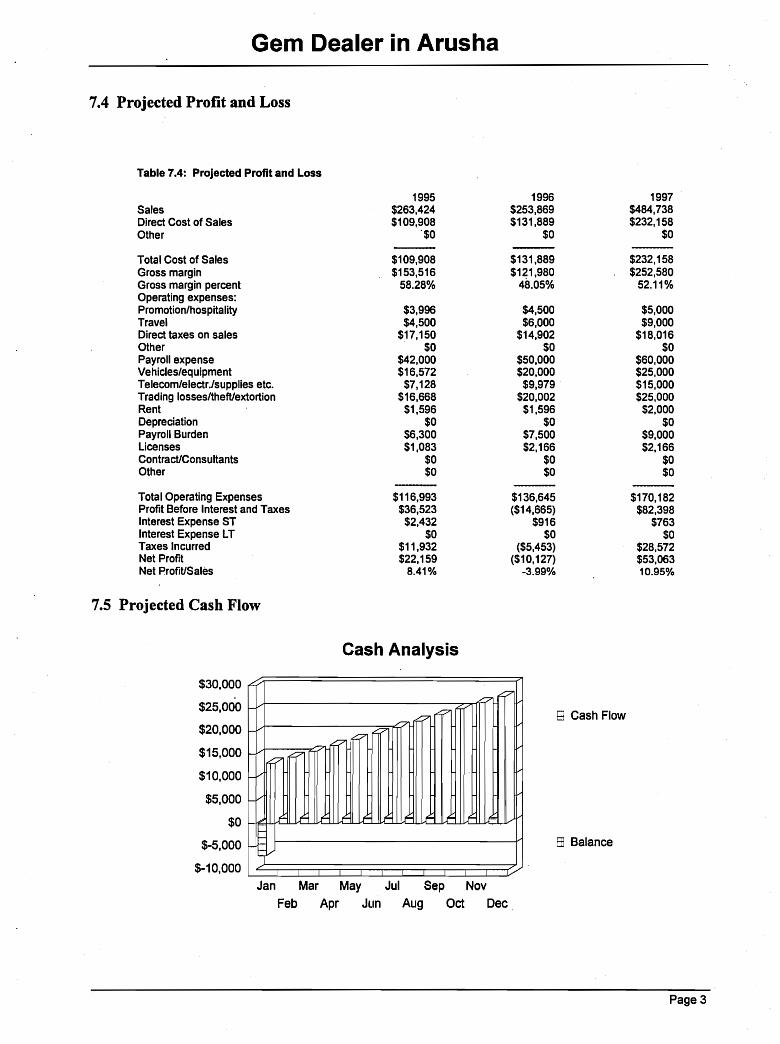
Gem Dealer in Arusha
7.4 Projected Profit and Loss
Table 7.4: Projected Profit and Loss
1995 1996 1997Sales $263,424 $253,869 $484,738Direct Cost of Sales $109,908 $131,889 $232,158Other '$0 $0 $0
Total Cost of Sales $109,908 $131,889 $232,158Gross margin $153,516 $1~1,980 $252,580Gross margin percent 58.28% 48.05% 52.11%Operating expenses:Promotion/hospitality $3,996 $4,500 $5,000Travel $4,500 $6,000 $9,000Direct taxes on sales $17,150 $14,902 $18,016Other $0 $0 $0Payroll expense $42,000 $50,000 $60,000Vehicles/equipment $16,572 $20,000 $25,000Telecom/electr.lsupplies etc. $7,128 $9,979 $15,000Trading losses/theft/extortion $16,668 $20,002 $25,000Rent $1,596 $1,596 $2,000Depreciation $0 $0 $0Payroll Burden $6,300 $7,500 $9,000Licenses $1,083 $2,166 $2,166Contract/Consultants $0 $0 $0Other $0 $0 $0
Total Operating Expenses $116,993 $136,645 $170,182Profit Before Interest and Taxes $36,523 ($14,665) $82,398Interest Expense ST $2,432 $916 $763Interest Expense LT $0 $0 $0Taxes Incurred $11,932 ($5,453) $28,572Net Profit $22,159 ($10,127) $53,063Net ProfiUSales 8.41% -3.99% 10.95%
7.5 Projected Cash Flow
Cash Analysis
$30,000
$25,000
$20,000
$15,000
$10,000
$5,000
$0
$-5,000
$-10,000
,.,:::;
/7'7
f-oP
"'7 /'f-/ 0,,::.7
,--, -:::;:::'/'
t-/ -:::;:::,c:7
f-/
,...V
r r f Lf f f f f f 11 ,1 ./
~~v::/"
8 Cash Flow
EE Balance
Jan
FebMar May
Apr JLln
Jul Sep Nov
Aug Oct Dec
Page 3

Gem Dealer in Arusha
Table 7.5: Projected Cash Flow
1995 1996 1997Net Profit: $22,159 ($10,127) $53,063Plus:Depreciation $0 $0 $0Change in Accounts Payable $0 $0 $0Current Borrowing (repayment) ($6,948)Increase (decrease) Other Liabilities $0 $0 $0Long-term Borrowing (repayment) $0 $0 $0Capital Input $0 $0 $0
Subtotal $15,211 ($10,127) $53,063Less: 1995 1996 1997Change in Accounts Receivable ($10,000) $0 $0Change in Inventory $17,477 $5,495 $25,067Change in Other ST Assets $0 $0 $0Capital Expenditure $0 $0 $0Dividends $0 $0 $0
Subtotal $7,477 $5,495 $25,067Net Cash Flow $7,734 ($15,623) $27,996Cash balance $27,734 $12,111 $40,107
7.6 Projected Balance Sheet
Table 7.6: Projected Balance Sheet
1995 1996 1997Short-term AssetsCash $27,734 $12,111 $40,107Accounts receivable $0 $0 $0Inventory $27,477 $32,972 $58,040Other Short-term Assets $0 $0 $0Total Short-term Assets $55,211 $45,084 $98,146Long-term AssetsCapital Assets $0 $0 $0Accumulated Depreciation $0 $0 $0Total Long-term Assets $0 $0 $0
Total Assets $55,211 $45,084 $98,146
Debt and Equity1995 1996 1997
Accounts Payable $0 $0 $0Short-term Notes $3,052 $3,052 $3,052Other ST Liabilities $0 $0 $0SUbtotal Short-term Liabilities $3,052 $3,052 $3,052
Long-term Liabilities $0 $0 $0Total Liabilities $3,052 $3,052 $3,052
Paid in Capital $8,333 $8,333 $8,333Retained Earnings $21,667 $43,826 $33,699Earnings $22,159 ($10,127) $53,063Total Equity $52,159 $42,032 $95,094Total Debt and Equity $55,211 $45,084 $98,146Net Worth $52,159 $42,032 $95,094
Page 4
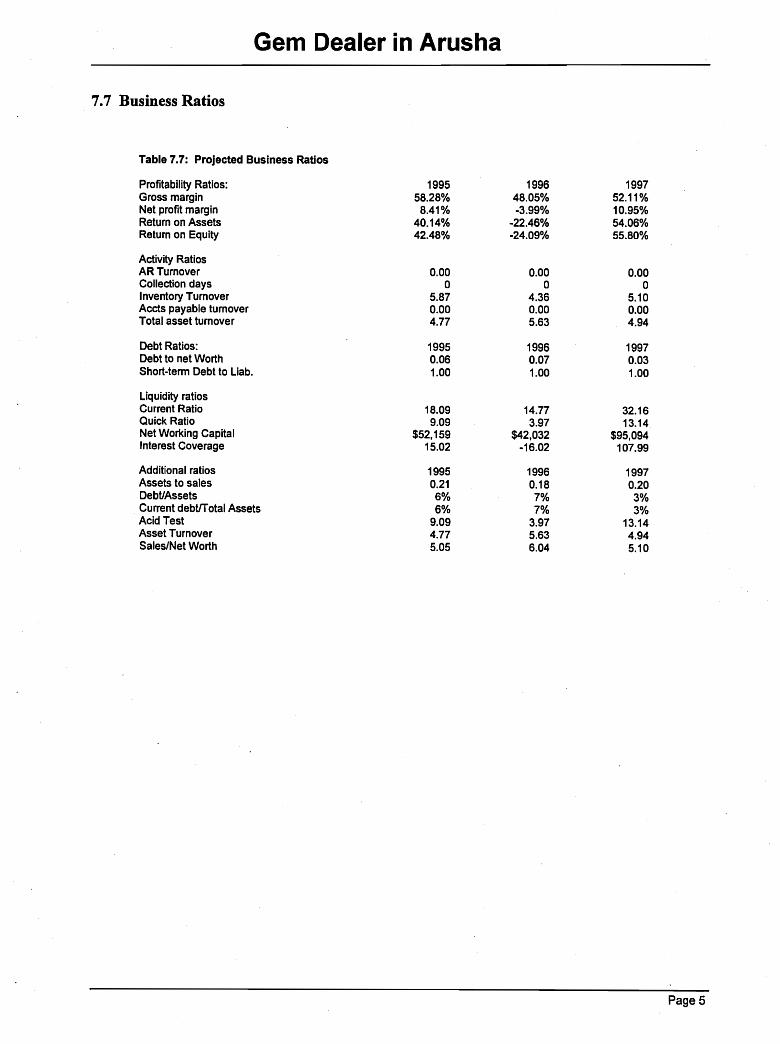
7.7 Business Ratios
Gem Dealer in Arusha
Table 7.7: Projected Business Ratios
Profitability Ratios: 1995 1996 1997Gross margin 58.28% 48.05% 52.11%Net profit margin 8.41% -3.99% 10.95%Return on Assets 40.14% -22.46% 54.06%Return on Equity 42.48% -24.09% 55.80%
Activity RatiosAR Turnover 0.00 0.00 0.00Collection days 0 0 0Inventory Turnover 5.87 4.36 5.10Accts payable turnover 0.00 0.00 0.00Total asset turnover 4.77 5.63 4.94
Debt Ratios: 1995 1996 1997Debt to net Worth 0.06 0.07 0.03Short-term Debt to Liab. 1.00 1.00 1.00
liqUidity ratiosCurrent Ratio 18.09 14.77 32.16Quick Ratio 9.09 3.97 13.14Net Working Capital $52,159 $42,032 $95,094Interest Coverage 15.02 -16.02 107.99
Additional ratios 1995 1996 1997Assets to sales 0.21 0.18 0.20Debt/Assets 6% 7% 3%Current debtfTotal Assets 6% 7% 3%Acid Test 9.09 3.97 13.14Asset Turnover 4.77 5.63 4.94Sales/Net Worth 5.05 6.04 5.10
PageS
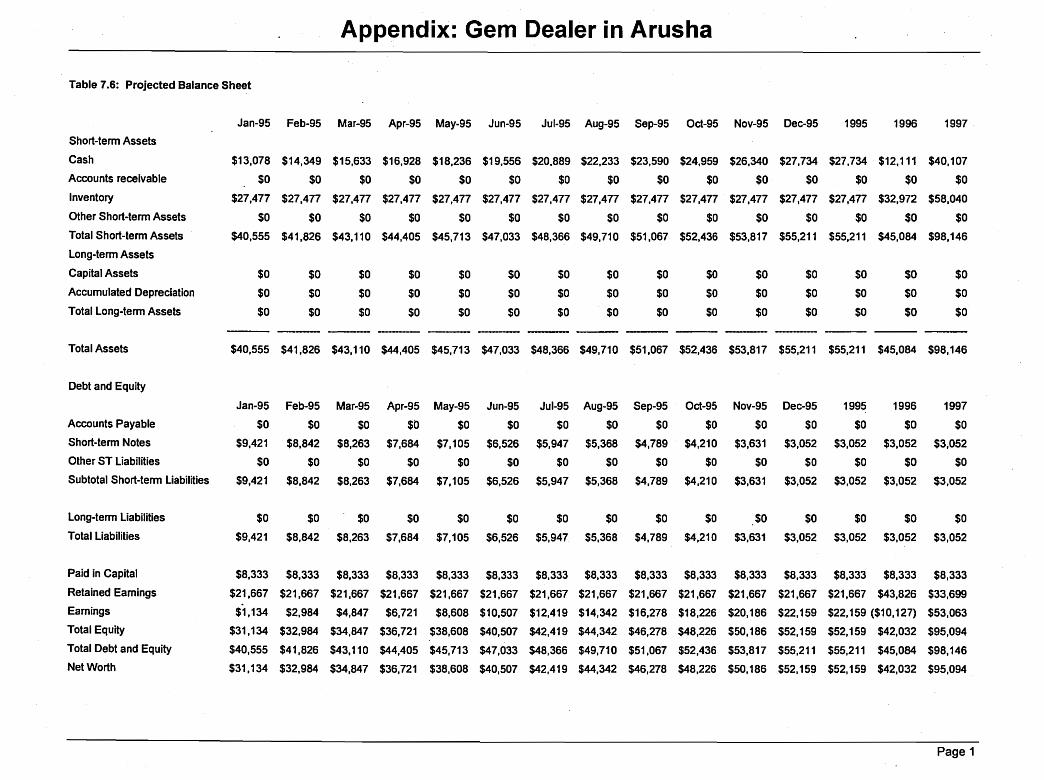
Appendix: Gem Dealer in Arusha
Table 7.6: Projected Balance Sheet
Jan-95 Feb-95 Mar-95 Apr-95 May-95 Jun-95 Jul-95 Aug-95 Sep-95 Oct-95 Nov-95 Dec-95 1995 1996 1997
Short-term Assets
Cash $13,078 $14,349 $15,633 $16,928 $18,236 $19,556 $20,889 $22,233 $23,590 $24,959 $26,340 $27,734 $27,734 $12,111 $40,107
Accounts receivable $0 $0 $0 $0 $0 $0 $0 $0 $0 $0 $0 $0 $0 $0 $0
Inventory $27,477 $27,477 $27,477 $27,477 $27,477 $27,477 $27,477 $27,477 $27,477 $27,477 $27,477 $27,477 $27,477 $32,972 $58,040
Other Short-term Assets $0 $0 $0 $0 $0 $0 $0 $0 $0 $0 $0 $0 $0 $0 $0
Total Short-term Assets $40,555 $41,826 $43,110 $44,405 $45,713 $47,033 $48,366 $49,710 $51,067 $52,436 $53,817 $55,211 $55,211 $45,084 $98,146
Long-term Assets
Capital Assets $0 $0 $0 $0 $0 $0 $0 $0 $0 $0 $0 $0 $0 $0 $0
Accumulated Depreciation $0 $0 $0 $0 $0 $0 $0 $0 $0 $0 $0 $0 $0 $0 $0
Total Long-term Assets $0 $0 $0 $0 $0 $0 $0 $0 $0 $0 $0 $0 $0 $0 $0
Total Assets $40,555 $41,826 $43,110 $44,405 $45,713 $47,033 $48,366 $49,710 $51,067 $52,436 $53,817 $55,211 $55,211 $45,084 $98,146
Debt and Equity
Jan-95 Feb-95 Mar-95 Apr-95 May-95 Jun-95 Jul-95 Aug-95 Sep-95 Oct-95 Nov-95 Dec-95 1995 1996 1997
Accounts Payable $0 $0 $0 $0 $0 $0 $0 $0 $0 $0 $0 $0 $0 $0 $0
Short-term Notes $9,421 $8,842 $8,263 $7,684 $7,105 $6,526 $5,947 $5,368 $4,789 $4,210 $3,631 $3,052 $3,052 $3,052 $3,052
Other ST Liabilities $0 $0 $0 $0 $0 $0 $0 $0 $0 $0 $0 $0 $0 $0 $0
Subtotal Short-term Liabilities $9,421 $8,842 $8,263 $7,684 $7,105 $6,526 $5,947 $5,368 $4,789 $4,210 $3,631 $3,052 $3,052 $3,052 $3,052
Long-term Liabilities $0 $0 $0 $0 $0 $0 $0 $0 $0 $0 $0 $0 $0 $0 $0
Total Liabilities $9,421 $8,842 $8,263 $7,684 $7,105 $6,526 $5,947 $5,368 $4,789 $4,210 $3,631 $3,052 $3,052 $3,052 $3,052
Paid in Capital $8,333 $8,333 $8,333 $8,333 $8,333 $8,333 $8,333 $8,333 $8,333 $8,333 $8,333 $8,333 $8,333 $8,333 $8,333
Retained Earnings $21,667 $21,667 $21,667 $21,667 $21,667 $21,667 $21,667 $21,667 $21,667 $21,667 $21,667 $21,667 $21,667 $43,826 $33,699
Earnings $1,134 $2,984 $4,847 $6,721 $8,608 $10,507 $12,419 $14,342 $16,278 $18,226 $20,186 $22,159 $22,159 ($10,127) $53,063
Total EqUity $31,134 $32,984 $34,847 $36,721 $38,608 $40,507 $42,419 $44,342 $46,278 $48,226 $50,186 $52,159 $52,159 $42,032 $95,094
Total Debt and Equity $40,555 $41,826 $43,110 $44,405 $45,713 $47,033 $48,366 $49,710 $51,067 $52,436 $53,817 $55,211 $55,211 $45,084 $98,146
Net Worth $31,134 $32,984 $34,847 $36,721 $38,608 $40,507 $42,419 $44,342 $46,278 $48,226 $50,186 $52,159 $52,159 $42,032 $95,094
Page 1
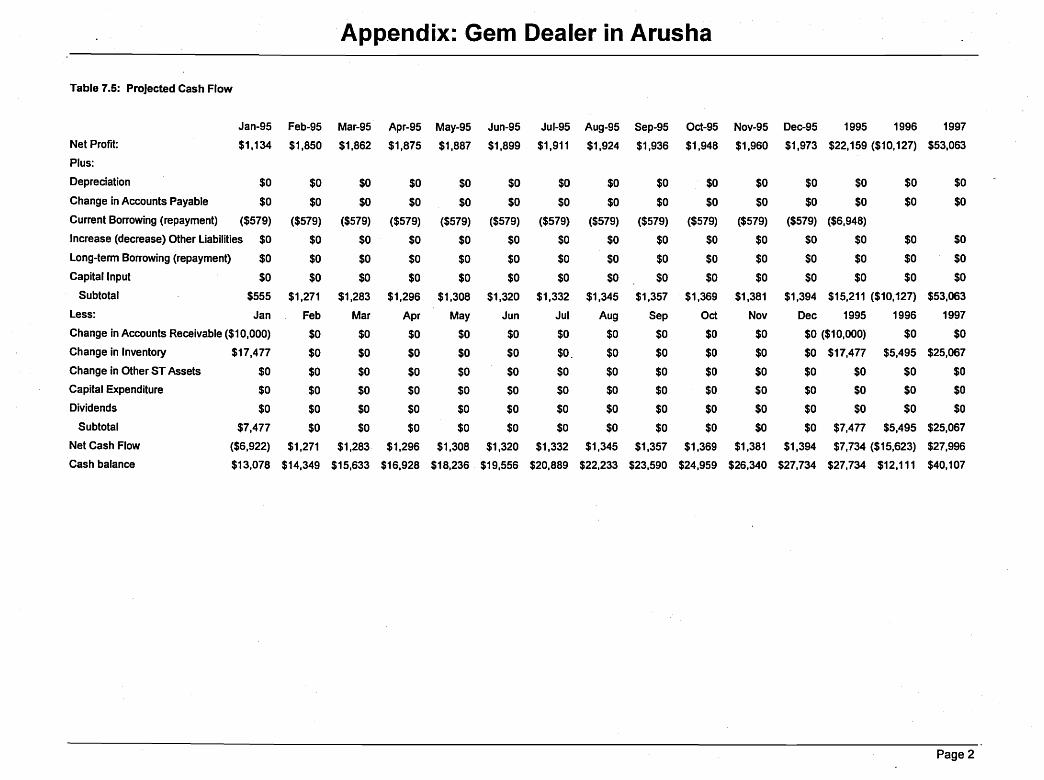
Appendix: Gem Dealer in Arusha
Table 7.5: Projected Cash Flow
Jan-95 Feb-95 Mar-95 Apr-95 May-95 Jun-95 Jul-95 Aug-95 Sep-95 Oct-95 Nov-95 Dec-95 1995 1996 1997
Net Profit: $1,134 $1,850 $1,862 $1,875 $1,887 $1,899 $1,911 $1,924 $1,936 $1,948 $1,960 $1,973 $22,159 ($10,127) $53,063
Plus:
Depreciation $0 $0 $0 $0 $0 $0 $0 $0 $0 $0 $0 $0 $0 $0 $0
Change in Accounts Payable $0 $0 $0 $0 $0 $0 $0 $0 $0 $0 $0 $0 $0 $0 $0
Current Borrowing (repayment) ($579) ($579) ($579) ($579) ($579) ($579) ($579) ($579) ($579) ($579) ($579) ($579) ($6,948)
Increase (decrease) Other liabilities $0 $0 $0 $0 $0 $0 $0 $0 $0 $0 $0 $0 $0 $0 $0
long-term Borrowing (repayment) $0 $0 $0 $0 $0 $0 $0 $0 $0 $0 $0 $0 $0 $0 $0
Capital Input $0 $0 $0 $0 $0 $0 $0 $0 $0 $0 $0 $0 $0 $0 $0
Subtotal $555 $1,271 $1,283 $1,296 $1,308 $1,320 $1,332 $1,345 $1,357 $1,369 $1,381 $1,394 $15,211 ($10,127) $53,063
less: Jan Feb Mar Apr May Jun Jul Aug Sep Oct Nov Dec 1995 1996 1997
Change in Accounts Receivable ($10,000) $0 $0 $0 $0 $0 $0 $0 $0 $0 $0 $0 ($10,000) $0 $0
Change in Inventory $17,477 $0 $0 $0 $0 $0 $0. $0 $0 $0 $0 $0 $17,477 $5,495 $25,067
Change in Other ST Assets $0 $0 $0 $0 $0 $0 $0 $0 $0 $0 $0 $0 $0 $0 $0
Capital Expenditure $0 $0 $0 $0 $0 $0 $0 $0 $0 $0 $0 $0 $0 $0 $0
Dividends $0 $0 $0 $0 $0 $0 $0 $0 $0 $0 $0 $0 $0 $0 $0
Subtotal $7,477 $0 $0 $0 $0 $0 $0 $0 $0 $0 $0 $0 $7,477 $5,495 $25,067
Net Cash Flow ($6,922) $1,271 $1,283 $1,296 $1,308 $1,320 $1,332 $1,345 $1,357 $1,369 $1,381 $1,394 $7,734 ($15,623) $27,996
Cash balance $13,078 $14,349 $15,633 $16,928 $18,236 $19,556 $20,889 $22,233 $23,590 $24,959 $26,340 $27,734 $27,734 $12,111 $40,107
Page 2
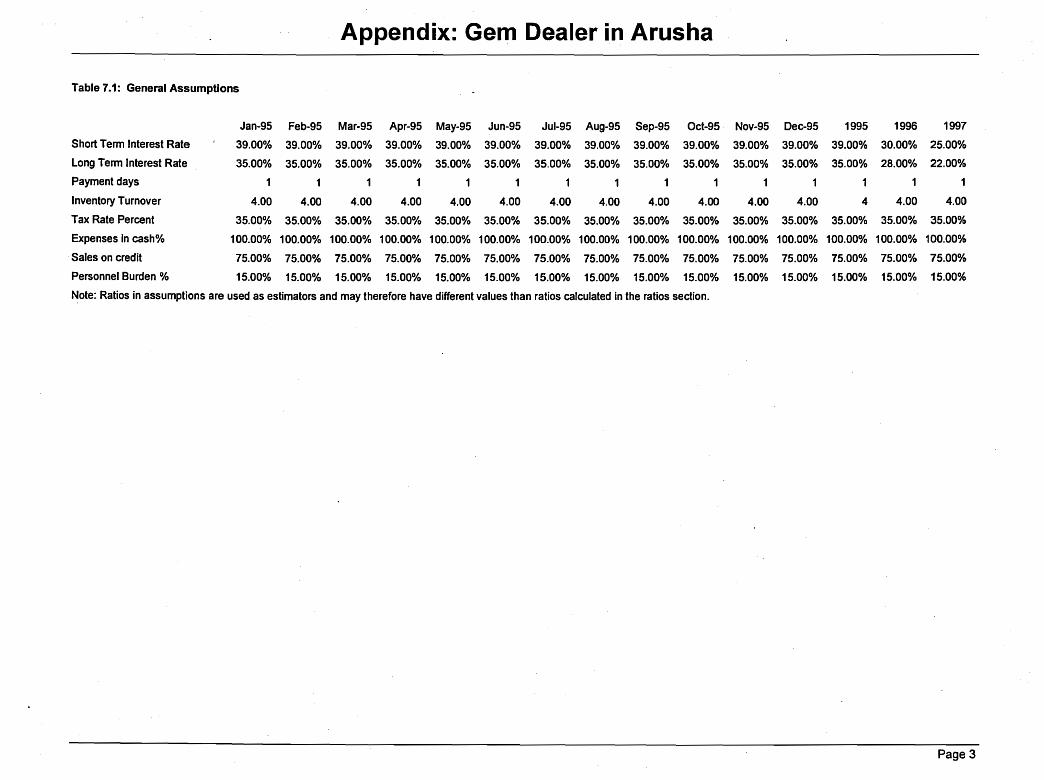
Appendix: Gem Dealer in Arusha
Page 3

Appendix: Gem Dealer in Arusha
Table 6.4: Personnel Plan
Job title Jan-95 Feb-95 Mar-95 Apr-95 May-95 Jun-95 Jul-95 Aug-95 Sep-95 Oct-95 Nov-95 Dec-95 1995 1996 1997
Dealers $1,667 $1,667 $1,667 $1,667 $1,667 $1,667 $1,667 $1,667 $1,667 $1,667 $1,667 $1,667 $20,004 $25,000 $30,000
Buyers, staff and guards $1,000 $1,000 $1,000 $1,000 $1,000 $1,000 $1,000 $1,000 $1,000 $1,000 $1,000 $1,000 $12,000 $14,000 $18,000
Cutter $833 $833 $833 $833 $833 $833 $833 $833 $833 $833 $833 $833 $9,996 $11,000 $12,000
Other $0 $0 $0 $0 $0 $0 $0 $0 $0 .$0 $0 $0 $0 $0 $0
Subtotal $3,500 $3,500 $3,500 $3,500 $3,500 $3,500 $3,500 $3,500 $3,500 $3,500 $3,500 $3,500 $42,000 $50,000 $60,000
Page 4

Appendix: Gem Dealer in Arusha
Table 7.4: Projected Profit and Loss
Jan-95 Feb-95 Mar-95 Apr-95 May-95 Jun-95 Jul-95 Aug-95 Sep-95 Oct-95 Nov-95 Dec-95 1995 1996 1997
Sales $21,952 $21,952 $21,952 $21,952 $21,952 $21,952 $21,952 $21,952 $21,952 $21,952 $21,952 $21,952 $263,424 $253,869 $484,738
Direct Cost of Sales $9,159 $9,159 $9,159 $9,159 $9,159 $9,159 $9,159 $9,159 $9,159 $9,159 $9,159 $9,159 $109,908 $131,889 $232,158
Other $0 $0 $0 $0 $0 $0 $0 $0 $0 $0 $0 $0 $0 $0 $0
Total Cost of Sales $9,159 $9,159 $9,159 $9,159 $9,159 $9,159 $9,159 $9,159 $9,159 $9,159 $9,159 $9,159 $109,908 $131,889 $232,158
Gross margin $12,793 $12,793 $12,793 $12,793 $12,793 $12,793 $12,793 $12,793 $12,793 $12,793 $12,793 $12,793 $153,516 $121,980 $252,580
Gross margin percent 58.28% 58.28% 58.28% 58.28% 58.28% 58.28% 58.28% 58.28% 58.28% 58.28% 58.28% 58.28% 58.28% 48.05% 52.11%
Operating expenses:
Promotion/hospitality $333 $333 $333 $333 $333 $333 $333 $333 $333 $333 $333 $333 $3,996 $4,500 $5,000
Travel $375 $375 $375 $375 $375 $375 $375 $375 $375 $375 $375 $375 $4,500 $6,000 $9,000
Direct taxes on sales $1,429 $1,429 $1,429 $1,429 $1,429 $1,429 $1,429 $1,429 $1,429 $1,429 $1,429 $1,429 $17,150 $14,902 $18,016
Other $0 $0 $0
Payroll expense $3,500 $3,500 $3,500 $3,500 $3,500 $3,500 $3,500 $3,500 $3,500 $3,500 $3,500 $3,500 $42,000 $50,000 $60,000
Vehicles/equipment $1,381 $1,381 $1,381 $1,381 $1,381 $1,381 $1,381 . $1,381 $1,381 $1,381 $1,381 $1,381 $16,572 $20,000 $25,000
Telecom/electr.lsupplies etc. $594 $594 $594 $594 $594 $594 $594 $594 $594 $594 $594 $594 $7,128 $9,979 $15,000
Trading losses/theft/extortion $1,389 $1,389 $1,389 $1,389 $1,389 $1,389 $1,389 $1,389 $1,389 $1,389 $1,389 $1,389 $16,668 $20,002 $25,000
Rent $133 $133 $133 $133 $133 $133 $133 $133 $133 $133 $133 $133 $1,596 $1,596 $2,000
Depreciation $0 $0 $0 $0 $0 $0 $0 $0 $0 $0 $0 $0 $0 $0 $0
Payroll Burden $525 $525 $525 $525 $525 $525 $525 $525 $525 $525 $525 $525 $6,300 $7,500 $9,000
Licenses $1,083 $0 $0 $0 $0 $0 $0 $0 $0 $0 $0 $0 $1,083 $2,166 $2,166
Contract/Consultants $0 $0 $0 $0 $0 $0 $0 $0 $0 $0 $0 $0 $0 $0 $0
Other $0 $0 $0 $0 $0 $0 $0 $0 $0 $0 $0 $0 $0 $0 $0
--- ----Total Operating Expenses $10,742 $9,659 $9,659 $9,659 $9,659 $9,659 $9,659 $9,659 $9,659 $9,659 $9,659 $9,659 $116,993 $136,645 $170,182
Profit Before Interest and Taxes $2,051 $3,134 $3,134 $3,134 $3,134 $3,134 $3,134 $3,134 $3,134 $3,134 $3,134 $3,134 $36,523 ($14,665) $82,398
Interest Expense ST $306 $287 $269 $250 $231 $212 $193 $174 $156 $137 $118 $99 $2,432 $916 $763
Interest Expense LT $0 $0 $0 $0 $0 $0 $0 $0 $0 $0 $0 $0 $0 $0 $0
Taxes Incurred $611 $996 $1,003 $1,009 $1,016 $1,023 $1,029 $1,036 $1,042 $1,049 $1,056 $1,062 $11,932 ($5,453) $28,572
Net Profit $1,134 $1,850 $1,862 $1,875 $1,887 $1,899 $1,911 $1,924 $1,936 $1,948 $1,960 $1,973 $22,159 ($10,127) $53,063
Net ProfiUSales 5.17% 8.43% 8.48% 8.54% 8.60% 8.65% 8.71% 8.76% 8.82% 8.87% 8.93% 8.99% 8.41% -3.99% 10.95%
Page 5
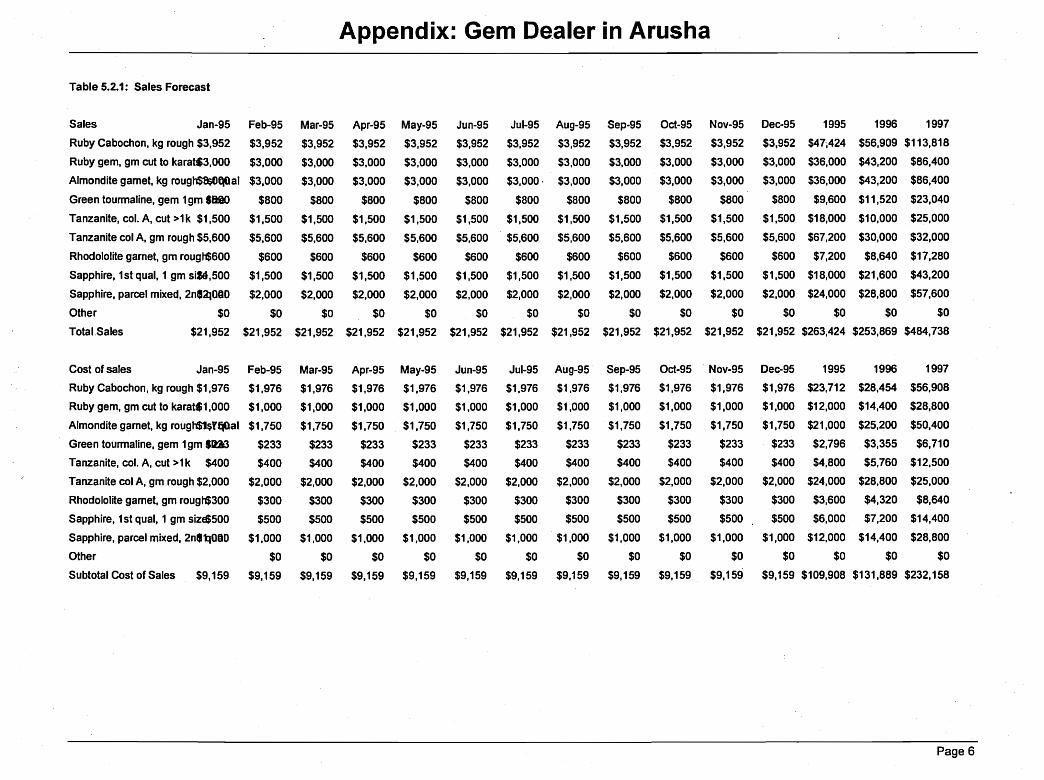
Appendix: Gem De.aler in Arusha
Table 5.2.1: Sales Forecast
Sales Jan-95 Feb-95 Mar-95 Apr-95 May-95 Jun-95 Jul-95 Aug-95 Sep-95 Oct-95 Nov-95 Dec-95 1995 1996 1997
Ruby Cabochon, kg rough $3,952 $3,952 $3,952 $3,952 $3,952 $3,952 $3.952 $3,952 $3,952 $3,952 $3,952 $3,952 $47;424 $56,909 $113,818
Ruby gem, gm cut to karat$3,OOO $3,000 $3,000 $3,000 $3,000 $3.000 $3,000 $3,000 $3,000 $3,000 $3,000 $3,000 $36,000 $43.200 $86,400
Almondite gamet, kg roug~~al $3,000 $3,000 $3,000 $3,000 $3,000 $3,000· $3,000 $3.000 $3,000 $3,000 $3,000 $36,000 $43,200 $86,400
Green tourmaline, gem 1gm SftilO $800 $800 $800 $800 $800 $800 $800 $800 $800 $800 $800 $9,600 $11,520 $23,040
Tanzanite, col. A, cut >1 k $1,500 $1,500 $1,500 $1,500 $1,500 $1,500 $1.500 $1,500 $1,500 $1,500 $1,500 $1,500 $18.000 $10,000 $25,000
Tanzanite col A, gm rough $5,600 $5.600 $5,600 $5,600 $5,600 $5,600 $5,600 $5,600 $5,600 $5,600 $5,600 $5,600 $67,200 $30,000 $32,000
Rhodololite garnet, gm rougt$600 $600 $600 $600 $600 $600 $600 $600 $600 $600 $600 $600 $7,200 $8,640 $17,280
Sapphire, 1st qual, 1 gm siU,500 $1,500 $1,500 $1,500 $1,500 $1,500 $1,500 $1,500 $1,500 $1,500 $1,500 $1,500 $18,000 $21,600 $43,200
Sapphire, parcel mixed, 2n$2IOOO $2,000 $2,000 $2,000 $2,000 $2,000 $2,000 $2,000 $2,000 $2,000 $2,000 $2,000 $24,000 $28,800 $57,600
Other $0 $0 $0 $0 $0 $0 $0 $0 $0 $0 $0 $0 $0 $0 $0
TotatSales $21,952 $21,952 $21,952 $21,952 $21,952 $21,952 $21,952 $21,952 $21,952 $21,952 $21,952 $21,952 $263,424 $253,869 $484,738
Cost of sales Jan-95 Feb-95 Mar-95 Apr-95 May-95 Jun-95 Jul-95 Aug-95 Sep-95 Oct-95 Nov-95 Dec-95 1995 1996 1997
Ruby Cabochon, kg rough $1,976 $1,976 $1,976 $1,976 $1,976 $1,976 $1,976 $1,976 $1,976 $1,976 $1,976 $1,976 $23,712 $28,454 $56,908
Ruby gem, gm cut to karat$1,OOO $1,000 $1,000 $1,000 $1,000 $1,000 $1,000 $1,000 $1,000 $1,000 $1,000 $1,000 $12,000 $14,400 $28,800
Almondite gamet, kg rough$1$r~al $1,750 $1,750 $1,750 $1,750 $1,750 $1,750 $1,750 $1,750 $1,750 $1,750 $1,750 $21,000 $25,200 $50,400
Green tourmaline, gem 1gm SD3 $233 $233 $233 $233 $233 $233 $233 $233 $233 $233 $233 $2,796 $3,355 $6,710
Tanzanite, col. A, cut >1 k $400 $400 $400 $400 $400 $400 $400 $400 $400 $400 $400 $400 $4,800 $5,760 $12,500
Tanzanite col A, gm rough $2,000 $2,000 $2,000 $2,000 $2,000 $2,000 $2,000 $2,000 $2,000 $2,000 $2,000 $2,000 $24,000 $28,800 $25,000
Rhodololite garnet, gm rougt$300 $300 $300 $300 $300 $300 $300 $300 $300 $300 $300 $300 $3,600 $4,320 $8,640
Sapphire, 1st qual, 1 gm sizE$500 $500 $500 $500 $500 $500 $500 $500 $500 $500 $500 $500 $6,000 $7,200 $14,400
Sapphire, parcel mixed, 2n$~000 $1,000 $1,000 $1,000 $1,000 $1,000 $1,000 $1,000 $1,000 $1,000 $1,000 $1,000 $12,000 $14,400 $28,800
Other $0 $0 $0 $0 $0 $0 $0 $0 $0 $0 $0 $0 $0 $0
Subtotal Cost of Sales $9,159 $9,159 $9,159 $9,159 $9,159 $9,159 $9,159 $9,159 $9,159 $9,159 $9,159 $9,159 $109,908 $131,889 $232,158
Page 6

ANNEX 4Gem Dealer in Nairobi
101

Gem Dealer in Nairobi
1.0 Executive Summary
Nairobi
Business Plan Highlights
$1,000,000
$800,000
$600,000
$400,000
$200,000
$0 '---__----' ......l...-__-V
El Sales
D Gross margin
Q Net Profit
5.2.1 Sales Forecast
1995 1996 1997
$25,000
$20,000
$15,000
$10,000
$5,000
Total Sales by Month in Year 1
Jan Feb Mar Apr May Jun Jul Aug Sep Oct Nov Dec
Page 1

Gem Dealer in Nairobi
Table 5.2.1: Sales Forecast
Sales 1995 1996 1997Ruby Cabochon, kg rough $47,424 113818 227636Ruby gem, gm cut to karats $36,000 86400 172800Almondite gamet, kg rough 1st qual $36,000 72000 129600Green tourmaline, gem 1gm size $9,600 23040 46080Tanzanite, col. A, cut >1 k $18,000 20000 50000Tanzanite col A, gm rough $67,200 60000 32000Rhodololite garnet, gm rough $7,200 17280 34560Sapphire, 1st qual, 1 gm size $18,000 43200 86400Sapphire, parcel mixed, 2nd qual $24,000 57600 115200Other $0 $0 $0Total Sales $263,424 $493,338 $894,276
Cost of sales 1995 1996 1997Ruby Cabochon, kg rough $23,712 56908 113816Ruby gem, gm cut to karats $12,000 28800 57600Almondite garnet, kg rough 1st qual $21,000 42000 75600Green tourmaline, gem 19m size $2,796 6710 13420Tanzanite, col. A, cut >1 k $4,800 11520 25000Tanzanite col A, gm rough $24,000 57600 25000Rhodololite gamet, gm rough $3,600 8640 17280Sapphire, 1st qual, 1 gm size $6,000 14400 28800Sapphire, parcel mixed, 2nd qual $12,000 28800 57600Other $0 $0 $0Subtotal Cost of Sales $109,908 $255,378 $414,116
6.4 Personnel Plan
Table 6.4: Personnel Plan
Job titleDealersBuyers, staff and guardsCutterOtherSubtotal
7.0 Financial Plan
7.1 Important Assumptions
Table 7.1: General Assumptions
1995$20,004$12,000
$0$0
$32,004
1996S35,OOO$18,000
SOSO
$53,000
1997S60,OOO$32.000
SO$0
$92.000
1995 1996 1997Short Term Interest Rate 39.00% 27.00% 25.00%Long Term Interest Rate 35.00% 24.00% 22.00%Payment days 1 1 1Inventory Turnover 4 4.00 4.00Tax Rate Percent 35.00% 35.00% 35.00%Expenses in cash% 100.00% 100.00% 100.00%Sales on credit 75.00% 75.00% 75.00%Personnel Burden % 15.00% 15.00% 15.00%Note: Ratios in assumptions are used as estimators and may therefore have different values than ratios calculated in the
ratios section.
Page 2

Gem Dealer in Nairobi
7.4 Projected Profit and Loss
Table 7.4: Projected Profit and Loss
1995 1996 1997Sales $263,424 $493,338 $894,276Direct Cost of Sales $109,908 $255,378 $414,116Other $0 $0 $0
Total Cost of Sales $109,908 $255,378 $414,116Gross margin $153,516 $237,960 $480,160Gross margin percent 58.28% 48.23% 53.69%Operating expenses:Promotion/hospitality $3,996 $8,000 $16,000Travel $4,500 $9,000 $18,000Direct taxes on sales $0 $0 $0Other $0 $0 $0Payroll expense $32,004 $53,000 $92,000Vehicles/equipment $16,572 24200 42000Telecomlelectr.lsupplies etc. $5,669 8300 14200Trading losses/theft/extortion $16,668 24300 41600Rent $2,556 3700 6400·Depreciation $0 $0 $0Payroll Burden $4,801 $7,950 $13,800Licenses $455 $455 $455Contract/Consultants $0 $0 $0Other $0 $0 $0
Total Operating Expenses $87,338 $138,905 $244,455Profit Before Interest and Taxes $66,178 $99,055 $235,705Interest Expense ST $2,432 $824 $763Interest Expense LT $0 $0 $0Taxes Incurred $22,311 $34,381 $82,230Net Profit $41,435 $63,850 $152,712Net Profit/Sales 15.73% 12.94% 17.08%
7.5 Projected Cash Flow
Cash Analysis
$50,000
$40,000
$30,000
$20,000
$10,000
$0
$-10,000
~rC7
0"7
f-/7 re. 7
?'"f- ,c.7
C?
~
Q'
f-
7°f-V
V
A> t 1 1 1 1 1 t t 1 1 1 '"It--
11v
/"
B Cash Flow
Bl Balance
Jan Mar
Feb
May Jul Sep
Apr Jun AugNov
Oct Dec
Page 3
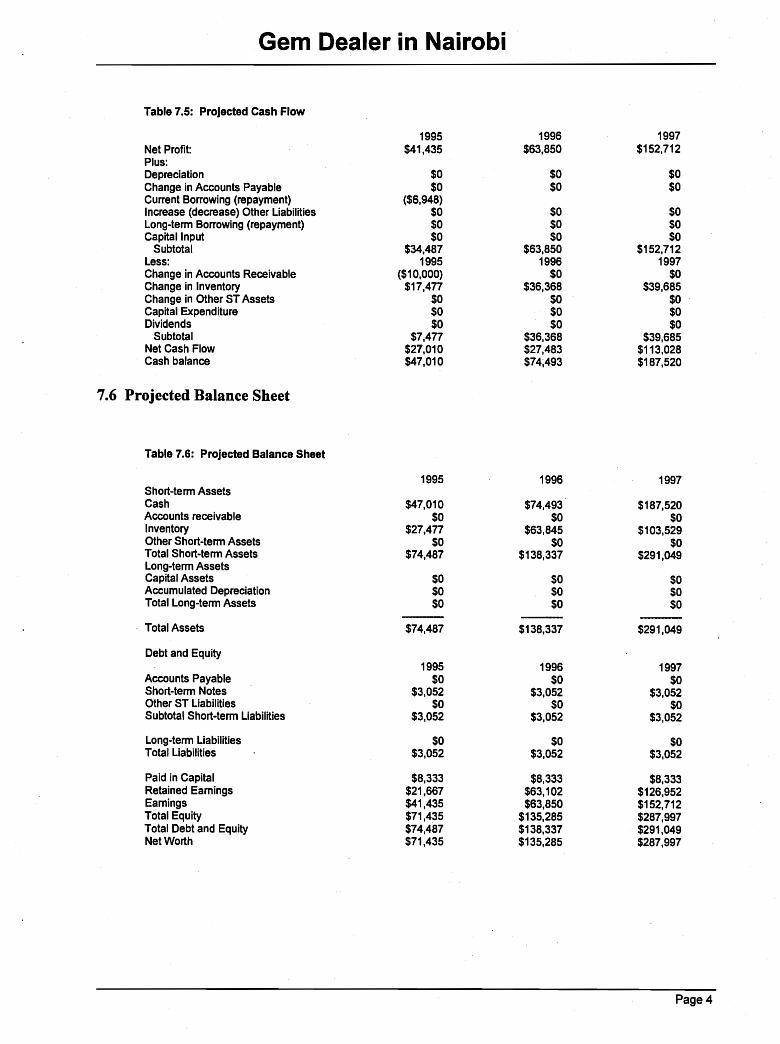
Gem Dealer in Nairobi
Table 7.5: Projected Cash Flow
1995 1996 1997Net Profit: $41,435 $63,850 $152,712Plus:Depreciation $0 $0 $0Change in Accounts Payable $0 $0 $0Current Borrowing (repayment) ($6,948)Increase (decrease) Other Liabilities $0 $0 $0Long-term Borrowing (repayment) $0 $0 $0Capital Input $0 $0 $0
Subtotal $34,487 $63,850 $152,712Less: 1995 1996 1997Change in Accounts Receivable ($10,000) $0 $0Change in Inventory $17,4n $36,368 $39,685Change in Other ST Assets $0 $0 $0Capital Expenditure $0 $0 $0Dividends $0 $0 $0
Subtotal $7,477 $36,368 $39,685Net Cash Flow $27,010 $27,483 $113.028Cash balance $47,010 $74,493 $187,520
7.6 Projected Balance Sheet
Table 7.6: Projected Balance Sheet
1995 1996 1997Short-term AssetsCash $47,010 $74,493 $187,520Accounts receivable $0 $0 $0Inventory $27,477 $63,845 $103,529Other Short-term Assets $0 $0 $0Total Short-term Assets $74,487 $138,337 $291,049Long-term AssetsCapital Assets $0 $0 $0Accumulated Depreciation $0 $0 $0Total Long-term Assets $0 $0 $0
Total Assets $74,487 $138,337 $291,049
Debt and EqUity1995 1996 1997
Accounts Payable $0 $0 $0Short-term Notes $3,052 $3,052 $3,052Other ST Liabilities $0 $0 $0Subtotal Short-term Liabilities $3,052 $3,052 $3,052
Long-term Liabilities $0 $0 $0Total Liabilities $3,052 $3,052 $3,052
Paid in Capital $8,333 $8,333 $8,333Retained Earnings $21,667 $63,102 $126,952Earnings $41,435 $63,850 $152,712Total Equity $71,435 $135,285 $287,997Total Debt and Equity $74,487 $138,337 $291,049Net Worth $71,435 $135,285 $287,997
Page 4

7.7 Business Ratios
Gem Dealer in Nairobi
Table 7.7: Projected Business RaUos
Profitability Ratios: 1995 1996 1997Gross margin 58.28% 48.23% 53.69%Net profit margin 15.73% 12.94% 17.08%Return on Assets 55.63% 46.16% 52.47%Return on Equity 58.00% 47.20% 53.03%
Activity RatiosAR Turnover 0.00 0.00 0.00Collection days 0 0 0Inventory Turnover 5.87 5.59 4.95Acds payable turnover 0.00 0.00 0.00Total asset turnover 3.54 3.57 3.07
Debt Ratios: 1995 1996 1997Debt to net Worth 0.04 0.02 0.01Short-term Debt to Liab. 1.00 1.00 1.00
Liquidity ratios.Current Ratio 24.41 45.33 95.36Quick Ratio 15.40 24.41 61.44Net Working Capital $71,435 $135,285 $287,997Interest Coverage 27.21 120.21 308.92
Additional ratios 1995 1996 1997Assets to sales 0.28 0.28 0.33Debt/Assets 4% 2% 1%Current debtITotal Assets 4% 2% 1%Acid Test 15.40 24.41 61.44Asset Turnover 3.54 3.57 3.07Sales/Net Worth 3.69 3.65 3.11
Page 5

Appendix:. Gem Dealer in Nairobi
Table 7.6: Projected Balance Sheet
Jan-95 Feb-95 Mar-95 Apr-95 May-95 Jun-95 Jul-95 Aug-95 Sep-95 Oct-95 Nov-95 Dec-95 1995 1996 1997
Short-term Assets
Cash $14,986 $17,836 $20,698 $23,573 $26,460 $29,359 $32,270 $35,194 $38,129 $41,077 $44,038 $47,010 $47,010 $74,493 $187,520
Accounts receivable $0 $0 $0 $0 $0 $0 $0 $0 $0 $0 $0 $0 $0 $0 $0
Inventory $27,477 $27,477 $27,477 $27,477 $27,477 $27,477 $27,477 $27,477 $27,477 $27,477 $27,477 $27,477 $27,477 $63,845 $103,529
Other Short-term Assets $0 $0 $0 $0 $0 $0 $0 $0 $0 $0 $0 $0 $0 $0 $0
Total Short-term Assets $42,463 $45,313 $48,175 $51,050 $53,937 $56,836 $59,747 $62,671 $65,606 $68,554 $71,515 $74,487 $74,487 $138,337 $291,049
long-term Assets
Capital Assets $0 $0 $0 $0 $0 $0 $0 $0 $0 $0 $0 $0 $0 $0 $0
Accumulated Depreciation $0 $0 $0 $0 $0 $0 $0 $0 $0 $0 $0 $0 $0 $0 $0
Total long-term Assets $0 $0 $0 $0 $0 $0 $0 $0 $0 $0 $0 $0 $0 $0 $0
Total Assets $42,463 $45,313 $48,175 $51,050 $53,937 $56,836 $59,747 $62,671 $65,606 $68,554 $71,515 $74,487 $74,487 $138,337 $291,049
Debt and Equity
Jan-95 Feb-95 Mar-95 Apr-95 May-95 Jun-95 Jul-95 Aug-95 Sep-95 Oct-95 Nov-95 Dec-95 1995 1996 1997
Accounts Payable $0 $0 $0 $0 $0 $0 $0 $0 $0 $0 $0 $0 $0 $0 $0
Short-term Notes $9,421 $8,842 $8,263 $7,684 $7,105 $6,526 $5,947 $5,368 $4,789 $4,210 $3,631 $3,052 $3,052 $3,052 $3,052
Other ST liabilities $0 $0 $0 $0 $0 $0 $0 $0 $0 $0 $0 $0 $0 $0 $0
Subtotal Short-term liabilities $9,421 $8,842 $8,263 $7,684 $7,105 $6,526 $5,947 $5,368 $4,789 $4,210 $3,631 $3,052 $3,052 $3,052 $3,052
long-term liabilities $0 $0 $0 $0 $0 $0 $0 $0 $0 $0 $0 $0 $0 $0 $0
Total liabilities $9,421 $8,842 $8,263 $7,684 $7,105 $6,526 $5,947 $5,368 $4,789 $4,210 $3,631 $3,052 $3,052 $3,052 $3,052
Paid in Capital $8,333 $8,333 $8,333 $8,333 $8,333 $8,333 $8,333 $8,333 $8,333 $8,333 $8,333 $8,333 $8,333 $8,333 $8,333
Retained Earnings $21,667 $21,667 $21,667 $21,667 $21,667 $21,667 $21,667 $21,667 $21,667 $21,667 $21,667 $21,667 $21,667 $63,102 $126,952
Earnings $3,042 $6,471 $9,912 $13,366 $16,832 $20,310 $23,800 $27,303 $30,817 $34,344 $37,884 $41,435 $41,435 $63,850 $152,712
Total Equity $33,042 $36,471 $39,912 $43,366 $46,832 $50,310 $53,800 $57,303 $60,817 $64,344 .$67,884 $71,435 $71,435 $135,285 $287,997
Total Debt and Equity $42,463 $45,313 $48,175 $51,050 $53,937 $56,836 $59,747 $62,671 $65,606 $68,554 $71,515 $74,487 $74,487 $138,337 $291,049
Net Worth $33,042 $36,471 $39,912 $43,366 $46,832 $50,310 $53,800 $57,303 $60,817 $64,344 $67,884 $71,435 $71,435 $135,285 $287,997
Page 1
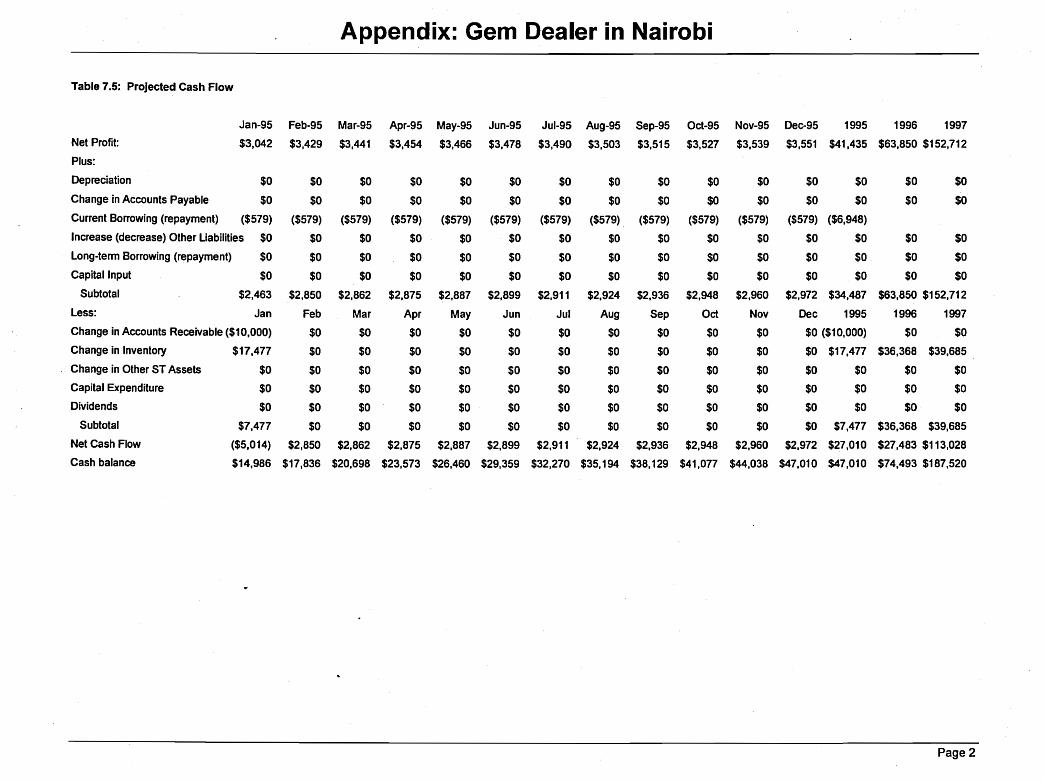
Appendix: Gem Dealer in Nairobi
Table 7.5: Projected Cash Flow
Jan-95 Feb-95 Mar-95 Apr-95 May-95 Jun-95 Jul-95 Aug-95 Sep-95 Oct-95 Nov-95 Dec-95 1995 1996 1997
Net Profit: $3,042 $3,429 $3,441 $3,454 $3,466 $3,478 $3,490 $3,503 $3.515 $3,527 $3,539 $3,551 $41,435 $63,850 $152,712
Plus:
Depreciation $0 $0 $0 $0 $0 $0 $0 $0 $0 $0 $0 $0 $0 $0 $0
Change in Accounts Payable $0 $0 $0 $0 $0 $0 $0 $0 $0 $0 $0 $0 $0 $0 $0
Current Borrowing (repayment) ($579) ($579) ($579) ($579) ($579) ($579) ($579) ($579) ($579) ($579) ($579) ($579) ($6,948)
Increase (decrease) Other Liabilities $0 $0 $0 $0 $0 $0 $0 $0 $0 $0 $0 $0 $0 $0 $0
Long-term Borrowing (repayment) $0 $0 $0 $0 $0 $0 $0 $0 $0 $0 $0 $0 $0 $0 $0
Capital Input $0 $0 $0 $0 $0 $0 $0 $0 $0 $0 $0 $0 $0 $0 $0
Subtotal $2,463 $2,850 $2,862 $2,875 $2,887 $2,899 $2,911 $2,924 $2,936 $2,948 $2.960 $2,972 $34,487 $63,850 $152,712
Less: Jan Feb Mar Apr May Jun Jul Aug Sep Oct Nov Dec 1995 1996 1997
Change in Accounts Receivable ($10,000) $0 $0 $0 $0 $0 $0 $0 $0 $0 $0 $0 ($10.000) $0 $0
Change in Inventory $17,477 $0 $0 $0 $0 $0 $0 $0 $0 $0 $0 $0 $17,477 $36,368 $39,685
Change in Other ST Assets $0 $0 $0 $0 $0 $0 $0 $0 $0 $0 $0 $0 $0 $0 $0
Capital Expenditure $0 $0 $0 $0 $0 $0 $0 $0 $0 $0 $0 $0 $0 $0 $0
Dividends $0 $0 $0 $0 $0 $0 $0 $0 $0 $0 $0 $0 $0 $0 $0
Subtotal $7,477 $0 $0 $0 $0 $0 $0 $0 $0 $0 $0 $0 $7,477 $36,368 $39,685
Net Cash Flow ($5,014) $2,850 $2,862 $2,875 $2,887 $2,899 $2,911 $2,924 $2,936 $2.948 $2,960 $2,972 $27,010 $27,483 $113,028
Cash balance $14,986 $17,836 $20,698 $23,573 $26,460 $29.359 $32,270 $35,194 $38,129 $41,077 $44,038 $47,010 $47,010 $74,493 $187,520
Page 2

Appendix: Gem Dealer in Nairobi
Table 7.1: General Assumptions
Jan-95 Feb-95 Mar-95 Apr-95 May-95 Jun-95 Jul-95 Aug-95 Sep-95 Oct-95 Nov-95 Dec-95 1995 1996 1997
Short Term Interest Rate 39.00% 39.00% 39.00% 39.00% 39.00% 39.00% 39.00% 39.00% 39.00% 39.00% 39.00% 39.00% 39.00% 27.00% 25.00%
Long Term Interest Rate 35.00% 35.00% 35.00% 35.00% 35.00% 35.00% 35.00% 35.00% 35.00% 35.00% 35.00% 35.00% 35.00% 24.00% 22.00%
Payment days 1 1 1 1 1 1 1 1 1 1 1 1 1 1
Inventory Turnover 4.00 4.00 4.00 4.00 4.00 4.00 4.00 4.00 4.00 4.00 4.00 4.00 4 4.00 4.00
Tax Rate Percent 35.00% 35.00% 35.00% 35.00% 35.00% 35.00% 35.00% 35.00% 35.00% 35.00% 35.00% 35.00% 35.00% 35.00% 35.00%
Expenses in cash% 100.00% 100.00% 100.00% 100.00% 100.00% 100.00% 100.00% 100.00% 100.00% 100.00% 100.00% 100.00% 100.00% 100.00% 100.00%
Sales on credit 75.00% 75.00% 75.00% 75.00% 75.00% 75.00% 75.00% 75.00% 75.00% 75.00% 75.00% 75.00% 75.00% 75.00% 75.00%
Personnel Burden % 15.00% 15.00% 15.00% 15.00% 15.00% 15.00% 15.00% 15.00% 15.00% 15.00% 15.00% 15.00% 15.00% 15.00% 15.00%
Note: Ratios in assumptions are used as estimators and may therefore have different values than ratios calculated in the ratios section.
Page 3

Appendix: Gem Dealer in Nairobi
Table 6.4: Personnel Plan
Job title Jan-95 Feb-95 Mar-95 Apr-95 May-95 Jun-95 Jul-95 Aug-95 Sep-95 Oct-95 Nov-95 Dec-95 1995 1996 1997
Dealers $1,667 $1,667 $1,667 $1,667 $1,667 $1,667 $1,667 $1,667 $1,667 $1,667 $1,667 $1,667 $20,004 $35,000 $60,000
Buyers, staff and guards $1,000 $1,000 $1,000 $1,000 $1,000 $1,000 $1,000 $1,000 $1,000 $1,000 $1,000 $1,000 $12,000 $18,000 $32,000
Cutter $0 $0 $0 $0 $0 $0 $0 $0 $0 $0 $0 $0 $0 $0 $0
Other $0 $0 $0 $0 $0 $0 $0 $0 $0 $0 $0 $0 $0 $0 $0
Subtotal $2,667 $2,667 $2,667 $2,667 $2,667 $2,667 $2,667 $2,667 $2,667 $2,667 $2,667 $2,667 $32,004 $53,000 $92,000
Page.4

Appendix: Gem Dealer in Nairobi
Table 7.4: Projected Profit and Loss
Jan-95 Feb-95 Mar-95 Apr-95 May-95 Jun-95 Jul-95 Aug-95 Sep-95 Oct-95 Nov-95 Dec-95 1995 1996 1997-
Sales $21,952 $21,952 $21,952 $21,952 $21,952 $21,952 $21,952 $21,952 $21,952 $21,952 $21,952 $21,952 $263,424 $493,338 $894,276
Direct Cost of Sales $9,159 $9,159 $9,159 $9,159 $9,159 $9,159 $9,159 $9,159 $9,159 $9,159 $9,159 $9,159 $109,908 $255,378 $414,116
Other $0 $0 $0 $0 $0 $0 $0 $0 $0 $0 $0 $0 $0 $0 $0
---Total Cost of Sales $9,159 $9,159 $9,159 $9,159 $9,159 $9,159 $9,159 $9,159 $9,159 $9,159 $9,159 $9,159 $109,908 $255,378 $4~4,116
Gross margin $12,793 $12,793 $12,793 $12,793 $12,793 $12,793 $12,793 $12,793 $12,793 $12,793 $12,793 $12,793 $153,516 $237,960 $480,160
Gross margin percent 58.28% 58.28% 58.28% 58.28% 58.28% 58.28% 58.28% 58.28% 58.28% 58.28% 58.28% 58.28% 58.28% 48.23% 53.69%
Operating expenses:
Promotion/hospitality - $333 $333 $333 $333 $333 $333 $333 $333 $333 $333 $333 $333 $3,996 $8,000 $16,000
Travel $375 $375 $375 $375 $375 $375 $375 $375 $375 $375 $375 $375 $4,500 $9,000 $18,000
Direct taxes on sales $0 $0 $0 $0 $0 $0 $0 $0 $0 $0 $0 $0 $0 $0 $0
Other $0 $0 $0
Payroll expense $2,667 $2,667 $2,667 $2,667 $2,667 $2,667 $2,667 $2,667 $2,667 $2,667 $2,667 $2,667 $32,004 $53,000 $92,000
Vehicles/equipment $1,381 $1,381 $1,381 $1,381 $1,381 $1,381 $1,381 $1,381 $1,381 $1,381 $1,381 $1,381 $16,572 24200 42000
Telecornlelectr.lsupplies etc. $594 $472 $472 $472 $472 $472 $472 $472 $472 $472 $472 $472 $5,669 8300 14200
Trading losses/theft/extortion $1,389 $1,389 $1,389 $1,389 $1,389 $1,389 $1,389 $1,389 $1,389 $1,389 $1,389 $1,389 $16,668 24300 41600
Rent $213 $213 $213 $213 $213 $213 $213 $213 $213 $213 $213 $213 $2,556 3700 6400
Depreciation $0 $0 $0 $0 $0 $0 $0 $0 $0 $0 $0 $0 $0 $0 $0
Payroll Burden $400 $400 $400 $400 $400 $400 $400 $400 $400 $400 $400 $400 $4,801 $7,950 $13,800
Licenses $455 $0 $0 $0 $0 $0 $0 $0 $0 $0 $0 $0 $455 $455 $455
Contract/Consultants $0 $0 $0 $0 $0 $0 $0 $0 $0 $0 $0 $0 $0 $0 $0
Other $0 $0 $0 $0 $0 $0 $0 $0 $0 $0 $0 $0 $0 $0 $0
Total Operating Expenses $7,807 $7,230 $7,230 $7,230 $7,230 $7,230 $7,230 $7,230 $7,230 $7,230 $7,230 $7,230 $87,338 $138,905 $244,455
Profit Before Interest and Taxes $4,986 $5,563 $5,563 -$5,563 $5,563 $5,563 $5,563 $5,563 $5,563 $5,563 $5,563 $5,563 $66,178 $99,055 $235,705
Interest Expense ST $306 $287 $269 $250 $231 $212 $193 $174 $156 $137 $118 $99 $2,432 $824 $763
Interest Expense LT $0 $0 $0 $0 $0 $0 $0 $0 $0 $0 $0 $0 $0 $0 $0
Taxes Incurred $1,638 $1,846 $1,853 $1,860 $1,866 $1,873 $1,879 $1,886 $1,893 $1,899 $1,906 $1,912 $22,311 $34,381 $82,230
Net Profit $3,042 $3,429 $3,441 $3,454 $3,466 $3,478 $3,490 $3,503 $3,515 $3,527 $3,539 $3,551 $41,435 $63,850 $152,712
Net ProfiVSales 13.86% 15.62% 15.68% 15.73% 15.79% 15.84% 15.90% 15.96% 16.01% 16.07% 16.12% 16.18% 15.73% 12.94% 17.08%
Page 5
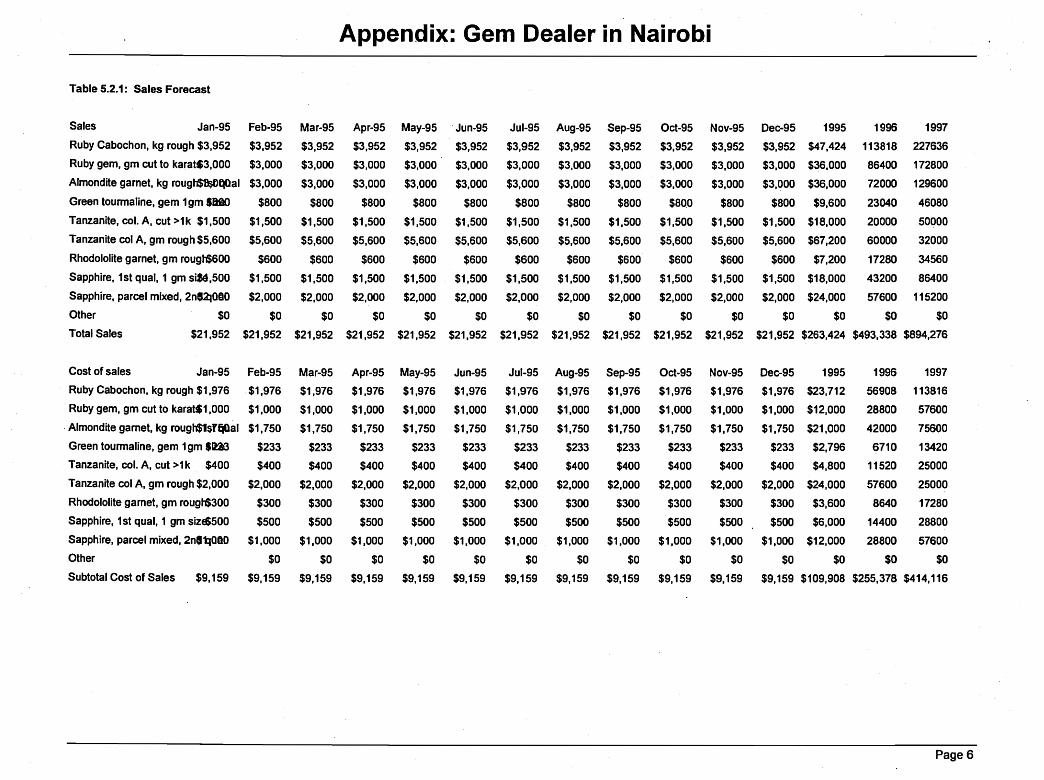
Appendix: Gem Dealer in Nairobi
Table 5.2.1: Sales Forecast
Sales Jan-95 Feb-95 Mar-95 Apr-95 May-95 Jun-95 Jul-95 Aug-95 Sep-95 Oct-95 Nov-95 Dec-95 1995 1996 1997
Ruby Cabochon, kg rough $3,952 $3,952 $3,952 $3,952 $3,952 $3,952 $3,952 $3,952 $3,952 $3,952 $3,952 $3,952 $47,424 113818 227636
Ruby gem, gm cut to karatS3,OOO $3,000 $3,000 $3,000 $3,000 $3,000 $3,000 $3,000 $3,000 $3,000 $3,000 $3,000 $36,000 86400 172800
Almondite gamet, kg rough$&$O~al $3,000 $3,000 $3,000 $3,000 $3,000 $3,000 $3,000 $3,000 $3,000 $3,000 $3,000 $36,000 72000 129600
Green tourmaline, gem 1gm SHO $800 $800 $800 $800 $800 $800 $800 $800 $80.0 $800 $800 $9,600 23040 46080
Tanzanite, col. A, cut >1k $1,500 $1,500 $1,500 $1,500 $1,500 $1,500 $1,500 $1,500 $1,500 $1,500 $1,500 $1,500 $18,000 20000 50000
Tanzanite col A, gm rough $5,600 $5,600 $5,600 $5,600 $5,600 $5,600 $5,600 $5,600 $5,600 $5,600 $5,600 $5,600 $67,200 60000 32000
Rhodololite gamet, gm rough$600 $600 $600 $600 $600 $600 $600 $600 $600 $600 $600 $600 $7,200 17280 34560
Sapphire, 1st qual, 1 gm siM,500 $1,500 $1,500 $1,500 $1,500 $1,500 $1,500 $1,500 $1,500 $1,500 $1,500 $1,500 $18,000 43200 86400
Sapphire, parcel mixed, 2n'2IOOO $2,000 $2,000 $2,000 $2,000 $2,000 $2,000 $2,000 $2,000 $2,000 $2,000 $2,000 $24,000 57600 115200
Other $0 $0 $0 $0 $0 $0 $0 $0 $0 $0 $0 $0 $0 $0 $0
Total Sales $21,952 $21,952 $21,952 $21,952 $21,952 $21,952 $21,952 $21,952 $21,952 $21,952 $21,952 $21,952 $263,424 $493,338 $894,276
Cost of sales Jan-95 Feb-95 Mar-95 Apr-95 May-95 Jun-95 Jul-95 Aug-95 Sep-95 Oct-95 Nov-95 Dec-95 1995 1996 1997
Ruby Cabochon, kg rough $1,976 $1,976 $1,976 $1,976 $1,976 $1,976 $1,976 $1,976 $1,976 $1,976 $1,976 $1,976 $23,712 56908 113816
Ruby gem, gm cut to karatS1,000 $1,000 $1,000 $1,000 $1,000 $1,000 $1,000 $1,000 $1,000 $1,000 $1,000 $1,000 $12,000 28800 57600
. Almondite gamet, kg rougt$1$fQOal $1,750 $1,750 $1,750 $1,750 $1,750 $1,750 $1,750 $1,750 $1,750 $1,750 $1,750 $21,000 42000 75600
Green tourmaline, gem 1gm SW $233 $233 $233 $233 $233 $233 $233 $233 $233 $233 $233 $2,796 6710 13420
Tanzanite, col. A, cut >1 k $400 $400 $400 $400 $400 $400 $400 $400 $400 $400 $400 $400 $4,800 11520 25000
Tanzanite col A, gm rough $2,000 $2,000 $2,000 $2,000 $2,000 $2,000 $2,000 $2,000 $2,000 $2,000 $2,000 $2,000 $24,000 57600 25000
Rhodololite garnet, gm rough$300 $300 $300 $300 $300 $300 $300 $300 $300 $300 $300 $300 $3,600 8640 17280
Sapphire, 1st qual, 1 gm sizE$500 $500 $500 $500 $500 $500 $500 $500 $500 $500 $500 $500 $6,000 14400 28800
Sapphire, parcel mixed, 2n'1::I000 $1,000 $1,000 $1,000 $1,000 $1,000 $1,000 $1,000 $1,000 $1,000 $1,000 $1,000 $12,000 28800 57600
Other $0 $0 $0 $0 $0 $0 $0 $0 $0 $0 $0 $0 $0 $0
Subtotal Cost of Sales $9,159 $9,159 $9,159 $9,159 $9,159 $9,159 $9,159 $9,159 $9,159 $9,159 $9,159 $9,159 $109,908 $255,378 $414,116
Page 6

ANNEX 5
113

ROYALTIES COLLECTED ON GEMSTONE EXPORTS, 1996·1997
Coloured Gemstone exports and Royalty Revenues 1996-April1997" Master Diamond Dealers' ExportsMonth Weight Value Royalty Value Yield Exchange Month Weight Value Royalty Value Yield Exchange
(gms) (US$) Tsh % of Val Rate 1996 (carat) (US$) (Tsh) Tsh % of Val Rate1996 161,328,317 9,583,248 117,659,945 . 5,749,948,800 2.05% 600 8,604 728,172 16,427,347 437,263,056 3.76% 600
January 46,575,472 1,038,644 11,525,532 623,186,400 1.85% 600 January 99.03 11,376.25 312,475 6,825,750 4.58% 600
February 0 0 0 0 ERR 600 February 0.00 0.00 0 0 ERR 600
March 946,383 833,394 9,495,753 500,036,400 1.90% 600 March 2,514.83 92,376.28 53,331 55,425,768 0.10% 600
April 6,398,965 666,086 9,107,764 399,651,600 2.28% 600 April 485.47 23,192.34 639,094 13,915,404 4.59% 600May 25,540,918 1,264,457 12,951,303 758,674,200 1.71% 600 May 373.53 119,567.48 668,810 71,740,488 0.93% 600
June 18,332,190 792,271 11,392,344 475,362,600 2.40% 600 June 488.58 54,539.70 1,678,672 32,723,820 5.13% 600
July 3,019,794 812,933 10,846,233 487,759,800 2.22% 600 July 244.30 37,816.20 1,134,486 22,689,720 5.00% 600
August 1,564,284 690,441 9,426,197 414,264,600 2.28% 600 August 498.68 33,272.78 1,430,685 19,963,668 7.17% 600
September 1,402,555 1,123,062 12,839,200 673,837,200 1.91% 600 September 1,014.25 196,936.82 5,857,744 118,162,092 4.96% 600
October 30,272,243 723,215 9,888,582 433,929,000 2.28% 600 October 771.25 32,475.60 848,730 19,485,360 4.36% 600
November 26,646,884 978,999 12,070,089 587,399,400 2.05% 600 November 1,834.42 39,701.16 1,191,420 23,820,696 5.00% 600
December 628,629 659,746 8,116,948 395,847,600 2.05% 600 December 279.32 87,517.15 2,611,900 52,510,290 4.97% 600
1997 1997January 1,962,905 1,003,574 11,312,383 602,144,400 1.88% 600 January 100.94 21,170.55 1,720,460 12,702,330 13.54% 600
February 974,169 385,815 4,075,010 231,489,000 1.76% 600 February 281.35 60,209.80 1,806,335 36,125,880 5.00% 600
March 71,810,850 469,046 6,154,822 281,427,600 2.19% 600 March 420.33 66,523.20 1,995,975 39,913,920 5.00% 600April 835,092 657,479 7,180,715 394,487,400 1.82% 600 April 82.45 18,962.50 562,900 11,377,500 4.95% 600
4 mo total 1997 75,583,016 2,515,914 28,722,930 1,509,548,400 1.90% 600 May 1,087.35 154,035.75 4,667,800 92,421,450 5.05% 600
4 mo total 1996 53,920,820 2,538,124 30,129,049 1,522,874,400 1.98% 600 5 mo total 1997 1,972.42 320,901.80 10,753,470 192,541,080 5.59% 600
============= 5 mo total 1996 3,472.86 246,512.35 1,673,710 147,907,410 1.13% 600
Source: Ministry of Energy and Minerals •• Formal mines such as Williamson have 3-5 year royalty exemption currently in effect.
D:\MvFiles\EAGER\TZ\ROYAI TV \AIR? nAl1A1QR 11·?I;· ..A 4 UI
ANNEX 6Proportions of value-added contributing to Kenyan and Tanzanian GDP
115

..... _-- ._- ... __ ._--_ .._- ---_._~._-- -- ----.. _---_.._-.... ---._-- -- .. _--------_. _._-_ .._------j
Tanzanite Value Addedin Tanzania and Kenya
/1----------60
°1 .. / /. -~ .~ l o r·" I .. · ..--.·----l-0~ 40% I
Q)::J 200/0-m>
Tanzania 71 0/0
Kenya 29%

Value Added from Lake Zone GoldAt High Estimated Production 13.3 Tty
en 100 i
g I
E 50. 1
en::Jyt""'-'"
.. - . -- . -...- .- - ... -- . __ ...• --_ ..__.. _ .. _ ..... ----- --.---. __._------- _...---------------.-
-.._-----------
Tanzania 77%
Kenya 23%

BmLIOGRAPHY
"A chat with Ole Naiko." 1996. The Express, November 7-13:29.
African Mining Bulletin. 1997. African Mining Bulletin #12, March 26. Johannesburg: ResourcePublications.
American Embassy, Bangkok. 1995. "Country Commercial Guide: Thailand 1996." U.S. Department ofCommerce, National Technical Information Service, Springfield, Virginia. June.
____.1996. "Country Commercial Guide: Thailand 1997." U.S. Department ofCommerce,National Technical Information Service, Springfield, Virginia. August.
Andrews, Craig B. 1992. "Mineral Sector Technologies: Policy Implications for Developing Countries."Industry and Energy Division Note No. 19. Africa Technical Department, The World Bank. November.
Anyango, Gordon J. 1995. Executive Summary ofthe USAID/Comparative Transportation Cost Analysisin East Africa Project. The Management Centre, Nairobi. .
Atkinson, Dan. 1997. "Rocks and Rackets." Business in Africa, no. 1365-1560. January-March: 17-20.
Bagachawa, M.S.D., and A. Naho. 1994. A Review of Recent Developments in the Second Economy inTanzania. AERC Special Paper 16. African Economic Research Consortium.
Bangkok Bank. 1995. "Thailand's Trade Partners." www.verdLinet.co.th:80/-putt/BBL/econ_thai:Internet Thailand Service.
"Bangkok Post economic Review Year-End 1994." 1995. www.nectec.or.th/bureauxlbkkpost: TheBangkok Post.
Barry, Mamadou, ed., 1996. "Regularizing Informal Mining," A Summary of the Proceedings oftheInternational Roundtable on Artisanal Mining Organized by The World Bank, Washington, D.C., May17-19, 1995. Industry and Energy Department Occasional PaperNo. 6. April.
Beesley, Cap. 1996. "Burma Report." www.primenet.com/-rgenis/Forecasters.html: The GemstoneForecaster 14, no. 2, part one.
"BET: Facilitator of export drive." 1996. The Express, November 7-13:30.
Beyani, Chaloka. 1997. "Legal safeguards in Africa." Mining Joumal328, no. 8414: 15.
Bezerra, Oswaldo, Adalberto Verissimo, and Christopher UhI. 1996. "The Regional impacts of smallscale gold mining in Amazonia." Natural Resources Forum 20, no.4:305-317.
Blamey, Chris. 1996. "One Company, 50 million carats of sapphire a year." www.gemstone.org:International Colored Gem Association.
Bray, John. 1997. "Political risk in Africa." Mining Joumal 328, no. 8414:6,9.
"Burma Mining Industry Profile." 1994. www.tradeport.org: Tradeport.
119
____. "Minerals and Mining Law, 1986." Ghana Publishing Corporation, Printing Division. Accra1986.
____. "Minerals (Royalties) Regulations, 1987." Ghana Publishing Corporation, PrintingDivision. Accra 1987.
____. "Mercury Law, 1989." Ghana Publishing Corporation, Printing Division. Accra 1989.
____. "Small-Scale Gold Mining Law, 1989." Ghana Publishing Corporation, Printing Division.Accra 1989.
____. "Minerals and Mining (Amendment) Act, 1994." Ghana Publishing Corporation, PrintingDivision. Accra 1994.
Goldman, Anthony. 1996. "Oil Boom May turn Tiny African State Around." The East African,November 4-10:13.
Goransson, Bo. 1996. "Sweden spearheads new relations with the world's developing countries." TheGuardian, November 7:6.
Government of Kenya, Commissioner of Mines and Geology, Mines and Geological Department,Ministry of Environment. 1996. "Mining Investment Opportunity in Kenya."
Haonga, Michael. 1996. "Mrema, Lamwai to face charges." The Guardian, November 7:11.
Haule, John. 1996. "Information on minerals computerized at Dodoma." The Guardian, November 22:3.
International Colored Gem Association. 1996a. "Gem Import & Export Statistics." www.gemstone.org:International Colored Gem Association.
____. 1996b. "Thailand Gem Supply Update." www.gemstone.org: International Colored GemAssociation.
____. 1996c. "The 1995 ICA World Gemstone Mining Report." www.gemstone.org:lnternationalColored Gem Association.
International Conference on Development, Environment and Mining. 1994. "Development, Environment,and Mining: Enhancing the Contribution of the Mineral Industry to Sustainable Development," PostConference Summary. Washington, D.C., June 1-3.
"International Market Updates." 1995. www.primenet.com/-rgenis/Forecasters.html: The GemstoneForecaster 13, no. 4, part two.
"International Market Updates." 1996. www.primenet.com/-rgenis/Forecasters.html: The GemstoneForecaster 14, no. 3, part two.
International Monetary Fund (IMF). 1995a. Tanzania - StaffReport/or the 1995 Article IV Consultation.Washington, D.C. International Monetary Fund. November.
121
· 1996b. "Thailand Back on Track for Gem Trade Supremacy." www.diamonds.com: Martin----Rapaport.
Mabele, R.B. 1995. Transport and Agricultural Development Under Structural Adjustment in Tanzania.Dar es Salaam: SAP.
Mankad, H. 1996. "Euroafrican perspective on foreign investment." The Express, November 7-13:25.
Merere, Ahmed. 1996a. "Dar Drafts New Mining Law to Woo Investors." The East African, November11-17:1,32.
____. 1996b. "Tanzania Lowers Port Tariffs In Bid to Woo Shippers." The East African, April 8-14:1-2.
____. 1996c. "Tanzania Sets Up Oil Import Rules." The East African, November 4-10:6.
____. 1996d. "Tanzania to Establish Maritime Authority." The East African, November 4-10:23.
Minerals Commission. Procedure for the Acquisition ofMineral Prospecting License in Ghana. Accra,Minerals Commission.
"Monitors dispute fairness ofZambia elections. II 1996. The Guardian, November 21:10.
Mruma, Hayaz H.H. 1994. "Annual Report for the Project URT/90/020: Strengthening ofthe MineralResources Department." UNDP-MADINI, Dodoma, Tanzania. March.
Muiruri, Stephen and Mburu Mwangi. 1996. "Family of three die in tragic flight. II Daily Nation,November 15:1-2.
Murusuri, Dereck. 1996. "Increase non-traditional exports to generate forex." The Guardian, November22:3.
Mutumba-Lule, A. 1996. "Cement Firms Move to Up Production." The East African, November 4-10:21.
Mwakisyala, James. 1996. "Tanzania to Hawk Public Firms to SADC." The East African, April 15-21:12.
Mwambande, Lwaga. 1996. "Too early to criticize govt, CCM official says." The Guardian, November7:3.
Mwamukonda, G.R. 1994. An Appraisal ofthe Banks Perspective towards the Gold Buying Business inTanzania. United Republic ofTanzania: The National Bank ofCommerce.
Mwandenga, Adam. 1996. "Tanzania's Poor Economic Performance: Intellectuals have not played theirpart." The Guardian, November 22:5.
Mwapachu, Juma V. 1996. "Investing in Tanzania." The Express, November 7-13:28.
Mwitumba, Evarist. 1996. "Eastern Africa land valuers gather at UCLAS." The Guardian, March 26:1.
123
Sunguh, George. 1996. "Burundi Barred from Meeting of Top Users of Mombassa Port." The EastAfrican, November 4-10:23.
Tan Discovery Minerals Consulting. 1996a. Draft Report of Supplementary Data an Information onBaseline Survey and Preparation of Development Strategy for Small Scale and Artisanal MiningProgram. Tan Discovery Minerals Consultingffhe World Bank, Dar es Salaam.
____. 1996b. Preliminary Report on Baseline Survey and Preparation of Development Strategyfor Small Scale and Artisanal Mining Program. Tan Discovery Minerals Consulting/The World Bank,Dar es Salaam.
Tanganyika [now Tanzania, United Republic of]. "The Diamond Industry Protection Ordinance." TheGovernment Printer. Dar es Salaam 1958.
____,. Gold Trading: Chapter 127 of the Laws (Revised): (Principal Legislation). TheGovernment Printer. Dar es Salaam 1958.
____' . "The Explosives Act, 1963." The Government Printer. Dar es Salaam 1963.
____. "The Explosives Regulations, 1964." The Government Printer. Dar es Salaam 1964.
____."Mining - Chapter 123 of the Laws (revised)." The Government Printer. Dar es Salaam1969.
"Tanzania Breweries: A torch bearer." 1996. The Express, November 7-13:20.
Tanzania Chamber of Mines. Constitution. April 1994.
Tanzania, Government of. 1995. Tanzania J?xport Strategy.
Tanzania, Government of, Ministry of Water, Energy and Minerals. 1995. Opportunities for MineralResource Development. Colorado: Knudsen Printing.
____. Annual Report of the Mineral Resources Department, 1991.
Tanzania, Government of. Implementation Manual. Ministry of Water, Energy and MineralslWorldBank/Mineral Sector Development Technical Assistance Project. Dar es Salaam, March 1994.
Tanzania, United Republic of, Intra-Governmental Task Force. 1995. Export Development Strategy andAction Plan (1995-2000). .
Tanzania, United Republic of. "The Gemstone Industry (Development and Protection) Act, 1967." TheGovernment Printer. Dar es Salaam 1967.
____. "The Gemstone Industry (Development and Protection) Regulations, 1969." TheGovernment Printer. Dar es Salaam 1969.
____. "The Mining Act, 1979.'·' The Government Printer. Dar es Salaam 1979.
____. "The Mining (Claims) Regulations, 1980." The Government Printer. Dar es Salaam 1980.
125
"USA to foster stronger Trade ties with Africa." 1996. Financial Times, November 20: 1O.
Venance, Nick. 1996. "Bright future for miners." Daily News, November 14:5.
"Venture capital in Tanzania." 1996. The Express, November 7-13:18.
Vethouse Associates, Inc. for the United States Agency for International Development(USAIDffanzania). 1995. "The Mineral Sector in Tanzania." December.
Wanjala, George. 1996. "UNIDO set to improve mining industry." The Guardian, November 7:3.
Warigi, Gitau. 1996. "Strategic as well as Ethnic Factor in Zaire Fighting." The East African, November4-10:15.
"We want investors, say job-seekers." 1997. The Express, November 7-13:4.
Whiteman, Kaye. "Building on Obuasi." West Africa, no. 4136:238-9.
World Bank. 1993. Tanzania Mineral Sector Development Technical Assistance Project. World BankProject Appraisal Report. Washington, D.C., The World Bank.
. 1994. Memorandum and Recommendation of the President of the International----Development Association to the Executive Directors on a Proposed Credit in the amount of SDR 8.9Million to the United Republic ofTanzania for a Mineral Sector Development Technical AssistanceProject. Report No. P-6276-TA, 1994. Washington, D.C., World Bank.
____. 1995a. "A Comprehensive Strategy Toward Artisanal Mining." The World Bank, Industryand Mining Division, Industry and Energy Department. August.
____. 1995b. Argentina Mining Sector Development. World Bank Project Appraisal Report.Washington, D.C., The World Bank.
____. 1995c. Burkina Faso Mining Sector Capacity Building and Environmental ManagementProject. World Bank Project Appraisal Report. Washington, D.C., The World Bank.
____. 1995d. Proceedings of the International Roundtable on Artisanal Mining, 1995.Washington, D.C.: The World Bank.
World Resources. 1997. World Resources: A Guide to the Global Environment, The Urban Environment,1996-97.
Yamaguchi, Ryo. 1996. "Understanding the Jewelry Market in Japan." www.gemstone.org: InternationalColored Gem Association.
"Zairean refugees cross lake into Tanzania." 1996. The Guardian, November 7: 1O.
Zimbabwe, Republic of. "Precious Stones Trade Act." The Government Printer. Harare 1996
127