gebco 2014 bathymetric grid · this document provides information on the development of the...
TRANSCRIPT
GEBCO_2014 Bathymetric Grid
Please note that the GEBCO_2014 Grid is made available as an historical data set and has been superseded by a later release of the GEBCO global grid.
To access GEBCO’s latest data sets, please visit the GEBCO web site (www.gebco.net).
Contents
Preface
1. Introduction - The GEBCO_2014 Grid 2. Grid development 3. Land data 4. Source Identifier (SID) Grid 5. Grid format 6. GEBCO's grids and vertical datum 7. Data set attribution 8. Terms of use 9. References and links
Annex A — Data sets included in the GEBCO_2014 Grid

Preface
The General Bathymetric Chart of the Oceans (GEBCO) consists of an international group of experts who work on the development of a range of bathymetric data sets and data products, with the aim of providing the most authoritative, publicly available bathymetric data sets for the world's oceans.
GEBCO operates under the joint auspices of the International Hydrographic Organization (IHO) and the Intergovernmental Oceanographic Commission (IOC) of UNESCO.
This document provides information on the development of the GEBCO_2014 Grid.
1. Introduction
The GEBCO_2014 Grid
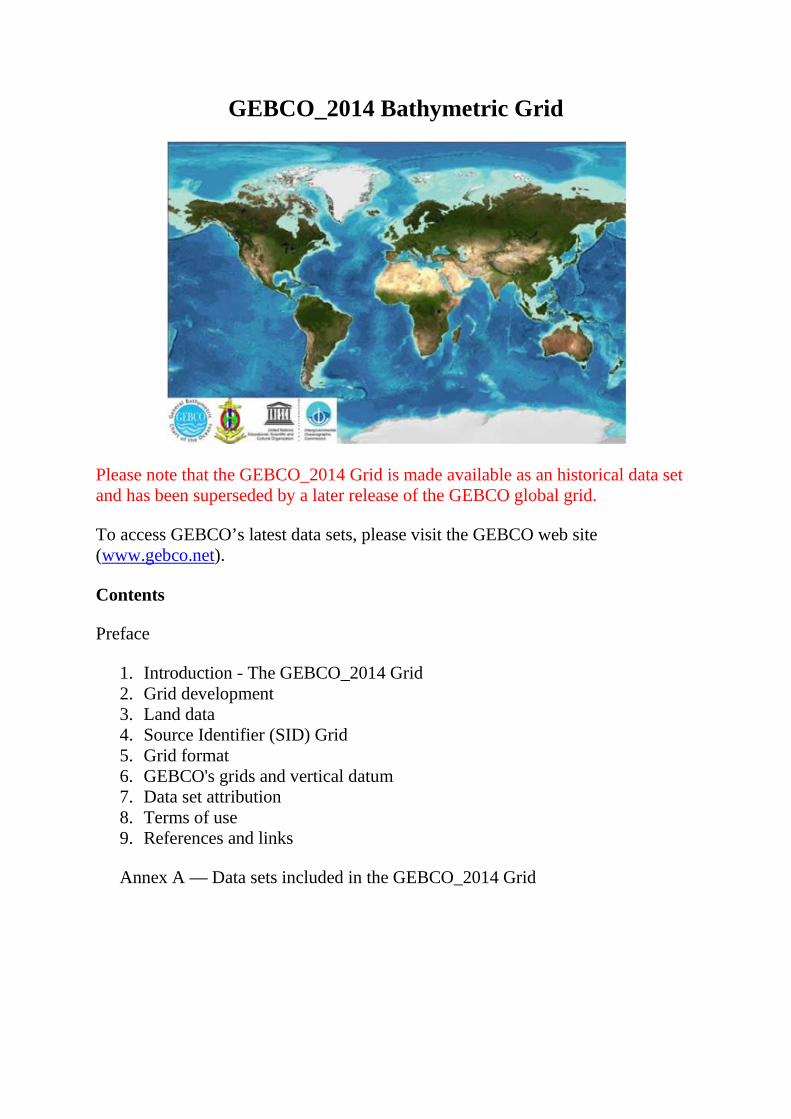
The GEBCO_2014 Grid is a continuous terrain model for ocean and land with a spatial resolution of 30 arc seconds. It is an updated version of the GEBCO_08 Grid.
The GEBCO_08 Grid was first published in January 2009. The bathymetric portion of the grid was developed from a database of ship track soundings with interpolation between soundings guided by satellite-derived gravity data.
Since its initial release, the GEBCO community has been working on updating this data set. Where they improve on this 'base grid', data sets generated by other methods have been included.
Recognising the importance of local expertise when building a global bathymetric grid, GEBCO has been working with regional mapping groups to improve its global bathymetric model. This release of the grid benefits from collaborations with a number of regional groups. Further details can be found in Annex A.
Details on the development of the grid are given below along with information on its update history. For information on the data sets referenced in this document, please see the References and Links section and Annex A below.
2. Grid development
The GEBCO grid, called 'GEBCO_08', was originally derived from v5.0 of the SRTM30_plus data set3, released in 2008. This grid was produced by combining the published Smith and Sandwell global topographic grid between latitudes 80° N and 81° S (version 11.1, September, 2008) with a database of over 290 million bathymetric soundings.

Within the Smith and Sandwell global topographic grid, the predicted depths are based on version V16.1 of the Sandwell and Smith gravity anomaly from Geosat and ERS 1 satellite altimetry, created in March 2007.
The original GEBCO_08 Grid was developed as a collaborative effort by the following organisations
• The General Bathymetric Chart of the Oceans (GEBCO) • International Hydrographic Bureau (IHB) • The US National Geospatial-Intelligence Agency (NGA) • The US National Oceanic and Atmospheric Administration (NOAA) • The US Naval Oceanographic Office (NAVO) • Scripps Institution of Oceanography (SIO) • The UK Natural Environment Research Council (NERC)
Bathymetric sounding data sets and compilation grids of measured bathymetry from a number of sources were used to generate the base grid, including
• Bathymetric soundings from the GEODAS10 data set maintained by the International Hydrographic Organization (IHO) Data Center for Digital Bathymetry (DCDB) at the US National Geophysical Data Center (NGDC).
• Bathymetric grids and data files from the marine geology and geophysics community, including contributions from the Lamont Doherty Earth Observatory (LDEO) Ridge Multibeam Synthesis Project, GEOMAR, National Science Foundation (NSF) Polar Programs, the School of Ocean and Earth Science and Technology (SOEST) at the University of Hawaii at Manoa and the WHOI/GLOBEC programme.
• Swath bathymetry grids from Scripps Institution of Oceanography multibeam cruises.
• Multibeam grids contributed by the Japan Agency for Marine-Earth Science and Technology (JAMSTEC)16.
• The US National Geophysical Data Center (NGDC) Coastal Relief Model6. • Multibeam grids from "Law of the Sea" work for areas around Alaska and
the Arctic, the Marianas, Kingman Reef and Palmyra Atoll, the Western Atlantic Ocean and the Gulf of Mexico from the Center for Coastal and Ocean Mapping/Joint Hydrographic Center at the University of New Hampshire, USA19.
• Bathymetric soundings contributed by the Institut Français de Recherche pour L'Exploitation de la Mer (IFREMER) from centre beam data from over 100 cruises.
• The Geological Survey of Ireland (GSI) provided a bathymetric grid for Irish designated waters based on multibeam surveys carried out between 2000 and 2006 as part of the Irish National Seabed Survey12.
• In some shallow water areas (shallower than 300 m), bathymetry data have been provided by a number of the International Hydrographic Organization's

(IHO) Member States. This work has been done through a project, coordinated by the International Hydrographic Bureau (IHB), to extract shallow water bathymetry data from Electronic Navigation Charts (ENCs).
Since the release of the first version of the GEBCO Grid in 2009, the data set has been updated with a number of bathymetric compilations as detailed in the data set update history section below.
2.1 Procedures used to update the GEBCO base grid
The inclusion of new data sets into the existing GEBCO base grid has been done with the aim of producing a seamless global terrain model.
For the majority of the updates supplied in the form of bathymetric grids or multibeam surveys, the 'remove-restore' procedure (Smith and Sandwell, 1997; Becker, Sandwell and Smith, 2009 and Hell and Jakobsson, 2011) has been used.
This is a two stage process of computing the difference between the new data and the existing grid and then gridding the difference and adding the difference back to the existing base grid. The aim is to achieve a smooth transition between the 'new' and 'old' data sets with the minimum of perturbation of the existing base data set.
For new data sets supplied in the form of isolated soundings a grid has been produced from the data points using an adjustable tension continuous curvature surface gridding algorithm, i.e. 'surface' from Generic Mapping Tools (GMT) (Smith and Wessel, 1990).
2.2 Reported bugs in the GEBCO Grid
While every effort is made to produce an error free grid, some artefacts may still appear in the data set. Please see our errata web page for information on known bugs in the dataset.
Please note that the GEBCO_2014 Grid is provided as an historical data set and it is not planned to make any further updates to the data set. Visit the GEBCO web site (www.gebco.net) for information on GEBCO’s latest data sets and products.
3. Land data
With the exception of polar regions, land data are based on the one km averages of topography derived from version 2.0 of the US Geological Survey SRTM3025 gridded digital elevation model data product, created with data from the US National Aeronautics and Space Administration (NASA) Shuttle Radar Topography Mission.

For the Arctic region north of 64° N the GEBCO grid is based on the International Bathymetric Chart of the Arctic Ocean (IBCAO) v317. This data set uses land data taken largely from the Global Multi-resolution Terrain Elevation Data 2010 (GMTED2010)5 data set. Over Greenland the approximately 2000 by 2000 m resolution Digital Elevation Model (DEM)8 published by Ekholm (1996) is used.
For the Southern Ocean area, south of 60° S, land data are taken from Bedmap29 data set as included in the International Bathymetric Chart of the Southern Ocean (IBCSO)1.
4. GEBCO Source Identifier (SID) Grid
The GEBCO Grid is accompanied by a Source Identifier (SID) grid. This data set identifies which of the corresponding grid cells in the GEBCO Grid are based on bathymetric soundings or bathymetric depth values from grids and which cells contain predicted or interpolated depth values. Further information about the format and coding of the data set is given below.
4.1 GEBCO SID Grid coding
The table below details the coding of the GEBCO_2014 Source Identifier (SID) grid. It includes a description of the data source that the corresponding grid cell in the GEBCO_2014 Grid is based on.
SID file coding Description
0
The grid value at this location has been developed from a database of ship track soundings with interpolation between soundings guided by satellite derived gravity data.
At this location in the grid, the data value has been interpolated.
9999
The grid value at this location has been developed from a database of ship track soundings with interpolation between soundings guided by satellite derived gravity data.
At this location, the grid cell has been constrained by a bathymetric sounding(s) data during the gridding process.
-8888 The grid value at this location has a positive value (+ve), i.e. is coded as land.

Please note that for the Southern Ocean region (south of 60°S) based on the IBCSO, elevation values are based on the Bedmap2 data set and coded as 3500.
110
The grid value at this location is taken from the Caspian Sea grid, (see Annex A.1 ). This grid has been generated from a data set of soundings using a kriging gridding algorithm.
SID grid cells that contain a sounding(s) from the Caspian Sea source data set are coded as '1100'.
120
The grid value at this location is taken from the Black Sea grid, (see Annex A.2 ). This grid has been generated from a data set of soundings using a kriging gridding algorithm.
SID grid cells that contain a sounding(s) from the Black Sea source data set are coded as '1200'.
130
The grid value at this location is taken from the GEBCO_08 Grid. In this region, the GEBCO_08 Grid is based on the Weddell Sea grid, (seeAnnex A.3). This grid has been generated from a data set of bathymetric contours based largely on multibeam and single beam bathymetric surveys.
SID grid cells that contain trackline control from the Weddell Sea source data set are coded as '1300'.
1100
The grid value at this location is taken from the Caspian Sea grid, (see Annex A.1 ). The grid cell at this location contains a sounding(s) from the Caspian Sea source data set.
For the Caspian Sea grid, cells that do not contain a sounding(s) are coded as '110'.
1200
The grid value at this location is taken from the Black Sea grid, (see Annex A.2). The grid cell at this location contains a sounding(s) from the Black Sea source data set.
For the Black Sea grid, cells that do not contain a sounding(s) are coded as '120'.
1300 The grid value at this location is taken from the GEBCO_08 Grid. In this area the GEBCO_08 Grid is based on the Weddell Sea grid, (see Annex A.3 ). This grid has been generated from a data set of

bathymetric contours based largely on multibeam and single-beam bathymetric surveys.
The grid cell at this location is 'crossed' by trackline control information, i.e. survey track or isolated sounding, from the Weddell Sea source data set.
For the Weddell Sea grid, cells that do not contain trackline control are coded as '130'.
1400 The grid value at this location is taken from the Geoscience Australia grid 'Australian Bathymetry and Topography Grid, June 2009'.
1500 The grid value at this location is based on ENC soundings supplied by the East Asia Hydrographic Commission.
1550 The grid value at this location is based on ENC bathymetric contours supplied by the East Asia Hydrographic Commission.
1600 The grid value at this location is based on gridded data from the North American Great Lakes gridded data sets.
1700 The grid value at this location is based on gridded data from the Gulf of Cadiz gridded data set 'The quest for the Africa-Eurasia plate boundary west of the Strait of Gibraltar'.
1800 The grid value at this location is based on multibeam data from the 2004 cruise of HMS Scott.
1900 The grid value at this location is taken from the IBCAO V3 grid ( www.ibcao.org ) and is based on interpolation.
1910 The grid value at this location is based on multibeam data.
1920 The grid value at this location is based on single beam data in the IBCAO V3 or IBCSO V1 grids.
1940 The grid value at this location is taken from the IBCSO V1 grid and is based on depth data from digital bathymetric models.
1950 The grid value at this location is taken from the IBCAO V3 and is based on depth contours from digitised charts.
2000 The grid value at this location is based on Olex data.
2100 The grid value at this location is based on interpolation using an adjustable tension continuous curvature surface gridding algorithm 'surface' from GMT.
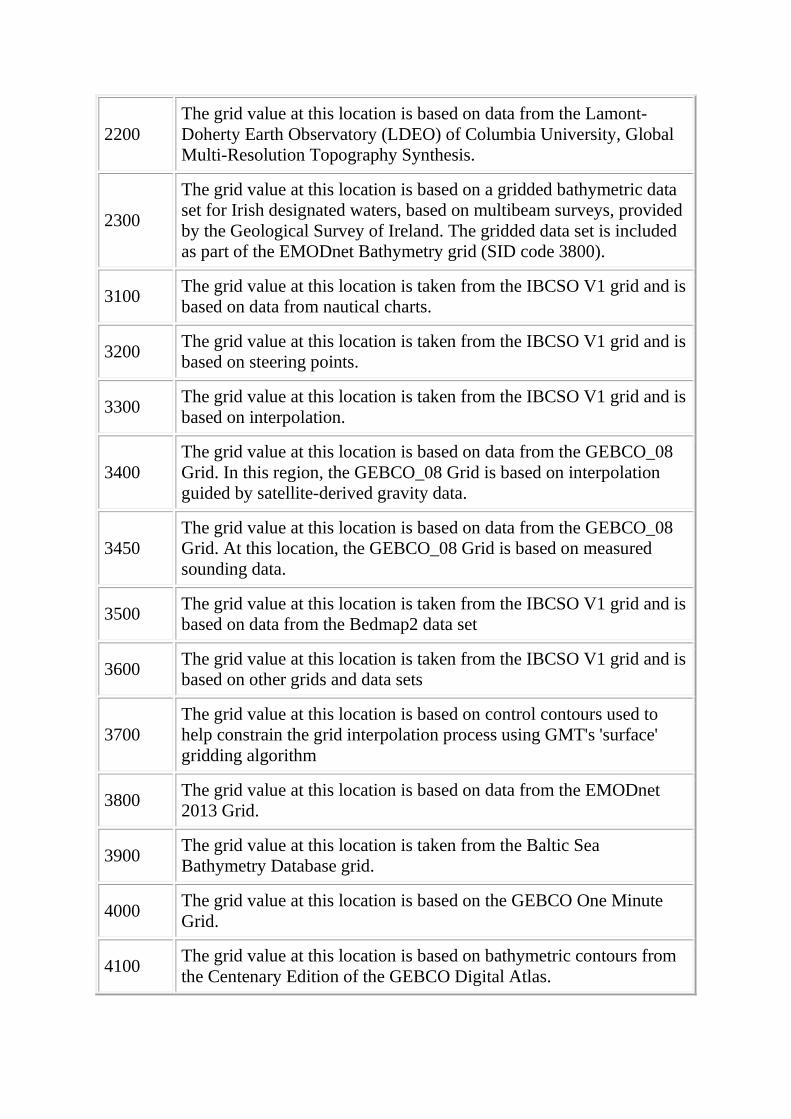
2200 The grid value at this location is based on data from the Lamont-Doherty Earth Observatory (LDEO) of Columbia University, Global Multi-Resolution Topography Synthesis.
2300
The grid value at this location is based on a gridded bathymetric data set for Irish designated waters, based on multibeam surveys, provided by the Geological Survey of Ireland. The gridded data set is included as part of the EMODnet Bathymetry grid (SID code 3800).
3100 The grid value at this location is taken from the IBCSO V1 grid and is based on data from nautical charts.
3200 The grid value at this location is taken from the IBCSO V1 grid and is based on steering points.
3300 The grid value at this location is taken from the IBCSO V1 grid and is based on interpolation.
3400 The grid value at this location is based on data from the GEBCO_08 Grid. In this region, the GEBCO_08 Grid is based on interpolation guided by satellite-derived gravity data.
3450 The grid value at this location is based on data from the GEBCO_08 Grid. At this location, the GEBCO_08 Grid is based on measured sounding data.
3500 The grid value at this location is taken from the IBCSO V1 grid and is based on data from the Bedmap2 data set
3600 The grid value at this location is taken from the IBCSO V1 grid and is based on other grids and data sets
3700 The grid value at this location is based on control contours used to help constrain the grid interpolation process using GMT's 'surface' gridding algorithm
3800 The grid value at this location is based on data from the EMODnet 2013 Grid.
3900 The grid value at this location is taken from the Baltic Sea Bathymetry Database grid.
4000 The grid value at this location is based on the GEBCO One Minute Grid.
4100 The grid value at this location is based on bathymetric contours from the Centenary Edition of the GEBCO Digital Atlas.

4200 The grid value at this location is based on bathymetric contours from the International Bathymetric Chart of the Mediterranean (IBCM).
4300 The grid value at this location is based on multibeam data from RRS Charles Darwin cruise CD118.
4400 The grid value at this location is based on ENC soundings provided by the Servicio Hidrográfico y Oceanográfico de la Armada de Chile.
4500 The grid value at this location is based on the Japanese Coast Guard grid and in this region the grid is based on multibeam data.
4550 The grid value at this location is based on the Japanese Coast Guard grid and in this region the grid is based on the J-EGG500 grid JODC-Expert Grid data for Geographic -500m.
5. Grid format
The GEBCO_2014 Grid is made available in the form of a two-dimensional array of signed 2-byte integers and uses the NetCDF Climate and Forecast (CF) Metadata Convention (http://cfconventions.org/).
Within the 2D CF-netCDF file, the grid is stored as a two-dimensional array of 2-byte signed integer values of elevation in metres, with negative values for bathymetric depths and positive values for topographic heights.
The complete data set gives global coverage, spanning 89° 59' 45''N, 179° 59' 45''W to 89° 59' 45''S, 179° 59' 45''E on a 30 arc-second grid. It consists of 21,600 rows x 43,200 columns, giving 933,120,000 data points. The netCDF storage is arranged as contiguous latitudinal bands. The data values are pixel-centre registered i.e. they refer to elevations at the centre of grid cells.
6. GEBCO's grids and vertical datum
GEBCO's global elevation models are generated by the assimilation of heterogeneous data types, assuming all of them to be referred to mean sea level. However, in some shallow water areas, the grids include data from sources having a vertical datum other than mean sea level. We are working to understand how best to fully assimilate these data.
7. Data set attribution
If the data sets are used in a presentation or publication then we ask that you acknowledge the source. This should be of the form (including the appropriate version number). Please note however, that the GEBCO_2014 Grid is provided as

a historical data set. Visit the GEBCO web site (www.gebco.net) for information on GEBCO’s latest data sets.
For the GEBCO_2014 Grid:
• 'The GEBCO_2014 Grid, version 20150318, http://www.gebco.net'.
For the GEBCO_2014 SID Grid:
• 'The GEBCO_2014 SID Grid, version 20150318, http://www.gebco.net'.
The version number of the grid is given in the header information within the grid file.
8. Terms of use
Terms of Use of The GEBCO Grid and derived information products
Scope
These terms of use apply to The GEBCO Grid and other GEBCO-derived information products
For brevity 'The GEBCO Grid' is used throughout and should be interpreted as meaning The GEBCO Grid and other GEBCO-derived information products
Bathymetric Data refers to measurements made by various instruments of the ocean depth, associated ocean properties and the supporting metadata
Information products are the result of applying algorithms, mathematical techniques, scientific theory and Intellectual Property to data to create useful, derived values.
As the GEBCO Grid is created by interpolating, applying algorithms and mathematical techniques to bathymetric data, GEBCO considers the GEBCO Grid to be an information product
GEBCO does not provide the underlying source bathymetric data when distributing the GEBCO Grid
Terms of use
The GEBCO Grid is placed in the public domain and may be used free of charge.
Use of the GEBCO Grid indicates that the user accepts the conditions of use and disclaimer information given below.

Users are free to:
• Copy, publish, distribute and transmit The GEBCO Grid • Adapt The GEBCO Grid • Commercially exploit The GEBCO Grid, by, for example, combining it with
other information, or by including it in their own product or application
Users must:
• Acknowledge the source of The GEBCO Grid. A suitable form of attribution is given in the documentation that accompanies The GEBCO Grid.
• Not use The GEBCO Grid in a way that suggests any official status or that GEBCO, or the IHO or IOC, endorses any particular application of The GEBCO Grid.
• Not mislead others or misrepresent The GEBCO Grid or its source.
Disclaimer
• The GEBCO Grid should NOT be used for navigation or for any other purpose involving safety at sea.
• The GEBCO Grid is made available 'as is'. While every effort has been made to ensure reliability within the limits of present knowledge, the accuracy and completeness of The GEBCO Grid cannot be guaranteed. No responsibility can be accepted by GEBCO, IHO, IOC, or those involved in its creation or publication for any consequential loss, injury or damage arising from its use or for determining the fitness of The GEBCO Grid for any particular use.
• The GEBCO Grid is based on bathymetric data from many different sources of varying quality and coverage.
• As The GEBCO Grid is an information product created by interpolation of measured data, the resolution of The GEBCO Grid may be significantly different to that of the resolution of the underlying measured data.
9. References and links
1. Arndt, J.E., H. W. Schenke, M. Jakobsson, F. Nitsche, G. Buys, B. Goleby, M. Rebesco, F. Bohoyo, J.K. Hong, J. Black, R. Greku, G. Udintsev, F. Barrios, W. Reynoso-Peralta, T. Morishita, R. Wigley, (2013) "The International Bathymetric Chart of the Southern Ocean (IBCSO) Version 1.0 - A new bathymetric compilation covering circum-Antarctic waters", Geophysical Research Letters, doi: 10.1002/grl.50413.2013
2. Australian Bathymetry and Topography Grid, June 2009, ANZLIC unique identifier: ANZCW0703013116, Geoscience Australia

3. Becker, J. J., D. T. Sandwell, W. H. F. Smith, J. Braud, B. Binder, J. Depner, D. Fabre, J. Factor, S. Ingalls, S-H. Kim, R. Ladner, K. Marks, S. Nelson, A. Pharaoh, R. Trimmer, J. Von Rosenberg, G. Wallace, P. Weatherall., Global Bathymetry and Elevation Data at 30 Arc Seconds Resolution: SRTM30_PLUS, Marine Geodesy, 32:4, 355-371, 2009. ftp://topex.ucsd.edu/pub/srtm30_plus
4. CD118 - bathymetry data collected by RRS Charles Darwin cruise CD118 in May 1999 for the Anton Dohrn Seamount, Iceland Basin, Hatton Bank, Lousy Bank area of the Northeast Atlantic Ocean. Data collected by the Southampton Oceanography Centre (now the National Oceanography Centre, Southampton) using a Simrad EM12 S-120 multibeam echosounder.
5. Danielson, J. J., and D. B. Gesch (2011), Global Multi-resolution Terrain Elevation Data 2010 (GMTED2010), U.S. Geol. Surv. Open File Rep., 2011-1073, 25 pp
6. Divins, D.L., and D. Metzger,The US National Geophysical Data Center (NGDC), NGDC Coastal Relief Model http://www.ngdc.noaa.gov/mgg/coastal/coastal.html
7. East Asia Hydrographic Commission http://home.eahc.asia/
8. Ekholm, S. (1996), A full coverage, high-resolution, topographic model of Greenland computed from a variety of digital elevation data, J. Geophys. Res., 101(B10), 21,961-21,972, doi:10.1029/96JB01912.
9. Fretwell, P., Pritchard, H. D. et al (2013), Bedmap2: improved ice bed, surface and thickness datasets for Antarctica, The Cryosphere, 7, 375-393, 2013. http://www.the-cryosphere.net/7/375/2013/tc-7-375-2013.html
10. GEODAS data set at the IHO Data Center for Digital Bathymetry at the US National Geophysical Data Center (NDGC) http://www.ngdc.noaa.gov/mgg/bathymetry/iho.html
11. Global Mapper, v11, GIS data processing application software, http://www.bluemarblegeo.com/products/global-mapper.php
12. Gridded bathymetry data for Irish designated waters, based on multibeam surveys, provided by the Geological Survey of Ireland (GSI). High-resolution grids of the GSI multibeam data can be accessed from https://jetstream.gsi.ie/iwdds/index.html
13. Hall, J.K., Geological Survey of Israel, Current Research, Vol. 13, December 2002.Bathymetric compilations of the seas around Israel I: The Caspian and Black Seas, 2002
14. Hell, B., and M. Jakobsson (2011), Gridding heterogeneous bathymetric data sets with stacked continuous curvature splines in tension, Mar. Geophys. Res., 32(4), 493-501, doi:10.1007/s11001-011-9141-1.
15. Henstock, T.J., McNeill, L.C. and Tappin, D.R. (2006). Seafloor morphology of the Sumatran subduction zone: Surface rupture during megathrust earthquakes? Geology, v34, pp485-488

16. JAMSTEC Data Site for Research Cruises http://www.godac.jamstec.go.jp/darwin/e
17. Jakobsson, M., L. A. Mayer, B. Coakley, J. A. Dowdeswell, S. Forbes, B. Fridman, H. Hodnesdal, R. Noormets, R. Pedersen, M. Rebesco, H.-W. Schenke, Y. Zarayskaya A, D. Accettella, A. Armstrong, R. M. Anderson, P. Bienhoff, A. Camerlenghi, I. Church, M. Edwards, J. V. Gardner, J. K. Hall, B. Hell, O. B. Hestvik, Y. Kristoffersen, C. Marcussen, R. Mohammad, D. Mosher, S. V. Nghiem, M. T. Pedrosa, P. G. Travaglini, and P. Weatherall, The International Bathymetric Chart of the Arctic Ocean (IBCAO) Version 3.0, Geophysical Research Letters, doi: 10.1029/2012GL052219.2012
18. Lamont Doherty Earth Observatory (LDEO) Ridge Multibeam Synthesis Project http://www.ldeo.columbia.edu/research/marine-geology-geophysics/ridge-multibeam-bathymetry-synthesis
19. Law of the Sea Data, UNCLOS, Article 76, extended continental shelf, foot of slope, multibeam bathymetry, seafloor mapping, Center for Coastal and Ocean Mapping/Joint Hydrographic Center (CCOM/JHC), University of New Hampshire, USA
20. Multibeam bathymetry data from the US National Geophysical Data Center, http://www.ngdc.noaa.gov/mgg/bathymetry/multibeam.html. Quality controlled ('cleaned') version of the data set, supplied by Scripps Institution of Oceanography (SIO).
21. NOAA National Geophysical Data Center, U.S. Great Lakes Bathymetry, http://www.ngdc.noaa.gov/mgg/greatlakes/greatlakes.html
22. Ryan, W. B. F., et al. (2009), Global Multi-Resolution Topography synthesis, Geochem. Geophys. Geosyst., 10, Q03014,doi:10.1029/2008GC002332. http://www.marine-geo.org/portals/gmrt/
23. Sandwell, D. T., W. H. F. Smith, Marine gravity anomaly from Geosat and ERS 1 satellite altimetry, Journal of Geophysical Research, v. 102 , No. B5, p. 10039-10054, 1997. ftp://topex.ucsd.edu/pub/global_grav_1min http://topex.ucsd.edu/sandwell/publications/71.pdf
24. Schenke, Hans Werner; Hinze, Heinrich; Dijkstra, Semme J; Hoppmann, Bernd; Niederjasper, Fred; Schöne, Tilo (1997): AWI Bathymetric Chart of the Weddell Sea, Antarctica (BCWS). Alfred Wegener Institute, Helmholtz Center for Polar and Marine Research, Bremerhaven, doi:10.1594/PANGAEA.708081
25. Shuttle Radar Topography Mission (SRTM) http://www2.jpl.nasa.gov/srtm/
26. Smith, W. H. F., and D. T. Sandwell, Global seafloor topography from satellite altimetry and ship depth soundings, Science, v. 277, p. 1957-1962, 26 Sept. 1997

ftp://topex.ucsd.edu/pub/global_topo_1min http://topex.ucsd.edu/sandwell/publications/74.pdf
27. Smith, W. H. F., and P. Wessel, Gridding with continuous curvature splines in tension, Geophysics, vol. 55 (3), pp. 293-305, 1990
28. SRTM30 data and documentation — http://www2.jpl.nasa.gov/srtm/cbanddataproducts.html
29. SOJN04MV - bathymetry data collected by R/V Melville cruise SOJN04MV in the Indian Ocean in 1997.
30. Spinoccia, M. and Buchanan, C., 2011. XYZ marine bathymetric grids of survey GA-2476 WA Margins onboard the RV Sonne. Geoscience Australia, Canberra
31. SRTM30 data and documentation: http://www2.jpl.nasa.gov/srtm/cbanddataproducts.html
32. Wessel, P., and W. H. F. Smith, Free software helps map and display data, EOS Trans. Amer. Geophys. U., vol. 72 (41), pp. 441, 445-446, 1991 http://gmt.soest.hawaii.edu/
33. Zitellini, N., Gràcia, E., Matias, L., Terrinha, P., Abreu, M.A., DeAlteriis, G., Henriet, J.P., Dañobeitia, J.J., Masson, D.G., Mulder, T., Ramella, R., Somoza, L. and Diez, S. (2009). The quest for the Africa-Eurasia plate boundary west of the Strait of Gibraltar: Earth and Planetary Science Letters, 280, (1-4), 13-50. (doi:10.1016/j.epsl.2008.12.005)
Annex A — Data sets included in the GEBCO_2014 Grid
The following is a list of the data sets used to update the original GEBCO_08 base grid, upon which the GEBCO_2014 Grid is based.
1. The Caspian Sea 2. The Black Sea 3. Weddell Sea Grid 4. International Bathymetric Chart of the Southern Ocean (IBCSO) v1 5. International Bathymetric Chart of the Arctic Ocean (IBCAO) v3 6. European Marine Observation and Data Network (EMODnet) Bathymetry
2013 data set 7. Baltic Sea Bathymetry Database 8. Australian Bathymetry and Topography Grid, June 2009 9. Global Multi-Resolution Topography (GMRT) Synthesis 10. Japan Coast Guard Grid for the North Western Pacific Ocean region 11. Bathymetry of the South China Sea Region 12. Bathymetry of the North American Great Lakes 13. North Atlantic Ocean, Gulf of Cadiz region 14. Indian Ocean region off Sumatra 15. Waters off the west coast of Africa 16. Northwest European Continental Shelf region 17. South Pacific Ocean, Coral Sea region

18. Waters off Chile
Annex A.1
The Caspian Sea
Included in — version 20100927 of the GEBCO_08 Grid, released in October 2010
Data set coverage — 46° 40' E - 54° 2' E; 36° 31' N - 47° N
Data set provider — Dr. John K. Hall, Geological Survey of Israel (retired)
Information on the data set is given below and further details can be found in — Bathymetric compilations of the seas around Israel I: The Caspian and Black Seas, J.K. Hall, Geological Survey of Israel, Current Research, Vol. 13, December 2002.
Data set information
The grid was generated from over 280,000 bathymetric soundings and points digitised from bathymetric contours, taken from 107 Russian hydrographic charts, on a Mercator projection relative to the Pulkovo 1942 datum.
The digitised soundings and contour data were converted from Mercator projection co-ordinates to x,y,z values on a Universal Transverse Mercator (UTM) projection on the WGS 84 datum using Global Mapper software.
The data, in UTM co-ordinates, were then gridded using a kriging algorithm from Golden Software Inc's Surfer software package using 100 m interval grid spacing.
The 100 m interval UTM grid was converted to geographic co-ordinates, with grid intervals of three arc seconds. Due to the Caspian Sea's lower sea level stand, 28 m was added to the depths in the grid, using Global Mapper software. The data set was supplied to GEBCO at this resolution.
The grid was sampled to 30 arc second intervals using 'grdsample' from Generic Mapping Tools (GMT).
Quality control checks were carried out on the data set, looking for artefacts in the gridded data. This was done by comparing the gridded data set with the source sounding and contour data. Any artefacts noted in the grid were removed.

The Caspian Sea grid was then incorporated into the GEBCO_08 Grid. This was achieved by firstly extracting grid points (largely land elevation) from the GEBCO_08 Grid that fell outside the geographic coverage of the Caspian Sea grid. These data were converted to ASCII x,y,z values. An ASCII x,y,z file of data values was created from the Caspian Sea grid. The data sets were combined and then gridded at 30 arc second intervals using 'Surface' (a minimum tension surface gridding algorithm) from GMT.
Annex A.2
The Black Sea
Included in — version 20100927 of the GEBCO_08 Grid, released in October 2010
Data set coverage — 26° E - 41° 46' E; 40° N - 47° 15'N
Data set provider — Dr. John K. Hall, Geological Survey of Israel (retired)
Information on the data set is given below and further details can be found in — Bathymetric compilations of the seas around Israel I: The Caspian and Black Seas, J.K. Hall, Geological Survey of Israel, Current Research, Vol. 13, December 2002.
Data set information
The grid was generated from over 196,400 bathymetric soundings digitised from Russian hydrographic charts, on a Mercator projection, relative to the WGS 72 and Pulkovo 1942 datums.
The data were gridded using a kriging algorithm from Golden Software Inc's Surfer software package. The gridded was converted to geographic co-ordinates (relative to WGS 84) and the data set was supplied to GEBCO at 15 arc second grid intervals.
The Black Sea grid was sampled to 30 arc second intervals using 'grdsample' from Generic Mapping Tools (GMT).
Quality control checks were carried out on the data set, looking for artefacts in the gridded data. This was done by comparing the gridded data set with the source sounding data. Any artefacts noted in the grid were removed.
The Black Sea grid was then incorporated into the GEBCO_08 Grid. This was achieved by firstly extracting grid points (largely land elevation) from the GEBCO_08 Grid that fell outside the geographic coverage of the Black Sea grid. These data were converted to ASCII x,y,z values. An ASCII x,y,z file of data

values was created from the Black Sea grid and the data sets were combined and then gridded at 30 arc second intervals using 'Surface' (a minimum tension surface gridding algorithm) from GMT.
Annex A.3
The Weddell Sea - Bathymetric Chart of the Weddell Sea (BCWS)
Included in — version 20100927 of the GEBCO_08 Grid, released in October 2010
Data set coverage — 60° S to 66° S; 75° W to 15° W, 66° S to 79° S; 65° W to 2° E
Data set provider — Alfred Wegener Institute for Polar and Marine Research (AWI), http://www.awi.de
Data source and gridding method
The bathymetric grid was generated at AWI from the contours of the Bathymetric Chart of the Weddell Sea (BCWS). Further information about the BCWS is given below.
Bathymetric Chart of the Weddell Sea (BCWS)
The BCWS is a 1:1,000,000 map series plus a 1:3,000,000 master sheet based on compilations of bathymetric data in the Weddell Sea. This data set consists of bathymetric contour lines, generally at interval of 100m, but at 50m in the southern Weddell Sea.
Chief Editor— Dr. Hans Werner Schenke (AWI)
Publication dates— 1998-2001
Data set Digital Object Identifier (DOI)— doi:10.1594/PANGAEA.708081
Further information about the BCWS is given on AWI's web site.
Grid preparation
The bathymetric contour data from the BCWS were gridded in Mercator projection co-ordinates. Firstly, a Triangulated Irregular Network (TIN) grid was created from the contour lines using the Douglas-Peucker algorithm.

The TIN was converted to a grid with a regular cell spacing using Natural Neighbours interpolation with a cell size of 250m. The grid was then projected from Mercator to geographic coordinates with a cell size of 30 arc-seconds.
Annex A.4
International Bathymetric Chart of the Southern Ocean (IBCSO) version 1
Included in — version 20141103 of the GEBCO_2013 Grid, released in June 2013
Data set coverage — 60° S to 90° S; 180° W to 180° E
Data set provided by — Dipl.-Ing. Jan Erik Arndt, Alfred Wegener Institute, Bremerhaven, Germany, on behalf of the IBCSO team
Data set citation — Arndt, J.E., H. W. Schenke, M. Jakobsson, F. Nitsche, G. Buys, B. Goleby, M. Rebesco, F. Bohoyo, J.K. Hong, J. Black, R. Greku, G. Udintsev, F. Barrios, W. Reynoso-Peralta, T. Morishita, R. Wigley,The International Bathymetric Chart of the Southern Ocean (IBCSO) Version 1.0 - A new bathymetric compilation covering circum-Antarctic waters, Geophysical Research Letters, doi: 10.1002/grl.50413
Link to data source — www.ibcso.org
Data set information
The IBCSO is terrain model for the Southern Ocean area south of 60°S. It has been developed from a database of multibeam and single beam echo sounder data points — digitised soundings from nautical charts and regional bathymetric compilations. The data have been contributed by more than 30 institutions from 15 countries. Land and ice shelf regions are based on the Bedmap2 data sets.
Using the Bedmap2 data sets, the IBCSO grid is made available with a choice for land/ice shelf areas of either 'surface elevation', giving the surface elevation including ice cover, or 'bedrock', giving the surface elevation without ice cover. The data set is available at 500m grid intervals in Polar Stereographic projection units and also at one arc-minute grid intervals in geographic latitude and longitude co-ordinates.
Further information about the development of the data set can be found on the IBCSO web site — www.ibcso.org . Further information about Bedmap2 can be found on their web site — www.antarctica.ac.uk//bas_research/our_research/az/bedmap2/

For consistency with the Arctic region, the 'surface elevation' version of the IBCSO grid was used to update the GEBCO grid.
The one arc minute interval version of the IBCSO grid was sampled to 30 arc seconds using GMT's grdsample software routine. The data were edge matched with the existing GEBCO grid at 60° S using a feather blending routine, part of the Global Mapper v11.01 software package.
Annex A.5
International Bathymetric Chart of the Arctic Ocean (IBCAO) version 3
Included in — version 20141103 of the GEBCO_2013 Grid, released in June 2013
Data set coverage — 90° N to 64° N; 180° W to 180° E
Data set provided by — Prof. Martin Jakobsson, Stockholm University, Sweden, on behalf of the IBCAO team
Citation — Jakobsson, M., L. A. Mayer, B. Coakley, J. A. Dowdeswell, S. Forbes, B. Fridman, H. Hodnesdal, R. Noormets, R. Pedersen, M. Rebesco, H.-W. Schenke, Y. Zarayskaya A, D. Accettella, A. Armstrong, R. M. Anderson, P. Bienhoff, A. Camerlenghi, I. Church, M. Edwards, J. V. Gardner, J. K. Hall, B. Hell, O. B. Hestvik, Y. Kristoffersen, C. Marcussen, R. Mohammad, D. Mosher, S. V. Nghiem, M. T. Pedrosa, P. G. Travaglini, and P. Weatherall, The International Bathymetric Chart of the Arctic Ocean (IBCAO) Version 3.0, Geophysical Research Letters, doi: 10.1029/2012GL052219.
Link to data source — www.ibcao.org
Data set information
This version of the IBCAO represents the largest improvement in the data set since its release in 1999. It includes new data sets collected by the circum-Arctic nations, opportunistic data collected from fishing vessels and data acquired from US Navy submarines and research ships of various nations. The grid has been developed on 500 metre spacing and built using an improved gridding algorithm.
The IBCAO grid was edge matched with the existing GEBCO grid at 64° N using a feather blending routine, part of the Global Mapper v11.01 software package.
Annex A.6
European Marine Observation and Data Network (EMODnet) Bathymetry 2013 data set

Included in — version 20141103 of the GEBCO_2014 Grid, released in November 2014
Data set coverage — 63° N to 30° N; 34° W to 37° E
Data set provided by— EMODnet bathymetry team
Link to data source — www.emodnet-hydrography.eu
Data set information
EMODnet is a project, funded by the European Commission, to bring together marine data into interoperable, continuous and publicly available data sets for complete maritime basins in European waters.
As part of this project, the EMODnet bathymetry portal provides bathymetry data in the form of Digital Terrain Models (DTM) for selected maritime basins. The DTMs have been produced from collated bathymetric data sets integrated into a central DTM. There are 'holes' in the central DTM in regions where high resolution data sets are not available.
Through a collaboration between GEBCO and the EMODnet bathymetry team, the 2013 version of the EMODnet grid has been incorporated into the GEBCO global grid using the 'remove-restore' procedure. This has resulted in a continuous grid with gaps filled by the existing GEBCO grid.
This combined grid has been included in GEBCO_2014 and forms the basis of future EMODnet bathymetric grid development work.
It is planned to continue the GEBCO and EMODnet collaboration work for future development of these data sets.
Annex A.7
Baltic Sea Bathymetry Database (BSBD)
Included in — version 20141103 of the GEBCO_2014 Grid, released in November 2014
Data set coverage — Baltic Sea region 66° N to 53° N 41'; 7° 45' E to 30° E
Data set provided by— BSBD team
Attribution— Baltic Sea Hydrographic Commission, 2013, Baltic Sea Bathymetry Database version 0.9.3. Downloaded from http://data.bshc.pro/

Link to data source — http://data.bshc.pro
Data set information
The Baltic Sea Bathymetry Database is the result of an effort to generate and make available a bathymetric grid for the Baltic Sea region using data from Baltic Sea countries' national hydrographic offices under the umbrella of the Baltic Sea Hydrographic Commission.
The data set was sampled to the same grid size interval as the GEBCO grid and then the 'remove-restore' procedure was used to include the grid into the GEBCO global grid.
Annex A.8
Australian Bathymetry and Topography Grid, June 2009
Included in — version 20141103 of the GEBCO_2014 Grid, released in November 2014
Data set coverage — 8° 30' S to 50° S; 105° E to 163° E
Data set provided by— Geoscience Australia
Data set identifier — Australia New Zealand Land Information Council (ANZLIC) unique identifier — ANZCW0703013116
Data set information
The bathymetric portion of the grid has been developed from a number of data sources, including
• Multibeam data • Fairsheets (1:250,000 Series) • Laser Airborne Depth Sounder (LADS) data • ETOPO2v2g bathymetric grid
The sections of the grid based on Multibeam, Fairsheets and LADS data sets, mainly in near shore regions, have been used to update the GEBCO grid.
The data have been included into the GEBCO grid using the remove-restore procedure.
Annex A.9
Global Multi-Resolution Topography (GMRT) synthesis

Included in — version 20141103 of the GEBCO_2014 Grid, released in November 2014
Data set coverage — The GMRT synthesis contributes data in all ocean regions, the grid cells based on this data set are identified in the GEBCO Source Identifier Grid
Data set provided by — The Lamont-Doherty Earth Observatory (LDEO) of Columbia University
Link to data source — http://www.marine-geo.org/portals/gmrt/
Data set information
The LDEO GMRT synthesis makes use of sonar data collected by scientists and institutions worldwide, merging them into a single continuously updated compilation of high resolution seafloor topography. The synthesis began in 1992 as the Ridge Multibeam Synthesis (RMBS), was expanded to include multibeam bathymetry data from the Southern Ocean and now includes other bathymetry from throughout the global and coastal oceans.
LDEO have provided over 9,600 data tiles from their GMRT tile set (400 m resolution) for updating GEBCO's grid.
The data from the GMRT tile set has been included into the GEBCO grid using the remove-restore procedure.
Annex A.10
Japan Coast Guard Grid for the North Western Pacific Ocean region
Included in — version 20141103 of the GEBCO_2014 Grid, released in November 2014
Data set coverage — North Western Pacific Ocean area: 17°N - 43°N; 126°E - 160°E
Data set provided by — Japan Oceanographic Data Center (JODC) of the Japan Coast Guard
Data set information
The grid for this area was originally developed at 9 arc-second intervals and based on the following source data
• (1) Land data

• (2) Multibeam data from the Japan Coast Guard • (3) A pre-prepared 500m interval grid based on measured sounding data: J-
EGG500 grid JODC-Expert Grid data for Geographic -500mwww.jodc.go.jp/data_set/jodc/jegg_intro.html
• (4) GEBCO_08
The gridded data set for the area was developed by combining the above data sources using the 'surface' gridding algorithm from Generic Mapping Tools (GMT). The areas where no multibeam data exists were filled with the J-EGG500 data (3) or with GEBCO_08 grid data (4) for the areas outside of the coverage of (3).
To avoid 'steps' between these data sets during the gridding process, 'buffering zones' were created around data sets (2) and (3). The buffer zone width was 1 km for the contact between (2) and (3), and 2 km for the contacts between (2) and (4) or between (3) and (4).
The values in the 'buffering zones' are interpolated, based on values from the surrounding gridded data sets. In addition, the relatively small data gaps between land values and multibeam data or within the area based on multibeam data were interpolated from nearby data.

The final grid was generated by sampling to 30 arc seconds using 'grdsample' from Generic Mapping Tools.
The data set has been included into the GEBCO grid using the remove-restore procedure.
Annex A.11
Bathymetry of the South China Sea region
Included in — version 20141103 of the GEBCO_2014 Grid
Data set coverage — 101° E - 122° E; 5° S - 25° N
Data set provided by — The East Asia Hydrographic Commission
Data set information
Data extracted from Electronic Navigation Charts (ENCs) has been provided by the East Asia Hydrographic Commission for part of the South China Sea region to help update the GEBCO_08 Grid. This is as part of an initiative to help improve GEBCO's grids in shallower water regions, bathymetry.
Over 12,200 soundings were provided with over 8,570 in waters of a depth of 200 m or shallower. The data set also contains bathymetric contours.
Sounding point data and data from some of the bathymetric contours in the depth region of 200 m and shallower were used to update the GEBCO grid. These data were combined with data extracted from the GEBCO grid (in regions deeper than 200 m) and gridded using an adjustable tension continuous curvature surface gridding algorithm, i.e. 'surface' from Generic Mapping Tools (GMT).
Annex A.12
Bathymetry of the North American Great Lakes
Included in — version 20141103 of the GEBCO_2014 Grid
Data set coverage — 50° N - 40° 30' N; 93° W - 76° W
Link to data source — http://www.ngdc.noaa.gov/mgg/greatlakes/
Data set information
The bathymetry data for the North American Great Lakes are made available as part of program managed by NGDC and rely on the cooperation of NOAA/Great
Lakes Environmental Research Laboratory, NOAA/National Ocean Service, the Canadian Hydrographic Service, other agencies and academic laboratories.
The gridded data files were downloaded from the US NGDC's web site (from the above link) with the 'Mean Sea Level' export option selected.
The data were included into the GEBCO grid using an adjustable tension continuous curvature surface gridding algorithm, i.e. 'surface' from Generic Mapping Tools (GMT).
Annex A.13
North Atlantic Ocean, Gulf of Cadiz region — SWIM project "Earthquake and Tsunami hazards of active faults at the South West Iberian Margin: deep structure, high-resolution imaging and paleoseismic signature"
Included in — version 20141103 of the GEBCO_2014 Grid
Data set coverage — 38° 36' N - 34° N; 13° 30' W - 5° 5' W
Data set citation — The quest for the Africa-Eurasia plate boundary west of the Strait of Gibraltar: Zitellini, N., Gràcia, E., Matias, L., Terrinha, P., Abreu, M.A., DeAlteriis, G., Henriet, J.P., Dañobeitia, J.J., Masson, D.G., Mulder, T., Ramella, R., Somoza, L. and Diez, S. (2009). Earth and Planetary Science Letters, 280, (1-4), 13-50. (doi:10.1016/j.epsl.2008.12.005)
Data set information
The grid was developed for a study into the missing link in the plate boundary between Eurasia and Africa in the central Atlantic — carried out under the European Science Foundation (ESF) EuroMargins SWIM project.
The data set was compiled from 19 bathymetric surveys carried out between 2000 and 2006 by teams belonging to 14 research institutions from seven European countries.
The data were included into the GEBCO grid using the remove-restore procedure.
Annex A.14
Indian Ocean region off Sumatra
Included in — version 20141103 of the GEBCO_2014 Grid
Data set coverage — 7° N - 1° 30' N; 92° E - 96° E

Data set acknowledgement — Timothy J. Henstock, Lisa C. McNeill, and David R. Tappin, Seafloor morphology of the Sumatran subduction zone: Surface rupture during megathrust earthquakes? Geology, v34, pp485-488, 2006
The data were gathered by HMS Scott, a UK Royal Navy survey vessel, during marine scientific research coordinated by the Joint Environment Directorate of Defence Intelligence. The Royal Navy, British Geological Survey, National Oceanography Centre (Southampton), United Kingdom Hydrographic Office and the Government of Indonesia cooperated on this project.
Link to data source — http://www.noc.soton.ac.uk/gg/sumatra/hms_scott.html
Data set information
During January and February 2005, the Royal Navy survey vessel HMS Scott conducted bathymetric mapping of part of the Sumatra subduction zone. The work concentrated on the southern 450 km of the 2004 rupture (within Indonesian waters) and on the deeper water around the trench and the slope of the accretionary wedge, although some coverage of the Aceh forearc basin was also obtained.
The resultant bathymetric grid produced from the survey data has been included in the GEBCO Grid.
The data were included into the GEBCO grid using the remove-restore procedure.
Annex A.15
Waters off the West Coast of Africa
Included in — version 20141103 of the GEBCO_2014 Grid
Data set coverage — 34° N - 8° N; 18° 30' W - 7° 30' W
Data set provider — Olex AS, Norway
Data source
Olex is a Norwegian company that produces mapping and visualisation software, largely based on data collected from fishing vessels. They have made a sub-sample of their global marine soundings database available to GEBCO. This data set is largely focussed in shallower water areas, mainly in the North Atlantic Ocean region.
Data set information
Data from the Olex data set within a bounding polygon, the extent of the dense Olex data coverage in this area, were used to update the GEBCO grid.
These data were combined with data from the existing GEBCO grid, outside of the polygon region, using an adjustable tension continuous curvature surface gridding algorithm, i.e. 'surface' from Generic Mapping Tools (GMT).
Annex A.16
Northwest European Continental Shelf region
Included in — version 20141103 of the GEBCO_2014 Grid
Data set coverage — 64° N - 45° N; 10° W - 15° 30' E
Data set information
Olex is a Norwegian company that produces mapping and visualisation software, largely based on data collected from fishing vessels. They have made a sub-sample of their global marine soundings database available to GEBCO. This data set is largely focussed in shallower water areas, mainly in the North Atlantic Ocean region.
Data from the Olex data set, for the Northwest European Continental Shelf region, have been used in the development of previous versions of the GEBCO grid. However, the coverage of the Olex data used stopped at 0° E. The method used to include the data in the GEBCO grid also resulted in a line of discontinuity in the data set, see our 'reported bugs' page — http://www.bodc.ac.uk/help_and_hints/errata/gebco/gebco_08.html.
The coverage of the Olex data set has now been extended to — 64° N - 45° N; 10° W - 15° 30' E.
The data were included in the GEBCO grid using the remove-restore procedure.
Annex A.17
South Pacific Ocean, Coral Sea region
Included in — version 20141103 of the GEBCO_2014 Grid
Data set coverage — 187° S to 22° S; 158° E to 162° E
Data set provider — Geoscience Australia (on behalf of the data set originators at the University of Sydney) for data from R/V Southern Surveyor (survey code

SS2012_v06) and The Royal Australian Navy, Australian Hydrographic Service for data from hydrographic surveys of the region.
Data set information
At the end of 2012, a scientific cruise (survey code SS2012_v06) led by the University of Sydney in the Coral Sea region of the South Pacific Ocean reported that an island, "Sandy Island", shown in some digital data sets, including the GEBCO_08 Grid, did not exist. Further information can be found on GEBCO's web site.
It is believed that the island has been incorporated into terrain models such as GEBCO via its inclusion in digital coastline data sets.
In order to correct this error in the GEBCO_08 Grid, the scientists who collected the data kindly made it available to GEBCO, via Geoscience Australia. To further help with this update work, the Australian Hydrographic Office provided data from some of their survey data sets for the region.
Using these data sources, this area of the GEBCO_08 Grid has been updated. The update work was carried out by gridding the newly supplied data using GMT's 'surface' gridding algorithm.
Annex A.18
Waters off Chile
Included in — version 20141103 of the GEBCO_2014 Grid
Data set coverage — 18° S to 55° S; 77° W to 67° W
Data set provider — Chilean Navy Oceanographic and Hydrographic Service
Data set information
Data extracted from Electronic Navigation Charts (ENCs) has been provided for waters off Chile to help update the GEBCO Grid. This is as part of an initiative to help improve GEBCO's grids in shallower water regions.
From this data set, over 81,000 soundings were used to update the GEBCO grid. These data were combined with other trackline survey data in the region and gridded using an adjustable tension continuous curvature surface gridding algorithm, i.e. 'surface' from Generic Mapping Tools (GMT).