geat rthquakes and r ea global seismic networks for this event and enabled more detailed seismologi...
TRANSCRIPT

Seismological Research Letters Volume 81, Number 6 November/December 2010 965doi: 10.1785/gssrl.81.6.965
great earthquakes and global seismic networksCharles J. Ammon, Thorne Lay, and David W. Simpson
Charles J. Ammon,1 Thorne Lay,2 and David W. Simpson3
INTRODUCTION
Seismologists often jest that “the best way to stop earthquakes is to deploy seismic stations.” The laborious effort to install seismometers to record signals from earthquakes or to pursue targeted investigations of Earth’s structure is sometimes con-founded by the vagaries of earthquake occurrence, which is decidedly nonuniform in space and time. Of course, this often proves to be more of an anxiety than a reality, and most efforts, especially those employing multiyear installations, succeed in gathering valuable seismic data. One of the most gratify-ing examples of success is provided by the deployment of the Incorporated Research Institutions for Seismology–National Science Foundation–U.S. Geological Survey (IRIS-NSF-USGS) Global Seismographic Network (GSN) in parallel with numerous international deployments of broadband seismom-eters in the Federation of Digital Seismic Networks (FDSN). Between about 1982 and 2004, global installations of high-quality broadband digital seismometers proliferated, replacing the obsolete analog systems of the World-Wide Standardized Seismograph Network and upgrading sparse institutional observatories and first-generation digital networks. While deployments of important additional stations continue, by 2004 the GSN had achieved its basic design goals: openly available continuous broadband data from roughly 130 sta-tions providing real-time global coverage and large dynamic range (Butler et al. 2004). Then the 26 December 2004 great Sumatra-Andaman earthquake (Mw 9.2) occurred—the first event to exceed magnitude 9 since the 1964 Alaska earthquake. The GSN and FDSN provided unprecedented global seismic recordings for this event and enabled more detailed seismologi-cal investigation than was possible for any prior event of such size (e.g., Lay et al. 2005; Bilek et al. 2007). Those same glob-ally distributed seismic stations have gathered data from a sub-stantial number of great earthquakes; from 2001 to 2010, there have been 18 events with MS ≥ 8 and 13 events with Mw ≥ 8, whereas over the previous century an average of only six or seven events with M ≥ 8 occurred per decade (for simplicity,
we use “M” to represent a mixture of MS and MW values). In the time interval of construction of the GSN (1986–2004), the number of global events/decade with Mw ≥ 7.5 has more than doubled and has increased by a factor of 6.5 for Mw ≥ 8.0. So, perhaps the new seismic adage should be “if you build it, they will come.” Long-term maintenance and operation of the high-quality global digital seismic networks will certainly provide invaluable scientific data far into the future.
GLOBAL SEISMIC INSTRUMENTATION
Global seismograph observatories with fairly standardized seis-mometer designs began to be deployed early in the 20th cen-tury. Over several decades modest “global” networks of 20–30 stations were deployed in the Milne networks supported by the British Association for the Advancement of Science (Adams 1989) and at Jesuit observatories (Udías and Stauder 1996), along with a handful of additional national efforts, primarily at universities and other research center observatories (Figure 1). Prompted by the initiation of underground nuclear test-ing in 1957, a significant expansion of the global seismic sta-tion coverage occurred when the World-Wide Standardized Seismograph Network (WWSSN) was constructed from 1960 to 1966 (Oliver and Murphy 1971). In addition to establishing standardized observatory sensors and recording equipment, the WWSSN pioneered a system for global data exchange by trans-ferring all seismograms to microfilm. Full or partial collections of the WWSSN archive were established at the USGS, Lamont, Caltech, and other research centers. While primitive by modern data center standards, the relatively easy access to data from the analog WWSSN network provided critical observations that contributed to the plate tectonics revolution of the 1960s (e.g., Isacks et al. 1968) and the advent of quantitative ground motion modeling that commenced in earnest in the 1970s.
As technology advanced, digital seismic recording and broadband sensors became the standard for global seismo-graph installations. The French GEOSCOPE program of the Institut de Physique du Globe de Paris began its deployment of broadband digital seismic stations in 1982 (Roult et al. 2010), and from 1986 onward the IRIS-NSF-USGS Global Seismic Network (GSN) built upon earlier digital seismic networks such as the Seismic Research Observatories (SRO), Auxiliary Seismic Research Observatories (ASRO), digital WWSSN conver-sions, and International Deployment of Accelerometers (IDA)
1. Department of Geosciences, Pennsylvania State University, University Park
2. Department of Earth and Planetary Sciences, University of California, Santa Cruz
3. Incorporated Research Institutions for Seismology, Washington, DC

966 Seismological Research Letters Volume 81, Number 6 November/December 2010
networks (Hutt et al. 2002). In concert, many parallel efforts deploying permanent broadband digital seismographs for global earthquake observations joined together in 1986 to form the Federation of Digital Seismic Networks (FDSN; http://www.fdsn.org/historical/). Especially in areas of high earthquake hazard, there has also been a rapidly expanding incorporation of modern digital broadband systems in regional earthquake monitoring networks. The substantial increase in global seismo-graphic observatories is interesting to juxtapose against the cor-responding 110 years of global great earthquake activity.
GREAT AND DEADLY EARTHQUAKE HISTORY
Most practicing seismologists today were not active in the field back in 1964 (many were not even born), and from about 1970 to 2000 there were not very many great earthquakes for seismologists to investigate (Figure 2). However, during the past decade, as the GSN approached its design goal, the situ-ation changed. Numerous great earthquakes have occurred and have produced ground motions that truly exercised the bandwidth and dynamic range of modern recording systems. Figure 2 indicates the large fluctuations in great earthquake
activity throughout the age of seismic instrumentation, but those seismologists attentive to the occurrence of great earth-quakes cannot help but have noticed the increased rate over the past decade relative to the prior few decades. The relative paucity of great earthquakes between the 1964 Alaska and the 2004 Sumatra-Andaman earthquakes corresponds to the time interval between completion of the WWSSN and build-up of the GSN (Figure 3). Activity was relatively low while the WWSSN declined and the number of new GSN and FDSN stations was low. When the 2004 Sumatra-Andaman event struck, hundreds of broadband digital stations were operating, and for the recent February 27, 2010 great Chile earthquake (Mw = 8.8), data from more than 1,200 global broadband sta-tions were readily retrievable within a few hours after the event through the IRIS Data Management Center (http://www.iris.edu/data/) and other network data-center portals. The near real-time sharing of so much data is a major step forward from the film chip exchange pioneered by the WWSSN and a sig-nificant asset for global earthquake monitoring and interna-tional science. Figure 4 illustrates the quality of data recorded for some of the great earthquakes of the past few years; cor-responding motions on WWSSN analog recordings would
MILNE Seismographic Network Jesuit Network—1930s
The WorldWide Standardized Seismographic Network
The IRIS/USGS Global Seismographic Network Federation of Digital Seismographic Networks (FDSN)
GEOSCOPE
▲ Figure 1. Global seismic networks with relatively standardized instrumentation deployed from 1900 to 2010, which have provided seismic recordings for research on earthquakes and Earth structure (Simpson 2002).

Seismological Research Letters Volume 81, Number 6 November/December 2010 967
have been several meters in amplitude with all details off-scale. In addition, the WWSSN response was severely limited in bandwidth, especially in the ultra-long-period range that is so important for full characterization of great earthquakes. This is a tremendous advance from the data availability of the pre-ceding century of seismic observations of great earthquakes.
The increase in global high-magnitude seismic activity over the past few decades is intriguing. In response to the inevitable questions about increasing earthquake frequency following any clustering of newsworthy events, seismologists have tradi-tionally insisted that global averages of seismic activity remain stable when considered over sufficient space and time intervals. Any consideration of long-term seismicity behavior is com-plicated by non-uniformity of catalogs, magnitude measures, and numbers of stations operating over time. Nonetheless, it is interesting that a total of 18 shallow earthquakes with MS ≥ 8.0 occurred globally during 2001–2010, about triple the average number (6 ± 3) per decade over the prior century, as tabulated in the catalog of Pacheco and Sykes (1992). Although
it is preferable to use seismic moment magnitude (Mw) when possible, for events prior to 1970 there are very few direct determinations of seismic moment by procedures comparable to those for recent events. Several researchers have attempted to approximate seismic moments for early events based on various estimates of event size (e.g., Pacheco and Sykes 1992; Engdahl and Villaseñor 2002), allowing comparisons with the trend found using MS to be performed.
The PAGER-CAT catalog of Allen et al. (2009) presents a composite list of events with “Preferred Magnitudes” taken from scaled Mw estimates based on MS or MB or informa-tion about historical rupture dimensions for earlier events (largely drawn from the catalogs of Pacheco and Sykes 1992 and Engdahl and Villaseñor 2002), and direct Mw measure-ments from Harvard and Global centroid-moment-tensor (CMT) inversions for recent events. Figure 5 indicates that for PAGER-CAT Preferred Magnitudes (M), the occurrence of great earthquakes over the past century has indeed been vari-able on the decadal timescale. The trend is not as pronounced
1900 1910 1920 1930 1940 1950 1960 1970 1980 1990 2000 20107.5
8
8.5
9
9.5
Year
Magnitude
Chile
AlaskaSumatra
ChileKamchatka
▲ Figure 2. Time line of great (seismic magnitude ≥ 8.0) earthquakes from 1900 to 2010 from the PAGER-CAT of Allen et al. (2009) updated using the Harvard and Global Centroid Moment Tensor catalogs through the 2010 Chile (Mw 8.8) event. Note the relative dearth of great events from 1970 to 2000.
WWSSNMilne / JesuitIRIS GSN
NSF/USGS
1900 1910 1920 1930 1940 1950 1960 1970 1980 1990 2000 2010
8.0
8.5
9.0
9.5
Year
Mag
nitu
de
1900 1910 1920 1930 1940 1950 1960 1970 1980 1990 2000 20100
50
100
150
200
Year
Num
ber o
f Sta
tions
▲ Figure 3. Time line of deployment of recent major global seismic networks relative to the largest global earthquakes from 1900 to 2010. The Milne/Jesuit global networks information is approximate. Note the relative surge of great earthquakes during the last decade apparent here for magnitudes ≥ 8.0.

968 Seismological Research Letters Volume 81, Number 6 November/December 2010
as for MS, but the number of M ≥ 8.0 events in the past decade (13) is about a factor of two higher than the average number per decade during the preceding 10 decades (6.8 ± 2.3).
Figure 6 shows M versus time for events with M ≥ 7.5 from 1900 to 2010, along with running estimates of the number of events per 10-year interval for M ≥ 7.5, 7.7, and 8.0. The most recent decade of activity includes a higher total number of events per decade for each magnitude threshold than experi-enced in any 10-year interval throughout the prior century. The recent increase is more prominent as the magnitude threshold is increased from 7.5 to 8.0, but vanishes if one uses a lower threshold such as M ≥ 7.0.
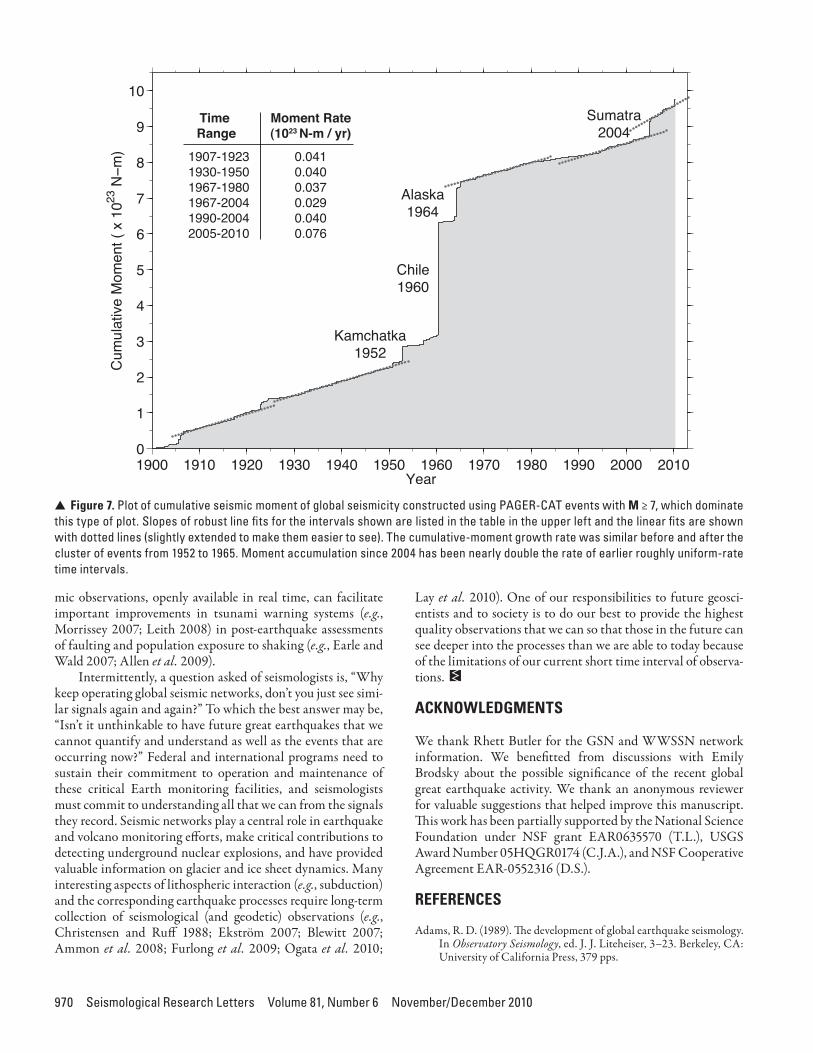
While the recent activity levels relative to pre-1970 are sub-ject to ambiguities associated with the catalog magnitudes, the increase in global seismicity that occurred during the deploy-ment of the GSN (1986–2004) is robust, as it involves only rigorous Mw determinations and a complete global catalog. The large number of great events during the past six years has produced a steeper overall slope of cumulative seismic moment versus time relative to any comparable time interval during the preceding century that does not include a giant event (Figure 7).
We leave it for other investigations to explore any statisti-cal significance of the recent vigorous great earthquake activ-ity (e.g., Brodsky 2009) and attendant analysis of effects of magnitude threshold and clustering of events. The point in this article is that the establishment of extensive global digital seismographic networks, many of which have open data access, came about in time to capture substantial numbers of seismic recordings of the recent surge of great events (and, of course, thousands upon thousands of smaller events as well).
-101
26 DEC 2004 (9.2)POHA-10-Z
-101
28 MAR 2005 (8.6)POHA-10-Z
-101
12 SEP, 2007 (8.5)POHA-10-Z
-101
27 FEB 2010 (8.8)ABPO-10-Z
0 1000 2000 3000 4000 5000
Time After Origin (s)
Dis
pla
cem
en
t (c
m)
▲ Figure 4. Broadband vertical ground displacement records from the STS-2 instruments at stations POHA and ABPO for the four largest earthquakes of the past decade. The upper three traces are for events along Sumatra in 2004, 2005, and 2007, while the lower trace is for the 2010 Chile earthquake. The Mw of each event is indicated after the date. Amplitudes were adjusted to equalize for effects of source depth and 360-s period Rayleigh wave radiation pattern. All the signals were recorded about 100° distance from the sources. These signals would have all been far off-scale for almost all earlier generations of analog recording systems.
1900 1910 1920 1930 1940 1950 1960 1970 1980 1990 2000 20100
2
4
6
8
10
12
14
Year
Num
ber o
f Gre
at E
arth
quak
es P
er D
ecad
e
▲ Figure 5. Number of events with M ≥ 8.0 per decade interval from 1901 to 2010 in the PAGER-CAT (Allen et al. 2002) updated with CMT Mw values to 2010. The most recent decade had 13 Mw ≥ 8.0 events, whereas the average number per decade in the preceding 10 decades was 6.8 ± 2.3. Figure 6 shows running mean number of events per decade for various size thresholds and annual sampling, for which this is just a single realization.

Seismological Research Letters Volume 81, Number 6 November/December 2010 969
SCIENTIFIC OPPORTUNITY AND LONG-TERM COMMITMENT
With more great earthquakes in the last decade than in the previous two decades and an increase in the number of high dynamic range broadband seismographic stations to more than 1,000 that contribute openly accessible seismograms, seis-mologists have been provided with a substantial collection of ground motions for investigations of large earthquake rupture processes as well as Earth structure. The global seismological networks constitute a multi-application tool for monitoring Earth processes that is central to addressing major scientific challenges in Earth sciences (Forsyth et al. 2009).
The situation would be different had the international seismological communities not undertaken the global broad-band digital seismic network deployments and not established procedures to facilitate the open distribution of data. The importance of the observations collected by these networks to basic research on earthquake processes is self-evident. The soci-etal importance of recording and archiving signals from future destructive earthquakes is reinforced by considering Figure 8, which summarizes the loss of life from earthquakes since 1900 tabulated in the PAGER-CAT (Allen et al. 2009). The perceptible increase in occurrence of deadly earthquakes that is accompanying growth of human population in earthquake-prone regions is clear (Hough and Bilham 2006). Global seis-
1900 1910 1920 1930 1940 1950 1960 1970 1980 1990 2000 20107.5
8
8.5
9
9.5
Year
Mag
nitu
de
20
30
40
50
60Running average number of earthquakes per decade
10
20
30
40
1900 1910 1920 1930 1940 1950 1960 1970 1980 1990 2000 20100
5
10
15
Year
M ≥ 7.5
M ≥ 8.0
M ≥ 7.7
Num
ber ≥
7.5
/dec
ade
Num
ber ≥
7.7
/dec
ade
Num
ber ≥
8.0
/dec
ade
▲ Figure 6. Top panel: Timeline of M ≥ 7.5 events from 1900 to 2010 based on the USGS PAGER-CAT (Allen et al. 2002) updated to include events through early 2010. Lower three panels: Running average number of events per 10-year interval, centered on each point, for PAGER catalog preferred magnitudes (M) ≥ 7.5 (upper), 7.7 (middle), and 8.0 (lower). The recent decade has experienced numbers of large and great earthquakes exceeding those of early times in the seismological record. Note the dramatic increase in activity from a dramatic lull in the mid-1980s to a substantially active present.
970 Seismological Research Letters Volume 81, Number 6 November/December 2010
mic observations, openly available in real time, can facilitate important improvements in tsunami warning systems (e.g., Morrissey 2007; Leith 2008) in post-earthquake assessments of faulting and population exposure to shaking (e.g., Earle and Wald 2007; Allen et al. 2009).
Intermittently, a question asked of seismologists is, “Why keep operating global seismic networks, don’t you just see simi-lar signals again and again?” To which the best answer may be, “Isn’t it unthinkable to have future great earthquakes that we cannot quantify and understand as well as the events that are occurring now?” Federal and international programs need to sustain their commitment to operation and maintenance of these critical Earth monitoring facilities, and seismologists must commit to understanding all that we can from the signals they record. Seismic networks play a central role in earthquake and volcano monitoring efforts, make critical contributions to detecting underground nuclear explosions, and have provided valuable information on glacier and ice sheet dynamics. Many interesting aspects of lithospheric interaction (e.g., subduction) and the corresponding earthquake processes require long-term collection of seismological (and geodetic) observations (e.g., Christensen and Ruff 1988; Ekström 2007; Blewitt 2007; Ammon et al. 2008; Furlong et al. 2009; Ogata et al. 2010;
Lay et al. 2010). One of our responsibilities to future geosci-entists and to society is to do our best to provide the highest quality observations that we can so that those in the future can see deeper into the processes than we are able to today because of the limitations of our current short time interval of observa-tions.
ACKNOWLEDGMENTS
We thank Rhett Butler for the GSN and WWSSN network information. We benefitted from discussions with Emily Brodsky about the possible significance of the recent global great earthquake activity. We thank an anonymous reviewer for valuable suggestions that helped improve this manuscript. This work has been partially supported by the National Science Foundation under NSF grant EAR0635570 (T.L.), USGS Award Number 05HQGR0174 (C.J.A.), and NSF Cooperative Agreement EAR-0552316 (D.S.).
REFERENCES
Adams, R. D. (1989). The development of global earthquake seismology. In Observatory Seismology, ed. J. J. Liteheiser, 3–23. Berkeley, CA: University of California Press, 379 pps.
1900 1910 1920 1930 1940 1950 1960 1970 1980 1990 2000 20100
1
2
3
4
5
6
7
8
9
10
Year
Cum
ulat
ive
Mom
ent (
x 1
023 N
−m)
Chile1960
Kamchatka1952
Sumatra2004
Alaska1964
Time Moment Rate Range (1023 N-m / yr)
1907-1923 0.0411930-1950 0.0401967-1980 0.0371967-2004 0.0291990-2004 0.0402005-2010 0.076
▲ Figure 7. Plot of cumulative seismic moment of global seismicity constructed using PAGER-CAT events with M ≥ 7, which dominate this type of plot. Slopes of robust line fits for the intervals shown are listed in the table in the upper left and the linear fits are shown with dotted lines (slightly extended to make them easier to see). The cumulative-moment growth rate was similar before and after the cluster of events from 1952 to 1965. Moment accumulation since 2004 has been nearly double the rate of earlier roughly uniform-rate time intervals.

Seismological Research Letters Volume 81, Number 6 November/December 2010 971
Allen, T. I., K. D. Marano, P. S. Earle, and D. J. Wald (2009). PAGER-CAT: A composite earthquake catalog for calibrating global fatal-ity models. Seismological Research Letters 80, 57–62; doi:10.1785/gssrl.81.6.57.
Ammon, C. J., H. Kanamori, and T. Lay (2008). A great earthquake doublet and seismic stress transfer cycle in the central Kuril islands. Nature 451(7,178), 561–564.
Bilek, S. L., K. Satake, and K. Sieh (2007). Introduction to the special issue on the 2004 Sumatra-Andaman earthquake and the Indian Ocean tsunami. Bulletin of the Seismological Society of America 97 (1), S1–S5.
Blewitt, G. (2007). GPS and space-based geodetic methods. In Treatise on Geophysics, vol. 3: Geodesy, ed. T. Herring, 351–390. Amsterdam: Elsevier; doi:10.1016/B978-044452748-6.00058-4.
Brodsky, E. (2009). The 2004–2008 worldwide superswarm. Eos, Transactions, American Geophysical Union 90 (52), Fall Meeting Supplement, abstract S53B-06.
Butler, R., T. Lay, K. Creager, P. Earle, K. Fischer, J. Gaherty, G. Laske, B. Leith, J. Park, M. Ritzwoller, J. Tromp, and L. Wen (2004). The global seismic network surpasses its design goal. Eos, Transactions, American Geophysical Union 85 (23), 225, 228–229.
Christensen, D., and L. Ruff (1988). Seismic coupling and outer rise earthquakes. Journal of Geophysical Research 93, 13,421–13,444.
Earle, P. S., and D. J. Wald (2007). PAGER—Rapid Assessment of an Earthquake’s Impact. USGS Fact Sheet 2007–3101, 4 pps.
Ekström, G. (2007). Global Seismicity: Results from systematic wave-form analyses, 1976–2005. In Treatise on Geophysics, vol. 4: Earthquake Seismology, ed. H. Kanamori, 473–481. Amsterdam: Elsevier; doi:10.1016/B978-044452748-6.00077-8.
Engdahl, E. R., and A. Villaseñor (2002). Global seismicity: 1900–1999. In International Handbook of Earthquake and Engineering Seismology, part A, ed. W. H. K. Lee, P. Jennings, C. Kisslinger, and H. Kanamori, 665–690. Amsterdam and Boston: Academic Press.
Forsyth, D. W., T. Lay, R. C. Aster, and B. Romanowicz (2009). Grand challenges for seismology. Eos, Transactions, American Geophysical Union 90, 361–362.
Furlong, K. P., T. Lay, and C. J. Ammon (2009). A great earthquake rupture across a rapidly evolving three-plate boundary. Science 324 (5,924), 226–229.
Hough, S. E., and R. G. Bilham (2006). After the Earth Quakes: Elastic Rebound on an Urban Planet. New York: Oxford University Press, 336 pps.
Hutt, C. R, H. F. Bolton, and L. G. Holcomb (2002). U.S. contribution to digital global seismograph networks. In International Handbook of Earthquake and Engineering Seismology, part A, ed. W. H. K.
Lee, H. Kanamori, P. C. Jennings, and C. Kisslinger, 319–332. Amsterdam and Boston: Academic Press.
Isacks, B., J. Oliver, and L. R. Sykes (1968). Seismology and the new global tectonics. Journal of Geophysical Research 73, 5,855–5,899.
Lay, T., H. Kanamori, C. J. Ammon, M. Nettles, S. N. Ward, R. C. Aster, S. L. Beck, S. L. Bilek, M. R. Brudzinski, R. Butler, H. R. DeShon, G. Ekstrom, K. Satake, and S. Sipkin (2005). The great Sumatra-Andaman earthquake of 26 December 2004. Science 308 (5,725), 1,127–1,133.
Lay, T., C. J. Ammon, H. Kanamori, L. Rivera, K. Koper, and A. Hutko (2010). The 2009 Samoa-Tonga great earthquake triggered doublet. Nature 466 (7,309), 964–968.
Leith, W. (2008). Challenges ahead for the global seismographic net-work. Seismological Research Letters 79, 155–157.
Morrissey, W. A. (2007). Tsunamis: Monitoring, Detection, and Early Warning Systems. U.S. Congressional Research Service Report for Congress, order code RL32739, 27 pps.
Ogata, Y., and S. Toda (2010). Bridging great earthquake doublets through silent slip: On- and off-fault aftershocks of the 2006 Kuril Island subduction earthquake toggled by a slow slip on the outer rise normal fault of the 2007 great earthquake. Journal of Geophysical Research 115; doi:10.1029/2009JB006777.
Oliver, J., and L. Murphy (1971). WWSSN: Seismology’s global network of observing stations. Science 174, 254–261.
Pacheco, J. F., and L. R. Sykes (1992). Seismic moment catalog of large shallow earthquakes, 1900 to 1989. Bulletin of the Seismological Society of America 82, 1,306–1,349.
Roult, G., J.-P. Montagner, B. Romanowicz, M. Cara, D. Rouland, R. Pillet, J.-F. Karczewski, Jeannot Trampert, L. Rivera, E. Stutzmann, Jean-Claude Lépine, A. Maggi (2010). The GEOSCOPE Program: Progress and challenges during the past 30 years. Seismological Research Letters 81 (4), 427–452.
Simpson, David W. (2002). National, international and global coordina-tion in observational seismology. Seismological Research Letters 73, 218 (abstract).
Udías, A., and W. Stauder (1996). The Jesuit contribution to seismology. Seismological Research Letters 67, 10–19.
The Pennsylvania State UniversityDepartment of Geosciences
440 Deike BuildingUniversity Park, Pennsylvania 16802 U.S.A.
[email protected](C. A.)
1900 1910 1920 1930 1940 1950 1960 1970 1980 1990 2000 2010103
104
105
106
Year
Num
ber o
f Fat
aliti
es
▲ Figure 8. Estimated loss of life from individual deadly earthquakes from 1900 to 2010. Sources are the PAGER-CAT (Allen et al. 2002) and the many references therein. There are many more events that have claimed fewer than 1,000 lives.