ge 2q 2017 earnings - the digital industrial company · pdf filewe delivered $0.28 of...
TRANSCRIPT

“GE’s portfolio enables us to execute in a slow-growth, volatile environment, with Industrial segment organic revenues* +2% and orders +6%. We delivered $0.28 of Industrial operating + Verticals earnings per share* and reported Industrial operating margin* +10 bps. GE’s Industrial CFOA*-b) for the second quarter was $1.5 billion, significantly better than first quarter and better than second quarter last year. We expect cash flow to continue to improve throughout the year. We’ve reduced our Industrial structural costs* year to date by $670 million and we are on track to meet or exceed our $1 billion cost reduction target for the year. The global scale of the Company, along with our ability to innovate industry-leading products and services, will help us navigate the current environment and unlock productivity across our businesses and markets.” —Jeff Immelt, Chairman and CEO
GE 2Q 2017 EARNINGS JULY 21, 2017
EARNINGS/EPS REVENUES MARGINS
CONTINUING OPS/EPS-c)
NET EARNINGS/EPS-c)
TOTAL REVENUES
INDUSTRIAL MARGIN
$1.3BEPS: $0.15, (58)%
$1.2BEPS: $0.13, (57)%
$29.6B(12)%
8.5%(760) bps
INDUSTRIAL OPERATING + VERTICALS/EPS
INDUSTRIAL SEGMENT ORGANIC REVENUES
INDUSTRIAL OP MARGIN-a)
$2.4BEPS: $0.28, (45)%
$28.0B+2%
13.2%+10 bps
-a) Excludes non-operating pension, gains and restructuring & other-b) Excludes deal taxes and GE Pension Plan funding -c) Amounts attributable to GE common shareowners* Non-GAAP measure
We present both GAAP and non-GAAP measures to provide investors with additional information. The non-GAAP measures are focused on our ongoing operations and may exclude the effects of gains/losses on business dispositions, non-operating pension costs, and restructuring & other charges. See pages 8-13 for reconciliations between these GAAP and non-GAAP measures and the specific reasons why we provide these non-GAAP measures.
GAAP
NON- GAAP
Continuing operations EPS (GAAP) of $0.15, (58)% Industrial operating + Verticals EPS (non-GAAP) of $0.28, (45)%
Industrial segment revenues $28.0 billion (2)%, +2% organically*; Industrial operating profit-a) $3.6 billion (1)%, +4% organically* Backlog $327 billion +2% vs 2Q’16; Orders +6%
2Q’17 GE CFOA of $3.2B; $1.5 billion Industrial CFOA*-b) YTD returned $7.8 billion in cash to shareowners; $3.6 billion through buyback
BACKLOGORDERSGE CFOA CASH TO SHAREOWNERS
1H'171H'16
$3.6B
$14.1
$(0.3)
(67)%
GE CapitalDividend
IndustrialCFOA*
$10.8B
$11.0 $4.0
$0.5
$(0.7)$(0.2)
Deal Taxes/Pension
2Q’172Q’16
$28.3B
$14.1
$13.7 $14.2
$26.6B
+6%
Equipment Services
$12.9
2Q’172Q’16
$326.8B
$233.3 $242.6
$86.3$319.6B
+2%
Equipment Services
$84.2
$7.8B1H’17
$3.6 BILLION THROUGH BUYBACK
GE 2Q 2017 EARNINGS
-b)

GE 2Q 2017 EARNINGS JULY 21, 2017
2
“We’re looking forward to a smooth transition of the CEO position on August 1, when John Flannery becomes CEO. Since the outcome of the Board’s succession planning process was announced in June, John and I have been spending a lot of time together discussing this unique role and what he can expect in the months and years ahead. I am as confident as ever that John is going to be an outstanding leader of this great company.” — Jeff Immelt, Chairman and CEO
INDUSTRIAL DEAL HIGHLIGHTS
POWER:
• 9 HA gas turbine orders in 2Q with 33 units in backlog
• Won largest Power Services agreement in history - more than $3 billion - to support a large volume of power in Algeria with Sonelgaz, including 68 Advanced Gas Path upgrades (AGPs)
• Won $200+ million fast power and digital services contracts to supply power for up to 15% of the population of Angola
RENEWABLE ENERGY:
• Won contract to supply Invenergy’s 300MW wind farm in Texas with 120 GE2.5-116 turbines
• First large-scale pilot of Digital Hydro Plant with Fortum in Sweden
OIL & GAS:
• Combined Baker Hughes and GE Oil & Gas to create BHGE in 3Q; world’s first fullstream oil and gas company
• Deal for subsea production systems, equipment, and service for Mozambique offshore development project, making us the first subsea supplier in Mozambique and East Africa
HEALTHCARE:
• Announced 10-year collaboration with Partners Healthcare to develop Artificial Intelligence medical platforms and solutions
• Signed agreement with Humber River Hospital in Canada to install a digital Command Center, using predictive analytics to target improved clinical, operational and financial outcomes
• Announced deal to install India’s first-ever FlexFactory to expand biologics production in Hyderabad, India
TRANSPORTATION:
• Signed letter of intent with Ministry of Transportation and Egyptian National Railways worth $575 million for locomotives and 15-year agreement for parts and technical support
ENERGY CONNECTIONS:
• Introduced world’s first battery-gas turbine hybrid system with Southern California Edison
• India’s first-ever LV5 solar inverter solution deployment with 25-year long-term service agreement; largest executed order to date in the country
AVIATION:
• Announced more than $31 billion-a) in orders and commitments at the Paris Air Show
• Signed $3 billion long-term CFM LEAP-1B engine-b) support agreement with VietJet Air
• Awarded $1 billion contract from U.S. Army for 2,500 T700 engines
GLOBAL GROWTH:
• Signed $15 billion of MoUs and agreements for industrial project development and capacity building in Saudi Arabia
CURRENT, POWERED BY GE:
• Announced second phase of JPMorgan Chase collaboration to reduce their global energy consumption by 15% across 4,500 branches
• Signed UK’s largest LED deal with Sainsbury’s to switch to 100% LED lighting in its stores
DIGITAL:
• Signed Predix digital solutions agreement with Saudi Ministry of Health to enable digital hospitals
• IDC MarketScape recognized GE Digital as a leader in IoT solutions in its IDC MarketScape: IoT Platform 2017 Vendor Assessment
GE CAPITAL HIGHLIGHTS
-a) Valued at list price-b) LEAP is a trademark of CFM International. CFM is a 50/50 joint venture between GE and Snecma.
• Enabled $3.9 billion of Industrial orders in 2Q’17 • Launched infrastructure funds in global aircraft and
Japanese renewable energy sectors• $2 billion of dividends paid to GE in 2Q’17; $4 billion
dividends paid to GE YTD• GE Capital Exit Plan sales substantially complete
GE CAPITAL EARNINGS (LOSS) WALK 2Q’17
Verticals $544MMOther Continuing $(716)MM
Capital $(172)MMDiscontinued operations $(152)MM
GE Capital $(324)MM

GE 2Q 2017 EARNINGS JULY 21, 2017
3
Related charts are now posted on our website for your review prior to the call.
www.ge.com/investor
Second-quarter results webcast at 8:30 a.m. ET today
In this document, we sometimes use information derived from consolidated financial data but not presented in our financial statements prepared in accordance with U.S. generally accepted accounting principles (GAAP). Certain of these data are considered “non-GAAP financial measures” under the U.S. Securities and Exchange Commission rules. These non-GAAP financial measures supplement our GAAP disclosures and should not be considered an alternative to the GAAP measure. We have referred to:
• Industrial operating and GE Capital earnings (loss) from continuing operations and EPS
• Industrial operating + Verticals earnings and EPS• Industrial operating profit margin (excluding certain items)• Industrial organic operating profit • Industrial structural costs • Industrial segment organic revenues • Industrial cash flows from operating activities (Industrial CFOA)
and Industrial CFOA excluding deal taxes and GE Pension Plan funding
• 2017 operating framework including 2017 Industrial operating + Verticals EPS targets
The reasons we use these non-GAAP financial measures and the reconciliation to their most directly comparable GAAP financial measure are included in the accompanying tables, which include information integral to assessing the Company’s financial position, operating performance and cash flows.
NOTE: Amounts reported in billions in graphs within this release are computed based on the amounts in millions. As a result, the sum of the components reported in billions may not equal the total amount reported in billions due to rounding. Certain columns and rows within the tables may not add due to the use of rounded numbers. Percentages presented are calculated from the underlying numbers in millions.
Caution Concerning Forward-Looking Statements:This document contains “forward-looking statements” — that is, statements related to future events that by their nature address matters that are, to different degrees, uncertain. For details on the uncertainties that may cause our actual future results to be materially different than those expressed in our forward-looking statements, visit http://www.ge.com/investor-relations/disclaimer-caution-concerning-forward-looking-statements as well as our annual reports on Form 10-K and quarterly reports on Form 10-Q. We do not undertake to update our forward-looking statements. This document also includes certain forward-looking projected financial information that is based on current estimates and forecasts. Actual results could differ materially.
General Electric Capital Corporation (GECC) was merged into GE in 2015 and our financial services business is now operated by GE Capital Global Holdings LLC (GECGH). In this document, we refer to GECC and GECGH as “GE Capital.” We refer to the industrial businesses of the Company including GE Capital on an equity basis as “GE.” “GE (ex-GE Capital)” and /or “Industrial” refer to GE excluding GE Capital.
Investor Contact: Matt Cribbins, 617.443.3400 [email protected]
Media Contact: Jennifer Erickson, 646.682.5620 [email protected]
GE’s Investor Relations website at www.ge.com/investor-relations and our corporate blog at www.gereports.com, as well as GE’s Facebook page and Twitter accounts, and other social media, including @GE_Reports, contain a significant amount of information about GE, including financial and other information for investors. GE encourages investors to visit these websites from time to time, as information is updated and new information is posted.

GE 2Q 2017 EARNINGS JULY 21, 2017
4
GENERAL ELECTRIC COMPANYCONDENSED STATEMENT OF EARNINGS (LOSS) (UNAUDITED) Consolidated GE(a) Financial Services (GE Capital)Three months ended June 30 2017 2016 V% 2017 2016 V% 2017 2016 V%Revenues and other incomeSales of goods and services $27,239 $28,028 (3)% $ 27,293 $ 28,150 (3)% $ 33 $ 29 14 %Other income 298 3,150 300 3,054 — —GE Capital earnings (loss) from continuing operations — — (172) (600) — —GE Capital revenues from services 2,022 2,316 — — 2,413 2,742
Total revenues and other income 29,558 33,494 (12)% 27,421 30,604 (10)% 2,446 2,771 (12)%Costs and expensesCost of sales 21,793 22,383 21,328 21,958 547 576Selling, general and administrative expenses 4,287 4,883 3,919 4,231 498 733Interest and other financial charges 1,174 1,326 637 567 771 958Investment contracts, insurance losses and
insurance annuity benefits 657 776 — — 682 815Other costs and expenses 133 303 — — 144 313
Total costs and expenses 28,044 29,670 (5)% 25,883 26,756 (3)% 2,641 3,394 (22)%Earnings (loss) from continuing operations
before income taxes 1,515 3,824 (60)% 1,538 3,847 (60)% (195) (623) 69 %Benefit (provision) for income taxes (15) (461) (218) (629) 202 168Earnings (loss) from continuing operations 1,499 3,363 (55)% 1,320 3,218 (59)% 7 (454) FEarnings (loss) from discontinued
operations, net of taxes (146) (541) (152) (544) (146) (541)Net earnings (loss) 1,354 2,823 (52)% 1,167 2,674 (56)% (138) (995) 86 %Less net earnings (loss) attributable to
noncontrolling interests (14) (86) (18) (82) 4 (4)Net earnings (loss) attributable to the Company 1,367 2,908 (53)% 1,185 2,756 (57)% (142) (991) 86 %Preferred stock dividends (182) (152) — — (182) (152)Net earnings (loss) attributable to
GE common shareowners $ 1,185 $ 2,756 (57)% $ 1,185 $ 2,756 (57)% $ (324) $ (1,143) 72 %Amounts attributable to GE common
shareowners:Earnings (loss) from continuing operations $ 1,499 $ 3,363 (55)% $ 1,320 $ 3,218 (59)% $ 7 $ (454) FLess net earnings (loss) attributable
to noncontrolling interests, continuing operations (21) (89) (18) (82) (3) (7)Earnings (loss) from continuing operations
attributable to the Company 1,520 3,452 (56)% 1,338 3,300 (59)% 10 (448) FPreferred stock dividends (182) (152) — — (182) (152)Earnings (loss) from continuing operations
attributable to GE common shareowners 1,338 3,300 (59)% 1,338 3,300 (59)% (172) (600) 71 %Earnings (loss) from discontinued
operations, net of taxes (146) (541) (152) (544) (146) (541)Less net earnings (loss) attributable to
noncontrolling interests, discontinued operations 7 3 — — 7 3Net earnings (loss) attributable to GE
common shareowners $ 1,185 $ 2,756 (57)% $ 1,185 $ 2,756 (57)% $ (324) $ (1,143) 72 %Per-share amounts - earnings (loss) from
continuing operationsDiluted earnings (loss) per share $ 0.15 $ 0.36 (58)%Basic earnings (loss) per share $ 0.15 $ 0.36 (58)%Per-share amounts - net earnings (loss)Diluted earnings (loss) per share $ 0.13 $ 0.30 (57)%Basic earnings (loss) per share $ 0.14 $ 0.30 (53)%Total average equivalent sharesDiluted 8,760 9,187 (5)%Basic 8,671 9,079 (4)%Dividends declared per common share $ 0.24 $ 0.23 4 %
(a) Represents the adding together of all affiliated companies except GE Capital, which is presented on a one-line basis.Amounts may not add due to rounding. Dollar amounts and share amounts in millions; per-share amounts in dollars."GE Capital" means GE Capital Global Holdings, LLC (GECGH) and its predecessor General Electric Capital Corporation (GECC) and all of their affiliates and associated companies. Separate information is shown for "GE" and "Financial Services (GE Capital)." Transactions between GE and GE Capital have been eliminated from the "Consolidated" column. See Note 1 to the 2016 consolidated financial statements at www.ge.com/ar2016 for further information about consolidation matters.

GE 2Q 2017 EARNINGS JULY 21, 2017
5
GENERAL ELECTRIC COMPANYCONDENSED STATEMENT OF EARNINGS (LOSS) (UNAUDITED) Consolidated GE(a) Financial Services (GE Capital)Six months ended June 30 2017 2016 V% 2017 2016 V% 2017 2016 V%Revenues and other income Sales of goods and services $52,467 $53,342 (2)% $ 52,684 $ 53,556 (2)% $ 62 $ 54 15 %Other income 465 3,158 437 3,146 — — GE Capital earnings (loss) from continuing operations — — (219) (1,492) — — GE Capital revenues from services 4,286 4,838 — — 5,065 5,602
Total revenues and other income 57,219 61,339 (7)% 52,902 55,210 (4)% 5,127 5,656 (9)%Costs and expenses Cost of sales 42,153 42,744 41,302 41,848 1,131 1,164 Selling, general and administrative expenses 8,793 9,491 7,939 8,214 1,073 1,607 Interest and other financial charges 2,313 3,062 1,200 1,007 1,582 2,389 Investment contracts, insurance losses and
insurance annuity benefits 1,291 1,417 — — 1,318 1,486 Other costs and expenses 323 562 — — 358 581
Total costs and expenses 54,872 57,276 (4)% 50,441 51,069 (1)% 5,461 7,227 (24)%Earnings (loss) from continuing operations
before income taxes 2,346 4,063 (42)% 2,461 4,141 (41)% (334) (1,571) 79 %Benefit (provision) for income taxes (31) (284) (361) (793) 330 509 Earnings (loss) from continuing operations 2,315 3,779 (39)% 2,100 3,349 (37)% (4) (1,062) FEarnings (loss) from discontinued
operations, net of taxes (385) (849) (392) (852) (388) (849) Net earnings (loss) 1,931 2,930 (34)% 1,708 2,496 (32)% (392) (1,911) 79 %Less net earnings (loss) attributable to
noncontrolling interests (90) (207) (96) (199) 6 (8) Net earnings (loss) attributable to the Company 2,020 3,137 (36)% 1,804 2,695 (33)% (398) (1,903) 79 %Preferred stock dividends (216) (441) — — (216) (441) Net earnings (loss) attributable to
GE common shareowners $ 1,804 $ 2,695 (33)% $ 1,804 $ 2,695 (33)% $ (614) $ (2,344) 74 %Amounts attributable to GE common
shareowners: Earnings (loss) from continuing operations $ 2,315 $ 3,779 (39)% $ 2,100 $ 3,349 (37)% $ (4) $ (1,062) FLess net earnings (loss) attributable
to noncontrolling interests, continuing operations (97) (210) (96) (199) (1) (11) Earnings (loss) from continuing operations
attributable to the Company 2,412 3,989 (40)% 2,196 3,548 (38)% (3) (1,051) FPreferred stock dividends (216) (441) — — (216) (441) Earnings (loss) from continuing operations
attributable to GE common shareowners 2,196 3,548 (38)% 2,196 3,548 (38)% (219) (1,492) 85 %Earnings (loss) from discontinued
operations, net of taxes (385) (849) (392) (852) (388) (849) Less net earnings (loss) attributable to
noncontrolling interests, discontinued operations 7 3 — — 7 3 Net earnings (loss) attributable to GE
common shareowners $ 1,804 $ 2,695 (33)% $ 1,804 $ 2,695 (33)% $ (614) $ (2,344) 74 %Per-share amounts - earnings (loss) from
continuing operations Diluted earnings (loss) per share $ 0.25 $ 0.38 (34)% Basic earnings (loss) per share $ 0.25 $ 0.39 (36)% Per-share amounts - net earnings (loss) Diluted earnings (loss) per share $ 0.20 $ 0.29 (31)% Basic earnings (loss) per share $ 0.21 $ 0.29 (28)% Total average equivalent shares Diluted 8,789 9,281 (5)% Basic 8,695 9,179 (5)% Dividends declared per common share $ 0.48 $ 0.46 4 % (a) Represents the adding together of all affiliated companies except GE Capital, which is presented on a one-line basis.Amounts may not add due to rounding. Dollar amounts and share amounts in millions; per-share amounts in dollars."GE Capital" means GE Capital Global Holdings, LLC (GECGH) and its predecessor General Electric Capital Corporation (GECC) and all of their affiliates and associated companies. Separate information is shown for "GE" and "Financial Services (GE Capital)." Transactions between GE and GE Capital have been eliminated from the "Consolidated" column. See Note 1 to the 2016 consolidated financial statements at www.ge.com/ar2016 for further information about consolidation matters.
GE 2Q 2017 EARNINGS JULY 21, 2017
6
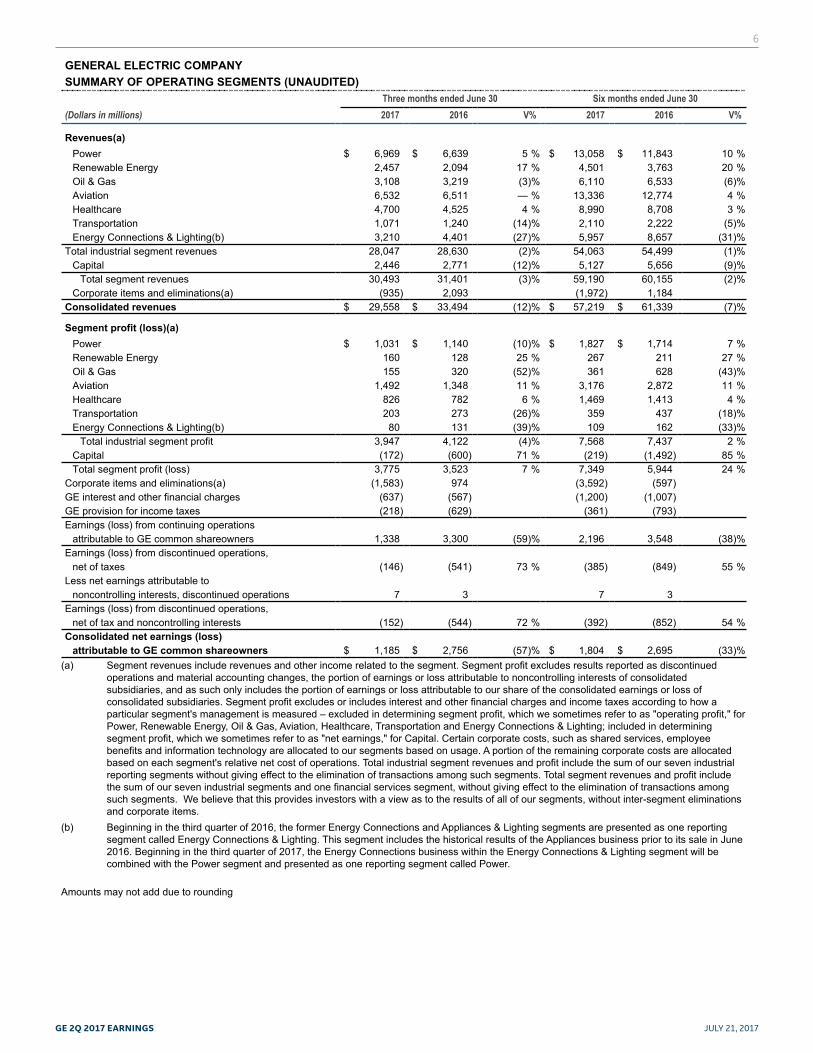
GENERAL ELECTRIC COMPANYSUMMARY OF OPERATING SEGMENTS (UNAUDITED) Three months ended June 30 Six months ended June 30(Dollars in millions) 2017 2016 V% 2017 2016 V%
Revenues(a) Power $ 6,969 $ 6,639 5 % $ 13,058 $ 11,843 10 %Renewable Energy 2,457 2,094 17 % 4,501 3,763 20 %Oil & Gas 3,108 3,219 (3)% 6,110 6,533 (6)%Aviation 6,532 6,511 — % 13,336 12,774 4 %Healthcare 4,700 4,525 4 % 8,990 8,708 3 %Transportation 1,071 1,240 (14)% 2,110 2,222 (5)%Energy Connections & Lighting(b) 3,210 4,401 (27)% 5,957 8,657 (31)%
Total industrial segment revenues 28,047 28,630 (2)% 54,063 54,499 (1)%Capital 2,446 2,771 (12)% 5,127 5,656 (9)%
Total segment revenues 30,493 31,401 (3)% 59,190 60,155 (2)%Corporate items and eliminations(a) (935) 2,093 (1,972) 1,184
Consolidated revenues $ 29,558 $ 33,494 (12)% $ 57,219 $ 61,339 (7)%
Segment profit (loss)(a) Power $ 1,031 $ 1,140 (10)% $ 1,827 $ 1,714 7 %Renewable Energy 160 128 25 % 267 211 27 %Oil & Gas 155 320 (52)% 361 628 (43)%Aviation 1,492 1,348 11 % 3,176 2,872 11 %Healthcare 826 782 6 % 1,469 1,413 4 %Transportation 203 273 (26)% 359 437 (18)%Energy Connections & Lighting(b) 80 131 (39)% 109 162 (33)%
Total industrial segment profit 3,947 4,122 (4)% 7,568 7,437 2 %Capital (172) (600) 71 % (219) (1,492) 85 %Total segment profit (loss) 3,775 3,523 7 % 7,349 5,944 24 %
Corporate items and eliminations(a) (1,583) 974 (3,592) (597)GE interest and other financial charges (637) (567) (1,200) (1,007)GE provision for income taxes (218) (629) (361) (793)Earnings (loss) from continuing operations
attributable to GE common shareowners 1,338 3,300 (59)% 2,196 3,548 (38)%Earnings (loss) from discontinued operations,
net of taxes (146) (541) 73 % (385) (849) 55 %Less net earnings attributable to
noncontrolling interests, discontinued operations 7 3 7 3Earnings (loss) from discontinued operations,
net of tax and noncontrolling interests (152) (544) 72 % (392) (852) 54 %Consolidated net earnings (loss)
attributable to GE common shareowners $ 1,185 $ 2,756 (57)% $ 1,804 $ 2,695 (33)%(a) Segment revenues include revenues and other income related to the segment. Segment profit excludes results reported as discontinued
operations and material accounting changes, the portion of earnings or loss attributable to noncontrolling interests of consolidated subsidiaries, and as such only includes the portion of earnings or loss attributable to our share of the consolidated earnings or loss of consolidated subsidiaries. Segment profit excludes or includes interest and other financial charges and income taxes according to how a particular segment's management is measured – excluded in determining segment profit, which we sometimes refer to as "operating profit," for Power, Renewable Energy, Oil & Gas, Aviation, Healthcare, Transportation and Energy Connections & Lighting; included in determining segment profit, which we sometimes refer to as "net earnings," for Capital. Certain corporate costs, such as shared services, employee benefits and information technology are allocated to our segments based on usage. A portion of the remaining corporate costs are allocated based on each segment's relative net cost of operations. Total industrial segment revenues and profit include the sum of our seven industrial reporting segments without giving effect to the elimination of transactions among such segments. Total segment revenues and profit include the sum of our seven industrial segments and one financial services segment, without giving effect to the elimination of transactions among such segments. We believe that this provides investors with a view as to the results of all of our segments, without inter-segment eliminations and corporate items.
(b) Beginning in the third quarter of 2016, the former Energy Connections and Appliances & Lighting segments are presented as one reporting segment called Energy Connections & Lighting. This segment includes the historical results of the Appliances business prior to its sale in June 2016. Beginning in the third quarter of 2017, the Energy Connections business within the Energy Connections & Lighting segment will be combined with the Power segment and presented as one reporting segment called Power.
Amounts may not add due to rounding

GE 2Q 2017 EARNINGS JULY 21, 2017
7
GENERAL ELECTRIC COMPANYCONDENSED STATEMENT OF FINANCIAL POSITION (UNAUDITED)
Consolidated GE(a) Financial Services (GECapital)
June 30, December 31, June 30, December 31, June 30, December 31,(Dollars in billions) 2017 2016 2017 2016 2017 2016AssetsCash and marketable securities(b) $ 84.0 $ 92.4 $ 14.4 $ 10.7 $ 69.6 $ 81.8Receivables 21.4 24.1 11.7 12.7 — —Inventories 22.8 22.4 22.8 22.3 0.1 0.1GE Capital financing receivables - net 12.1 12.2 — — 24.7 26.0Property, plant & equipment - net 50.2 50.5 19.6 19.1 31.5 32.2Receivable from GE Capital (debt assumption) — — 48.2 58.8 — —Investment in GE Capital — — 20.7 24.7 — —Goodwill & intangible assets 89.3 86.9 86.6 84.2 2.6 2.7Contract assets 28.9 25.2 28.9 25.2 — —Other assets 34.7 35.0 20.0 18.7 24.0 25.4Assets of businesses held for sale 4.1 1.7 3.8 1.6 — —Assets of discontinued operations 7.9 14.8 — — 7.9 14.8Total assets $ 355.5 $ 365.2 $ 276.8 $ 277.9 $ 160.5 $ 183.0Liabilities and equityBorrowings(c) $ 134.4 $ 136.2 $ 81.9 $ 79.3 $ 102.9 $ 117.3Investment contracts, insurance liabilities and
insurance annuity benefits 26.5 26.1 — — 27.0 26.5Non-current compensation and benefits 42.6 43.8 41.6 42.8 1.0 1.0Other liabilities 70.9 73.8 73.4 74.9 7.6 9.0Liabilities of businesses held for sale 1.2 0.7 1.2 0.7 — —Liabilities of discontinued operations 0.9 4.2 — — 0.9 4.1Redeemable noncontrolling interests 3.2 3.0 3.2 3.0 — —GE shareowners' equity 74.1 75.8 74.1 75.8 20.7 24.7Noncontrolling interests 1.6 1.7 1.3 1.4 0.3 0.3Total liabilities and equity $ 355.5 $ 365.2 $ 276.8 $ 277.9 $ 160.5 $ 183.0
(a) Represents the adding together of all affiliated companies except GE Capital, which is presented on a one-line basis.(b) At June 30, 2017, GE Capital maintained liquidity sources of $36.9 billion that consisted of cash and equivalents of $29.8 billion, high-quality
investments of $6.5 billion and cash and equivalents of $0.5 billion classified as assets of discontinued operations. Additionally, at June 30, 2017, GE has $20 billion of committed unused credit lines. Credit lines maintained at GE Company since December 2015, but can be drawn and lent to GE Capital upon request.
(c) GE Capital borrowings includes commercial paper of $5 billion for both periods ended June 30, 2017, and December 31, 2016.
Amounts may not add due to rounding
"GE Capital" means GE Capital Global Holdings, LLC (GECGH) and its predecessor General Electric Capital Corporation (GECC) and all of their affiliates and associated companies. Separate information is shown for "GE" and "Financial Services (GE Capital)." Transactions between GE and GE Capital have been eliminated from the "Consolidated" column. See Note 1 to the 2016 consolidated financial statements at www.ge.com/ar2016 for further information about consolidation matters.

GE 2Q 2017 EARNINGS JULY 21, 2017
8
GENERAL ELECTRIC COMPANYFinancial Measures That Supplement GAAP
We sometimes use financial measures derived from consolidated financial information but not presented in our financial statements prepared in accordance with U.S. generally accepted accounting principles (GAAP). Certain of these are considered "non-GAAP financial measures" under the U.S. Securities and Exchange Commission rules. The following non-GAAP financial measures supplement our GAAP disclosures and should not be considered an alternative to the GAAP measure.
• Industrial operating and GE Capital earnings (loss) from continuing operations and EPS
• Industrial operating + Verticals earnings and EPS
• Industrial operating profit and operating profit margin (excluding certain items)
• Industrial organic operating profit
• Industrial structural costs
• Industrial segment organic revenues
• Industrial cash flows from operating activities (Industrial CFOA) and Industrial CFOA excluding deal taxes and GE Pension Plan funding
• 2017 operating framework including 2017 Industrial operating + Verticals EPS target
The reasons we use these non-GAAP financial measures and the reconciliations to their most directly comparable GAAP financial measures follow. Certain columns, rows or percentages within these reconciliations may not add or recalculate due to the use of rounded numbers. Totals and percentages presented are calculated from the underlying numbers in millions.
GE 2Q 2017 EARNINGS JULY 21, 2017
9
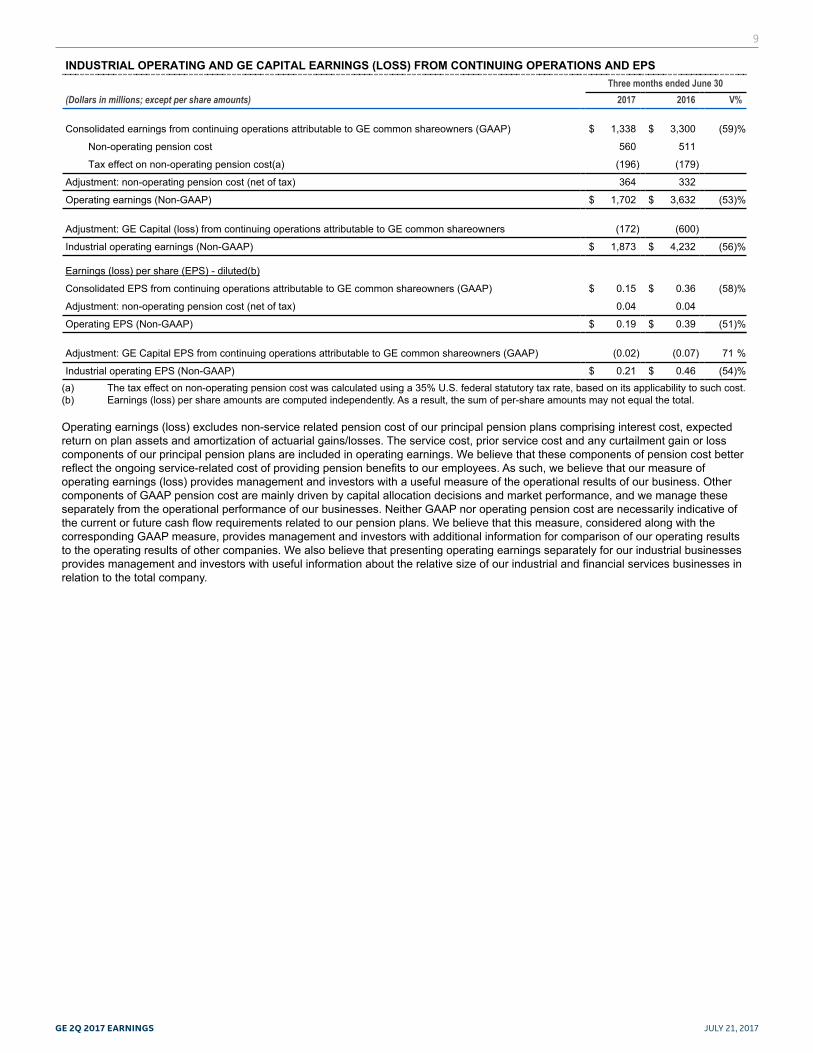
INDUSTRIAL OPERATING AND GE CAPITAL EARNINGS (LOSS) FROM CONTINUING OPERATIONS AND EPS Three months ended June 30(Dollars in millions; except per share amounts) 2017 2016 V%
Consolidated earnings from continuing operations attributable to GE common shareowners (GAAP) $ 1,338 $ 3,300 (59)%
Non-operating pension cost 560 511 Tax effect on non-operating pension cost(a) (196) (179)
Adjustment: non-operating pension cost (net of tax) 364 332 Operating earnings (Non-GAAP) $ 1,702 $ 3,632 (53)%
Adjustment: GE Capital (loss) from continuing operations attributable to GE common shareowners (172) (600) Industrial operating earnings (Non-GAAP) $ 1,873 $ 4,232 (56)%
Earnings (loss) per share (EPS) - diluted(b) Consolidated EPS from continuing operations attributable to GE common shareowners (GAAP) $ 0.15 $ 0.36 (58)%
Adjustment: non-operating pension cost (net of tax) 0.04 0.04 Operating EPS (Non-GAAP) $ 0.19 $ 0.39 (51)%
Adjustment: GE Capital EPS from continuing operations attributable to GE common shareowners (GAAP) (0.02) (0.07) 71 %
Industrial operating EPS (Non-GAAP) $ 0.21 $ 0.46 (54)%
(a) The tax effect on non-operating pension cost was calculated using a 35% U.S. federal statutory tax rate, based on its applicability to such cost.(b) Earnings (loss) per share amounts are computed independently. As a result, the sum of per-share amounts may not equal the total.
Operating earnings (loss) excludes non-service related pension cost of our principal pension plans comprising interest cost, expected return on plan assets and amortization of actuarial gains/losses. The service cost, prior service cost and any curtailment gain or loss components of our principal pension plans are included in operating earnings. We believe that these components of pension cost better reflect the ongoing service-related cost of providing pension benefits to our employees. As such, we believe that our measure of operating earnings (loss) provides management and investors with a useful measure of the operational results of our business. Other components of GAAP pension cost are mainly driven by capital allocation decisions and market performance, and we manage these separately from the operational performance of our businesses. Neither GAAP nor operating pension cost are necessarily indicative of the current or future cash flow requirements related to our pension plans. We believe that this measure, considered along with the corresponding GAAP measure, provides management and investors with additional information for comparison of our operating results to the operating results of other companies. We also believe that presenting operating earnings separately for our industrial businesses provides management and investors with useful information about the relative size of our industrial and financial services businesses in relation to the total company.

GE 2Q 2017 EARNINGS JULY 21, 2017
10
INDUSTRIAL OPERATING + VERTICALS EARNINGS AND EPS Three months ended June 30(Dollars in millions; except per share amounts) 2017 2016 V%
GE Capital earnings (loss) from continuing operations attributable to GE common shareowners (GAAP) $ (172) $ (600) 71 %
Adjustment: GE Capital other continuing earnings (loss) (Other Capital) (716) (1,051)
Verticals earnings(a) $ 544 $ 452 20 %
Industrial operating earnings (Non-GAAP) 1,873 4,232 (56)%
Industrial operating earnings + Verticals earnings (Non-GAAP) $ 2,418 $ 4,684 (48)%
Earnings (loss) per share (EPS) - diluted(b)
GE Capital EPS from continuing operations attributable to GE common shareowners (GAAP) (0.02) (0.07) 71 %
Adjustment: GE Capital other continuing EPS (Other Capital EPS) (0.08) (0.11)
Verticals EPS $ 0.06 $ 0.05 20 %
Industrial operating EPS (Non-GAAP) 0.21 0.46 (54)%
Industrial operating + Verticals EPS (Non-GAAP) $ 0.28 $ 0.51 (45)%
(a) Verticals include businesses expected to be retained (GECAS, Energy Financial Services, Industrial Finance, and run-off Insurance), including allocated corporate after-tax costs of $25 million in both the three months ended June 30, 2017 and 2016.
(b) Earnings (loss) per share amounts are computed independently. As a result, the sum of per-share amounts may not equal the total.
As described above, Verticals represents the GE Capital businesses that we expect to retain. We believe that presenting Industrial operating + Verticals earnings per share amounts provides management and investors with a useful measure to evaluate the performance of the businesses we expect to retain after the disposition of most of our financial services business.

GE 2Q 2017 EARNINGS JULY 21, 2017
11
INDUSTRIAL OPERATING PROFIT AND OPERATING PROFIT MARGIN (EXCLUDING CERTAIN ITEMS)
Three months ended June 30(Dollars in millions) 2017 2016Revenues
GE total revenues and other income $ 27,421 $ 30,604
Less: GE Capital earnings (loss) from continuing operations (172) (600)
GE revenues and other income excluding GE Capital earnings (loss) (Industrial revenues) (GAAP) $ 27,593 $ 31,204
Less: gains on disposals — 3,129
Adjusted Industrial revenues (Non-GAAP) $ 27,593 $ 28,075
Costs GE total costs and expenses $ 25,883 $ 26,756
Less: GE interest and other financial charges 637 567
Industrial costs excluding interest and other financial charges (GAAP) $ 25,247 $ 26,189
Less: non-operating pension cost 560 511
Less: restructuring and other charges 709 1,188
Less: noncontrolling interests 18 82
Adjusted Industrial costs (Non-GAAP) $ 23,960 $ 24,408
Industrial profit (GAAP) $ 2,346 $ 5,015
Industrial margins (GAAP) 8.5% 16.1%
Industrial operating profit (Non-GAAP) $ 3,633 $ 3,667
Industrial operating profit margins (Non-GAAP) 13.2% 13.1%
INDUSTRIAL ORGANIC OPERATING PROFIT
Three months ended June 30(Dollars in millions) 2017 2016 V%
Industrial operating profit (Non-GAAP) $ 3,633 $ 3,667 (1)%
Adjustments: Acquisitions (47) (4)
Business dispositions — 124
Currency exchange rates (18) —
Industrial organic operating profit (Non-GAAP) $ 3,698 $ 3,547 4 %
We have presented our Industrial operating profit and operating profit margin excluding gains, non-operating pension cost, restructuring and other charges, and noncontrolling interests. We believe that Industrial operating profit and operating profit margin adjusted for these items are meaningful measures because they increase the comparability of period-to-period results.
We have also presented Industrial organic operating profit excluding the effects of acquisitions, business dispositions and currency exchange rates. We believe that this measure provides management and investors with a more complete understanding of underlying operating results and trends of established, ongoing operations by excluding the effect of acquisitions, dispositions and currency exchange, which activities are subject to volatility and can obscure underlying trends. We also believe that presenting industrial organic operating profit growth separately provides management and investors with useful information about the trends of our industrial businesses and enables a more direct comparison to other non-financial businesses and companies. Management recognizes that the term "Industrial organic operating profit" may be interpreted differently by other companies and under different circumstances. Although this may have an effect on comparability of absolute percentage growth from company to company, we believe that these measures are useful in assessing trends of the respective businesses or companies and may therefore be a useful tool in assessing period-to-period performance trends.

GE 2Q 2017 EARNINGS JULY 21, 2017
12
INDUSTRIAL STRUCTURAL COSTS Six months ended June 30(Dollars in millions) 2017 2016 V
GE total costs and expenses $ 50,441 $ 51,069 $ (628)
Less: GE interest and other financial charges 1,200 1,007
Industrial costs excluding interest and other financial charges (GAAP) $ 49,241 $ 50,062 $ (821)
Less: Segment variable costs 35,342 35,398
Less: Corporate revenue excluding GE-GE Capital elimination and gains on disposals (944) (985)
Less: Corporate restructuring and other charges 1,728 1,874
Less: Corporate non-operating pension cost 1,138 1,023
Less: Corporate noncontrolling interests — (1)
Industrial structural costs (Non-GAAP) $ 11,976 $ 12,754 $ (778)
Less: acquisitions and dispositions structural costs 278 387
Industrial structural costs excluding acquisitions and dispositions (Non-GAAP) $ 11,698 $ 12,368 $ (670)
Industrial structural costs include segment structural costs excluding the impact of business acquisitions and dispositions, plus total Corporate operating profit excluding non-operating pension cost, restructuring and other charges and gains. To establish a consistent baseline, the 2016 amount excluded Appliances (which the Company sold in the second quarter of 2016), and the 2017 amount will exclude significant transactions such as Baker Hughes, LM Wind Power, and additive manufacturing (Arcam & Concept Laser).
We believe that Industrial structural costs are a meaningful measure as they are broader than selling, general and administrative costs and represent the total structural costs in the Industrial segments and Corporate that generally do not vary with volume.
INDUSTRIAL SEGMENT ORGANIC REVENUES
Three months ended June 30(Dollars in millions) 2017 2016 V%
Industrial segment revenues (GAAP) $ 28,047 $ 28,630 (2)%
Adjustments: Acquisitions 218 14 Business dispositions — 1,239 Currency exchange rates (162) —
Industrial segment organic revenues (Non-GAAP) $ 27,992 $ 27,376 2 %
Organic revenue growth measures revenue growth excluding the effects of acquisitions, business dispositions and currency exchange rates. We believe that this measure provides management and investors with a more complete understanding of underlying operating results and trends of established, ongoing operations by excluding the effect of acquisitions, dispositions and currency exchange, which activities are subject to volatility and can obscure underlying trends. We also believe that presenting organic revenue growth separately for our industrial businesses provides management and investors with useful information about the trends of our industrial businesses and enables a more direct comparison to other non-financial businesses and companies. Management recognizes that the term "organic revenue growth" may be interpreted differently by other companies and under different circumstances. Although this may have an effect on comparability of absolute percentage growth from company to company, we believe that these measures are useful in assessing trends of the respective businesses or companies and may therefore be a useful tool in assessing period-to-period performance trends.

GE 2Q 2017 EARNINGS JULY 21, 2017
13
INDUSTRIAL CASH FLOWS FROM OPERATING ACTIVITIES (INDUSTRIAL CFOA) AND INDUSTRIAL CFOA EXCLUDING DEAL TAXES AND GE PENSION PLAN FUNDING Three months ended June 30 Six months ended June 30(Dollars in millions) 2017 2016 V% 2017 2016 V%
Cash from GE's operating activities (continuing operations), as reported (GAAP) $ 3,215 $ 2,865 12% $ 3,585 $10,767 (67)%
Adjustment: dividends from GE Capital 2,016 3,500 4,016 11,000
Industrial CFOA (Non-GAAP) $ 1,199 $ (635) F $ (431) $ (233) (85)%
Adjustments:
Deal taxes 51 700 51 700
GE Pension Plan funding 217 — 217 —
Industrial CFOA excluding deal taxes and GE Pension Plan funding (Non-GAAP) $ 1,467 $ 65 F $ (163) $ 467 U
We define "Industrial CFOA" as GE's cash from operating activities (continuing operations) less the amount of dividends received by GE from GE Capital. This reflects the effects of intercompany transactions, which include, but are not limited to, the following: GE Capital working capital solutions to optimize GE cash management; GE Capital enabled GE industrial orders; aircraft engines, power equipment and healthcare equipment manufactured by GE that are installed on GE Capital investments, including leased equipment; expenses related to parent-subsidiary pension plans; buildings and equipment leased between GE and GE Capital, including sale-leaseback transactions; information technology (IT) and other services sold to GE Capital by GE; and various investments, loans and allocations of GE corporate overhead costs.
We believe that investors may find it useful to compare GE's operating cash flows without the effect of GE Capital dividends, since these dividends are not representative of the operating cash flows of our industrial businesses and can vary from period-to-period based upon the results of the financial services businesses. We also believe that investors may find it useful to compare Industrial CFOA excluding the effects of deal taxes paid related to the 2016 Appliances business sale, the 2017 Baker Hughes transaction and contributions to our GE Pension Plan. Management recognizes that these measures may not be comparable to cash flow results of companies which contain both industrial and financial services businesses, but believes that this comparison is aided by the provision of additional information about the amounts of dividends paid by our financial services business and the separate presentation in our financial statements of the GE Capital cash flows. We believe that our measure of Industrial CFOA and Industrial CFOA excluding deal-related taxes and GE Pension Plan contributions provides management and investors with useful measures to compare the capacity of our industrial operations to generate operating cash flow with the operating cash flow of other non-financial businesses and companies and as such provides useful measures to supplement the reported GAAP CFOA measure.
2017 OPERATING FRAMEWORK INCLUDING 2017 INDUSTRIAL OPERATING + VERTICALS EPS TARGET 2017 Industrial operating + Verticals EPS Target $1.60-1.70 Items not included in non-GAAP metric:
1) Non-operating pension cost, which we estimate to be approximately $(0.16) – (0.17) per share.2) Capital Other continuing earnings (excluding Verticals), which we estimate to be approximately $(0.03) – (0.12) per share.
This amount is affected by, among other things:• The timing of when, and the amount by which, the Company pays down GE Capital's outstanding debt; and• The timing and magnitude of the remaining costs associated with GE Capital's Exit Plan.
Note: The company cannot provide an equivalent GAAP EPS guidance range without unreasonable effort because of the uncertainty of the amount and timing of events affecting earnings as we execute the GE Capital Exit Plan. Although we have attempted to estimate GE Capital's Other continuing earnings for the purpose of explaining the probable significance of this component, as described under number 2, this calculation involves a number of unknown variables, resulting in a GAAP range that we believe is too large and variable to be meaningful.
It is also impractical to provide a reconciliation for our organic revenue, Industrial operating margin expansion and Free Cash Flow plus Dispositions targets as these involve a number of unknown variables including the effects of future acquisitions, dispositions, restructuring activities, property plant and equipment purchases and dispositions and currency exchange.