ge 2016 form 10-k 2d18rn0p25nwr6d.cloudfront.net/cik-0000040545/c7f8b5ca-cc9a-4ab… · form 10-k...
TRANSCRIPT

United States Securities and Exchange CommissionWASHINGTON, D.C. 20549
FORM 10-K(Mark One)
☑☑ Annual Report Pursuant to Section 13 or 15(d) of the Securities Exchange Act of 1934
For the fiscal year ended December 31, 2016or
☐☐ Transition Report pursuant to Section 13 or 15(d) of the Securities Exchange Act of 1934
For the transition period from ___________to ___________
Commission file number 001-00035
General Electric Company (Exact name of registrant as specified in charter)
New York 14-0689340(State or other jurisdiction of incorporation or organization) (I.R.S. Employer Identification No.)
41 Farnsworth Street, Boston, MA 02210 (617) 443-3000(Address of principal executive offices) (Zip Code) (Telephone No.)
Securities Registered Pursuant to Section 12(b) of the Act:
Title of each class Name of each exchange on which registeredCommon stock, par value $0.06 per share New York Stock Exchange
Securities Registered Pursuant to Section 12(g) of the Act:
(Title of class)
Indicate by check mark if the registrant is a well-known seasoned issuer, as defined in Rule 405 of the Securities Act. Yes ☑ No ☐Indicate by check mark if the registrant is not required to file reports pursuant to Section 13 or Section 15(d) of the Act. Yes ☐ No ☑Indicate by check mark whether the registrant (1) has filed all reports required to be filed by Section 13 or 15(d) of the Securities Exchange Act of 1934 during the preceding 12months (or for such shorter period that the registrant was required to file such reports), and (2) has been subject to such filing requirements for the past 90 days. Yes ☑ No ☐Indicate by check mark whether the registrant has submitted electronically and posted on its corporate Web site, if any, every Interactive Data File required to be submitted andposted pursuant to Rule 405 of Regulation S-T during the preceding 12 months (or for such shorter period that the registrant was required to submit and post such files). Yes ☑ No ☐Indicate by check mark if disclosure of delinquent filers pursuant to Item 405 of Regulation S-K is not contained herein, and will not be contained, to the best of registrant'sknowledge, in definitive proxy or information statements incorporated by reference in Part III of this Form 10-K or any amendment to this Form 10‑K. ☐Indicate by check mark whether the registrant is a large accelerated filer, an accelerated filer, a non-accelerated filer, or a smaller reporting company. See definitions of "largeaccelerated filer," "accelerated filer" and "smaller reporting company" in Rule 12b-2 of the Exchange Act. (Check one):Large accelerated filer ☑
Accelerated filer ☐
Non-accelerated filer ☐
Smaller reporting company ☐
Indicate by check mark whether the registrant is a shell company (as defined in Rule 12b-2 of the Act). Yes ☐ No ☑The aggregate market value of the outstanding common equity of the registrant not held by affiliates as of the last business day of the registrant's most recently completedsecond fiscal quarter was at least $279.3 billion. There were 8,724,783,000 shares of voting common stock with a par value of $0.06 outstanding at January 31, 2017.
DOCUMENTS INCORPORATED BY REFERENCEThe definitive proxy statement relating to the registrant's Annual Meeting of Shareowners, to be held April 26, 2017, is incorporated by reference into Part III to the extentdescribed therein.

GE 2016 FORM 10-K 2

GE 2016 FORM 10-K 3

See "Consolidated Results" section on page 27
GE 2016 FORM 10-K 4

See "Supplemental Information" section on page 101
GE 2016 FORM 10-K 5

See "Supplemental Information" section on page 101
GE 2016 FORM 10-K 6

GE 2016 FORM 10-K 7

See "Research and Development" section on page 100
GE 2016 FORM 10-K 8


See "GE Digital" section on page 98
See "Aviation" segment section on page 46
GE 2016 FORM 10-K 9

See "Consolidated Results" section on page 27
See "Segment Operations" section on page 33
GE 2016 FORM 10-K 10


GE 2016 FORM 10-K 13

See "Statement of Cash Flows – Overview from 2014 Through 2016" section on page 82See "Supplemental Information" section on page 101
See "Restructuring" section on page 66

GE 2016 FORM 10-K 14

See "Supplemental Information" section on page 101
GE 2016 FORM 10-K 15

See "Risk Management" section on page 118See "Risk Factors" section on page 120
GE 2016 FORM 10-K 16

FORWARD LOOKING STATEMENTSThis document contains "forward-looking statements" – that is, statements related to future, not past, events. In this context, forward-looking statements oftenaddress our expected future business and financial performance and financial condition, and often contain words such as "expect," "anticipate," "intend," "plan,""believe," "seek," "see," "will," "would," "estimate," "forecast" or "target."Forward-looking statements by their nature address matters that are, to different degrees, uncertain, such as statements about our announced plan to combineour Oil & Gas business with Baker Hughes, including projected revenue and cost synergies, impact on our earnings per share, and the timing and structure ofthe proposed transaction; the completion of our announced plan to reduce the size of our financial services businesses, including expected cash and non-cashcharges associated with this plan and earnings per share of GE Capital's retained businesses (Verticals); expected income; earnings per share, including our2018 target; revenues; organic growth; growth and productivity associated with our Digital business; margins; cost structure and plans to reduce costs;restructuring charges; transaction-related synergies and gains; cash flows, including the impact of pension funding contributions; returns on capital andinvestment; capital expenditures; capital allocation, including dividends, share repurchases and acquisitions; or capital structure, including leverage.For us, particular uncertainties that could cause our actual results to be materially different than those expressed in our forward-looking statements include:· our ability to complete incremental asset sales as we complete our announced plan to reduce the size of our financial services businesses and our ability to
reduce costs as we execute that plan;
· changes in law, economic and financial conditions, including interest and exchange rate volatility, commodity and equity prices and the value of financialassets;
· the impact of conditions in the financial and credit markets on the availability and cost of GE Capital Global Holdings, LLC's (GE Capital) funding, and GECapital's exposure to counterparties;
· pending and future mortgage loan repurchase claims and other litigation claims and investigations in connection with WMC, which may affect our estimatesof liability, including possible loss estimates;
· our ability to maintain our current credit rating and the impact on our funding costs and competitive position if we do not do so;
· the amount and timing of our cash flows and earnings and other conditions, which may affect our ability to pay our quarterly dividend at the planned level orto repurchase shares at planned levels;
· GE Capital's ability to pay dividends to GE at the planned level, which may be affected by GE Capital's cash flows and earnings, financial servicesregulation and oversight, claims and investigations relating to WMC and other factors;
· our ability to launch new products in a cost-effective manner;
· our ability to increase margins through restructuring and other cost reduction measures;
· our ability to convert pre-order commitments/wins into orders/bookings;
· the price we realize on orders/bookings since commitments/wins are stated at list prices;
· customer actions or developments such as early aircraft retirements or reduced energy demand, changes in economic conditions, including oil prices, andother factors that may affect the level of demand and financial performance of the major industries and customers we serve;
· the impact of regulation and regulatory, investigative and legal proceedings and legal compliance risks, including the impact of Alstom investigative andlegal proceedings;
· our capital allocation plans, as such plans may change including with respect to the timing and size of share repurchases, acquisitions, joint ventures,dispositions and other strategic actions;
· our success in completing, including obtaining regulatory approvals and satisfying other closing conditions for, announced transactions, such as ourannounced plans and transactions to combine our Oil & Gas business with Baker Hughes, to reduce the size of our financial services businesses, and toacquire LM Wind Power;
· our success in integrating acquired businesses and operating joint ventures, including Baker Hughes;
· our ability to realize revenue and cost synergies from announced transactions, acquired businesses and joint ventures, including Alstom and Baker Hughes;
· the impact of potential information technology or data security breaches; and· the other factors that are described in the Risk Factors section of this Form 10-K report.
These or other uncertainties may cause our actual future results to be materially different than those expressed in our forward-looking statements. We do notundertake to update our forward-looking statements. This document includes certain forward-looking projected financial information that is based on currentestimates and forecasts. Actual results could differ materially .
GE 2016 FORM 10-K 17

ABOUT GENERAL ELECTRIC
OUR BUSINESS AND HOW WE TALK ABOUT ITWe are a global digital industrial company, transforming industry with software-defined machines and solutions that are connected, responsive and predictive.With products and services ranging from aircraft engines, power generation and oil and gas production equipment to medical imaging, financing and industrialproducts, we serve customers in approximately 180 countries and employ approximately 295,000 people worldwide. Since our incorporation in 1892, we havedeveloped or acquired new technologies and services that have considerably broadened and changed the scope of our activities.
OUR INDUSTRIAL OPERATING SEGMENTS
Power Aviation Energy Connections & Lighting (a)
Renewable Energy Healthcare Oil & Gas Transportation
OUR FINANCIAL SERVICES OPERATING SEGMENT
Capital
(a) Beginning in the third quarter of 2016, the former Energy Connections and Appliances & Lighting segments are presented as one reporting segment called EnergyConnections & Lighting. This segment includes historical results of the Appliances business prior to its sale in June 2016.
Business, operation and financial overviews for our operating segments are provided in the Segment Operations section within the Management's Discussionand Analysis of Financial Condition and Results of Operations (MD&A) section.
COMPETITIVE CONDITIONS AND ENVIRONMENT
In all of our global business activities, we encounter aggressive and able competition. In many instances, the competitive climate is characterized by changingtechnology that requires continuing research and development. With respect to manufacturing operations, we believe that, in general, we are one of the leadingfirms in most of the major industries in which we participate. The businesses in which GE Capital engages are subject to competition from various types offinancial institutions, including commercial banks, investment banks, leasing companies, independent finance companies, finance companies associated withmanufacturers and insurance and reinsurance companies.
As a diverse global company, we are affected by world economies, instability in certain regions, commodity prices, such as the price of oil, and foreign currencyvolatility. Other factors impacting our business include:
· product development cycles for many of our products are long and product quality and efficiency are critical to success,
· research and development expenditures are important to our business and
· many of our products are subject to a number of regulatory standards.
These factors are discussed throughout MD&A.
GE 2016 FORM 10-K 18

OUR EMPLOYEES AND EMPLOYEE RELATIONS
At year-end 2016, General Electric Company and consolidated affiliates employed approximately 295,000 persons, of whom approximately 104,000 wereemployed in the United States. For further information about employees, see the Other Financial Data section within the MD&A.
Approximately 9,300 GE manufacturing and service employees in the United States are represented for collective bargaining purposes by one of 9 unions(approximately 48 different locals within such unions). A majority of such employees are represented by union locals that are affiliated with the IUE-CWA, TheIndustrial Division of the Communication Workers of America, AFL-CIO, CLC. In June 2015, we negotiated new four-year collective bargaining agreements withmost of our U.S unions. These agreements continue to provide employees with good wages and benefits while addressing competitive realities facing theCompany.
Other GE affiliates are parties to labor contracts with various labor unions, also with varying terms and expiration dates that cover approximately 1,700employees.
PROPERTIES
Manufacturing operations are carried out at 184 manufacturing plants located in 38 states in the United States and Puerto Rico and at 325 manufacturing plantslocated in 40 other countries.
CORPORATE INFORMATION AND WEBSITES
General Electric's address is 1 River Road, Schenectady, NY 12345-6999; we also maintain executive offices at 41 Farnsworth Street, Boston, MA 02210.
GE's Internet address a t www.ge.com , Investor Relations website at www.ge.com/investor-relations and our corporate blog at www.gereports.com , as well asGE's Facebook page, Twitter accounts and other social media, including @GE_Reports, contain a significant amount of information about GE, includingfinancial and other information for investors. GE encourages investors to visit these websites from time to time, as information is updated and new information isposted.
Website references in this report are provided as a convenience and do not constitute, and should not be viewed as, incorporation by reference of theinformation contained on, or available through, the websites. Therefore, such information should not be considered part of this report.
Our annual report on Form 10-K, quarterly reports on Form 10-Q, current reports on Form 8-K, and amendments to those reports are available, without charge,on our website, www.ge.com/investor-relations/events-reports , as soon as reasonably practicable after they are filed electronically with the U.S. Securities andExchange Commission (SEC). Copies are also available, without charge, from GE Corporate Investor Communications, 41 Farnsworth Street, Boston, MA02210.
Reports filed with the SEC may be viewed at www.sec.gov or obtained at the SEC Public Reference Room in Washington, D.C. Information about the operationof the Public Reference Room may be obtained by calling the SEC at 1-800-SEC-0330.
GE 2016 FORM 10-K 19

MANAGEMENT'S DISCUSSION AND ANALYSIS OF FINANCIALCONDITION AND RESULTS OF OPERATIONS (MD&A)
PRESENTATION
The consolidated financial statements of General Electric Company (the Company) combine the industrial manufacturing and services businesses of GeneralElectric Company (GE) with the financial services businesses of GE Capital Global Holdings, LLC (GE Capital or Financial Services) and its predecessor,General Electric Capital Corporation.
We believe that investors will gain a better understanding of our company if they understand how we measure and talk about our results. Because of thediversity in our businesses, we present our financial statements in a three-column format, which allows investors to see our industrial operations separately fromour Financial Services operations. We believe that this provides useful information to investors. When used in this report, unless otherwise indicated by thecontext, we use the terms to mean the following:
· General Electric or the Company – the parent company, General Electric Company.
· GE – the adding together of all affiliates except GE Capital, whose continuing operations are presented on a one-line basis, giving effect to the eliminationof transactions among such affiliates. Transactions between GE and GE Capital have not been eliminated at the GE level. We present the results of GE inthe center column of our consolidated statements of earnings, financial position and cash flows. An example of a GE metric is GE cash from operatingactivities (GE CFOA).
· General Electric Capital Corporation or GECC – predecessor to GE Capital Global Holdings, LLC.
· GE Capital Global Holdings, LLC or GECGH – the adding together of all affiliates of GECGH, giving effect to the elimination of transactions among suchaffiliates.
· GE Capital or Financial Services – refers to GECGH, or its predecessor GECC, and is the adding together of all affiliates of GE Capital giving effect to theelimination of transactions among such affiliates. We present the results of GE Capital in the right-side column of our consolidated statements of earnings,financial position and cash flows.
· GE consolidated – the adding together of GE and GE Capital, giving effect to the elimination of transactions between the two. We present the results ofGE consolidated in the left-side column of our consolidated statements of earnings, financial position and cash flows.
· Industrial – GE excluding the continuing operations of GE Capital. We believe that this provides investors with a view as to the results of our industrialbusinesses and corporate items. An example of an Industrial metric is Industrial CFOA (Non-GAAP), which is GE CFOA excluding the effects of dividendsfrom GE Capital.
· Industrial segment – the sum of our seven industrial reporting segments, without giving effect to the elimination of transactions among such segments andbetween these segments and our Financial Services segment. This provides investors with a view as to the results of our industrial segments, without inter-segment eliminations and corporate items. An example of an industrial segment metric is industrial segment revenue growth.
· Total segment – the sum of our seven industrial segments and one financial services segment, without giving effect to the elimination of transactionsbetween such segments. This provides investors with a view as to the results of all of our segments, without inter-segment eliminations and corporate items.
· Verticals or GE Capital Verticals – the adding together of GE Capital businesses that we expect to retain, principally its vertical financing businesses—GECapital Aviation Services (GECAS), Energy Financial Services (EFS) and Industrial Finance (which includes Healthcare Equipment Finance, WorkingCapital Solutions and Industrial Financing Solutions)—that relate to the Company's core industrial domain and other operations, including our run-offinsurance activities, and allocated corporate costs.
GE 2016 FORM 10-K 20

We integrate acquisitions as quickly as possible. Revenues and earnings from the date we complete the acquisition through the end of the fourth quarterfollowing the acquisition are considered the acquisition effect of such businesses.
Discussion of GE Capital's total assets includes deferred income tax liabilities, which are presented within assets for purposes of our consolidated statement offinancial position presentations for this filing.
Amounts reported in billions in graphs within this report are computed based on the amounts in millions. As a result, the sum of the components reported inbillions may not equal the total amount reported in billions due to rounding. Certain columns and rows within the tables may not add due to the use of roundednumbers. Percentages presented are calculated from the underlying numbers in millions.
Discussions throughout this MD&A are based on continuing operations unless otherwise noted.
The MD&A should be read in conjunction with the Financial Statements and Notes to the consolidated financial statements.
OTHER TERMS USED BY GE
· Backlog – unfilled customer orders for products and product services (expected life of contract sales for product services).
· Borrowings as a percentage of total capital invested – for GE, the sum of borrowings and mandatorily redeemable preferred stock, divided by the sumof borrowings, mandatorily redeemable preferred stock, redeemable noncontrolling interest, noncontrolling interests and total shareowners' equity.
· Continuing earnings – unless otherwise indicated, we refer to the caption "earnings from continuing operations attributable to GE common shareowners"as continuing earnings or simply as earnings.
· Continuing earnings per share (EPS) – unless otherwise indicated, when we refer to continuing earnings per share, it is the diluted per-share amount of"earnings from continuing operations attributable to GE common shareowners".
· Digital revenues – revenues related to internally developed software (including Predix TM ) and associated hardware, and software solutions that improveour customers' asset performance. In 2016, we reassessed the span of our digital product offerings, which now excludes software-enabled productupgrades. These revenues are largely generated from our operating businesses and are included in their segment results.
· Ending Net Investment (ENI) (Non-GAAP) – the total capital we have invested in the Financial Services business. It is the sum of short-term borrowings,long-term borrowings and equity (excluding noncontrolling interests) adjusted for unrealized gains and losses on investment securities and hedginginstruments. Alternatively, it is the amount of assets of continuing operations less the amount of non-interest-bearing liabilities.
· Equipment leased to others (ELTO) – rental equipment we own that is available to rent and is stated at cost less accumulated depreciation.
· Free cash flow (Non-GAAP) – GE's cash from operating activities (continuing operations) less GE additions to property, plant and equipment, plus GEdispositions of property, plant and equipment, which are included in cash flows from investing activities.
· GE Capital Exit Plan – our plan, announced on April 10, 2015, to reduce the size of our financial services businesses through the sale of most of theassets of GE Capital, and to focus on continued investment and growth in our industrial businesses.
· Global Growth Organization (GGO ) – organization that provides operational processes through a shared services structure for the enabling functions:commercial, enterprise data management, finance, HR, IT, legal, supply chain and tax through a partnership with the businesses and global functions.
· Growth markets – consist of countries/regions which are expected to grow at above average world GDP rates over the long term and typically are resourcerich and/or have large infrastructure needs. They encompass the following: Australasia; Canada; Latin America; Middle East, North Africa and Turkey;Russia and CIS; Sub-Saharan Africa; Greater China; South Asia; South East Asia (ASEAN).
·· Industrial margin – GE revenues and other income excluding GE Capital earnings (loss) from continuing operations (Industrial revenues) minus GE totalcosts and expenses less GE interest and other financial charges divided by Industrial revenues.
GE 2016 FORM 10-K 21

·· Industrial operating profit margin (Non-GAAP) – Industrial segment profit plus corporate items and eliminations (excluding gains, restructuring, and pre-tax non-operating pension costs) divided by industrial segment revenues plus corporate items and eliminations (excluding gains and GE-GE Capitaleliminations).
· Industrial return on total capital (Industrial ROTC) (Non-GAAP) – earnings from continuing operations attributable to GE common shareowners less GECapital earnings from continuing operations plus GE after-tax interest, divided by average Industrial shareholders' equity, less average GE Capital'sshareholders' equity, plus average debt and other, net.
· Industrial segment gross margin – industrial segment sales less industrial segment cost of sales.
· Industrial shareholders' equity and GE Capital shareholders' equity – for purposes of the Industrial ROTC calculation excludes the effects ofdiscontinued operations and is calculated on an annual basis using a five-point average.
· Net earnings – unless otherwise indicated, we refer to the caption "net earnings attributable to GE common shareowners" as net earnings.
· Net earnings per share (EPS) – unless otherwise indicated, when we refer to net earnings per share, it is the diluted per-share amount of "net earningsattributable to GE common shareowners".
· Non-operating pension cost (Non-GAAP) – comprises the expected return on plan assets, interest cost on benefit obligations and net actuarial gain (loss)amortization for our principal pension plans.
· Operating earnings (Non-GAAP) – GE earnings from continuing operations attributable to common shareowners excluding the impact of non-operatingpension costs.
· Operating earnings per share (Non-GAAP) – unless otherwise indicated, when we refer to operating earnings per share, it is the diluted per-shareamount of "operating earnings".
· Operating pension cost (Non-GAAP) – comprises the service cost of benefits earned, prior service cost amortization and curtailment gain (loss) for ourprincipal pension plans.
· Organic revenues (Non-GAAP) – revenues excluding the effects of acquisitions, dispositions and translational foreign currency exchange.
· Product services – for purposes of the financial statement display of sales and costs of sales in our Statement of Earnings, "goods" is required by SECregulations to include all sales of tangible products, and "services" must include all other sales, including other services activities. In our MD&A section ofthis report, we refer to sales under product services agreements and sales of both goods (such as spare parts and equipment upgrades) and relatedservices (such as monitoring, maintenance and repairs) as sales of "product services," which is an important part of our operations. We refer to "productservices" simply as "services" within the MD&A.
· Product services agreements – contractual commitments, with multiple-year terms, to provide specified services for products in our Power, RenewableEnergy, Oil & Gas, Aviation and Transportation installed base – for example, monitoring, maintenance, service and spare parts for a gas turbine/generatorset installed in a customer's power plant.
· Revenues – unless otherwise indicated, we refer to captions such as "revenues and other income" simply as revenues.
· Segment profit – refers to the operating profit of the industrial segments and the net earnings of the Financial Services segment. See the SegmentOperations section within the MD&A for a description of the basis for segment profits.
·· Shared Services – sharing of business processes in order to standardize and consolidate services to provide value to the businesses in the form ofsimplified processes, reduced overall costs and increased service performance.
GE 2016 FORM 10-K 22

NON-GAAP FINANCIAL MEASURES
In the accompanying analysis of financial information, we sometimes use information derived from consolidated financial data but not presented in our financialstatements prepared in accordance with U.S. generally accepted accounting principles (GAAP). Certain of these data are considered "non-GAAP financialmeasures" under the SEC rules. Specifically, we have referred, in various sections of this report, to:
· Industrial segment organic revenues and industrial segment organic revenues excluding Oil & Gas
· Industrial segment organic operating profit
· Oil & Gas organic revenue and operating profit growth
· Operating and non-operating pension cost
· Adjusted corporate costs (operating)
· GE pre-tax earnings from continuing operations, excluding GE Capital earnings (loss) from continuing operations and the corresponding effective tax rates,and the reconciliation of the U.S. federal statutory income tax rate to GE effective tax rate, excluding GE Capital earnings
· Industrial operating earnings and GE Capital earnings (loss) from continuing operations and EPS
· Industrial operating + Verticals earnings and EPS
· Industrial operating profit and operating profit margin (excluding certain items)
· Industrial operating profit + Verticals
· Industrial segment gross margin (excluding Alstom)
· Industrial segment operating profit and operating margin (excluding Alstom)
· Average GE shareowners' equity, excluding effects of discontinued operations
· Average GE Capital shareowners' equity, excluding effects of discontinued operations
· Industrial return on total capital (Industrial ROTC)
· Industrial cash flows from operating activities (Industrial CFOA) and Industrial CFOA excluding taxes related to business sales and principal pension planfunding
· GE cash flows from operating activities (GE CFOA) excluding taxes related to business sales and principal pension plan funding
· Free cash flow (FCF) and FCF plus dispositions
· Ratio of adjusted debt to equity at GE Capital, net of liquidity
· Capital ending net investment (ENI), excluding liquidity
· 2017 operating framework including 2017 Industrial operating + Verticals EPS target
The reasons we use these non-GAAP financial measures and the reconciliations to their most directly comparable GAAP financial measures are included in theSupplemental Information section within the MD&A. Non-GAAP financial measures referred to in this report are either labeled as "non-GAAP" or designated assuch with an asterisk (*).
GE 2016 FORM 10-K 23

KEY PERFORMANCE INDICATORS(Dollarsinbillions;per-shareamountsindollars) REVENUES PERFORMANCE
GE CFOA
GE Capital Dividend
Industrial CFOA*
(a) Including the results of Alstom for November and December of both 2015 and2016
(a) Industrial CFOA was $12.2 billion excluding deal taxes of $(0.2) billion related tothe sale of our Signaling business
(b) Industrial CFOA was $11.6 billion excluding deal taxes of $(1.4) billion related tothe sale of our Appliances business and $(0.3) billion of pension funding
(c) Included $(0.3) billion related to Alstom in both 2015 and 2016
INDUSTRIAL ORDERS
INDUSTRIAL BACKLOG
Equipment
Services
Equipment
Services
(a) Included $2.5 billion related to Alstom(b) Included $17.4 billion related to Alstom
(a) Included $29.2 billion related to Alstom(b) Included $31.2 billion related to Alstom
INDUSTRIAL MARGINS
INDUSTRIAL OPERATING PROFIT MARGINS (NON-GAAP) (a)
(a) 12.0%, excluding (7.9)% related to Alstom*
(b) 12.1%, excluding 5.9% related to Alstom*
(a) Excluded gains, non-operating pension costs, restructuring and other,noncontrolling interests, GE Capital preferred stock dividends, as well as the resultsof Alstom
* Non-GAAP Financial Measure
GE 2016 FORM 10-K 24

KEY PERFORMANCE INDICATORS(Dollarsinbillions;per-shareamountsindollars;attributabletoGEcommonshareowners) NET EARNINGS (LOSS)
NET EARNINGS (LOSS) PER SHARE
OPERATING EARNINGS (NON-GAAP)
OPERATING EARNINGS PER SHARE (NON-GAAP)
INDUSTRIAL OPERATING +VERTICALS EARNINGS (NON-GAAP)
INDUSTRIAL OPERATING +VERTICALS EPS (NON-GAAP)
GE 2016 FORM 10-K 25

KEY PERFORMANCE INDICATORS(Dollarsinbillions;per-shareamountsindollars)
SHAREHOLDER INFORMATIONRETURNED $30.5 BILLION TO
SHAREOWNERS IN 2016
Dividends $8.5 billionStock buyback $22.0 billion
ANNUAL MEETING
General Electric's 2017 Annual Meeting ofShareowners will be held on April 26, 2017,
in Asheville, NC FIVE-YEAR PERFORMANCE GRAPH
The annual changes for the five-year period shown in the graph on this page are based on the assumption that $100 had been invested in General Electriccommon stock, the Standard & Poor's 500 Stock Index (S&P 500) and the Dow Jones Industrial Average (DJIA) on December 31, 2011, and that all quarterlydividends were reinvested. The cumulative dollar returns shown on the graph represent the value that such investments would have had on December 31 foreach year indicated.
STOCK PRICE RANGE AND DIVIDENDS
With respect to "Market Information," in the United States, General Electric common stock is listed on the New York Stock Exchange (its principal market).General Electric common stock is also listed on the London Stock Exchange, Euronext Paris, the SIX Swiss Exchange and the Frankfurt Stock Exchange. Thechart above shows trading prices, as reported on the New York Stock Exchange, Inc., Composite Transactions Tape.
As of January 31, 2017, there were approximately 440,000 shareowner accounts of record.
On February 10, 2017, our Board of Directors approved a quarterly dividend of $0.24 per share of common stock, which is payable April 25, 2017, toshareowners of record at close of business on February 27, 2017.
GE 2016 FORM 10-K 26

CONSOLIDATED RESULTS
SIGNIFICANT DEVELOPMENTS IN 2016 Our consolidated results for 2016 were significantly affected by recent portfolio changes, including the 2015 acquisition of Alstom, the disposal of financialservices businesses under the GE Capital Exit Plan initiated in 2015 and the 2016 sale of our Appliances business. ALSTOM
In 2016, Alstom contributed revenues of $13.0 billion and an operating loss of $0.3 billion, of which $0.8 billion of profit is included in the segment results and$1.0 billion of charges is included in Corporate, primarily related to purchase accounting and acquisition related charges. Including the effects of tax benefits of$0.8 billion, net earnings were $0.4 billion for the year ended December 31, 2016. In addition, Alstom used cash flows from operating activities of $0.3 billion forthe year ended December 31, 2016. GE CAPITAL EXIT PLAN
As of December 31, 2016, we have signed agreements with buyers for $197 billion of GE Capital ending net investment (ENI), excluding liquidity (as originallyreported at December 31, 2014), of which $190 billion have closed by the end of 2016.
In June 2016, we received approval of our request to the Financial Stability Oversight Council (FSOC) for rescission of GE Capital's designation as a nonbankSystemically Important Financial Institution (SIFI). 2016 SIGNIFICANT TRANSACTIONS
Transactions completed in 2016 included the following.
· The June 2016 sale of our Appliances business to Qingdao Haier Co., Ltd. (Haier) for $5.6 billion (including $0.8 billion from sale of receivablesoriginated in our Appliances business and sold from GE Capital to Haier) on which we recognized an after-tax gain of $1.8 billion.
· Acquisition of the remaining 74% of software developer Meridium Inc. in September 2016, for $0.4 billion to enhance and accelerate our assetperformance-management capabilities across our industrial businesses.
· The acquisitions of a 76.2% interest in Arcam AB for $0.5 billion and a 75% interest in Concept Laser GmbH for $0.6 billion, two European 3-D printingcompanies that print metal parts for aircraft and other industrial components, to expand our additive manufacturing capabilities. PLANNED TRANSACTIONS
We also announced a number of strategic transactions during 2016 that we expect to complete in 2017, including the following.
· In October 2016, we announced an agreement with Baker Hughes Incorporated (Baker Hughes) to combine our Oil & Gas business and BakerHughes to create a new entity in which GE will hold a 62.5% interest and existing Baker Hughes shareholders will have a 37.5% interest. Baker Hughesshareholders will also receive a cash dividend funded by a $7.4 billion cash contribution by GE. The transaction is subject to the approval of Baker Hughesshareholders, regulatory approvals and other customary closing conditions.
· In October 2016, we announced a plan to acquire LM Wind Power, one of the world's largest wind turbine blade manufacturers for $1.7 billion, subjectto customary closing conditions.
· In October 2016, we also announced our plan to sell our Water & Process Technologies business and in December 2016, we announced our plan tosell our Industrial Solutions business.
GE 2016 FORM 10-K 27

CONSOLIDATED RESULTS(Dollarsinbillions) 2016 GEOGRAPHIC REVENUES
2016 SEGMENT REVENUES
REVENUES
INDUSTRIAL REVENUES
FINANCIAL SERVICES REVENUES
(a) Includes $2.0 billion related to Alstom(b) Includes $13.0 billion related to Alstom
(a) Includes $2.0 billion related to Alstom(b) Includes $13.0 billion related to Alstom
CONTINUING EARNINGS(a)
CONTINUING EARNINGSPER SHARE(a)
(a) Attributable to GE common shareowners
GE 2016 FORM 10-K 28

CONSOLIDATED RESULTS(Dollarsinbillions)
REVENUE COMMENTARY: 2016 – 2015
EARNINGS COMMENTARY: 2016 – 2015
Consolidated revenues increased $6.3 billion, or 5%, primarily driven byincreased Industrial revenues of $6.6 billion and increased Financial Servicesrevenues of $0.1 billion, partially offset by an increase in eliminations betweenIndustrial and Financial Services of $0.4 billion. The overall foreign currencyimpact on consolidated revenues was a decrease of $1.3 billion.
· Industrial revenues increased $6.6 billion, or 6% due to increasedindustrial segment revenues of $4.4 billion, or 4%, as increases at Power,Renewable Energy, Aviation and Healthcare were partially offset bydecreases at Oil & Gas, Transportation and Energy Connections &Lighting. This increase in industrial segment revenues was primarilydriven by the net effects of acquisitions of $11.2 billion, offset by the neteffects of dispositions of $5.6 billion and the effects of a stronger U.S.dollar of $0.8 billion. Excluding the effects of acquisitions, dispositionsand translational currency exchange, industrial segment organicrevenues* decreased $0.5 billion.Industrial revenues increased an additional $2.2 billion at Corporate ascurrent year gains were $1.9 billion higher than 2015 gains.· Financial Services revenues increased $0.1 billion, or 1% ,primarily due to lower impairments, higher gains and the effects ofacquisitions, partially offset by organic revenue declines, the effects ofdispositions and the effects of translational currency exchange.
Consolidated continuing earnings increased $7.5 billion, primarily driven bydecreased Financial Services losses of $6.7 billion, increased Industrialcontinuing earnings of $0.5 billion and a net decrease of $0.2 billion resultingfrom income taxes, and interest and other financial charges. The overallforeign currency impact on consolidated earnings was a decrease of $0.3billion.
· Industrial earnings increased $0.5 billion due to increasedearnings at Corporate of $0.8 billion, or 17%, as current year gains were$1.9 billion higher and pension costs were $0.7 billion lower than 2015.These increases to earnings were partially offset by $1.8 billion of higherrestructuring and other charges.Industrial earnings decreased due to decreased industrial segmentearnings of $0.4 billion, or 2%, as decreases at Oil & Gas, EnergyConnections & Lighting, and Transportation were partially offset byincreases at Aviation, Power, Healthcare and Renewable Energy. Thisdecrease in industrial segment earnings, was primarily driven bydecreases in organic operating profit* of $0.8 billion and the net effect ofdispositions of $0.5 billion, partially offset by the net effect of acquisitionsof $0.9 billion.· Financial Services losses decreased $6.7 billion, or 84% ,primarily due to the absence of the 2015 charges associated with the GECapital Exit Plan.· In addition to the effects on net earnings described above, earningsper share amounts were also positively impacted by the reduction innumber of outstanding common shares compared to 2015. The averagenumber of shares outstanding used to calculate 2016 earnings per shareamounts was 9% lower than 2015, primarily due to the 2015 SynchronyFinancial share exchange and ongoing share buyback activities funded inlarge part by dividends from GE Capital.
* Non-GAAP Financial Measure
GE 2016 FORM 10-K 29

CONSOLIDATED RESULTS(Dollarsinbillions)
REVENUE COMMENTARY: 2015 – 2014
EARNINGS COMMENTARY: 2015 – 2014
Consolidated revenues increased $0.2 billion, primarily driven by increasedIndustrial revenues of $0.4 billion and a decrease in eliminations betweenIndustrial and Financial Services of $0.4 billion, partially offset by decreasedFinancial Services revenues of $0.5 billion. The overall foreign currencyimpact on consolidated revenues was a decrease of $4.9 billion.
· Industrial revenues increased $0.4 billion due an increase atCorporate of $1.3 billion, or 75%, as 2015 gains were $1.4 billion higherthan 2014 year gains.This was offset by decreases in industrial segment revenues of $0.9billion, or 1%, as decreases at Oil & Gas, Healthcare and RenewableEnergy were partially offset by increases at Power, Aviation, EnergyConnections & Lighting and Transportation. The $0.9 billion decrease inindustrial segment revenues was primarily driven by the translationaleffects of a stronger U.S. dollar of $4.8 billion and the net effects ofdispositions of $1.1 billion, partially offset by the net effects ofacquisitions of $2.2 billion. Excluding the effects of acquisitions,dispositions and currency exchange, industrial segment organicrevenues* increased by $2.8 billion, or 3%.· Financial Services revenues decreased $0.5 billion, or 5% ,primarily due to organic revenue declines, primarily resulting from lowerending net investment (ENI), lower gains and higher impairments,partially offset by the effects of acquisitions and dispositions.
Consolidated continuing earnings decreased $7.9 billion, or 83%, primarilydriven by decreased Financial Services net earnings of $9.2 billion, partiallyoffset by an increase in Industrial continuing earnings of $1.3 billion. Theoverall foreign currency impact on consolidated earnings was a decrease of$0.6 billion.
· Industrial earnings increased 1.3 billion, or 11%, due to increasedindustrial segment earnings of $0.2 billion, or 1%, as increases atAviation, Energy Connections & Lighting, Transportation and Power werepartially offset by decreases at Oil & Gas, Renewable Energy andHealthcare. This increase in industrial segment earnings was primarilydriven by increases in organic operating profit* of $1.2 billion, partiallyoffset by the translational currency exchange effects of a stronger U.S.dollar of $0.7 billion, net acquisitions of $0.1 billion and net dispositions of$0.2 billion.Industrial earnings at Corporate increased an additional $1.1 billion, or18%, as 2015 gains were $1.4 billion higher than 2014 gains, partiallyoffset by $0.5 billion of higher Principal retirement plan costs in 2015.· Financial Services net earnings decreased $9.2 billion , primarilydue to 2015 charges associated with the GE Capital Exit Plan.
See Segment Results and Corporate Items & Eliminations sections within the MD&A for more information.
Also, see the Other Consolidated Information section within the MD&A for a discussion of postretirement benefit plans costs, income taxes and geographic data.
*Non-GAAP Financial Measure
GE 2016 FORM 10-K 30

GE CAPITAL
GE Capital results include continuing operations, which are reported in the Capital segment (see Segment discussion), and discontinued operations (seeDiscontinued Operations section and Note 2).
THE GE CAPITAL EXIT PLAN
On April 10, 2015, the Company announced a plan (the GE Capital Exit Plan) to create a simple, more valuable company by reducing the size of its financialservices businesses through the sale of most of the assets of GE Capital over the following 24 months and aligning a smaller GE Capital with GE's industrialbusinesses.
Under the GE Capital Exit Plan, the Company is retaining certain GE Capital businesses, principally its vertical financing businesses—GE Capital AviationServices (GECAS), Energy Financial Services (EFS) and Industrial Finance (which includes Healthcare Equipment Finance, Working Capital Solutions andIndustrial Financing Solutions)—that relate to the Company's core industrial domain and other operations, including our run-off insurance activities, andallocated corporate costs (together referred to as GE Capital Verticals or Verticals).
As a result of the GE Capital Exit Plan dispositions, GE Capital has paid $24.4 billion in dividends to GE in 2015 and 2016 ($4.3 billion and $20.1 billion,respectively). We expect GE Capital to release additional dividends of up to approximately $10 billion through the remainder of the plan. In January 2017, GEreceived an additional $2.0 billion of common dividends from GE Capital. As of December 31, 2016, we are ahead of our plan, having signed agreements withbuyers for $197 billion of ending net investment (ENI), excluding liquidity (as originally reported at December 31, 2014), of which $190 billion has closed. As ofDecember 31, 2016, we have substantially completed the dispositions related to the GE Capital Exit Plan. In addition, as part of our initiative to reduce the sizeof our financial services businesses, we completed the split-off of our remaining interest in GE Capital's North American Retail Finance business, SynchronyFinancial, to holders of GE common stock, which resulted in a $20.4 billion buyback of GE common stock (671.4 million shares) in 2015. In connection with theGE Capital Exit Plan, we completed a legal reorganization of GE Capital that included a merger of GE Capital into GE, a guarantee by GE of GE Capital debt,and an exchange of $36 billion of GE Capital debt for new notes guaranteed by GE. The result of all these actions reduced GE Capital's total assets by 63%from $500 billion at December 31, 2014 to $183 billion at December 31, 2016. From inception of plan through December 31, 2016, we incurred charges of $22.0billion. Due to anticipated tax benefits and gains, we do not expect total after-tax charges through the completion of the GE Capital Exit Plan to exceed our initial$23 billion estimate.
On March 31, 2016, GE filed its request to the Financial Stability Oversight Council (FSOC) for rescission of GE Capital's designation as a nonbank SystemicallyImportant Financial Institution (SIFI). On June 28, 2016, the FSOC rescinded GE Capital's designation as a nonbank SIFI.
SALES AGREEMENTS
During 2016, GE signed agreements to sell approximately $40 billion of ENI, excluding liquidity (as originally reported at December 31, 2014), of whichapproximately $19 billion, $21 billion and less than $1 billion related to our Commercial Lending and Leasing (CLL), Consumer and Real Estate businesses,respectively.
Sales representing approximately $86 billion of ENI, excluding liquidity (as originally reported at December 31, 2014) closed during 2016, includingapproximately $70 billion, $16 billion and less than $1 billion related to our CLL, Consumer and Real Estate businesses, respectively.
GE 2016 FORM 10-K 31

AFTER-TAX CHARGES RELATED TO THE GE CAPITAL EXIT PLAN
During 2016, GE recorded less than $0.1 billion of after-tax charges related to the GE Capital Exit Plan of which $0.7 billion of net benefits were recorded incontinuing operations and $0.7 billion of after-tax charges were recorded in discontinued operations. A description of these after-tax charges for 2016 isprovided below.
· $1.3 billion of net loss primarily related to the completed and planned dispositions of Consumer and most of the CLL businesses, which was recorded indiscontinued operations under the caption "Earnings (loss) from discontinued operations, net of taxes" in the Statement of Earnings.
· $0.3 billion of charges associated with the preferred equity exchange that was completed in January 2016, which was recorded in continuing operationsand reported in GE Capital's corporate component under the caption "Preferred stock dividends" in the Statement of Earnings.
· These charges were offset by tax benefits of $1.4 billion primarily related to increased tax efficiency of planned cash repatriations through increasedforeign tax credit utilization of $0.8 billion and an IRS tax settlement of $0.6 billion. Of these benefits $1.1 billion was recorded in continuing operationsand reported in GE Capital's corporate component under the caption "Benefit (provision) for income taxes" in the Statement of Earnings and $0.2 billionwas recorded in discontinued operations under the caption "Earnings (loss) from discontinued operations, net of taxes" in the Statement of Earnings.
For additional information about the GE Capital Exit Plan 2015 sales agreements and after-tax charges, refer to our Form 8-K filed on June 3, 2016 related tothe Annual Report on Form 10-K for the year ended December 31, 2015.
In addition to the above charges, during the year ended December 31, 2016, we have incurred other costs related to our ongoing liability management actions,including $0.6 billion of pre-tax losses related to the repurchase of $12.5 billion of long-term unsecured debt and subordinated debentures which were recordedin continuing operations.
GE 2016 FORM 10-K 32

SEGMENT OPERATIONSSEGMENT CHANGES· Beginning in the third quarter of 2016, the former Energy Connections and Appliances & Lighting segments are presented as one reporting segment called
Energy Connections & Lighting. This segment includes historical results of the Appliances business prior to its sale in June 2016.
REVENUES AND PROFITSegment revenues include revenues and other income related to the segment.
Segment profit is determined based on internal performance measures used by the Chief Executive Officer (CEO) to assess the performance of each businessin a given period. In connection with that assessment, the CEO may exclude matters such as charges for restructuring; rationalization and other similarexpenses; acquisition costs and other related charges; technology and product development costs; certain gains and losses from acquisitions or dispositions;and litigation settlements or other charges, for which responsibility preceded the current management team. For additional information about costs excludedfrom segment profit, see Corporate Items and Eliminations section within this MD&A.
Segment profit excludes results reported as discontinued operations and material accounting changes. Segment profit also excludes the portion of earnings orloss attributable to noncontrolling interests of consolidated subsidiaries, and as such only includes the portion of earnings or loss attributable to our share of theconsolidated earnings or loss of consolidated subsidiaries.
Segment profit excludes or includes interest and other financial charges and income taxes according to how a particular segment's management is measured:
· Interest and other financial charges, income taxes and GE preferred stock dividends are excluded in determining segment profit (which we sometimes referto as "operating profit") for the industrial segments.
· Interest and other financial charges, income taxes and GE Capital preferred stock dividends are included in determining segment profit (which wesometimes refer to as "net earnings") for the Capital segment.
Certain corporate costs, such as shared services, employee benefits and information technology are allocated to our segments based on usage. A portion of theremaining corporate costs is allocated based on each segment's relative net cost of operations.
With respect to the segment revenue and profit walks, the overall effect of foreign exchange is included within multiple captions as follows:
· The translational foreign exchange impact is included within Foreign Exchange.· The transactional impact of foreign exchange hedging is included in operating cost within Productivity and in other income within Other.
GE 2016 FORM 10-K 33

SIGNIFICANT SEGMENT DEVELOPMENTS
ALSTOM ACQUISITION
On November 2, 2015, we completed the acquisition of Alstom's Thermal, Renewables and Grid businesses, resulting in two months of activity in 2015 resultsand a full year of activity in 2016 results. The completion of the transaction followed the regulatory approval of the deal in over 20 countries and regionsincluding the EU, U.S., China, India, Japan and Brazil. The cash purchase price was €9.2 billion (approximately $10.1 billion), net of cash acquired. Theacquisition and alliances with Alstom affected our Power, Energy Connections & Lighting and Renewable Energy segments, and to a lesser extent our Oil & Gassegment.
At year-end 2015, our preliminary allocation of purchase price resulted in recognition of approximately $13.5 billion of goodwill, $5.2 billion of intangible assets,and $1.1 billion of unfavorable customer contract liabilities. The preliminary fair value of the associated noncontrolling interest was approximately $3.6 billion. Asof the end of 2016, the amount of goodwill, intangible assets and unfavorable customer contract liabilities recognized was adjusted to approximately $17.3billion, $4.4 billion, and $2.7 billion, respectively. The adjustments reflected revisions in estimates primarily related to cash flows and other valuationassumptions for customer contracts, increases to legal reserves, and other fair value adjustments related to acquired assets and liabilities . Deferred taxes,unrecognized tax benefits and other tax uncertainties were also adjusted under applicable accounting rules. We finalized our purchase accounting analysis inthe fourth quarter of 2016. See Note 8 to the consolidated financial statements for further information.
For the year ended December 31, 2016, Alstom contributed revenues of $13.0 billion and an operating loss of $0.3 billion, of which $0.8 billion of profit isincluded in the segment results and $1.0 billion of charges is included in Corporate, primarily related to purchase accounting and acquisition related charges.Including the effects of tax benefits of $0.8 billion, net earnings were $0.4 billion for the year ended December 31, 2016. In addition, Alstom used cash flowsfrom operating activities of $0.3 billion for the year ended December 31, 2016. Alstom related revenues and operating profit are presented separately in thesegment revenues and profit walks that follow.
SALE OF APPLIANCESOn January 15, 2016, we announced the signing of an agreement to sell our Appliances business to Haier. On June 6, 2016, we completed the sale forproceeds of $5.6 billion (including $0.8 billion from the sale of receivables originated in our Appliances business and sold from GE Capital to Haier) andrecognized an after-tax gain of $1.8 billion in 2016.
GE 2016 FORM 10-K 34

SUMMARY OF OPERATING SEGMENTS General Electric Company and consolidated affiliates(In millions) 2016 2015 2014 2013 2012 Revenues Power $ 26,827 $ 21,490 $ 20,580 $ 19,315 $ 20,364Renewable Energy 9,033 6,273 6,399 4,824 7,373Oil & Gas 12,898 16,450 19,085 17,341 15,539Aviation 26,261 24,660 23,990 21,911 19,994Healthcare 18,291 17,639 18,299 18,200 18,290Transportation 4,713 5,933 5,650 5,885 5,608Energy Connections & Lighting 15,133 16,351 15,724 15,907 15,379 Total industrial segment revenues 113,156 108,796 109,727 103,383 102,548Capital 10,905 10,801 11,320 11,267 11,268 Total segment revenues 124,061 119,597 121,047 114,650 113,816Corporate items and eliminations (368) (2,211) (3,863) (1,405) (1,228)Consolidated revenues $ 123,693 $ 117,386 $ 117,184 $ 113,245 $ 112,588 Segment profit Power $ 4,979 $ 4,502 $ 4,486 $ 4,328 $ 4,368Renewable Energy 576 431 694 485 914Oil & Gas 1,392 2,427 2,758 2,357 2,064Aviation 6,115 5,507 4,973 4,345 3,747Healthcare 3,161 2,882 3,047 3,048 2,920Transportation 1,064 1,273 1,130 1,166 1,031Energy Connections & Lighting 311 944 677 491 442 Total industrial segment profit 17,598 17,966 17,764 16,220 15,487Capital (1,251) (7,983) 1,209 401 1,245 Total segment profit 16,347 9,983 18,973 16,621 16,731Corporate items and eliminations (4,226) (5,108) (6,225) (6,002) (4,719)GE interest and other financial charges (2,026) (1,706) (1,579) (1,333) (1,353)GE provision for income taxes (967) (1,506) (1,634) (1,667) (2,013)Earnings from continuing operations attributable to GE common shareowners 9,128 1,663 9,535 7,618 8,646Earnings (loss) from discontinued operations, net of taxes (954) (7,495) 5,855 5,475 5,047 Less net earnings (loss) attributable to noncontrolling interests, discontinued operations (1) 312 157 36 53Earnings (loss) from discontinued operations, net of taxes and noncontrolling interests (952) (7,807) 5,698 5,439 4,995Consolidated net earnings (loss) attributable to GE common shareowners $ 8,176 $ (6,145) $ 15,233 $ 13,057 $ 13,641
GE 2016 FORM 10-K 35

SEGMENT RESULTS(Dollarsinbillions)INDUSTRIAL SEGMENT EQUIPMENT& SERVICES REVENUES
INDUSTRIAL SEGMENT PROFIT
Equipment(a) Services(b)
(a) In 2015, $59.8 billion, excluding $1.1 billion related to Alstom.* In 2016, $52.7billion, excluding $8.1 billion related to Alstom*(b) In 2015, $47.1 billion, excluding $0.8 billion related to Alstom.* In 2016, $47.5billion, excluding $4.9 billion related to Alstom*
(a) $18.1 billion, excluding $(0.2) billion related to Alstom*
(b) $16.8 billion, excluding $0.8 billion related to Alstom*
2016 – 2015 COMMENTARY
· Industrial segment revenues increased $4.4 billion, or 4%, primarily driven by increases at Power and Renewable Energy, mainly due to the effects ofthe Alstom acquisition, and an organic increase at Renewable Energy. This increase in industrial segment revenues was partially offset by lower revenuesat Oil & Gas and Transportation, including the effects of foreign currency exchange of $0.3 billion at Oil & Gas.· Industrial segment acquisition revenues, driven by Alstom, also positively affected Energy Connections & Lighting, however, this was mostly offset by
the effects of disposition revenues related to the sale of Appliances in the second quarter of 2016 and sales of Meters, Intelligent Platforms EmbeddedSystems Products and Signaling businesses in 2015.· Industrial segment profit decreased $0.4 billion, or 2%, mainly driven by lower earnings organically at Oil & Gas and Energy Connections & Lighting,
as well as an unfavorable impact of foreign exchange, partially offset by higher earnings at Aviation, Power, Healthcare and Renewable Energy.· Industrial segment operating profit margin decreased 90 bps to 15.6%, primarily driven by the effects of Alstom results. Excluding Alstom*, industrial
segment operating profit margin was 16.8%, compared with 17.0% in 2015, reflecting core decreases at Power, Oil & Gas and Energy Connections &Lighting, that more than offset increases at Aviation, Healthcare and Transportation.
2015 – 2014 COMMENTARY· Industrial segment revenues decreased $0.9 billion, or 1%, primarily driven by decreases at Oil & Gas, mainly related to the effects of foreign
currency exchange and a decrease at Oil & Gas organically. This decrease was partially offset by higher revenues at Power, Energy Connections &Lighting, and Aviation, mainly as a result of organic increases, as well as the effects of the Alstom acquisition at Power and Energy Connections & Lighting,partially offset by the effects of dispositions related to the sale of Intelligent Platforms Embedded Systems Products and Wayne in 2015.· Industrial segment profit increased $0.2 billion, or 1%, mainly driven by higher earnings at Aviation, Energy Connections & Lighting and
Transportation, partially offset by lower earnings at Oil & Gas and Renewable Energy, as well as an unfavorable impact of foreign exchange.·Industrial segment operating profit margin increased 30 bps to 16.5% primarily driven by Aviation and Transportation, partially offset by the effects of
the Alstom acquisition. Excluding Alstom*, industrial segment operating profit margin was 17.0%, compared with 16.2% in 2014, reflecting core increasesat Power and Energy Connections & Lighting.
*Non-GAAP Financial Measure
GE 2016 FORM 10-K 36

POWER
BUSINESS OVERVIEW
Leader: Steve Bolze
Headquarters & Operations
· Senior Vice President, GE and President & CEO,GE Power· Over 20 years of service with General Electric
· 22% of segment revenues· 24% of industrial segment revenues· 28% of industrial segment profit· Headquarters: Schenectady, NY· Serving customers in 140+ countries· Employees: approximately 57,000
Products & Services Power serves power generation, industrial, government and other customers worldwide with products and services related to energyproduction and water reuse. Our products and technologies harness resources such as oil, gas, coal, diesel, nuclear and water to produceelectric power and include gas and steam turbines, full balance of plant, upgrade and service solutions, as well as data-leveragingsoftware.
· Gas Power Systems – offers a wide spectrum of heavy-duty and aeroderivative gas turbines for utilities, independent power producers and numerousindustrial applications, ranging from small, mobile power to utility scale power plants.
· Steam Power Systems – offers steam power technology for coal and nuclear applications including boilers, generators, steam turbines, and Air QualityControl Systems (AQCS) to help efficiently produce power and provide performance over the life of a power plant.
· Power Services – delivers maintenance, service and upgrade solutions across total plant assets and over their operational lifecycle, leveraging theIndustrial Internet to improve the performance of such solutions.
· Distributed Power –provides technology-based products and services to generate reliable and efficient power at or near the point of use. The productportfolio features highly efficient, fuel flexible industrial gas engines, including Jenbacher and Waukesha engines, that generate power for numerousindustries globally.
· Water & Process Technologies –provides comprehensive chemical and equipment solutions and services to help manage and optimize water resourcesacross numerous industries and municipalities, including water treatment, wastewater treatment and process system solutions.
· GE Hitachi Nuclear –offers advanced reactor technologies solutions, including reactors, fuels and support services for boiling water reactors, and isoffered through joint ventures with Hitachi and Toshiba, for safety, reliability and performance for nuclear fleets.
Competition & RegulationWorldwide competition for power generation products and services is intense. Demand for power generation is global and, as a result, is sensitive to theeconomic and political environments of each country in which we do business.
GE 2016 FORM 10-K 37

OPERATIONAL OVERVIEW(Dollarsinbillions)
2016 GEOGRAPHIC REVENUES: $ 26.8 BILLION ORDERS
Equipment
Services
(a) Includes $1.0 billion related to Alstom(b) Includes $10.0 billion related to Alstom
2016 SUB-SEGMENT REVENUES
BACKLOG
(a) Includes Water & Process Technologies, Distributed Power and GE HitachiNuclear
Equipment Services
(a) Includes $15.5 billion related to Alstom(b) Includes $18.3 billion related to Alstom
EQUIPMENT/SERVICES REVENUES
UNIT SALES
Services Equipment
SIGNIFICANT TRENDS & DEVELOPMENTS
· The integration of Alstom's Thermal business has yielded significant efficiencies in supply chain, service infrastructure, new product development andSG&A costs.
· We announced our plan to sell our Water & Process Technologies business that will further position the business for long-term growth.· We expanded our capabilities surrounding the manufacturing and supply of power plant equipment by acquiring Metem Corporation and a unit of South
Korea's Doosan Engineering and Construction Company, which provides Heat Steam Recovery Generators.· Digital offerings have been developed to further complement our equipment and services business and drive value and better outcomes for our customers.· The business continues to invest in new product development, such as our new HA-Turbine, reciprocating engines and advanced upgrades, to expand our
equipment and services offerings.· Excess capacity in developed markets, continued pressure in oil and gas applications and macroeconomic and geopolitical environments result in
uncertainty for the industry and business.
GE 2016 FORM 10-K 38

FINANCIAL OVERVIEW(Dollarsinbillions)
SEGMENT REVENUES SEGMENT PROFIT SEGMENT PROFIT MARGIN
(a) $20.6 billion, excluding $0.9 billion relatedto Alstom*(b) $20.6 billion, excluding $6.3 billion relatedto Alstom*
Equipment
Services
(a) $4.6 billion, excluding $(0.1) billion related toAlstom*(b) $4.4 billion, excluding $0.6 billion related toAlstom*
(a) 22.3%, excluding (8.7)% related to Alstom*(b) 21.5%, excluding 9.0% related to Alstom*
SEGMENT REVENUES & PROFIT WALK: COMMENTARY:2016 – 2015 2016 – 2015
Segment revenues up $5.3 billion (25%);Segment profit up $0.5 billion (11%) as a result of:
· The increase in revenues was driven primarily by the effects of theAlstom acquisition, including higher sales at Steam Power Systems, as wellas higher volume at Power Services, partially offset by the impact of astronger U.S. dollar and lower other income. Core revenues were flat.· The increase in profit was mainly driven by the effects of the Alstomacquisition, as well as material deflation, partially offset by lower costproductivity and an unfavorable business mix, driven by HA-Turbineshipments in the current year.
Revenues Profit2015 $ 21.5 $ 4.5Volume 0.1 -Price - -Foreign Exchange (0.1) -(Inflation)/Deflation N/A 0.1Mix N/A (0.1)Productivity N/A (0.1)Other (0.1) (0.1)Alstom 5.3 0.62016 $ 26.8 $ 5.0 2015 – 2014 2015 – 2014
Segment revenues up $0.9 billion (4%);Segment profit was flat as a result of:
· The increase in revenues was mainly driven by higher volume, primarilyat Power Services, as well as the effects of the Alstom acquisition, partiallyoffset by the impact of a stronger U.S. dollar.· Profit was flat as higher volume, the effects of deflation, higher prices,and favorable business mix were offset by lower productivity, including anincrease in SG&A cost, the impact of a stronger U.S. dollar, and the effectsof the Alstom acquisition.
Revenues Profit2014 $ 20.6 $ 4.5Volume 0.8 0.2Price 0.1 0.1Foreign Exchange (0.8) (0.1)(Inflation)/Deflation N/A 0.2Mix N/A 0.1Productivity N/A (0.4)Other - -Alstom 0.9 (0.1)2015 $ 21.5 $ 4.5 *Non-GAAP Financial Measure
GE 2016 FORM 10-K 39

RENEWABLE ENERGY
BUSINESS OVERVIEW
Leader: Jérôme Pécresse
Headquarters & Operations
· Senior Vice President, GE and President & CEO, GERenewable Energy· Former Alstom Renewable Power Executive Vice
President
· 7% of segment revenues· 8% of industrial segment revenues· 3% of industrial segment profit· Headquarters: Paris, France· Serving customers in 80+ countries· Employees: approximately 12,000
Products & Services
GE Renewable Energy makes renewable power sources affordable, accessible, and reliable for the benefit of people everywhere. With oneof the broadest technology portfolios in the industry, Renewable Energy creates value for customers with solutions from onshore andoffshore wind, hydro, and emerging low carbon technologies. With operations in 40+ countries around the world, Renewable Energy candeliver solutions to where its customers need them most.
· Onshore Wind – provides technology and services for the onshore wind power industry by providing wind turbine platforms and hardware and software tooptimize wind resources. Wind services help customers improve availability and value of their assets over the lifetime of the fleet. Digital Wind Farm is a sitelevel solution, creating a dynamic, connected and adaptable ecosystem that improves our customers' fleet operations.
· Offshore Wind – offers its high-yield offshore wind turbine, Haliade 150-6MW, which is compatible with bottom fixed and floating foundations. It uses theinnovative pure torque design and the Advanced High Density direct-drive Permanent Magnet Generator. Wind services support customers over the lifetimeof their fleet.
· Hydro – provides a full range of solutions, products and services to serve the hydropower industry from initial design to final commissioning, from Low Head/ Medium / High Head hydropower plants to pumped storage hydropower plants, small hydropower plants, concentrated solar power plants, geothermalpower plants and biomass power plants.
Competition & RegulationRenewable energy is now mainstream and more able to compete with other sources of power generation. While many factors, including government incentivesand specific market rules, affect how renewable energy can deliver outcomes for customers in a given region, the point is the same: renewable energy isincreasingly able to compete with fossil fuels. That is in large part due to technology. New innovations such as the digitization of renewable energy continue todrive down costs. We are also helping to make renewable energy more competitive through wind turbine product improvements, including larger rotors, tallertowers and higher nameplate ratings that continue to drive down the cost of wind energy. As industry models continue to evolve, our digital strategy andinvestments in technical innovation will position us to add value for customers looking for clean, renewable energy.
GE 2016 FORM 10-K 40

OPERATIONAL OVERVIEW(Dollarsinbillions)
2016 GEOGRAPHIC REVENUES: $ 9.0 BILLION ORDERS
Equipment Services
(a) Includes $0.5 billion related to Alstom(b) Includes $1.8 billion related to Alstom
2016 SUB-SEGMENT REVENUES BACKLOG
Equipment Services
(a) Includes $5.3 billion related to Alstom(b) Includes $5.5 billion related to Alstom
EQUIPMENT/SERVICES REVENUES UNIT SALES
Services Equipment SIGNIFICANT TRENDS & DEVELOPMENTS
· Renewable energy has experienced a surge of development in the last decade. Renewable energy capacity additions account for approximately half of allpower plant additions worldwide.
· The market to "repower" existing wind turbines – i.e., upgrade units that have been in service for a number of years to increase their efficiency andperformance – is growing as the existing Onshore Wind turbine fleet is aging. Repowering allows customers to increase the annual energy output of theirinstalled base, provide more competitively priced energy, and extend the life of their assets.
· New Product Introductions continue to be a key lever as our customers show a willingness to invest in new technology that decreases the levelized cost ofenergy.
· The $1.7 billion planned acquisition of LM Wind Power will bolster the ability of the GE Onshore and Offshore wind businesses to add value for customerswhile in-sourcing production and also better serve the customers of LM Wind Power.
· In 2016, we introduced new software applications suite for the Digital Wind Farm. The new apps, which streamline wind farm operations, are compatiblewith the company's latest 2 and 3 MW wind turbine platforms and GE's broader Predix software and diagnostics platform. The new applications can reducemaintenance costs by up to 10 percent and deliver one-to-three percent of additional revenue per site.
· The Offshore Wind business supported its customer, Deepwater Wind, in bringing the first ever offshore wind farm – the 30MW Block Island Wind Farmnear Rhode Island – into commercial operation in the U.S.
· Continued competitive pressure from other wind turbine producers, as well as from other energy sources such as primarily solar photovoltaic, reinforced bya general move to auction mechanisms, increases price pressure and the need for innovation in the wind market.
GE 2016 FORM 10-K 41

FINANCIAL OVERVIEW(Dollarsinbillions)
SEGMENT REVENUES SEGMENT PROFIT SEGMENT PROFIT MARGIN
(a) $6.2 billion, excluding $0.1 billionrelated to Alstom*(b) $7.9 billion, excluding $1.2 billionrelated to Alstom*
Equipment
Services
(a) $0.5 billion, excluding $(0.1) billion related toAlstom*(b) $0.5 billion, excluding an insignificant amountrelated to Alstom*
(a) 8.1%, excluding (79.3)% related to Alstom*(b) 6.9%, excluding 2.6% related to Alstom*
SEGMENT REVENUES & PROFIT WALK: COMMENTARY:2016 – 2015 2016 – 2015
Segment revenues up $2.8 billion (44%);Segment profit up $0.1 billion (34%) as a result of:
· The increase in revenues was due to higher volume, mainly driven byhigher core equipment sales at Onshore Wind as a result of shipping 420more onshore wind turbines than in the prior year, as well as higher sales atHydro, driven by the effects of the Alstom acquisition. The increase waspartially offset by lower other income, including negative foreign exchangetransactional hedge impacts, and lower prices.· The increase in profit was due to material deflation and higher volume,driven primarily by Onshore Wind, partially offset by lower other income,including negative foreign exchange transactional hedge impacts, lowerprices and an unfavorable business mix, driven by low margin projects withhigher services margins.
Revenues Profit2015 $ 6.3 $ 0.4Volume 2.0 0.1Price (0.1) (0.1)Foreign Exchange (0.1) -(Inflation)/Deflation N/A 0.2Mix N/A (0.1)Productivity N/A -Other (0.1) (0.1)Alstom 1.1 0.12016 $ 9.0 $ 0.6
2015 – 2014 2015 – 2014
Segment revenues down $0.1 billion (2%);Segment profit down $0.3 billion (38%) as a result of:
· The decrease in revenues was primarily driven by the effects of astronger U.S. dollar, partially offset by higher volume, driven by the sale of 2MW onshore units, higher prices, the effects of the Alstom acquisition andother income.· The decrease in profit was due to lower productivity, primarily driven by ashift to new products and technology, the effects of inflation, the effects of theAlstom acquisition and negative business mix, partially offset by higher pricesand other income.
Revenues Profit2014 $ 6.4 $ 0.7Volume 0.3 -Price 0.1 0.1Foreign Exchange (0.6) -(Inflation)/Deflation N/A (0.1)Mix N/A (0.1)Productivity N/A (0.1)Other 0.1 0.1Alstom 0.1 (0.1)2015 $ 6.3 $ 0.4 *Non-GAAP Financial Measure
GE 2016 FORM 10-K 42

OIL & GAS
BUSINESS OVERVIEW
Leader: Lorenzo Simonelli
Headquarters & Operations
· Senior Vice President, GE and President & CEO,GE Oil & Gas· Over 20 years of service with General Electric
· 10% of segment revenues· 11% of industrial segment revenues· 8% of industrial segment profit· Headquarters: London, UK· Serving customers in 140+ countries· Employees: approximately 34,000
Products & Services Oil & Gas serves all segments of the oil and gas industry, from drilling, completion, production and oil field operations, to transportation via
liquefied natural gas (LNG) and pipelines. In addition, Oil & Gas provides industrial power generation and compression solutions to therefining and petrochemicals segments. Oil & Gas also delivers pipeline integrity solutions and a wide range of sensing, inspection andmonitoring technologies. Oil & Gas exploits technological innovation from other GE segments, such as Aviation and Healthcare, tocontinuously improve oil and gas industry performance, output and productivity.
·· Turbomachinery Solutions (TMS) –provides equipment and related services for mechanical-drive, compression and power-generation applicationsacross the oil and gas industry. Our designs deliver high capacities and efficiencies, increase product flow and decrease both operational andenvironmental risks in the most extreme conditions, pressures and temperatures. Our portfolio includes drivers (aero-derivative gas turbines, heavy-duty gas turbines and synchronous and induction electric motors), compressors (centrifugal and axial, direct drive high speed, integrated, subseacompressors and turbo expanders), and turn-key solutions (industrial modules and waste heat recovery).
· Subsea Systems & Drilling (SS&D) –provides a broad portfolio of subsea products and services required to facilitate the safe and reliable flow ofhydrocarbons from the subsea wellhead to the surface. In addition, the sub-segment designs and manufactures onshore and offshore drilling andproduction systems and equipment for floating production platforms and provides a full range of services related to onshore and offshore drillingactivities.
· Digital Solutions (DS) – provides equipment and services for a wide range of industries, including oil & gas, power generation, aerospace, metals,and transportation. The offerings include sensor-based measurement; non-destructive testing and inspection; turbine, generator and plant controls andcondition monitoring, as well as pipeline integrity solutions.
· Surface – provides products and services for onshore oil & gas wells and manufactures artificial lift equipment for extracting crude oil and other fluidsfrom wells. Specific products include downhole tools for well integrity, dry trees and surface wellheads, electric submersible pumps, surface wellheads,wireline logging, artificial lift technologies, drilling pressure control equipment.
· Downstream Technology Solutions (DTS) – provides products and services to serve the downstream segments of the industry including refining,petrochemical, distributed gas, flow and process control and other industrial applications. Products include steam turbines, reciprocating and centrifugalcompressors, pumps, valves, and compressed natural gas (CNG) and small-scale LNG solutions used primarily for shale oil and gas field development.
Competition & RegulationDemand for oil and gas equipment and services is global and, as a result, is sensitive to the economic and political environment of each country in which we dobusiness. We are subject to the regulatory bodies of the countries in which we operate. Our products are subject to regulation by U.S. and non-U.S. energypolicies.
GE 2016 FORM 10-K 43

OPERATIONAL OVERVIEW(Dollarsinbillions)
2016 GEOGRAPHIC REVENUES: $ 12.9 BILLION ORDERS
Equipment Services
(a) Includes $0.1 billion related to Alstom 2016 SUB-SEGMENT REVENUES BACKLOG
Equipment Services
(a ) Previously referred to as Measurement & Controls (M&C) (a) Includes $0.1 billion related to Alstom EQUIPMENT/SERVICES REVENUES
Services Equipment
SIGNIFICANT TRENDS & DEVELOPMENTS
· In October 2016, we announced that our Oil & Gas business would combine with Baker Hughes to create a world-leading oilfield technology provider withmix of service and equipment. The combined businesses will be a leading equipment, technology and services provider in the oil and gas industry. Thetransaction is subject to the approval of Baker Hughes shareholders, regulatory approvals and other customary closing conditions.
· Lower oil prices leading to reductions in customers' forecasted capital expenditures create industry challenges, the effects of which are uncertain.· We are impacted by volatility in foreign currency exchange rates mainly due to a high concentration of non-U.S. dollar denominated business as well as
long-term contracts denominated in multiple currencies.· In 2015, a portion of the Distributed Power business that provides turbines for oil and gas applications was realigned from the Power segment to the Oil &
Gas segment .· We continue to take significant cost reduction actions in response to the weakening oil & gas market.
GE 2016 FORM 10-K 44

FINANCIAL OVERVIEW(Dollarsinbillions)
SEGMENT REVENUES SEGMENT PROFIT SEGMENT PROFIT MARGIN
(a) $12.8 billion, excluding $0.1 billion relatedto Alstom*
Equipment Services
(a) $1.4 billion, excluding an insignificant amountrelated to Alstom*
(a) 10.8%, excluding 6.5% related to Alstom*
SEGMENT REVENUES & PROFIT WALK: COMMENTARY:2016 – 2015 2016 – 2015
Segment revenues down $3.6 billion (22%);Segment profit down $1.0 billion (43%) as a result of:
· The decrease in revenues was mainly due to lower core volume acrossall sub-segments, primarily Surface and SS&D, due to lower oil prices, as wellas the effects of a stronger U.S. dollar, and lower other income, includingnegative foreign exchange transactional hedge impacts, partially offset by theeffects of the Alstom acquisition.· The decrease in profit was primarily market driven, mainly due to lowercore volume across all sub-segments due to lower oil prices, which, despitethe effects of restructuring actions, drove lower cost productivity. Profit wasalso adversely impacted by unfavorable foreign exchange transactionalhedge impacts in the year. These decreases were partially offset by materialdeflation. Operating profit excluding the effects of foreign exchange of $0.1billion was $1.5 billion (down 37% compared with prior year).*
Revenues Profit2015 $ 16.5 $ 2.4Volume (3.0) (0.4)Price (0.3) (0.3)Foreign Exchange (0.3) -(Inflation)/Deflation N/A 0.2Mix N/A -Productivity N/A (0.5)Other (0.1) -Alstom 0.1 -2016 $ 12.9 $ 1.4
2015 – 2014 2015 – 2014
Segment revenues down $2.6 billion (14%);Segment profit down $0.3 billion (12%) as a result of:
· The decrease in revenues was primarily due to the impact of a strongerU.S. dollar and lower volume at Surface and SS&D, driven by lower oil prices.Organic revenues* were down 5% compared with prior year.· The decrease in profit was primarily due to the impact of a stronger U.S.dollar and lower volume at Surface and SS&D, driven by lower oil prices,partially offset by the effects of deflation and cost productivity. Organic profit*increased 1% compared with prior year.
Revenues Profit2014 $ 19.1 $ 2.8Volume (1.0) (0.1)Price - -Foreign Exchange (1.6) (0.3)(Inflation)/Deflation N/A 0.1Mix N/A -Productivity N/A 0.1Other - -Alstom - -2015 $ 16.5 $ 2.4 *Non-GAAP Financial Measure
GE 2016 FORM 10-K 45

AVIATION
BUSINESS OVERVIEW
Leader: David Joyce
Headquarters & Operations
· Vice Chairman, GE and President & CEO, GEAviation· Over 30 years of service with General Electric
· 21% of segment revenues· 23% of industrial segment revenues· 35% of industrial segment profit· Headquarters: Cincinnati, OH· Serving customers in 120+ countries· Employees: approximately 45,000
Products & Services
Aviation designs and produces commercial and military aircraft engines, integrated digital components, electric power and mechanicalaircraft systems. We also provide aftermarket services to support our products.
· Commercial Engines –manufactures jet engines and turboprops for commercial airframes. Our commercial engines power aircraft in all categories;regional, narrowbody and widebody. We also manufacture engines and components for business and general aviation segments.
· Commercial Services –provides maintenance, component repair and overhaul services (MRO), including sales of replacement parts.
· Military –manufactures jet engines for military airframes. Our military engines power a wide variety of military aircraft including fighters, bombers, tankers,helicopters and surveillance aircraft, as well as marine applications. We provide maintenance, component repair and overhaul services, including sales ofreplacement parts.
· Systems –provides components, systems and services for commercial and military segments. This includes avionics systems, aviation electric powersystems, flight efficiency and intelligent operation services, aircraft structures and Avio Aero.
· Additive –provides machines for metal additive manufacturing for industry and comprises our existing technologies as well as two new acquisitions,enabling the design and manufacture of complex parts and leverage of technology for improved cost and performance.
· We also produce and market engines through CFM International, a company jointly owned by GE and Snecma, a subsidiary of SAFRAN of France, andEngine Alliance, LLC, a company jointly owned by GE and the Pratt & Whitney division of United Technologies Corporation. New engines are also beingdesigned and marketed in a joint venture with Honda Aero, Inc., a division of Honda Motor Co., Ltd.
Competition & RegulationThe global businesses for aircraft jet engines, maintenance component repair and overhaul services (including parts sales) are highly competitive. Both U.S. andnon-U.S. markets are important to the growth and success of the business. Product development cycles are long and product quality and efficiency are critical tosuccess. Research and development expenditures are important in this business, as are focused intellectual property strategies and protection of key aircraftengine design, manufacture, repair and product upgrade technologies. Aircraft engine orders and systems tend to follow civil air travel and demand and militaryprocurement cycles.
Our product, services and activities are subject to a number of regulators such as by the U.S. Federal Aviation Administration (FAA), European Aviation SafetyAgency (EASA) and other regulatory bodies.
GE 2016 FORM 10-K 46

OPERATIONAL OVERVIEW(Dollarsinbillions)
2016 GEOGRAPHIC REVENUES: $ 26.3 BILLION ORDERS
Equipment Services
2016 SUB-SEGMENT REVENUES BACKLOG
Equipment Services
EQUIPMENT/SERVICES REVENUES UNIT SALES
(a) GEnx and LEAP engines are a subset of commercial engines(b) Commercial spares shipment rate in millions of dollars per day Services Equipment
SIGNIFICANT TRENDS & DEVELOPMENTS
· The installed base continues to grow with new product launches. In 2016, through our CFM joint venture, we successfully launched the LEAP engine forapplication on the Airbus A320 NEO. Another variant of the engine, applied to the Boeing 737 MAX aircraft, is expected to enter in service in 2017. We arealso continuing development on the Advanced Turbo Prop program, and the GE9X engine incorporating the latest technologies for application in thewidebody aircraft space.
· During the fourth quarter of 2016, Aviation completed its acquisition of a 75% stake in Concept Laser GmbH, a German company specializing in powderbed based laser metal printing, and a 76.2% stake in Arcam AB, a Swedish company specializing in electron beam melting systems. We expect both ofthese investments in the additive manufacturing space to open a new market segment and also realize manufacturing efficiencies for GE.
· Our digital industrial business is providing insights and operational value for our customers, unlocking opportunities to deliver more productivity beyond ourtraditional services and becoming a better partner as we work on solving our customers' toughest operational problems. Our digital factory initiatives,including digital design tools, advanced and automated inspection, and advanced manufacturing analytics are enabling our operations, partners andsuppliers to dramatically reduce cycle time while improving quality.
· We expect an uptick in military shipments and continue to advance our next generation science and technology programs, two of which were awardedcontracts in 2016.
GE 2016 FORM 10-K 47

FINANCIAL OVERVIEW(Dollarsinbillions)
SEGMENT REVENUES SEGMENT PROFIT SEGMENT PROFIT MARGIN Equipment
Services
SEGMENT REVENUES & PROFIT WALK: COMMENTARY:2016 – 2015 2016 – 2015
Segment revenues up $1.6 billion (6%);Segment profit up $0.6 billion (11%) as a result of:
· The increase in revenues was primarily due to higher services volumeand LEAP engine shipments, partially offset by lower equipment volumedriven by lower Military shipments. Revenues also increased as a result ofhigher engines and services pricing. Prices increased in response to highermaterial and conversion costs.· The increase in profit was mainly due to higher cost productivity, drivenby higher services volume and prices. These increases were partially offsetby the effects of inflation, an unfavorable business mix driven by LEAPshipments, and lower other income.
Revenues Profit2015 $ 24.7 $ 5.5Volume 1.5 0.3Price 0.2 0.2Foreign Exchange - -(Inflation)/Deflation N/A (0.2)Mix N/A (0.1)Productivity N/A 0.5Other - (0.1)2016 $ 26.3 $ 6.1 2015 – 2014 2015 – 2014
Segment revenues up $0.7 billion (3%);Segment profit up $0.5 billion (11%) as a result of:
· The increase in revenues was due to higher prices in CommercialEngines and higher services volume, partially offset by decreased equipmentsales.· The increase in profit was mainly due to higher prices, favorablebusiness mix and higher cost productivity, partially offset by the effects ofinflation and lower other income.
Revenues Profit2014 $ 24.0 $ 5.0Volume 0.1 -Price 0.5 0.5Foreign Exchange - -(Inflation)/Deflation N/A (0.2)Mix N/A 0.2Productivity N/A 0.1Other - (0.1)2015 $ 24.7 $ 5.5
GE 2016 FORM 10-K 48

HEALTHCAREBUSINESS OVERVIEW
Leader: John L. Flannery
Headquarters & Operations
· Senior Vice President, GE and President &CEO, GE Healthcare· Over 25 years of service with General Electric
· 15% of segment revenues· 16% of industrial segment revenues· 18% of industrial segment profit· Headquarters: Chicago, IL· Serving customers in 140+ countries· Employees: approximately 54,000
Products & Services
Healthcare provides essential healthcare technologies to developed and emerging markets and has expertise in medical imaging,digital solutions, patient monitoring and diagnostics, drug discovery, biopharmaceutical manufacturing technologies and performanceimprovement solutions. Products and services are sold worldwide primarily to hospitals, medical facilities, pharmaceutical andbiotechnology companies, and to the life science research market .
· Healthcare Systems –provides a wide range of technologies and services that include diagnostic imaging and clinical systems. Diagnostic imagingsystems such as X-ray, digital mammography, computed tomography (CT), magnetic resonance (MR), surgical and interventional imaging and molecularimaging technologies allow clinicians to see inside the human body more clearly. Clinical systems such as ultrasound, electrocardiography (ECG), bonedensitometry, patient monitoring, incubators and infant warmers, respiratory care, and anesthesia management that enable clinicians to provide better carefor patients every day – from wellness screening to advanced diagnostics to life-saving treatment. Healthcare systems also offers product services thatinclude remote diagnostic and repair services for medical equipment manufactured by GE and by others.
· Life Sciences – delivers products, services and manufacturing solutions for drug discovery, the biopharmaceutical industry and cellular technologies, soscientists and specialists discover new ways to predict, diagnose and treat disease. It also researches, manufactures and markets innovative imagingagents used during medical scanning procedures to highlight organs, tissue and functions inside the human body, to aid physicians in the early detection,diagnosis and management of disease through advanced in-vivo diagnostics.
· Healthcare Digital – provides medical technologies, software, analytics, cloud solutions, implementation and services to drive increased access,enhanced quality and more affordable healthcare around the world. By combining digital and industrial, software and hardware, Healthcare Digital deliversintegrated digital solutions that improve outcomes.
Competition & RegulationHealthcare competes with a variety of U.S. and non-U.S. manufacturers and services providers. Customers require products and services that allow them toprovide better access to healthcare, improve the affordability of care, and improve the quality of patient outcomes. Technology and solution innovation to provideproducts that meet these customer requirements and competitive pricing are among the key factors affecting competition for these products and services. New technologiesand solutions could make our products and services obsolete unless we continue to develop new and improved products and services.
Our products are subject to regulation by numerous government agencies, including the U.S. Food and Drug Administration (U.S. FDA), as well as various lawsand regulations that apply to claims submitted under Medicare, Medicaid or other government funded healthcare programs .
GE 2016 FORM 10-K 49

OPERATIONAL OVERVIEW(Dollarsinbillions)
2016 GEOGRAPHIC REVENUES: $ 18.3 BILLION ORDERS
Equipment Services
2016 SUB-SEGMENT REVENUES BACKLOG
Equipment Services
EQUIPMENT/SERVICES REVENUES
Services Equipment
SIGNIFICANT TRENDS & DEVELOPMENTS
· We continue to lead in technology innovation with greater focus on productivity based technology, services, and IT/cloud-based solutions as healthcareproviders seek greater productivity and efficiency.
· The U.S. market is facing uncertainty regarding the future of the Affordable Care Act. Emerging markets are expected to grow long-term with short-termvolatility. The China market was more robust in 2016 and is expected to be a source of growth.
· Life Sciences is expanding its business through bioprocess market growth and enterprise solutions.
GE 2016 FORM 10-K 50

FINANCIAL OVERVIEW(Dollarsinbillions)
SEGMENT REVENUES SEGMENT PROFIT SEGMENT PROFIT MARGIN Equipment Services
SEGMENT REVENUES & PROFIT WALK: COMMENTARY:2016 – 2015 2016 – 2015
Segment revenues up $0.7 billion (4%);Segment profit up $0.3 billion (10%) as a result of: · The increase in revenues was primarily due to higher volume in Life Sciencesand Healthcare Systems, as well as higher other income, partially offset by lowerprices at Healthcare Systems and the effects of a stronger U.S. dollar.· The increase in profit was primarily driven by higher cost productivity,including the effects of previous restructuring actions and strong volume growth,partially offset by lower prices at Healthcare Systems.
Revenues Profit2015 $ 17.6 $ 2.9Volume 1.0 0.2Price (0.3) (0.3)Foreign Exchange (0.1) -(Inflation)/Deflation N/A -Mix N/A -Productivity N/A 0.4Other 0.1 -2016 $ 18.3 $ 3.2 2015 – 2014 2015 – 2014
Segment revenues down $0.7 billion (4%);Segment profit down $0.2 billion (5%) as a result of: · The decrease in revenues was primarily due to the effects of a stronger U.S.dollar, as well as lower prices, mainly at Healthcare Systems, partially offset byhigher volume in Life Sciences and Healthcare Systems.· The decrease in profit was primarily due to lower prices, mainly in HealthcareSystems, the effects of inflation and the impact of a stronger U.S. dollar, partiallyoffset by higher productivity, as increased R&D and related costs were more thanoffset by higher cost productivity, and higher volume.
Revenues Profit2014 $ 18.3 $ 3.0Volume 0.8 0.1Price (0.3) (0.3)Foreign Exchange (1.1) (0.1)(Inflation)/Deflation N/A (0.2)Mix N/A -Productivity N/A 0.3Other (0.1) -2015 $ 17.6 $ 2.9
GE 2016 FORM 10-K 51

TRANSPORTATION
BUSINESS OVERVIEW
Leader: Jamie S. Miller
Headquarters & Operations
· Senior Vice President, GE and President & CEO,GE Transportation· 8 years of service with General Electric
· 4% of segment revenues· 4% of industrial segment revenues· 6% of industrial segment profit· Headquarters: Chicago, IL· Serving customers in 60+ countries· Employees: approximately 10,000
Products & Services
Transportation is a global technology leader and supplier to the railroad, mining, marine, stationary power and drilling industries.Products and services offered by Transportation include:
· Locomotives –we provide freight and passenger locomotives as well as rail services to help solve rail challenges. We manufacture high-horsepower,
diesel-electric locomotives including the Evolution Series TM , which meets or exceeds the U.S. Environmental Protection Agency's (EPA) Tier 4requirements for freight and passenger applications.
· Services –we develop partnerships that support advisory services, parts, integrated software solutions and data analytics. Our comprehensive offeringsinclude tailored service programs, high-quality parts for GE and other locomotive platforms, overhaul, repair and upgrade services, and wreck repair. Ourportfolio provides the people, partnerships and leading software to optimize operations and asset utilization.
· Digital Solutions –we offer a suite of software-enabled solutions to help our customers lower operational costs, increase productivity and improve servicequality and reliability.
·· Mining – we provide mining equipment and services. The portfolio includes drive systems for off-highway vehicles, mining equipment, mining power andproductivity.
·· Marine, Stationary & Drilling – we offer marine diesel engines and stationary power diesel engines and motors for land and offshore drilling rigs.
Competition & RegulationThe competitive environment for locomotives and mining equipment and services consists of large global competitors. A number of smaller competitors competein a limited-size product range and geographic regions. North America will remain a focus of the industry, due to the EPA Tier 4 emissions standard that wentinto effect in 2015.
GE 2016 FORM 10-K 52

OPERATIONAL OVERVIEW(Dollarsinbillions)
2016 GEOGRAPHIC REVENUES: $ 4.7 BILLION ORDERS
Equipment Services
2016 SUB-SEGMENT REVENUES BACKLOG
(a) Includes Digital Solutions and Marine, Stationary & Drilling
Equipment Services
EQUIPMENT/SERVICES REVENUES
UNIT SALES
Services Equipment
SIGNIFICANT TRENDS & DEVELOPMENTS · Rail carload volumes, especially in North America, continue to decline and the number of parked locomotives remained high throughout 2016.· Demand for natural resources remains low, driving a decline in the overall mining industry.· Global locomotive deliveries were down from 985 units in 2015 to 749 units in 2016, due to a lower need for power across the railroad industry.· The Signaling business was sold to Alstom on November 2, 2015 for approximately $0.8 billion, on which we recognized a pre-tax gain of $0.6 billion, which
was reported in Corporate.
GE 2016 FORM 10-K 53

FINANCIAL OVERVIEW(Dollarsinbillions)
SEGMENT REVENUES SEGMENT PROFIT SEGMENT PROFIT MARGIN Equipment
Services
SEGMENT REVENUES & PROFIT WALK: COMMENTARY:2016 – 2015 2016 – 2015
Segment revenues down $1.2 billion (21%);Segment profit down $0.2 billion (16%) as a result of:
· The decrease in revenues was primarily driven by lower equipmentvolume, driven by 236 fewer locomotive shipments than in the prior year, aswell as lower services volume due to higher parked locomotives. Thedecrease in revenues was also impacted by the Signaling businessdisposition in November 2015.· The decrease in profit was primarily driven by lower volume, partiallyoffset by material deflation and higher cost productivity, as well as the effectsof restructuring actions.
Revenues Profit2015 $ 5.9 $ 1.3Volume (1.2) (0.2)Price - -Foreign Exchange - -(Inflation)/Deflation N/A 0.1Mix N/A -Productivity N/A -Other - -2016 $ 4.7 $ 1.1 2015 – 2014 2015 – 2014
Segment revenues up $0.3 billion (5%);Segment profit up $0.1 billion (13%) as a result of:
· The increase in revenues was primarily due to higher volume driven byTier 4 locomotive sales, partially offset by the Signaling disposition.· The increase in profit was primarily due to higher productivity, including areduction in SG&A cost, and higher volume driven by Tier 4 locomotive sales,partially offset by negative business mix.
Revenues Profit2014 $ 5.7 $ 1.1Volume 0.3 0.1Price - -Foreign Exchange - -(Inflation)/Deflation N/A -Mix N/A (0.2)Productivity N/A 0.2Other - -2015 $ 5.9 $ 1.3
GE 2016 FORM 10-K 54

ENERGY CONNECTIONS & LIGHTING
BUSINESS OVERVIEW
Leaders: Russell Stokes, William Lacey & Maryrose Sylvester
Headquarters & Operations
·· Senior Vice President, GE and President & CEO,
GE Energy Connections·· Over 20 years of service with General Electric ·· Vice President, GE and President & CEO, GE
Lighting·· 25 years of service with General Electric ·· Vice President, GE and President & CEO, Current,
powered by GE·· Over 25 years of service with General Electric
· 12% of segment revenues· 13% of industrial segment revenues· 2% of industrial segment profit· Energy Connections HQ: Atlanta, GA· GE Lighting HQ: East Cleveland, OH· Current, powered by GE HQ: Boston, MA· Serving customers in 150+ countries· Employees: approximately 53,000
Products & Services
GE Energy Connections designs and deploys industry-leading technologies that transport, convert, automate and optimizeenergy to ensure safe, efficient and reliable electrical power. Combining all the resources and scale of the world's digitalindustrial company, we connect brilliant machines, grids, and systems to power utility, oil & gas, marine, mining and renewablescustomers, that keep our world running.Lighting includes the GE Lighting business, which is primarily focused on consumer lighting applications in the U.S., andCurrent, powered by GE (Current), which is focused on providing energy efficiency and productivity solutions for commercial andindustrial customers.
Energy Connections· Industrial Solutions –creates advanced technologies that safely, reliably and efficiently distribute and control electricity to protect people, property and
equipment. We provide high performance software and control solutions and offer products such as circuit breakers, relays, arresters, switchgear, panelboards and repair for the commercial, data center, healthcare, mining, renewable energy, oil & gas, water and telecommunication markets.
· Grid Solutions –a GE and Alstom joint venture, equips 90% of power utilities worldwide to bring power from the point of generation to end consumers.With over 200 years combined experience in providing advanced energy solutions, our products and services enable more resilient, efficient and reliablepower systems. Our products and services, such as high voltage equipment, power electronics, automation and protection equipment, software solutions, inaddition to our robust projects and services capabilities modernize the grid. We serve industries such as generation, transmission, distribution, oil & gas,telecommunication, mining and water and our strategic partnership ventures, primarily in Mexico and China, allow us to support our customers throughvarious product and service offerings.
· Power Conversion – applies the science and systems of power conversion to help drive the electric transformation of the world's energy infrastructure. Ourproduct portfolio includes motors, generators, automation and control equipment and drives for energy intensive industries such as marine, oil & gas,renewable energy, mining, rail, metals, test systems and water.
GE 2016 FORM 10-K 55

· Automation & Controls – serves as the Controls Center of Excellence for GE and is leading the next chapter in GE's digital industrial journey andtransformation. In partnership with GE Digital, the Global Research Center, and GE businesses around the world, we are focused on the future of controlsolutions – helping customers become more productive and efficient. Each year $21 billion of GE equipment is sold with controls inside of them. Controlsare critical to keeping industry running and connected. They are the brains of industrial equipment, connecting data and machines.
Lighting· GE Lighting –focused on driving innovation and growth in light emitting diode (LED) and connected home technology. The business offers LEDs in a
variety of shapes, sizes, wattages and color temperatures. It's also investing in the growing smart home category, building a suite of connected lightingproducts with simple connection points that offer new opportunities to do more at home.
· Current – delivers energy efficiency and productivity solutions for commercial and industrial customers. We combine infrastructure technology like LEDand solar with new sensor-enabled data networks and Predix-based digital applications to help our customers reduce energy costs, better predict spendand gain business productivity insights. We partner with a wide variety of digital companies to help expand our application catalog, and we offer flexiblefinancing solutions that help our customers achieve faster payback periods and better long-term value.
Competition & RegulationEnergy Connections & Lighting faces competition from businesses operating with global presence and with deep energy domain expertise. Our products andservices sold to end customers are often subject to a number of regulatory specification and performance standards under different federal, state, foreign andenergy industry standards. The potential combination of energy technologies like lighting and solar with sensor-based data networks is unlocking new Internet ofThings (IoT) capabilities for the commercial and industrial market in which Current operates and introducing new competitors .
SIGNIFICANT TRENDS & DEVELOPMENTS
Energy Connections· We are continuing to see growth in renewable energy industries, specifically wind & solar industries, which is driving demand in our Power Conversion
business for equipment and services. This growth is offset by the decline in the oil & gas industry.· We see soft demand in the North American and European electrical distribution market, and continued soft demand in other parts of the developed world.
There are signs of market improvements in China, but the Asia Pacific region has mixed results.· The U.S. electrical grid capacity is high and load growth is expected to be slow in the near term; spending by utilities in the U.S. continues to be focused
more heavily on sustaining operations versus capital investment.· Integrating large shares of renewables will require strengthening of the grid and ensuring the availability of power plants to dispatch at short notice; these
system integration tools may present further business opportunities, and will be needed to pave the way for further decarbonization.· In December 2016, we announced our plan to sell our Industrial Solutions business.· The Intelligent Platforms Embedded Systems Products business of Automation & Control was sold in December 2015 for approximately $0.5 billion and the
Electricity Meters business of Grid Solutions was sold in December 2015 for approximately $0.2 billion.
Lighting· In the last decade, the lighting industry has seen a major technology pivot away from traditional lighting products, including incandescent, halogen and
specialty linear fluorescent lamps to energy-saving LEDs. That shift has been supported by the U.S. government phasing out incandescent bulbs anddeclining prices overall for LEDs. We estimate half of all residential sockets in the U.S. will convert to LED by 2020. This shift aligns with our LED focus.
· In 2016, GE Lighting and Current both made strategic organizational changes to help reduce costs, focus on key markets and simplify the businesses.
Appliances· In June 2016, we completed the sale of our Appliances business to Haier for $5.6 billion (including $0.8 billion from the sale of receivables originated in our
Appliances business and sold from GE Capital to Haier), on which we recognized an after-tax gain of $1.8 billion, which is reported in Corporate .
GE 2016 FORM 10-K 56

OPERATIONAL OVERVIEW(Dollarsinbillions)
2016 GEOGRAPHIC REVENUES: $ 15.1 BILLION ORDERS
Equipment Services
(a) Includes $1.1 billion related to Alstom(b) Included $5.5 billion related to Alstom
2016 SUB-SEGMENT REVENUES
BACKLOG
Equipment Services
(a) Includes Current, powered by GE(b) Reflects historical results of Appliances prior to its sale in June 2016
(a) Included $8.4 billion related to Alstom(b) Included $7.9 billion related to Alstom
EQUIPMENT/SERVICES REVENUES
Services Equipment
GE 2016 FORM 10-K 57

FINANCIAL OVERVIEW(Dollarsinbillions)
SEGMENT REVENUES SEGMENT PROFIT SEGMENT PROFIT MARGIN
(a) $15.4 billion, excluding $1.0 billion relatedto Alstom*(b) $9.7 billion, excluding $5.5 billion relatedto Alstom*, and $7.1 billion, excluding $8.1billion related to Alstom and Appliances*
Equipment Services
(a) $0.9 billion, excluding an insignificant amountrelated to Alstom*(b) $0.1 billion, excluding $0.2 billion related to Alstom*,and $(0.1) billion, excluding $0.4 billion related toAlstom and Appliances*
(a) 6.2%, excluding (0.5)% related to Alstom*(b) 1.5%, excluding 3.1% related to Alstom*, and(1.6)%, excluding 5.3% related to Alstom andAppliances*
SEGMENT REVENUES & PROFIT WALK:
COMMENTARY:
2016 – 2015 2016 – 2015
Segment revenues down $1.2 billion (7%);Segment profit down $0.6 billion (67%) as a result of:
· Energy Connections revenues increased driven by the effects ofAlstom, including higher equipment sales at Grid, partially offset bycore decreases at Industrial Solutions and Power Conversion. Theincrease in revenues was partially offset by lower prices, the effectsof a stronger U.S. dollar, and lower other income, including thenegative foreign exchange transactional hedge impacts. Lightingrevenues decreased primarily due to lower traditional lighting salesand were partially offset by increases in LED revenues and non-lighting product sales in Current, as well as lower prices. Revenuesalso decreased as a result of the sale of Appliances in June 2016.· Energy Connections profit decreased primarily as a result oflower cost productivity, driven by core volume decreases, as well aslower other income, including negative foreign exchangetransactional hedge impacts, and an unfavorable business mix,partially offset by the effects of Alstom. Lighting profit decreased asa result of the investment in Current, lower other income and lowerprices, partially offset by material deflation. Profit also decreaseddue to the sale of Appliances in June 2016.
Revenues Profit2015 $ 16.4 $ 0.9Volume (1.7) (0.1)Price (0.1) (0.1)Foreign Exchange (0.2) -(Inflation)/Deflation N/A -Mix N/A (0.1)Productivity N/A (0.2)Other (0.1) (0.1)Alstom 4.5 0.2Appliances (3.7) (0.3)2016 $ 15.1 $ 0.3
*Non-GAAP Financial Measure
GE 2016 FORM 10-K 58
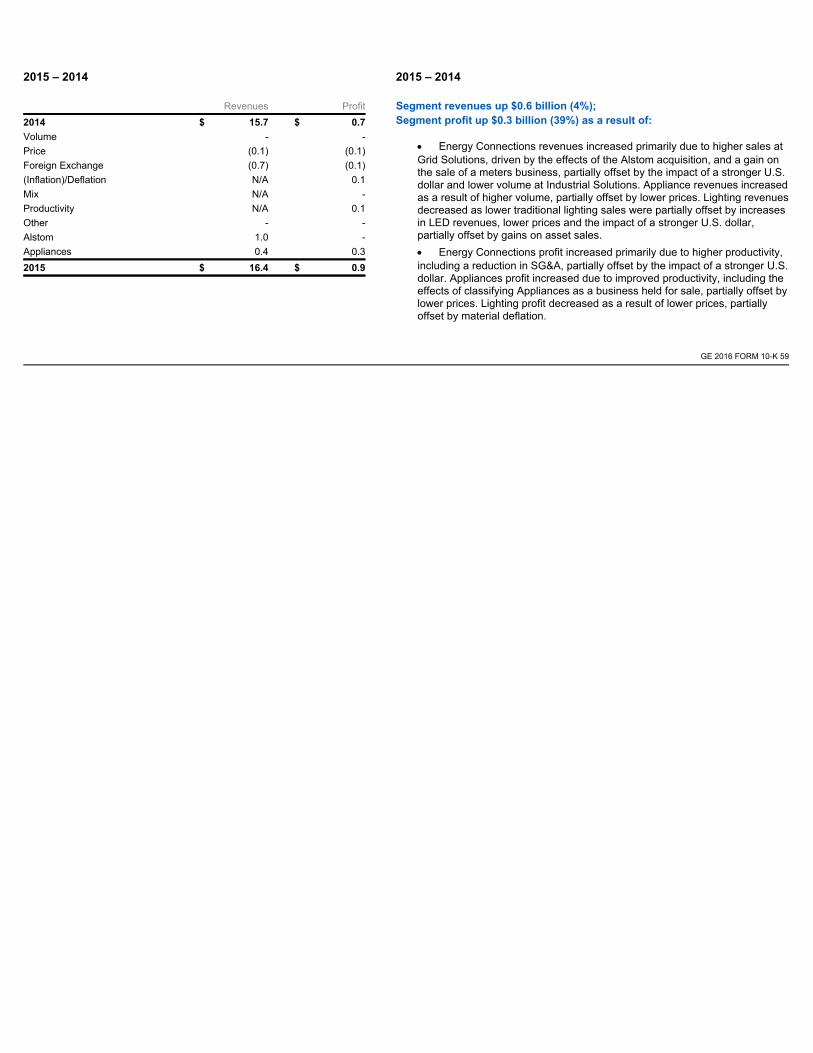
2015 – 2014 2015 – 2014
Segment revenues up $0.6 billion (4%);Segment profit up $0.3 billion (39%) as a result of:
· Energy Connections revenues increased primarily due to higher sales atGrid Solutions, driven by the effects of the Alstom acquisition, and a gain onthe sale of a meters business, partially offset by the impact of a stronger U.S.dollar and lower volume at Industrial Solutions. Appliance revenues increasedas a result of higher volume, partially offset by lower prices. Lighting revenuesdecreased as lower traditional lighting sales were partially offset by increasesin LED revenues, lower prices and the impact of a stronger U.S. dollar,partially offset by gains on asset sales.· Energy Connections profit increased primarily due to higher productivity,including a reduction in SG&A, partially offset by the impact of a stronger U.S.dollar. Appliances profit increased due to improved productivity, including theeffects of classifying Appliances as a business held for sale, partially offset bylower prices. Lighting profit decreased as a result of lower prices, partiallyoffset by material deflation.
Revenues Profit2014 $ 15.7 $ 0.7Volume - -Price (0.1) (0.1)Foreign Exchange (0.7) (0.1)(Inflation)/Deflation N/A 0.1Mix N/A -Productivity N/A 0.1Other - -Alstom 1.0 -Appliances 0.4 0.32015 $ 16.4 $ 0.9
GE 2016 FORM 10-K 59

CAPITALBUSINESS OVERVIEW
Leader: Richard Laxer Headquarters & Operations
· Senior Vice President, GE and Chairman & CEO,GE Capital
· Over 30 years of service with General Electric
· 9% of segment revenues· Headquarters: Norwalk, CT· Employees: approximately 6,000
Products & Services Capital is the financial services division of GE focused on customers and markets aligned with GE's industrial businesses, whether in developed economies oremerging markets. We provide financial products and services around the globe that are geared to utilize GE's industry specific expertise in aviation, energy,infrastructure, and healthcare to capitalize on market-specific opportunities. In addition, we continue to operate our run-off insurance activities as part of ourcontinuing operations. Our expertise, domain knowledge, and deep relationships create an environment for new hospitals to obtain necessary equipment, citiesto function more safely, and transportation networks to deliver people, goods, and services on time. We are the Capital in the GE Store. Products and servicesinclude:
· Industrial Finance (IF) – provides exclusive equipment financing solutions globally for the GE industrial businesses. In addition, its Working CapitalSolutions business provides critical working capital services to GE to help optimize cash management.
· Energy Financial Services (EFS) – a global energy investor that provides world class financial solutions and underwriting capabilities for Power,Renewable Energy, and Oil & Gas to meet rising demand and sustainability imperatives. EFS invests in long-lived, capital intensive energy projects andcompanies by providing structured equity, debt, leasing, partnership financing, project finance and broad-based commercial finance.
· GE Capital Aviation Services (GECAS) – offers commercial aircraft leasing, financing, services, and consulting with the industry's broadest range ofbusiness solutions.
As a result of the GE Capital Exit Plan, GE Capital's Real Estate business, Consumer business and most of its Commercial Lending and Leasing (CLL) businessare classified as discontinued operations and are no longer reported as part of the Capital segment. As such, all comparative prior period information has beenreclassified to reflect Real Estate, Consumer and most of CLL as discontinued operations. As of December 31, 2016, we have substantially completed thedispositions related to the GE Capital Exit Plan.
Competition & RegulationThe businesses in which we engage are subject to competition from various types of financial institutions, including commercial banks, investment banks,leasing companies, independent finance companies, finance companies associated with manufacturers and insurance and reinsurance companies.With the rescission of its designation as a nonbank SIFI in June 2016, GE Capital's activities are no longer subject to the consolidated supervision of the FederalReserve or subject to the enhanced prudential standards set forth in the Dodd Frank Wall Street Reform and Consumer Protection Act and its implementingregulations, including minimum regulatory capital and liquidity requirements, submission of annual resolution plans, the Volcker Rule and regulatory reportingrequirements.GE Capital's international operations are consolidated under GE Capital International Holdings Limited, a wholly owned subsidiary of GE Capital. GE CapitalInternational Holdings Limited continues to maintain its own capital structure and is supervised on a consolidated basis by the U.K. Prudential RegulationAuthority (PRA). The PRA's supervision includes capital and liquidity standards that could impact GE Capital's ability to pay dividends to GE. We expect to exitthe PRA's consolidated supervision in 2017.
GE 2016 FORM 10-K 60

OPERATIONAL OVERVIEW(Dollarsinbillions)
2016 GEOGRAPHIC REVENUES: $10.9 BILLION 2016 SUB-SEGMENT REVENUES
ENDING NET INVESTMENT, EXCLUDING LIQUIDITY* SUB-SEGMENT ASSET ALLOCATION AS OF DECEMBER 31, 2016
(a) $166 billion including discontinued operations(b) $93 billion including discontinued operations
SIGNIFICANT TRENDS & DEVELOPMENTS
· The GE Capital Exit Plan – As the GE Capital Exit Plan progresses, we will continue to incur interest on non-Verticals borrowings, restructuring costs andGE and GE Capital headquarters costs that are in excess of those allocated to the Verticals. These costs are recorded within other continuing operationswithin Capital.
*Non-GAAP Financial Measure
GE 2016 FORM 10-K 61

FINANCIAL OVERVIEW(Dollarsinbillions)
SEGMENT REVENUES SEGMENT PROFIT (LOSS)(a)
Total Capital Other Continuing Verticals
Total CapitalVerticals Other Continuing
(a) Interest and other financial chargesand income taxes areincluded indetermining segment profit for the Capitalsegment.
COMMENTARY: 2016 – 2015
Capital revenues increased $0.1 billion, or 1%, primarily due to lower impairments, higher gains and the effects of acquisitions, partially offset by organicrevenue declines, the effects of dispositions and the effects of currency exchange.
· Within Capital, Verticals revenues decreased by $0.2 billion , or 2%, as a result of organic revenue declines ($0.6 billion) and the effects of dispositions($0.2 billion), partially offset by higher gains ($0.3 billion), lower impairments ($0.2 billion), and the effects of acquisitions.
· Other Capital revenues increased $0.3 billion, or 99%, as a result of lower impairments ($0.2 billion) and organic revenue growth ($0.2 billion) partiallyoffset by the effects of currency exchange ($0.1 billion).
Capital net loss decreased by $6.7 billion, or 84%, primarily due to the absence of the 2015 charges associated with the GE Capital Exit Plan.· Within Capital, Verticals net earnings increased by $0.2 billion, or 14%, as a result of higher gains ($0.2 billion) and lower impairments ($0.2 billion),
partially offset by the effects of dispositions ($0.1 billion) and core decreases ($0.1 billion).
· Other Capital net loss decreased by $6.5 billion, or 67%, primarily as a result of:
· Lower tax expenses of $6.2 billion primarily related to the absence of the 2015 charges for repatriation of foreign earnings and write-off ofdeferred tax assets related to the GE Capital Exit Plan.
· 2016 tax benefits of $1.1 billion primarily related to increased tax efficiency of planned cash repatriations through increased foreign tax creditutilization of $0.8 billion and an IRS tax settlement of $0.3 billion.
· Lower impairment expenses of $0.8 billion resulting from the 2015 impairment of a coal-fired power plant in the U.S.
· Higher treasury operation expenses of $1.3 billion reflecting excess interest expense, costs associated with the February and May 2016 debttenders and derivative activities that reduce or eliminate interest rate, currency or market risk between financial assets and liabilities. Weexpect to continue to have excess interest costs in 2017. We may engage in liability management actions, such as buying back debt, basedon market and economic conditions.
· Charges of $0.3 billion associated with the preferred equity exchange that was completed in January 2016.
· Higher restructuring expenses of $0.2 billion.
GE 2016 FORM 10-K 62

COMMENTARY: 2015 – 2014
Capital revenues decreased by $0.5 billion, or 5%, primarily as a result of organic revenue declines, primarily due to lower ENI, lower gains and higherimpairments, partially offset by the effects of acquisitions and dispositions.
·Within Capital, Verticals revenues decreased by $0.7 billion, or 6%, as a result of organic revenue declines ($0.9 billion), lower gains ($0.2 billion) andhigher impairments ($0.1 billion), partially offset by the effects of acquisitions and dispositions ($0.5 billion).Capital net earnings decreased by $9.2 billion primarily due to charges associated with the GE Capital Exit Plan.
· Within Capital, Verticals net earnings increased by $0.1 billion, or 4%, as a result of lower equipment leased to others (ELTO) impairments ($0.1 billion)related to our operating lease portfolio of commercial aircraft and the effects of acquisitions and dispositions ($0.2 billion), partially offset by lower gains($0.1 billion) and core decreases ($0.1 billion).
· Other Capital net earnings decreased by $9.3 billion primarily as a result of the GE Capital Exit Plan as follows:
· Higher tax expenses of $7.0 billion primarily related to expected repatriation of foreign earnings and write-off of deferred tax assets related tothe GE Capital Exit Plan.
· Higher treasury operation expenses of $1.0 billion reflecting excess interest expense, including costs associated with the debt exchangecompleted in October 2015 and derivative activities that reduce or eliminate interest rate, currency or market risk between financial assets andliabilities.
· The 2015 $0.8 billion impairment of a coal-fired power plant in the U.S. related to a decision in the fourth quarter to exit the investment overtime.
GE 2016 FORM 10-K 63

GE CORPORATE ITEMS AND ELIMINATIONSGE Corporate Items and Eliminations is a caption used in the Segment Operations –Summary of Operating Segment table to reconcile the aggregated resultsof our segments to the consolidated results of the Company. As such, it includes corporate activities, including certain GE Digital activities, and the elimination ofinter-segment activities. Specifically, the GE Corporate Items and Eliminations amounts related to revenues and earnings include the results of disposedbusinesses, certain amounts not included in GE industrial operating segment results because they are excluded from measurement of their operatingperformance for internal and external purposes and the elimination of inter-segment activities. In addition, the GE Corporate Items and Eliminations amountsrelated to earnings include certain costs of our principal retirement plans, restructuring and other costs reported in Corporate, and the unallocated portion ofcertain corporate costs (such as research and development spending and costs related to our Global Growth Organization).
REVENUES AND OPERATING PROFIT (COST) (In millions) 2016 2015 2014 Revenues Gains (losses) on disposals(a) $ 3,444 $ 1,047 $ 91 NBCU settlement - 450 - Eliminations and other (3,812) (3,708) (3,954)Total Corporate Items and Eliminations $ (368) $ (2,211) $ (3,863) Operating profit (cost) Gains (losses) on disposals(a) $ 3,444 $ 1,047 $ 91 NBCU settlement - 450 - Principal retirement plans(b) (2,044) (2,760) (2,313) Restructuring and other charges (3,578) (1,734) (1,788) Eliminations and other (2,048) (2,111) (2,215)Total Corporate Items and Eliminations $ (4,226) $ (5,108) $ (6,225) CORPORATE COSTS (In millions) 2016 2015 2014 Total Corporate Items and Eliminations $ (4,226) $ (5,108) $ (6,225)Less non-operating pension cost* (2,052) (2,764) (2,120)Total Corporate costs (operating) * $ (2,175) $ (2,344) $ (4,105) Less, restructuring and other charges, gains and NBCU settlement (134) (237) (1,697)Adjusted Corporate costs (operating) * $ (2,040) $ (2,107) $ (2,408) (a) Included gains (losses) on disposed or held for sale businesses.
(b) Included non-operating pension cost* of $2.1 billion, $2.8 billion and $2.1 billion in 2016, 2015 and 2014, respectively, which includes expected return on plan assets,interest costs and non-cash amortization of actuarial gains and losses.
.
*Non-GAAP Financial Measure
GE 2016 FORM 10-K 64

2016 – 2015 COMMENTARY
Revenues and other income increased $1.8 billion, primarily a result of:· $2.4 billion of higher net gains from disposed and held for sale businesses, which included a $3.1 billion gain from the sale of our Appliances business to
Haier and a $0.4 billion gain from the sale of GE Asset Management to State Street Corporation in 2016, partially offset by a $0.1 billion impairment chargerelated to a potential sale of a non-strategic platform in our Aviation business in 2016. Gains on disposed or held for sale businesses in 2015 included a$0.6 billion gain from the sale of our Signaling business, and a $0.2 billion break-up fee paid by Electrolux AB due to the termination of the agreement toacquire the GE Appliances business.
These increases to revenues and other income was partially offset by the following:· $0.5 billion lower other income from a settlement related to the NBCU transaction in 2015, and
· $0.4 billion of higher inter-segment eliminations.
Operating costs decreased $0.9 billion, primarily as a result of:· $2.4 billion of higher net gains from disposed and held for sale businesses, which included a $3.1 billion gain from the sale of our Appliances business to
Haier and a $0.4 billion gain from the sale of GE Asset Management to State Street Corporation in 2016, partially offset by a $0.1 billion impairment chargerelated to a potential sale of a non-strategic platform in our Aviation business in 2016. Gains in 2015 included a $0.6 billion gain from the sale of ourSignaling business, and a $0.2 billion break-up fee paid by Electrolux AB due to the termination of the agreement to acquire the GE Appliances business,and
· $0.7 billion of lower costs associated with our principal retirement plans including the effects of higher discount rates.
These decreases to operating costs were partially offset by the following:· $1.8 billion higher restructuring and other charges, which included $0.7 billion of higher restructuring and other charges associated with the Alstom
acquisition, and
· $0.5 billion lower other income due to a non-repeat of a settlement related to the NBCU transaction in the second quarter of 2015.
2015 – 2014 COMMENTARY
Revenues and other income increased $1.7 billion, primarily a result of:· $1.0 billion of higher gains from disposed or held for sale businesses , which included a $0.2 billion break-up fee paid by Electrolux AB due to the
termination of the agreement to acquire the GE Appliances business,
· $0.5 billion higher other income from a settlement related to the NBCU transaction in 2015, and
· $0.2 billion of lower eliminations and other, which was driven by $0.4 billion of lower inter-segment eliminations, partially offset by $0.2 billion lowerlicensing, GE Asset Management fees and other income.
Operating costs decreased $1.1 billion, primarily as a result of:· $1.0 billion of higher gains from disposed businesses, which included a $0.2 billion break-up fee paid by Electrolux AB due to termination of the agreement
to acquire the GE Appliances business,
· $0.5 billion higher other income from a settlement related to the NBCU transaction in 2015, and
· Lower headquarter functional costs offset by higher investment in Information Technology (IT) growth initiatives .
These decreases to operating costs were partially offset by $0.4 billion of higher costs associated with our principal retirement plans including the effects oflower discount rates and updated mortality assumptions.
GE 2016 FORM 10-K 65

RESTRUCTURING
Restructuring actions are an essential component of our cost improvement efforts to both existing operations and those recently acquired. Restructuring andother charges relate primarily to workforce reductions, facility exit costs associated with the consolidation of sales, service and manufacturing facilities, theintegration of recent acquisitions, including Alstom, and other asset write-downs. We continue to closely monitor the economic environment and may undertakefurther restructuring actions to more closely align our cost structure with earnings goals.
RESTRUCTURING & OTHER CHARGES (In billions) 2016 2015 2014 Workforce reductions $ 1.3 $ 0.4 $ 0.5Plant closures & associated costs and other asset write-downs 1.3 0.6 0.7Acquisition/disposition net charges 0.7 0.4 0.4Other 0.3 0.3 0.1Total $ 3.6 $ 1.7 $ 1.8
For 2016, restructuring and other charges were $3.6 billion of which approximately $2.3 billion was reported in cost of products/services and $1.2 billion wasreported in other costs and expenses (SG&A). These activities were primarily at Power, Oil & Gas and Energy Connections & Lighting. Cash expenditures forrestructuring were approximately $1.0 billion in 2016.
For 2015, restructuring and other charges were $1.7 billion of which approximately $1.0 billion was reported in cost of products/services and $0.6 billion wasreported in other costs and expenses (SG&A). These activities were primarily at Oil & Gas, Corporate and Energy Connections & Lighting. Cash expendituresfor restructuring were approximately $0.4 billion in 2015.
For 2014, restructuring and other charges were $1.8 billion of which approximately $1.0 billion was reported in cost of products/services and $0.5 billion wasreported in other costs and expenses (SG&A). These activities were primarily at Power, Corporate and Oil & Gas. Cash expenditures for restructuring wereapproximately $0.6 billion in 2014.
GE 2016 FORM 10-K 66

COSTS AND GAINS NOT INCLUDED IN SEGMENT RESULTS
As discussed in the Segment Operations section within the MD&A, certain amounts are not included in industrial operating segment results because they areexcluded from measurement of their operating performance for internal and external purposes. The amount of costs and gains (losses) not included in segmentresults follows.
COSTS (In billions) 2016 2015 2014 Power $ 1.2 $ 0.3 $ 0.5Renewable Energy 0.3 0.2 0.1Oil & Gas 0.8 0.5 0.3Aviation 0.1 - 0.3Healthcare 0.5 0.3 0.5Transportation 0.2 0.1 -Energy Connections & Lighting 0.6 0.3 0.3Total $ 3.7 $ 1.7 $ 2.1
GAINS (LOSSES) (In billions) 2016 2015 2014 Power $ - $ - $ -Renewable Energy - - -Oil & Gas - - 0.1Aviation (0.2)(a) - -Healthcare - 0.1(c) -Transportation - 0.6(d) -Energy Connections & Lighting 3.1(b) 0.1(e) -Total $ 3.0 $ 0.9 $ 0.1 (a) Largely due to impairment related to a potential sale of a non-strategic platform in our Aviation business.
(b) Related to the sale of our Appliances business in the second quarter of 2016.
(c) Related to the Clarient business disposition in 2015.
(d) Related to the Signaling business disposition in 2015.
(e) Related to the Intelligent Platforms Embedded Systems Products business disposition in 2015.
GE 2016 FORM 10-K 67

DISCONTINUED OPERATIONSDiscontinued operations primarily relate to our financial services businesses as a result of the GE Capital Exit Plan and include our Consumer business, most ofour CLL business, our Real Estate business and U.S. mortgage business (WMC). All of these operations were previously reported in the Capital segment.
We have entered into Transitional Service Agreements (TSA) with and provided certain indemnifications to buyers of GE Capital's assets. Under the TSAs, GECapital provides various services for terms generally between 12 and 24 months and receives a level of cost reimbursement from the buyers.
At December 31, 2016 , we provided specific indemnifications to buyers of GE Capital's assets that amounted to $2.6 billion, for which we have recognizedrelated liabilities of $0.3 billion. In addition, in connection with the 2015 public offering and sale of Synchrony Financial, GE Capital indemnified SynchronyFinancial and its directors, officers, and employees against the liabilities of GECC's businesses other than historical liabilities of the businesses that are part ofSynchrony Financial's ongoing operations.
As part of the GE Capital Exit Plan, we entered into hedges (on an after-tax basis) of our net investment in businesses that we plan to dispose. Thesederivatives are treated as standalone hedges and the mark-to-market valuation changes on the derivatives are recorded in earnings of discontinued operations.
Results of operations, financial position and cash flows for these businesses are separately reported as discontinued operations for all periods presented.
FINANCIAL INFORMATION FOR DISCONTINUED OPERATIONS (In millions) 2016 2015 2014 Earnings (loss) from discontinued operations, net of taxes $ (954) $ (7,495) $ 5,855
The 2016 loss from discontinued operations, net of taxes, primarily reflected the following:· $1.1 billion after-tax loss at our CLL business (including $0.9 billion after-tax loss on planned disposals), and
· $0.1 billion after-tax loss at our Consumer business (including $0.3 billion after-tax loss on planned disposals).
· 2016 losses were partially offset by a $0.2 billion tax benefit related to an IRS tax settlement in our discontinued insurance operations.
The 2015 loss from discontinued operations, net of taxes, primarily reflected the following:· $7.9 billion after-tax loss at our CLL business (including $8.7 billion after-tax loss on planned disposals),
· $2.0 billion after-tax loss at our Real Estate business (including $2.0 billion after-tax loss on planned disposals), and
· $0.1 billion after-tax effect of incremental reserves related to retained representation and warranty obligations to repurchase previously sold loans on the2007 sale of WMC.
· 2015 losses were partially offset by $2.5 billion after-tax earnings at our Consumer business, primarily $3.4 billion after-tax gain on the split-off of SynchronyFinancial, $0.5 billion after-tax gain on other transactions closed, partially offset by $0.8 billion after-tax loss on disposals and $0.6 billion after-tax loss fromoperations.
The 2014 earnings from discontinued operations, net of taxes, primarily reflected the following:· $3.2 billion of after-tax earnings from operations at our Consumer business,
· $1.8 billion of after-tax earnings from operations at our CLL business,
· $1.0 billion of after-tax earnings from operations at our Real Estate business, and
· $0.1 billion tax benefit related to the extinguishment of our loss-sharing arrangement for excess interest claims associated with the 2008 sale of GE MoneyJapan.
· 2014 earnings were partially offset by a $0.2 billion after-tax loss on incremental reserves related to retained representation and warranty obligations torepurchase previously sold loans on the 2007 sale of WMC.
See Note 2 to the consolidated financial statements for additional information related to discontinued operations.
GE 2016 FORM 10-K 68

OTHER CONSOLIDATED INFORMATIONINTEREST AND OTHER FINANCIAL CHARGES
Interest on borrowings and other financial charges amounted to $5.0 billion, $3.5 billion and $2.7 billion in 2016, 2015 and 2014, respectively. The majority ofour borrowings are in Financial Services, where interest expense was $3.8 billion, $2.3 billion and $1.6 billion in 2016, 2015 and 2014, respectively. Included ininterest expense were $0.6 billion, $0.2 billion and an insignificant amount of debt extinguishment costs in 2016, 2015 and 2014, respectively. GE Capitalaverage borrowings were $145.0 billion, $216.8 billion and $266.7 billion in 2016, 2015 and 2014, respectively. The GE Capital average composite effectiveinterest rate (including interest allocated to discontinued operations) was 3.0% in 2016, 2.6% in 2015 and 2.6% in 2014. The rate increase from 2015 to 2016was primarily driven by debt extinguishment costs. Excluding the effect of debt extinguishment costs, the GE Capital average composite effective interest rate(including interest allocated to discontinued operations) was 2.6% in 2016, 2015 and 2014. In 2016, GE Capital average assets continued to decrease in linewith the GE Capital Exit Plan. See the Liquidity and Borrowings section within the MD&A for a discussion of liquidity, borrowings and interest rate riskmanagement.
It is our policy to allocate Capital interest expense that is either directly attributable or related to discontinued operations. The allocation is based on a marketbased leverage ratio, taking into consideration the underlying characteristics of the assets for the specific discontinued operations. Interest expense that isassociated with debt that is not assumed by the buyer or required to be repaid as a result of the disposal transaction is reflected in other continuing operationsafter the disposal occurs.
POSTRETIREMENT BENEFIT PLANS(Dollarsinbillions)
PRINCIPAL PENSION PLANSBENEFIT PLANS COST DISCOUNT RATES (December 31) EXPECTED RATE OF RETURN
2016 – 2015 COMMENTARY
· Postretirement benefit plans cost decreased $0.9 billion, primarily because of the effects of higher discount rates, lower service cost resulting from feweractive principal pension plans participants and lower loss amortization related to our principal pension plans.
· We updated our mortality assumptions at December 31, 2016 based on guidance issued by the Society of Actuaries to reflect updated rates andmethodology for future mortality improvements. The new mortality assumptions decreased our principal pension plans obligations by $0.6 billion at year-end 2016.
2015 – 2014 COMMENTARY
· Postretirement benefit plans cost increased $0.2 billion, primarily because of the effects of lower discount rates and new mortality assumptions, which werepartially offset by lower loss amortization related to our principal pension plans and by changes to principal retiree benefit plans.
· In 2015, we amended our principal retiree benefit plans affecting post-65 retiree health and retiree life insurance for certain production participants. Theseplan amendments reduced our principal postretirement benefit obligations by approximately $3.3 billion.
GE 2016 FORM 10-K 69

Looking forward, our key assumptions affecting 2017 postretirement benefits costs are as follows:
· Discount rate at 4.11% for our principal pension plans, reflecting current long-term interest rates.
· Assumed long-term return on our principal pension plan assets of 7.5%.
We expect 2017 postretirement benefit plans cost to be about the same as 2016.
PENSION COSTS
GAAP AND NON-GAAP PENSION COSTS (In billions) 2016 2015 2014 GAAP principal pension plans' cost $ 3.6 $ 4.5 $ 3.6Non-GAAP operating pension cost* 1.6 1.7 1.5 Our operating pension cost for our principal pension plans includes only those components that relate to benefits earned by active employees during the period(service cost, prior service cost amortization and curtailment loss). Non-operating pension cost elements such as interest cost, expected return on plan assetsand non-cash amortization of actuarial gains and losses are excluded from this measure. We expect operating pension cost to be approximately $1.4 billion in2017.
FUNDED STATUS OF PLANS
The table below presents the funded status of our benefit plans. The funded status represents the fair value of plan assets less benefit obligations.
FUNDED STATUS (In billions) 2016 2015 GE Pension Plan $ (19.1) $ (16.9)GE Supplementary Pension Plan (6.5) (6.1)Other pension plans (5.5) (4.3)Principal retiree benefit plans (5.7) (6.1) 2016 – 2015 COMMENTARY
· The GE Pension Plan deficit increased in 2016 primarily due to the growth in pension liabilities and lower discount rates, partially offset by investmentperformance and changes in mortality assumptions.
· The increase in the underfunding of our other pension plans was primarily attributable to lower discount rates and liability growth, partially offset byinvestment performance and employer contributions.
· The decrease in principal retiree benefit plans deficit was primarily attributable to employer contributions and lower costs from new healthcare suppliercontracts, partially offset by the growth in retiree benefit liabilities.
The Employee Retirement Income Security Act (ERISA) determines minimum pension funding requirements in the U.S. We made a $0.3 billion contribution tothe GE Pension Plan in 2016. We did not contribute to the GE Pension Plan in 2015. On an ERISA basis, our preliminary estimate is that the GE Pension Planwas approximately 95% funded at January 1, 2017. The ERISA funded status is higher than the GAAP funded status (71% funded) primarily because the ERISAprescribed interest rate is calculated using an average interest rate. As a result, the ERISA interest rate is higher than the year-end GAAP discount rate. Thehigher ERISA interest rate lowers pension liabilities for ERISA funding purposes. Our current estimate projects $1.7 billion of pension funding contributions to theGE Pension Plan in 2017 and approximately $1.6 billion in 2018.
* Non-GAAP Financial Measure
GE 2016 FORM 10-K 70

We expect to contribute $0.9 billion to our other pension plans in 2017, as compared to $0.8 billion in 2016 and $0.5 billion in 2015. GE Capital is a member ofcertain GE pension plans. As a result of the GE Capital Exit Plan, GE Capital will have additional funding obligations for these pension plans. These obligationsdo not relate to the Verticals and are recognized as an expense in GE Capital's other continuing operations when they become probable and estimable. See theIntercompany Transactions between GE and GE Capital section within the MD&A for further information.
We also expect to contribute $0.5 billion to our principal retiree benefit plans in 2017 as compared to $0.4 billion in 2016 and $0.5 billion in 2015.
The funded status of our postretirement benefit plans and future effects on operating results depend on economic conditions, interest rates and investmentperformance. See the Critical Accounting Estimates section within the MD&A and Notes 12 and 29 to the consolidated financial statements for furtherinformation about our benefit plans and the effects of this activity on our financial statements.
INCOME TAXES
GE pays the income taxes it owes in every country in which it does business. While GE and GE Capital file a consolidated U.S. federal income tax return, manyfactors impact our income tax expense and cash tax payments. The most significant factor is that we conduct business in approximately 180 countries andmore than half of our revenue is earned outside the U.S., often in countries with lower tax rates than in the U.S. We reinvest most of our foreign earningsoverseas to be able to fund our active non-U.S. business operations. Our tax liability is also affected by U.S. and foreign tax incentives designed to encouragecertain investments, like research and development; and by acquisitions, dispositions and tax law changes. Finally, our tax returns are routinely audited, andsettlements of issues raised in these audits sometimes affect our tax rates.
GE and GE Capital file a consolidated U.S. federal income tax return. This enables GE and GE Capital to use tax deductions and credits of one member of thegroup to reduce the tax that otherwise would have been payable by another member of the group. The effective tax rate reflects the benefit of these taxreductions in the consolidated return. GE makes cash payments to GE Capital for tax reductions and GE Capital pays for tax increases at the time GE's taxpayments are due.
CONSOLIDATED(Dollarsinbillions)
EFFECTIVE TAX RATE (ETR)
PROVISION (BENEFIT) FOR INCOMETAXES
CASH INCOME TAXES PAID(a)
(a) Includes taxes paid related to discontinued operations.
GE 2016 FORM 10-K 71

2016 – 2015 COMMENTARY
· The consolidated income tax rate for 2016 was (5.1)%. The effective tax rate was negative largely because of increased tax benefits from global operationsincluding benefits from the repatriation of GE non-U.S. earnings, benefits of integrating our existing services business with Alstom's services business andforeign tax credit planning at GE Capital to reduce the tax cost of anticipated repatriations of foreign cash.
· The decrease in the consolidated provision for income tax was attributable to the increased benefit from global operations and the non-repeat of the 2015charges associated with the GE Capital Exit Plan.
· As discussed in Note 14 to the consolidated financial statements, in 2015 in conjunction with the GE Capital Exit Plan, we incurred tax expense of $6.3billion related to expected repatriation of foreign earnings and write-off of deferred tax assets.
· The consolidated tax provision includes $1.5 billion and $1.0 billion for GE (excluding GE Capital) for 2015 and 2016, respectively.
2015 – 2014 COMMENTARY
· The consolidated income tax rate for 2015 was greater than 35% due to charges associated with the GE Capital Exit Plan.
· The increase in the income tax expense is primarily due to the tax expense incurred as part of the GE Capital Exit Plan.
· The consolidated tax provision includes $1.6 billion and $1.5 billion for GE (excluding GE Capital) for 2014 and 2015, respectively.
BENEFITS FROM GLOBAL OPERATIONS
Absent the effects of the GE Capital Exit Plan, our consolidated income tax provision is lower because of the benefits of lower-taxed global operations. There isa benefit from global operations as non-U.S. income is subject to local country tax rates that are significantly below the 35% U.S. statutory rate. These non-U.S.earnings have been indefinitely reinvested outside the U.S. and are not subject to current U.S. income tax. Most of these earnings have been reinvested inactive non-U.S. business operations and we do not intend to repatriate these earnings to fund U.S. operations. The rate of tax on our indefinitely reinvested non-U.S. earnings is below the 35% U.S. statutory tax rate because we have significant business operations subject to tax in countries where the tax on that incomeis lower than the U.S. statutory rate and because GE funds certain non-U.S. operations through foreign companies that are subject to low foreign taxes.
A substantial portion of the benefit related to business operations subject to tax in countries where the tax on that income is lower than the U.S. statutory rate isderived from our GECAS aircraft leasing operations located in Ireland, from our Power operations located in Switzerland and Hungary, and our Healthcareoperations in Europe.
We expect our ability to benefit from non-U.S. income taxed at less than the U.S. rate to continue, subject to changes in U.S. or foreign law. In addition, sincethis benefit depends on management's intention to indefinitely reinvest amounts outside the U.S., our tax provision will increase to the extent we no longerindefinitely reinvest foreign earnings .
BENEFITS FROM LOWER-TAXED GLOBAL OPERATIONS (In billions) 2016 2015 2014 Benefit of lower foreign tax rate on indefinitely reinvested non-U.S. earnings $ 0.9 $ 1.1 $ 1.2GE Capital Exit Plan - (6.1) -Benefit of audit resolutions 0.1 0.2 0.1Other 1.1 0.4 0.5Total $ 2.1 $ (4.4) $ 1.8
2016 – 2015 COMMENTARY
Our benefit from lower-taxed global operations increased in 2016 because of the non-repeat of the 2015 tax expense associated with the GE Capital Exit Planand because of benefits from the repatriation of GE non-U.S. earnings, benefits of integrating our existing services business with Alstom's services business andforeign tax credit planning at GE Capital to reduce the tax cost of anticipated repatriations of foreign cash, all of which are included in "other" in the table above.
GE 2016 FORM 10-K 72

2015 – 2014 COMMENTARY
Our benefits from lower-taxed global operations decreased in 2015 because of the tax expense associated with the GE Capital Exit Plan.
OTHER INFORMATION
To the extent non-U.S. operating income increases, we would expect tax benefits to increase, subject to management's intention to indefinitely reinvest thoseearnings. Included in 2015 is a tax expense of $6.1 billion related to the expected repatriation of foreign earnings and write-off of deferred tax assets inconjunction with the GE Capital Exit Plan.
The tax benefit from non-U.S. income taxed at a local country rate rather than the U.S. statutory tax rate is reported in the caption "Tax on global activitiesincluding exports" in the effective tax rate reconciliation in Note 14 to the consolidated financial statements.
A more detailed analysis of differences between the U.S. federal statutory rate and the consolidated effective rate, as well as other information about our incometax provisions, is provided in the Critical Accounting Estimates section within the MD&A and Note 14 to the consolidated financial statements. The nature ofbusiness activities and associated income taxes differ for GE and for GE Capital; therefore, a separate analysis of each is presented in the paragraphs thatfollow.
GE EFFECTIVE TAX RATE (EXCLUDING GE CAPITAL EARNINGS)(Dollarsinbillions)
We believe that the GE effective tax rate and provision for income taxes are best analyzed in relation to GE earnings before income taxes excluding the GECapital net earnings from continuing operations, as GE tax expense does not include taxes on GE Capital earnings. For further information on this calculation,see the Supplemental Information section within the MD&A.
GE ETR, EXCLUDING GE CAPITAL EARNINGS*
GE PROVISION FOR INCOME TAXES
2016 – 2015 COMMENTARY
· The GE provision for income taxes decreased in 2016 because of increased benefits from lower-taxed global operations ($0.3 billion), including benefitsfrom the repatriation of GE non-U.S. earnings and benefits of integrating our existing services business with Alstom's services business.
· The GE provision for income taxes also decreased due to increases in the benefit from deductible stock losses ($0.4 billion).
· Partially offsetting these decreases was a lower benefit of audit resolutions ($0.1 billion) shown below.
2015 – 2014 COMMENTARY
· The GE provision for income taxes decreased in 2015 because of increased benefits from lower-taxed global operations ($0.2 billion), including benefitsfrom integrating our existing services business with Alstom's services business.
· The GE provision for income taxes also decreased due to increases in the benefit of audit resolutions ($0.2 billion) shown below and deductible stock losses($0.2 billion).
· Partially offsetting these decreases was an increase in income taxed at rates above the average tax rate ($0.5 billion).
GE 2016 FORM 10-K 73

Resolution of audit matters reduced the GE provision for income taxes by $0.2 billion, $0.3 billion and $0.1 billion in 2016, 2015 and 2014, respectively. Theeffects of such resolutions are included in the following captions in Note 14 to the consolidated financial statements.
AUDIT RESOLUTIONS - EFFECT ON GE TAX RATE, EXCLUDING GE CAPITAL EARNINGS 2016 2015 2014 Tax on global activities including exports (1.4)% (1.5)% (0.2)%U.S. business credits - (0.5) - All other - net (0.4) (0.3) (0.7) Total (1.8)% (2.3)% (0.9)%
GE CAPITAL EFFECTIVE TAX RATE(Dollarsinbillions)
GE CAPITAL ETR
GE CAPITAL PROVISION (BENEFIT) FORINCOME TAXES
2016 – 2015 COMMENTARY
· The decrease in the income tax expense for GE Capital from an expense of $5.0 billion to a benefit of $1.4 billion is primarily due to the non-recurrence ofthe $6.3 billion tax expense, discussed in Note 14 to the consolidated financial statements, related to the GE Capital Exit Plan.
·· The GE Capital tax expense also decreased in 2016 due to higher benefits from global operations including foreign tax credit planning to reduce the taxcost of anticipated repatriations of foreign cash.
2015 – 2014 COMMENTARY
· The increase in the income tax expense from a benefit of $0.9 billion for 2014 to an expense of $5.0 billion for 2015 is primarily due to the tax expense,discussed in Note 14 to the consolidated financial statements, related to the GE Capital Exit Plan.
GEOGRAPHIC DATA
Our global activities span all geographic regions and primarily encompass manufacturing for local and export markets, import and sale of products produced inother regions, leasing of aircraft, sourcing for our plants domiciled in other global regions and provision of financial services within these regional economies.Thus, when countries or regions experience currency and/or economic stress, we often have increased exposure to certain risks, but also often have newopportunities that include, among other things, expansion of industrial activities through purchases of companies or assets at reduced prices and lower U.S.debt financing costs.
Financial results of our non-U.S. activities reported in U.S. dollars are affected by currency exchange. We use a number of techniques to manage the effects ofcurrency exchange, including selective borrowings in local currencies and selective hedging of significant cross-currency transactions. Such principal currenciesare the euro, the pound sterling, the Brazilian real and the Chinese renminbi.
GE 2016 FORM 10-K 74

REVENUES
Revenues are classified according to the region to which products and services are sold. For purposes of this analysis, the U.S. is presented separately from theremainder of the Americas.
GEOGRAPHIC REVENUES V%(Dollars in billions) 2016 2015 2014 2016-2015 2015-2014 U.S. $ 53.3 $ 53.2 $ 51.1 -% 4 %Non-U.S. Europe 21.6 16.8 18.4 Asia 20.4 19.3 20.2 Americas 10.5 12.0 11.8 Middle East and Africa 17.8 16.0 15.6 Total Non-U.S. 70.4 64.1 66.0 10 % (3)%Total $ 123.7 $ 117.4 $ 117.2 5 % -% Non-U.S. Revenues as a % of Consolidated Revenues 57% 55% 56%
NON-U.S. REVENUES AND EARNINGS
The increase in non-US. revenues in 2016 was primarily due to increases of 32% in Europe (primarily due to Alstom), 12% in Middle East, North Africa andTurkey (MENAT) and 35% in India, partially offset by a decrease of 10% in Latin America.
The decrease in non-U.S. revenues in 2015 was primarily due to decreases in growth markets of 11% in Canada and 29% in Australia & New Zealand (ANZ),partially offset by an increase of 2% in Middle East, North Africa and Turkey (MENAT) and 1% in China.
The effects of currency fluctuations on reported results were as follows:· Decreased revenues by $1.3 billion in 2016, primarily driven by the Brazilian real ($0.2 billion), pound sterling ($0.2 billion), euro ($0.1 billion) and the
Chinese renminbi ($0.1 billion).
· Decreased revenues by $4.9 billion in 2015, primarily driven by the euro ($2.6 billion), the Brazilian real ($0.9 billion) and the Canadian dollar ($0.2 billion).
The effects of foreign currency fluctuations decreased earnings by $0.3 billion in 2016. The effects of foreign currency fluctuations decreased earnings in 2015by $0.7 billion.
ASSETS
We classify certain assets that cannot meaningfully be associated with specific geographic areas as "Other Global" for this purpose.
TOTAL ASSETS (CONTINUING OPERATIONS) December 31 (In billions) 2016 2015 U.S. $ 179.0 $ 176.7Non-U.S. Europe 110.8 141.9 Asia 24.0 22.0 Americas 20.6 17.5 Other Global 15.8 14.0Total Non-U.S. 171.4 195.4Total $ 350.4 $ 372.1
The decrease in total assets of non-U.S. operations on a continuing basis reflected a decrease primarily in Europe driven by the strengthening of the U.S. dollaragainst the euro and pound sterling, coupled with a decrease in time deposits in line with debt maturities at GE Capital.
GE 2016 FORM 10-K 75

FOREIGN CURRENCY EXPOSUREAs a result of our global operations, we generate and incur a significant portion of our revenues and expenses in currencies other than the U.S. dollar. Suchprincipal currencies are the euro, the pound sterling, the Brazilian real and the Chinese renminbi. The results of operating entities reported in currencies otherthan U.S. dollar are translated to the U.S. dollar at the applicable exchange rate for inclusion in the financial statements. We use a number of techniques tomanage the effects of currency exchange, including selective borrowings in local currencies and selective hedging of significant cross-currency transactions.The foreign currency effect arising from operating activities outside of the U.S., including the remeasurement of derivatives, can result in significant transactionalforeign currency fluctuations at points in time, but will generally be offset as the underlying hedged item is recognized in earnings. The effects of foreign currencyfluctuations, excluding the earnings impact of the underlying hedged item, decreased net earnings for the year ended December 31, 2016 by $0.3 billion.
On June 23, 2016, a referendum in the United Kingdom (U.K.) was approved to withdraw from the European Union . The referendum was advisory and theterms of any withdrawal are subject to a negotiation period that could last for two years after the U.K. government initiates the withdrawal process. The approvalof the referendum had, and may continue to have, an impact on foreign currency exchange rates, among other things. We actively manage our exposure to theU.K. and do not anticipate a material economic impact from our currency exposure as a result of the recent decision by the U.K. to exit the European Union.
See Notes 20 and 29 to the consolidated financial statements for further information about our risk exposures, our use of derivatives, and the effects of thisactivity on our financial statements.
GE 2016 FORM 10-K 76

STATEMENT OF FINANCIAL POSITIONBecause GE and GE Capital share certain significant elements of their Statements of Financial Position, the following discussion addresses significant captionsin the consolidated statement. Within the following discussions, however, we distinguish between GE and GE Capital activities in order to permit meaningfulanalysis of each individual consolidating statement.
MAJOR CHANGES IN OUR FINANCIAL POSITION DURING 2016
·· Cash and equivalents decreased $22.4 billion . GE Cash and equivalents increased $0.2 billion due to continuing cash flows from operating activities of$30.0 billion (including common dividends from GE Capital of $20.1 billion), proceeds from the sale of our Appliances business of $4.8 billion and a short-term loan from GE Capital of $1.3 billion. This is partially offset by treasury stock net purchases of $21.4 billion (cash basis), including $11.4 billion paidunder ASR agreements, common dividends of $8.5 billion, net PP&E additions of $2.7 billion, business acquisitions of $2.3 billion and software spend of$0.7 billion. GE Capital Cash and equivalents decreased $22.5 billion primarily driven by $58.8 billion net repayments of debt, $20.4 billion in payments ofdividends to shareowners and a short-term loan to GE of $1.3 billion, partially offset by $59.9 billion in proceeds from business dispositions and $0.8 billionin proceeds from the sale of receivables originated in our Appliances business and sold to Haier. See the Statement of Cash Flows section of MD&A foradditional information.
· Investment securities increased $12.3 billion, primarily driven by investing excess cash in longer term investments to achieve higher yield at GE Capital.See Note 3 to the consolidated financial statements for additional information.
· All other assets decreased $9.6 billion , primarily due to maturities of time deposits in line with debt maturities at GE Capital. See Note 9 to theconsolidated financial statements for additional information.
· Assets of discontinued operations decreased $106.1 billion , primarily due to the disposition of CLL businesses of $89.2 billion at GE Capital. See Note2 to the consolidated financial statements for additional information.
· Borrowings decreased $61.4 billion , primarily due to net repayment of debt at GE Capital. See Note 10 to the consolidated financial statements foradditional information.
· Liabilities of discontinued operations decreased $42.3 billion , primarily driven by the disposition of CLL businesses of $34.7 billion at GE Capital. SeeNote 2 to the consolidated financial statements for additional information.
· Common stock held in treasury increased $19.5 billion , primarily due to treasury stock purchases of $22.0 billion (book basis), including $11.4 billionrepurchased under ASR agreements. This was partially offset by treasury stock issuances of $2.6 billion. See Note 15 to the consolidated financialstatements for additional information.
GE 2016 FORM 10-K 77

FINANCIAL RESOURCES AND LIQUIDITYLIQUIDITY AND BORROWINGS
We maintain a strong focus on liquidity. At both GE and GE Capital we manage our liquidity to help provide access to sufficient funding to meet our businessneeds and financial obligations throughout business cycles.
Our liquidity and borrowing plans for GE and GE Capital are established within the context of our annual financial and strategic planning processes. At GE, ourliquidity and funding plans take into account the liquidity necessary to fund our operating commitments, which include primarily purchase obligations forinventory and equipment, payroll and general expenses (including pension funding). We also take into account our capital allocation and growth objectives,including paying dividends, repurchasing shares, investing in research and development and acquiring industrial businesses. At GE, we rely primarily on cashgenerated through our operating activities, any dividend payments from GE Capital, and also have historically maintained a commercial paper program that weregularly use to fund operations in the U.S., principally within the quarters.
During 2017, GE plans to incur new long-term debt to refinance existing unsecured term debt, finance the Baker Hughes transaction, and for other corporatepurposes. This new debt may consist of new unsecured term debt issued by GE or intercompany arrangements between GE and GE Capital utilizing GECapital's excess unsecured term debt. GE maintains a commercial paper program with a balance of $1.5 billion at December 31, 2016.
Based on asset and liability management actions we have taken, GE Capital does not plan to issue any incremental GE Capital senior unsecured term debt until2019. GE Capital's global commercial paper issuances total $5.0 billion at December 31, 2016. GE Capital mainly relies on excess cash positions, cashgenerated through dispositions, and the cash flow from our Verticals to fund our debt maturities, including current portion of long-term debt ($18.2 billion atDecember 31, 2016), and our operating and interest costs. GE Capital's liquidity position is targeted to meet its obligations under both normal and stressedconditions. We expect to maintain an elevated liquidity position as we generate cash from asset sales, returning to more normalized levels in 2019. During thisperiod we expect to continue to have excess interest costs as asset sales have outpaced our debt maturities. While we maintain elevated liquidity levels, wemay engage in liability management actions, such as buying back debt, based on market and economic conditions in order to reduce our excess interest costs.In 2016, we repurchased $6.7 billion of long-term unsecured debt and $5.8 billion of subordinated debentures, resulting in a pre-tax loss of $0.6 billion.
We maintain a detailed liquidity policy for GE Capital that defines GE Capital's liquidity risk tolerance under stress based on its liquidity sources, and acomprehensive framework for managing liquidity risk including metrics to identify and monitor liquidity risk and procedures to escalate and address potentialissues.
On December 2, 2015, $87.7 billion of senior unsecured notes and $4.9 billion of commercial paper was assumed by GE upon its merger with GE Capital. Onthe GE balance sheet, assumed debt is presented in borrowings with an offsetting receivable from GE Capital. On the GE Capital balance sheet, assumed debtis reflected as an intercompany payable to GE presented in borrowings (see Note 10 for additional information). The following table illustrates total GE and GECapital external debt and debt assumed by GE as of December 31, 2016.
December 31, 2016 (In billions) GE GE Capital Consolidated(a) External debt $ 79.3 $ 58.5 $ 136.2Debt assumed by GE from GE Capital (58.8) 58.8 -Debt adjusted for assumed debt 20.5 117.3 136.2 (a) Includes $1.6 billion elimination of intercompany borrowings between GE and GE Capital.
GE 2016 FORM 10-K 78

LIQUIDITY SOURCES
In addition to GE cash of $10.5 billion at December 31, 2016, GE Capital maintained liquidity sources of $50.5 billion that consisted of cash and equivalents of$37.6 billion, high-quality investments of $11.5 billion and cash and equivalents of $1.4 billion classified as discontinued operations. Additionally, at December31, 2016, we have $20.0 billion of committed unused credit lines extended by 36 banks in a syndicated credit facility agreement. GE Capital has the right tocompel GE to borrow under such credit lines and transfer the proceeds as loans to GE Capital.
CASH AND EQUIVALENTS (In billions) December 31, 2016 December 31, 2016 GE(a) $ 10.5 U.S. $ 9.6GE Capital(b) 37.6 Non-U.S.(c) 38.6 (a) At December 31, 2016, $3.5 billion of GE cash and equivalents was held in countries with currency controls that may restrict the transfer of funds to the U.S. or limit
our ability to transfer funds to the U.S. without incurring substantial costs. These funds are available to fund operations and growth in these countries and we do notcurrently anticipate a need to transfer these funds to the U.S.
(b) At December 31, 2016, GE Capital cash and equivalents of about $0.5 billion was primarily in insurance entities and was subject to regulatory restrictions.
(c) Of this amount at December 31, 2016, $3.3 billion is held outside of the U.S. and is available to fund operations and other growth of non-U.S. subsidiaries; it is alsoavailable to fund our needs in the U.S. on a short-term basis through short-term loans, without being subject to U.S. tax. Under the Internal Revenue Code, theseloans are permitted to be outstanding for 30 days or less and the total of all such loans is required to be outstanding for less than 60 days during the year. If we wereto repatriate this cash, we would be subject to additional U.S. income taxes and foreign withholding taxes.
There were no new senior unsecured debt issuances in 2016.
COMMERCIAL PAPER (In billions) GE GE Capital Average commercial paper borrowings during the fourth quarter of 2016 $ 13.9 $ 5.0Maximum commercial paper borrowings outstanding during the fourth quarter of 2016 19.5 5.1 GE Capital commercial paper maturities have historically been funded principally through new commercial paper issuances and at GE are substantially repaidbefore quarter-end using indefinitely reinvested overseas cash, which as discussed above, is available for use in the U.S. on a short-term basis without beingsubject to U.S. tax.
We securitize financial assets as an alternative source of funding. At December 31, 2016, consolidated non-recourse securitization borrowings were $0.4 billion.
We have two deposit-taking banks outside of the U.S., which are classified as discontinued operations, and neither deposit-taking platform will be retained afterthe planned completion of the remaining GE Capital Exit Plan dispositions in Europe in 2017. On April 18, 2016, we completed the sale of the deposit-takingbank in the U.S., GE Capital Bank, an industrial bank.
EXCHANGE RATE AND INTEREST RATE RISKS
Exchange rate and interest rate risks are managed with a variety of techniques, including match funding and selective use of derivatives. We use derivatives tomitigate or eliminate certain financial and market risks because we conduct business in diverse markets around the world and local funding is not alwaysefficient. In addition, we use derivatives to adjust the debt we are issuing to match the fixed or floating nature of the assets we are originating. We apply strictpolicies to manage each of these risks, including prohibitions on speculative activities. Following is an analysis of the potential effects of changes in interestrates and currency exchange rates using so-called "shock" tests that seek to model the effects of shifts in rates. Such tests are inherently limited based on theassumptions used (described further below) and should not be viewed as a forecast; actual effects would depend on many variables, including market factorsand the composition of the Company's assets and liabilities at that time.
GE 2016 FORM 10-K 79

· It is our policy to minimize exposure to interest rate changes. We fund our financial investments using debt or a combination of debt and hedginginstruments so that the interest rates of our borrowings match the expected interest rate profile on our assets. To test the effectiveness of our hedgingactions, we assumed that, on January 1, 2016, interest rates decreased by 100 basis points across the yield curve (a "parallel shift" in that curve) andfurther assumed that the decrease remained in place for the next 12 months. Based on the year-end 2016 portfolio and holding all other assumptionsconstant, we estimated that our consolidated net earnings for the next 12 months, starting in January 2016, would decline by less than $0.1 billion as aresult of this parallel shift in the yield curve.
· It is our policy to minimize currency exposures and to conduct operations either within functional currencies or using the protection of hedge strategies. Weanalyzed year-end 2016 consolidated currency exposures, including derivatives designated and effective as hedges, to identify assets and liabilitiesdenominated in other than their relevant functional currencies. For such assets and liabilities, we then evaluated the effects of a 10% shift in exchange ratesbetween those currencies and the U.S. dollar, holding all other assumptions constant. This analysis indicated that our 2016 consolidated net earnings woulddecline by less than $0.3 billion as a result of such a shift in exchange rates. This analysis excludes any translation impact from changes in exchange rateson our financial results and any offsetting effect from the forecasted future transactions that are economically hedged.
DEBT AND DERIVATIVE INSTRUMENTS, GUARANTEES AND COVENANTS
CREDIT RATINGS
We have relied, and may continue to rely, on the short-term and long-term debt capital markets to fund, among other things, a significant portion of ouroperations and significant acquisitions. The cost and availability of debt financing is influenced by our credit ratings.
On September 23, 2016, Standard and Poor's Global Ratings (S&P) lowered GE's and GE Capital's long-term unsecured debt ratings to AA- from AA+. The A-1+ short-term funding rating from S&P remained unchanged. On October 31, 2016, GE announced an agreement with Baker Hughes as previously discussedin the Consolidated Results section of MD&A. Moody's, S&P and Fitch Ratings (Fitch) affirmed GE's credit ratings following the announcement. Fitch haspublished credit ratings for GE and GE Capital since August 2, 2016.
We are disclosing these ratings to enhance understanding of our sources of liquidity and the effects of our ratings on our costs of funds. Although we currentlydo not expect a downgrade in the credit ratings, our ratings may be subject to a revision or withdrawal at any time by the assigning rating organization, and eachrating should be evaluated independently of any other rating. For a description of some of the potential consequences of a reduction in our credit ratings, see"Risk Factors – Financial Risks - Funding access/costs - Failure to maintain our credit ratings, or conditions in the financial and credit markets, could adverselyaffect our access to capital markets, funding costs and related margins, liquidity and competitive position."
GE's and GE Capital's ratings are set forth in the table below.
Moody's S&P Fitch GE Outlook Stable Stable Stable Short term P-1 A-1+ F1+ Long term A1 AA- AA- GE Capital Outlook Stable Stable Stable Commercial paper P-1 A-1+ F1+ Senior notes A1 AA- AA-
GE 2016 FORM 10-K 80

PRINCIPAL DEBT AND DERIVATIVE CONDITIONS
Certain of our derivative instruments can be terminated if specified credit ratings are not maintained and certain debt and derivatives agreements of otherconsolidated entities have provisions that are affected by these credit ratings.
Fair values of our derivatives can change significantly from period to period based on, among other factors, market movements and changes in our positions.We manage counterparty credit risk (the risk that counterparties will default and not make payments to us according to the terms of our standard masteragreements) on an individual counterparty basis. Where we have agreed to netting of derivative exposures with a counterparty, we offset our exposures withthat counterparty and apply the value of collateral posted to us to determine the net exposure. We actively monitor these net exposures against defined limitsand take appropriate actions in response, including requiring additional collateral.
Swap, forward and option contracts are executed under standard master agreements that typically contain mutual downgrade provisions that provide the abilityof the counterparty to require termination if the long-term credit ratings of the applicable GE entity were to fall below A-/A3 or other ratings levels agreed uponwith the counterparty. In certain of these master agreements, the counterparty also has the ability to require termination if the short-term ratings of the applicableGE entity were to fall below A-1/P-1. The net derivative liability after consideration of netting arrangements, outstanding interest payments and collateral postedby us under these master agreements was estimated to be $0.4 billion at December 31, 2016.
See Notes 20 and 29 to the consolidated financial statements for further information about our risk exposures, our use of derivatives, and the effects of thisactivity on our financial statements.
GE GUARANTEE OF CERTAIN GE CAPITAL DEBT
GE provides implicit and explicit support to GE Capital through commitments, capital contributions and operating support. At December 31, 2016, GE debtassumed from GE Capital in connection with the merger of GE Capital into GE was $58.8 billion, and GE guaranteed $47.5 billion of GE Capital debt. See Note28 to the consolidated financial statements for further information on the guarantor financial statements.
ACCELERATED SHARE REPURCHASE AGREEMENT
During 2016, we repurchased $22.0 billion of our common stock, including $11.4 billion repurchased under accelerated share repurchase (ASR) agreements.
In December 2016, we entered into an ASR agreement with a financial institution that allowed us to repurchase GE common stock at a price below its volumeweighted-average price during a given period. During the fourth quarter, we paid $2.2 billion and received and classified as treasury shares an initial delivery of59,177,215 shares based on then-current market prices. The payment was recorded as a reduction to shareowners' equity, consisting of a $1.9 billion increasein treasury stock, which reflects the value of the shares received upon initial delivery, and a $0.3 billion decrease in other capital, which reflects the value of thestock held back pending final delivery.
We accounted for the ASR as two separate transactions: (i) 59,177,215 shares of common stock initially delivered to GE and $1.9 billion was accounted foras a treasury stock transaction and (ii) the unsettled contract of $0.3 billion was determined to be a forward contract indexed to GE's own common stock. Theinitial delivery of 59,177,215 shares resulted in an immediate reduction of the outstanding shares used to calculate the weighted-average common sharesoutstanding for basic and diluted earnings per share. GE has determined that the forward contract, indexed to its own common stock, met all the criteria forequity classification.
In the first quarter of 2017, we received the remaining 10,773,050 shares based on the final volume weighted-average price less the negotiated discount.
GE 2016 FORM 10-K 81

STATEMENT OF CASH FLOWS – OVERVIEW FROM 2014 THROUGH 2016
CONSOLIDATED CASH FLOWS
We evaluate our cash flows performance by reviewing our industrial (non-GE Capital) businesses and GE Capital businesses separately. Cash from operatingactivities (CFOA) is the principal source of cash generation for our industrial businesses.
GE CASH FLOWS(Dollarsinbillions)OPERATING CASH FLOWS INVESTING CASH FLOWS FINANCING CASH FLOWS
2014 2015 2016 2014 2015 2016 2014 2015 2016
With respect to GE CFOA, we believe that it is useful to supplement our GE Statement of Cash Flows and to examine in a broader context the businessactivities that provide and require cash.
The most significant source of cash in GE CFOA is customer-related activities, the largest of which is collecting cash resulting from product or services sales.The most significant operating use of cash is to pay our suppliers, employees, tax authorities and others for a wide range of material and services. Dividendsfrom GE Capital represent the distribution of a portion of GE Capital retained earnings, and are distinct from cash from continuing operations within the GECapital businesses.
All other operating activities reflect cash sources and uses as well as non-cash adjustments to net income including those related to taxes, interest, pension,contract assets and gains (losses) on principal business dispositions. See Note 26 to the consolidated financial statements for further information.
See the Intercompany Transactions between GE and GE Capital section within the MD&A and Notes 4, 22 and 24 to the consolidated financial statements forfurther information regarding certain transactions affecting our consolidated Statement of Cash Flows.
GE 2016 FORM 10-K 82

2016 – 2015 COMMENTARY – CONTINUING OPERATIONS:
GE cash from operating activities-continuing operations increased $13.6 billion, primarily due to the following:· GE Capital paid common dividends totaling $20.1 billion and $4.3 billion to GE in 2016 and 2015, respectively.
· Improvement of working capital of $3.6 billion, primarily due to increases in progress collections and accounts payable, partially offset by an increase ininventory build.
· These increases were partially offset by the following decreases:
· $1.0 billion increase in income tax payments, including $1.4 billion in taxes related to the 2016 sale of our Appliances business to Haier.
· Higher restructuring and interest payments of $0.6 billion and $0.4 billion, respectively, when compared to 2015.
· $0.5 billion of 2016 incentive compensation payments due to long-term performance awards. No such payments were made in 2015.
· 2016 GE Pension Trust funding of $0.3 billion representing net sale proceeds associated with the July 1, 2016 sale of GE Asset Management(GEAM) to State Street Corporation.
· The nonrecurrence of settlements related to the NBCU transaction of $0.5 billion and an Electrolux break-up fee of $0.2 billion received in 2015.
· See Note 26 to the consolidated financial statements for further information regarding cash sources and uses as well as non-cash adjustments to netincome reported as All other operating activities.
GE cash used for investing activities-continuing operations decreased $10.8 billion, primarily due to the following:· Higher proceeds from principal business dispositions of $3.6 billion, primarily driven by the sale of our Appliances business to Haier for proceeds of $4.8
billion and the sale of GEAM for proceeds of $0.4 billion in 2016, compared to $1.7 billion of total proceeds from principal business dispositions in 2015.
·· A decrease in business acquisition activity of $8.1 billion, primarily driven by the acquisition of Alstom for $10.1 billion in 2015.
· These decreases were partially offset by the funding of joint ventures of $0.4 billion in 2016, principally related to our Aviation business (reflected in All otherinvesting activities).
GE cash used for financing activities-continuing operations increased $19.2 billion, primarily due to the following:· Net purchases of GE treasury shares of $21.4 billion, including $11.4 billion paid under ASR agreements compared to $1.1 billion in 2015.
· This increase in cash usage was partially offset by the following decreases:
· A net increase in borrowings of $0.8 billion, primarily driven by a short-term loan from GE Capital to GE with remaining principal of $1.3 billion in2016 (the loan was fully repaid in January 2017).
· Lower dividends paid to shareowners of $0.8 billion due to lower shares outstanding in 2016 because of on-going repurchases of GE treasuryshares.
2015 – 2014 COMMENTARY – CONTINUING OPERATIONS:
GE cash from operating activities-continuing operations increased $1.2 billion, primarily due to the following:·· GE Capital paid common dividends totaling $4.3 billion and $3.0 billion to GE in 2015 and 2014, respectively.
· Improvement of working capital of $0.6 billion, primarily related to increased collections on current receivables, partially offset by a decrease in accountspayable and progress collections.
· Settlements related to the NBCU transaction of $0.5 billion and an Electrolux break-up fee of $0.2 billion received in 2015.
· These increases were partially offset by a $0.3 billion increase in income tax payments.
· See Note 26 to the consolidated financial statements for further information regarding cash sources and uses as well as non-cash adjustments to netincome reported as All other operating activities.
GE 2016 FORM 10-K 83

GE cash used for investing activities-continuing operations increased $6.9 billion, primarily due to the following:·· Higher business acquisition activity of $8.3 billion primarily driven by the 2015 acquisition of Alstom for $10.1 billion. This compares to the 2014 acquisitions
of certain Thermo Fisher Scientific Inc. life-sciences business for $1.1 billion, Cameron's Reciprocating Compression Division for $0.6 billion and APIHealthcare (API) for $0.3 billion. Partially offset by;
· Higher proceeds from principal business dispositions of $1.1 billion in 2015, primarily relating to Signaling of $0.8 billion and Intelligent Platforms EmbeddedSystems Products of $0.5 billion in 2015, compared to $0.6 billion of proceeds from principal business dispositions in 2014.
GE cash used for financing activities-continuing operations increased $1.5 billion, primarily due to the following:·· The 2015 repayment of $2.0 billion of GE unsecured notes, partially offset by;
· The 2015 issuance of unsecured notes of $3.4 billion compared to $3.0 billion in 2014.
GE CAPITAL CASH FLOWS
(Dollarsinbillions)
OPERATING CASH FLOWS INVESTING CASH FLOWS FINANCING CASH FLOWS
2014 2015 2016 2014 2015 2016 2014 2015 2016
2016 – 2015 COMMENTARY
GE Capital cash from operating activities decreased $3.1 billion, primarily due to the following:· Higher net income tax payments of $2.6 billion.
· Higher cash paid for interest reflecting excess interest expense, and costs associated with the February and May 2016 debt tenders.
· These decreases were partially offset by a net increase in cash collateral received from counterparties on derivative contracts of $1.7 billion.
· See Note 26 to the consolidated financial statements regarding All other operating activities.
GE 2016 FORM 10-K 84

GE Capital cash from investing activities decreased $12.2 billion, primarily due to the following:· Net proceeds from the sales of our CLL, Consumer and Real Estate businesses of $59.9 billion compared to $79.6 billion in 2015.
· Liquidity investments of $11.5 billion purchased in 2016.
· Net cash received from derivative settlements of $0.4 billion compared to $4.4 billion in 2015.
· An increase in net financing receivables of $1.5 billion, including $4.3 billion in additions, partially offset by $2.1 billion received from the refinancing of ourReceivables Facility and proceeds from the sale of receivables purchased from our Appliances business of $0.8 billion in 2016.
· A short-term loan from GE Capital to GE with remaining principal of $1.3 billion in 2016 (the loan was fully repaid in January 2017).
· These decreases were partially offset by the following increases:
· Investment and maturity of $20.8 billion related to high quality interest bearing deposits reflecting an investment of $10.4 billion in 2015 thatmatured in 2016.
· Other investing activities of $3.9 billion, primarily due to a reduction in net additions to property, plant & equipment of $1.6 billion and an increase inaircraft deposits received of $1.5 billion.
· The 2015 acquisition of Milestone Aviation Group resulting in net cash paid of $1.7 billion.
GE Capital cash used for financing activities increased $15.0 billion, primarily due to the following:· GE Capital paid common dividends to GE totaling $20.1 billion compared to $4.3 billion in 2015, partially offset by;
· Lower net repayments of borrowings of $58.8 billion compared to $59.3 billion in 2015, reflecting $2.1 billion of repayments resulting from the refinancing ofour Receivables Facility in 2016.
2015 – 2014 COMMENTARY
GE Capital cash from operating activities decreased $4.7 billion, primarily due to the following:· Net decrease in cash collateral received from counterparties on derivative contracts of $3.0 billion.
· A decrease in accounts payable of $0.4 billion.
· See Note 26 to the consolidated financial statements regarding All other operating activities.
GE Capital cash from investing activities increased $49.1 billion, primarily due to the following:· In 2015, we closed the sales of certain of our CLL, Real Estate and Consumer businesses for proceeds of $35.2 billion, $27.7 billion and $16.7 billion,
respectively.
· These increases were partially offset by the following decreases:
· 2015 investment of $10.4 billion in high quality interest bearing deposits (with a maturity date of April 2016).
· Aircraft deposits received of $0.1 billion compared to $2.3 billion in 2014.
· The net cash payment of $1.7 billion for the 2015 acquisition of Milestone Aviation Group.
· Net activity from equity method investments of $1.4 billion compared to $0.3 billion in 2014.
GE Capital cash used for financing activities increased $27.7 billion, primarily due to the following:· Higher net repayments of borrowings of $25.7 billion primarily driven by an increase in short-term and long-term debt maturities of $59.3 billion compared to
$33.6 billion in 2014.
· GE Capital paid higher common dividends to GE totaling $4.3 billion compared to $3.0 billion in 2014.
GE 2016 FORM 10-K 85

GE CAPITAL DISCONTINUED OPERATIONS CASH FLOWS(Dollarsinbillions)
OPERATING CASH FLOWS
INVESTING CASH FLOWS
FINANCING CASH FLOWS
2014
2015
2016
2014
2015
2016
2014
2015
2016
2016 – 2015 COMMENTARY – DISCONTINUED OPERATIONS:
GE Capital cash from operating activities-discontinued operations decreased $14.3 billion, primarily due to the following:· Lower cash generated as a result of certain dispositions in our CLL business of $9.9 billion and Consumer business of $5.9 billion (primarily resulting from
the 2015 split-off of Synchrony Financial), partially offset by our Real Estate business of $2.4 billion. In connection with the GE Capital Exit Plan, we closeda vast majority of our Consumer business and substantially all of our CLL and Real Estate business dispositions in 2015 and 2016.
·· Lower cash paid for interest, partially offset by higher net income tax payments that are included in the above.
GE Capital cash used for investing activities-discontinued operations increased $11.4 billion, primarily due to the following:· The sale of bank deposits for $16.5 billion in net cash paid in conjunction with the sale of GE Capital Bank's U.S. online deposit platform during 2016.
· The sale of bank deposits and other investments for $1.1 billion in net cash paid related to our Consumer platform during 2016.
· These increases were partially offset by Other investing activities of $6.2 billion, primarily higher net cash received on investment securities of $3.5 billion(including the sale of investment securities resulting from the split-off of Synchrony Financial) and cash generated from 2015 collections of financingreceivables and other investing assets prior to disposition of the underlying business.
GE Capital cash used for financing activities-discontinued operations decreased $7.3 billion, primarily due to the following:· Lower repayments of borrowings of $9.3 billion as a result of certain dispositions in our Consumer (including the 2015 split-off of Synchrony Financial), CLL
and Real Estate businesses, partially offset by;
· Other financing activities of $2.1 billion primarily newly issued debt of $1.5 billion in 2016.
2015 – 2014 COMMENTARY – DISCONTINUED OPERATIONS:
GE Capital cash from operating activities-discontinued operations decreased $3.6 billion, primarily due to the following:· Lower cash generated as a result of certain dispositions in our Consumer business of $2.4 billion, CLL business of $1.2 billion and our Real Estate business
of $0.3 billion. In connection with the GE Capital Exit Plan, we closed a vast majority of our Real Estate business dispositions in 2015 and split-off ofSynchrony Financial in 2015.
·· Included in the above were lower net income tax payments of $1.0 billion.
GE Capital cash used for investing activities-discontinued operations decreased $22.1 billion, primarily due to the following:· A decrease in net investing activities of $20.0 billion primarily related to decreased financing receivables, a reduction in net additions to property, plant and
equipment and decreased investment in other assets (including the 2015 split-off of Synchrony Financial) as a result of certain dispositions in connectionwith the GE Capital Exit Plan in 2015.
· Lower cash used for purchases of investment securities of $2.1 billion.
GE 2016 FORM 10-K 86

GE Capital cash from financing activities-discontinued operations decreased $30.4 billion, primarily due to the following:· Higher net repayments of borrowings of $17.5 billion as a result of certain 2015 dispositions in our Consumer (including the 2015 split-off of Synchrony
Financial), CLL and Real Estate businesses in connection with the GE Capital Exit Plan.
· Cash proceeds from bank deposits of $0.5 billion compared to $10.5 billion in 2014 (including the 2015 split-off of Synchrony Financial).
· Proceeds from the initial public offering of Synchrony Financial in 2014 of $2.8 billion.
INTERCOMPANY TRANSACTIONS BETWEEN GE AND GE CAPITAL
We are repositioning GE to be the world's best infrastructure and technology company, with a smaller financial services division. Our focus is on drivinginfrastructure leadership, investing in innovation and achieving a culture of simplification to better serve our customers around the world. Over the last decade,we have made significant strides in transforming our portfolio and focusing on our industrial leadership. We have grown our infrastructure platforms with majorportfolio moves, investing in adjacencies and pursuing opportunities that are closely related to our core.
In parallel, we have made a concentrated effort to reduce the size of our GE Capital business and align its growth with Industrial earnings. As a result, GECapital vertical businesses are now focused on investing financial, human and intellectual capital to promote growth for our industrial businesses and theircustomers. GE Capital accomplishes this in part through related party transactions with GE that are made on an arms-length basis and are reported in the GEand GE Capital columns of our financial statements, but are eliminated in deriving our consolidated financial statements. These transactions include, but are notlimited to, the following:
· GE Capital dividends to GE,· GE Capital working capital solutions to optimize GE cash management,· GE Capital enabled GE industrial orders, and· Aircraft engines, power equipment and healthcare equipment manufactured by GE that are installed on GE Capital investments, including leased
equipment.
In addition to the above transactions that primarily enable growth for the GE businesses, there are routine related party transactions, which include, but are notlimited to, the following:
· Expenses related to parent-subsidiary pension plans,· Buildings and equipment leased between GE and GE Capital, including sale-leaseback transactions,· Information technology (IT) and other services sold to GE Capital by GE, and· Various investments, loans and allocations of GE corporate overhead costs.
CASH FLOWS
GE Capital paid $20.1 billion, $4.3 billion and $3.0 billion of common dividends to GE in the years ended December 31, 2016, 2015 and 2014, respectively. InJanuary 2017, GE received an additional $2.0 billion of common dividends from GE Capital.
In order to manage credit exposure, GE sells current receivables to GE Capital and other third parties in part to fund the growth of our industrial businesses.These transactions can result in cash generation or cash use. During any given period, GE receives cash from the sale of receivables to GE Capital and otherthird parties. GE also leverages GE Capital for its expertise in receivables collection services and sales of receivables to GE Capital are made on an arm'slength basis. The incremental amount of cash received from sales of receivables represents the cash generated or used in the period relating to this activity. Theincremental cash generated in GE CFOA from current receivables sold to GE Capital, including current receivables subsequently sold to third parties, increasedGE's CFOA by $2.1 billion, $2.1 billion and $1.6 billion in 2016, 2015 and 2014, respectively.
As of December 31, 2016, GE Capital had approximately $12.3 billion recorded on its balance sheet related to current receivables purchased from GE. Of theseamounts, approximately half had been sold by GE to GE Capital with recourse (i.e., the GE business retains the risk of default). The evaluation of whetherrecourse transactions qualify for accounting derecognition is based, in part, upon the legal jurisdiction of the sale; as such, the majority of recourse transactionsoutside the U.S. qualify for sale treatment. Claims by GE Capital on receivables sold with recourse to GE have not been significant for the years endedDecember 31, 2016, 2015 and 2014.
GE 2016 FORM 10-K 87

In December 2016, GE Capital entered into a Receivables Facility with members of a bank group, designed to provide extra liquidity to GE. The ReceivablesFacility allows us to sell eligible current receivables on a non-recourse basis for cash and a deferred purchase price to members of the bank group. Thepurchase commitment of the bank group at December 31, 2016 was $3.0 billion. See Note 22 to the consolidated financial statements for further information.
ENABLED ORDERS
Enabled orders represent the act of introducing, elevating and influencing customers and prospects that result in an industrial sale, potentially coupled withprogrammatic captive financing or driving incremental products or services across the GE Store. During the year ended December 31, 2016, GE Capital enabled$13.4 billion of GE industrial orders, primarily with our Power ($6.9 billion), Renewable Energy ($4.8 billion) and Healthcare ($0.9 billion) businesses.
AVIATION
During the years ended December 31, 2016 and 2015, GE Capital acquired 44 aircraft (list price totaling $6.5 billion) and 56 aircraft (list price totaling $6.4billion), respectively, from third parties that will be leased to others, which are powered by engines that were manufactured by GE Aviation and affiliates.Additionally, GE Capital had $1.5 billion and $1.1 billion of net book value of engines, originally manufactured by GE Aviation and affiliates and subsequentlyleased back to GE Aviation and affiliates at December 31, 2016 and 2015, respectively.
PENSIONS
GE Capital is a member of certain GE Pension Plans. As a result of the GE Capital Exit Plan, GE Capital will have additional funding obligations for thesepension plans. These obligations do not relate to the Verticals and are recognized as an expense in GE Capital's other continuing operations when they becomeprobable and estimable. The additional funding obligations recognized by GE Capital were $0.6 billion and $0.2 billion for the years ended December 31, 2016and 2015, respectively.
Certain of this additional funding is recorded as a contra expense for GE and GE's related future pension obligations will be paid by GE Capital. For certain otherpension plan funding obligations triggered by the GE Capital Exit Plan, GE agreed to assume the funding obligation that would have been triggered by GECapital at the date of exit from the plan in exchange for an assumption fee that GE recorded as Other income. The total cash transferred to GE for theassumption of these GE Capital funding obligations was $0.2 billion and $0.1 billion for the years ended December 31, 2016 and 2015, respectively.
On a consolidated basis, the additional required pension funding and any related assumption fees do not affect current period earnings. Any additional requiredpension funding will be reflected as a reduction of the pension liability when paid.
GE GUARANTEE OF GE CAPITAL THIRD-PARTY TRANSACTIONS
In certain instances, GE provides guarantees to GE Capital transactions with third parties primarily in connection with enabled orders. In order to meet itsunderwriting criteria, GE Capital may obtain a direct guarantee from GE related to the performance of the third party. GE guarantees can take many forms andmay include, but not be limited to, direct performance or payment guarantees, return on investment guarantees, asset value guarantees and loss poolarrangements. As of December 31, 2016, GE had outstanding guarantees to GE Capital on $1.8 billion of funded exposure and $0.5 billion of unfundedcommitments. The recorded amount of these contingent liabilities was $0.1 billion as of December 31, 2016 and is dependent upon individual transaction leveldefaults, losses and/or returns.
GE GUARANTEE OF CERTAIN GE CAPITAL DEBT
GE provides implicit and explicit support to GE Capital through commitments, capital contributions and operating support. As previously discussed, GE debtassumed from GE Capital in connection with the merger of GE Capital into GE was $58.8 billion, and GE guaranteed $47.5 billion of GE Capital debt atDecember 31, 2016. See Note 24 to the consolidated financial statements for additional information about the eliminations of intercompany transactionsbetween GE and GE Capital.
GE 2016 FORM 10-K 88

CONTRACTUAL OBLIGATIONS
As defined by reporting regulations, our contractual obligations for estimated future payments as of December 31, 2016, follow.
Payments due by period 2022 and(In billions) Total 2017 2018-2019 2020-2021 thereafter Borrowings (Note 10) $ 136.2 $ 32.6 $ 21.5 $ 24.9 $ 57.2Interest on borrowings 42.5 3.7 5.9 4.8 28.1Purchase obligations(a)(b) 56.8 21.3 12.8 13.5 9.2Insurance liabilities (Note 11)(c) 11.1 1.3 1.9 1.5 6.4Operating lease obligations (Note 27) 4.2 0.8 1.3 1.0 1.1Other liabilities(d) 78.9 11.3 11.2 8.7 47.7Contractual obligations of discontinued operations(e) 4.2 4.2 - - - (a) Included all take-or-pay arrangements, capital expenditures, contractual commitments to purchase equipment that will be leased to others, software
acquisition/license commitments, contractual minimum programming commitments and any contractually required cash payments for acquisitions.(b) Excluded funding commitments entered into in the ordinary course of business. See Notes 20 and 23 to the consolidated financial statements for further information
on these commitments and other guarantees.(c) Included contracts with reasonably determinable cash flows such as structured settlements, guaranteed investment contracts, and certain property and casualty
contracts, and excluded long-term care, variable annuity and other life insurance contracts.(d) Included an estimate of future expected funding requirements related to our postretirement benefit plans and included liabilities for unrecognized tax benefits.
Because their future cash outflows are uncertain, the following non-current liabilities are excluded from the table above: derivatives, deferred revenue and othersundry items. See Notes 14, 20 and 29 to the consolidated financial statements for further information on certain of these items.
(e) Included payments for other liabilities.
GE 2016 FORM 10-K 89

CRITICAL ACCOUNTING ESTIMATESAccounting estimates and assumptions discussed in this section are those that we consider to be the most critical to an understanding of our financialstatements because they involve significant judgments and uncertainties. Many of these estimates include determining fair value. All of these estimates reflectour best judgment about current, and for some estimates future, economic and market conditions and their potential effects based on information available as ofthe date of these financial statements. If these conditions change from those expected, it is reasonably possible that the judgments and estimates describedbelow could change, which may result in future impairments of investment securities, goodwill, intangibles and long-lived assets, incremental losses on financingreceivables, increases in reserves for contingencies, establishment of valuation allowances on deferred tax assets and increased tax liabilities, among othereffects. Also see Note 1 to the consolidated financial statements, which discusses our most significant accounting policies.
REVENUE RECOGNITION ON LONG-TERM PRODUCT SERVICES AGREEMENTS
Revenue recognition on long-term product services agreements requires estimates of profits over the multiple-year terms of such agreements, consideringfactors such as the frequency and extent of future monitoring, maintenance and overhaul events; the amount of personnel, spare parts and other resourcesrequired to perform the services; and future billing rate, cost changes and customers' utilization of assets. We routinely review estimates under product servicesagreements and regularly revise them to adjust for changes in outlook.
We also regularly assess customer credit risk inherent in the carrying amounts of receivables and contract costs and estimated earnings, including the risk thatcontractual penalties may not be sufficient to offset our accumulated investment in the event of customer termination. We gain insight into future utilization andcost trends, as well as credit risk, through our knowledge of the installed base of equipment and the close interaction with our customers that comes withsupplying critical services and parts over extended periods. Revisions may affect a product services agreement's total estimated profitability resulting in anadjustment of earnings; such adjustments increased earnings by $2.2 billion, $1.4 billion and $1.0 billion in 2016, 2015 and 2014, respectively. We provide forprobable losses when they become evident.
See Notes 1 and 9 to the consolidated financial statements for further information.
ASSET IMPAIRMENT
Asset impairment assessment involves various estimates and assumptions as follows:
INVESTMENTS
We regularly review investment securities for impairment using both quantitative and qualitative criteria. For debt securities, if we do not intend to sell thesecurity and it is not more likely than not that we will be required to sell the security before recovery of our amortized cost, we evaluate other qualitative criteriato determine whether a credit loss exists, such as the financial health of and specific prospects for the issuer, including whether the issuer is in compliance withthe terms and covenants of the security. Quantitative criteria include determining whether there has been an adverse change in expected future cash flows. Forequity securities, our criteria include the length of time and magnitude of the amount that each security is in an unrealized loss position. Our other-than-temporary impairment reviews involve our finance, risk and asset management functions as well as the portfolio management and research capabilities of ourinternal and third-party asset managers. See Note 1 to the consolidated financial statements, which discusses the determination of fair value of investmentsecurities.
See Notes 1 and 3 to the consolidated financial statements for further information about actual and potential impairment losses.
GE 2016 FORM 10-K 90

LONG-LIVED ASSETS
We review long-lived assets for impairment whenever events or changes in circumstances indicate that the related carrying amounts may not be recoverable.Determining whether an impairment has occurred typically requires various estimates and assumptions, including determining which undiscounted cash flowsare directly related to the potentially impaired asset, the useful life over which cash flows will occur, their amount, and the asset's residual value, if any. In turn,measurement of an impairment loss requires a determination of fair value, which is based on the best information available. We derive the requiredundiscounted cash flow estimates from our historical experience and our internal business plans. To determine fair value, we use quoted market prices whenavailable, our internal cash flow estimates discounted at an appropriate discount rate and independent appraisals, as appropriate.
Our operating lease portfolio of commercial aircraft is a significant concentration of assets in Capital, and is particularly subject to market fluctuations. Therefore,we test recoverability of each aircraft in our operating lease portfolio at least annually. Additionally, we perform quarterly evaluations in circumstances such aswhen aircraft are re-leased, current lease terms have changed or a specific lessee's credit standing changes. We consider market conditions, such as globaldemand for commercial aircraft. Estimates of future rentals and residual values are based on historical experience and information received routinely fromindependent appraisers. Estimated cash flows from future leases are reduced for expected downtime between leases and for estimated costs required toprepare aircraft to be redeployed. Fair value used to measure impairment is based on management's best estimates which are benchmarked against third-partyappraiser current market values for aircraft of similar type and age.
See Notes 7 and 23 to the consolidated financial statements for further information on impairment losses and our exposure to the commercial aviation industry.
GOODWILL AND OTHER IDENTIFIED INTANGIBLE ASSETS
We test goodwill for impairment annually in the third quarter of each year using data as of July 1 of that year. The impairment test consists of two steps: in stepone, the carrying value of the reporting unit is compared with its fair value; in step two, which is applied when the carrying value is more than its fair value, theamount of goodwill impairment, if any, is derived by deducting the fair value of the reporting unit's assets and liabilities from the fair value of its equity, andcomparing that amount with the carrying amount of goodwill. We determined fair values for each of the reporting units using the market approach, whenavailable and appropriate, or the income approach, or a combination of both. We assess the valuation methodology based upon the relevance and availability ofthe data at the time we perform the valuation. If multiple valuation methodologies are used, the results are weighted appropriately.
Valuations using the market approach are derived from metrics of publicly traded companies or historically completed transactions of comparable businesses.The selection of comparable businesses is based on the markets in which the reporting units operate giving consideration to risk profiles, size, geography, anddiversity of products and services. A market approach is limited to reporting units for which there are publicly traded companies that have the characteristicssimilar to our businesses.
Under the income approach, fair value is determined based on the present value of estimated future cash flows, discounted at an appropriate risk-adjusted rate.We use our internal forecasts to estimate future cash flows and include an estimate of long-term future growth rates based on our most recent views of the long-term outlook for each business. Actual results may differ from those assumed in our forecasts. We derive our discount rates using a capital asset pricing modeland analyzing published rates for industries relevant to our reporting units to estimate the cost of equity financing. We use discount rates that are commensuratewith the risks and uncertainty inherent in the respective businesses and in our internally developed forecasts. Discount rates used in our reporting unit valuationsranged from 9.5% to 16.5%.
Estimating the fair value of reporting units requires the use of estimates and significant judgments that are based on a number of factors including actualoperating results. It is reasonably possible that the judgments and estimates described above could change in future periods.
During the third quarter of 2016, we performed our annual impairment test of goodwill for all of our reporting units. Based on the results of our step one testing,the fair values of each of the GE reporting units exceeded their carrying values; therefore, the second step of the impairment test was not required to beperformed for any of our reporting units and no goodwill impairment was recognized.
GE 2016 FORM 10-K 91

We review identified intangible assets with defined useful lives and subject to amortization for impairment whenever events or changes in circumstances indicatethat the related carrying amounts may not be recoverable. Determining whether an impairment loss occurred requires comparing the carrying amount to the sumof undiscounted cash flows expected to be generated by the asset. We test intangible assets with indefinite lives annually for impairment using a fair valuemethod such as discounted cash flows. For our insurance activities remaining in continuing operations, we periodically test for impairment our deferredacquisition costs and present value of future profits.
See Notes 1 and 8 to the consolidated financial statements for further information.
BUSINESSES AND ASSETS HELD FOR SALE
Businesses and assets held for sale represent components that meet the accounting requirements to be classified as held for sale and are presented as singleasset and liability amounts in our financial statements with a valuation allowance, if necessary, to recognize the net carrying amount at the lower of cost or fairvalue, less cost to sell. Financing receivables that no longer qualify to be presented as held for investment must be classified as assets held for sale andrecognized in our financial statements at the lower of cost or fair value, less cost to sell, with that amount representing a new cost basis at the date of transfer.
The determination of fair value for businesses and assets held for sale involves significant judgments and assumptions. Development of estimates of fair valuesin this circumstance is complex and is dependent upon, among other factors, the nature of the potential sales transaction (for example, asset sale versus sale oflegal entity), composition of assets and/or businesses in the disposal group, the comparability of the disposal group to market transactions, negotiations withthird party purchasers, etc. Such factors bear directly on the range of potential fair values and the selection of the best estimates. Key assumptions weredeveloped based on market observable data and, in the absence of such data, internal information that is consistent with what market participants would use ina hypothetical transaction.
We review all businesses and assets held for sale each reporting period to determine whether the existing carrying amounts are fully recoverable in comparisonto estimated fair values.
PENSION ASSUMPTIONS
Pension assumptions are significant inputs to the actuarial models that measure pension benefit obligations and related effects on operations. Two assumptions– discount rate and expected return on assets – are important elements of plan expense and asset/liability measurement. We evaluate these criticalassumptions at least annually on a plan and country-specific basis. We periodically evaluate other assumptions involving demographic factors such asretirement age, mortality and turnover, and update them to reflect our experience and expectations for the future. Actual results in any given year will often differfrom actuarial assumptions because of economic and other factors.
Projected benefit obligations are measured as the present value of expected payments. We discount those cash payments using the weighted average ofmarket-observed yields for high-quality fixed-income securities with maturities that correspond to the payment of benefits. Lower discount rates increase presentvalues and subsequent-year pension expense; higher discount rates decrease present values and subsequent-year pension expense.
Our discount rates for principal pension plans at December 31, 2016, 2015 and 2014 were 4.11%, 4.38% and 4.02%, respectively, reflecting market interestrates.
GE 2016 FORM 10-K 92

To determine the expected long-term rate of return on pension plan assets, we consider current and target asset allocations, as well as historical and expectedreturns on various categories of plan assets. In developing future long-term return expectations for our principal benefit plans' assets, we formulate views on thefuture economic environment, both in the U.S. and abroad. We evaluate general market trends and historical relationships among a number of key variables thatimpact asset class returns such as expected earnings growth, inflation, valuations, yields and spreads, using both internal and external sources. We also takeinto account expected volatility by asset class and diversification across classes to determine expected overall portfolio results given current and targetallocations. Assets in our principal pension plans earned 6.5% in 2016, and had average annual returns of 7.8%, 4.0%, and 8.0% per year in the 5-, 10- and 25-year periods ended December 31, 2016, respectively. The average historical 10- and 25- year returns were significantly affected by investment losses in 2008.Based on our analysis of future expectations of asset performance, past return results, and our current and target asset allocations, we have assumed a 7.5%long-term expected return on those assets for cost recognition in 2017 the same as 2016 and 2015.
Changes in key assumptions for our principal pension plans would have the following effects.
· Discount rate – A 25 basis point increase in discount rate would decrease pension cost in the following year by $0.2 billion and would decrease thepension benefit obligation at year-end by about $2.2 billion.
· Expected return on assets – A 50 basis point decrease in the expected return on assets would increase pension cost in the following year by $0.2billion.
See Other Consolidated Information – Postretirement Benefit Plans section within the MD&A and Notes 12 and 29 to the consolidated financial statements forfurther information on our pension plans.
INCOME TAXES
Our annual tax rate is based on our income, statutory tax rates and tax planning opportunities available to us in the various jurisdictions in which we operate.Tax laws are complex and subject to different interpretations by the taxpayer and respective governmental taxing authorities. Significant judgment is required indetermining our tax expense and in evaluating our tax positions, including evaluating uncertainties. We review our tax positions quarterly and adjust thebalances as new information becomes available. Our income tax rate is significantly affected by the tax rate on our global operations. In addition to local countrytax laws and regulations, this rate depends on the extent earnings are indefinitely reinvested outside the United States. Indefinite reinvestment is determined bymanagement's judgment about and intentions concerning the future operations of the Company. At December 31, 2016 and 2015, approximately $82 billion and$104 billion of earnings, respectively, have been indefinitely reinvested outside the United States. Most of these earnings have been reinvested in active non-U.S. business operations, and we do not intend to repatriate these earnings to fund U.S. operations. Because of the availability of U.S. foreign tax credits, it isnot practicable to determine the U.S. federal income tax liability that would be payable if such earnings were not reinvested indefinitely outside the United States.
Deferred income tax assets represent amounts available to reduce income taxes payable on taxable income in future years. Such assets arise because oftemporary differences between the financial reporting and tax bases of assets and liabilities, as well as from net operating loss and tax credit carryforwards. Weevaluate the recoverability of these future tax deductions and credits by assessing the adequacy of future expected taxable income from all sources, includingreversal of taxable temporary differences, forecasted operating earnings and available tax planning strategies. These sources of income rely heavily onestimates. We use our historical experience and our short- and long-range business forecasts to provide insight. Further, our global and diversified businessportfolio gives us the opportunity to employ various prudent and feasible tax planning strategies to facilitate the recoverability of future deductions. Amountsrecorded for deferred tax assets related to non-U.S. net operating losses, net of valuation allowances, were $3.1 billion and $5.1 billion at December 31, 2016and 2015, including $0.3 billion and $0.8 billion at December 31, 2016 and 2015, respectively, of deferred tax assets, net of valuation allowances, associatedwith losses reported in discontinued operations, primarily related to our Real Estate and Consumer businesses and our loss on the sale of GE Money Japan.Such year-end 2016 amounts are expected to be fully recoverable within the applicable statutory expiration periods. To the extent we do not consider it morelikely than not that a deferred tax asset will be recovered, a valuation allowance is established.
See Other Consolidated Information – Income Taxes section within the MD&A and Note 14 to the consolidated financial statements for further information onincome taxes.
GE 2016 FORM 10-K 93

DERIVATIVES AND HEDGING
We use derivatives to manage a variety of risks, including risks related to interest rates, foreign exchange and commodity prices. Accounting for derivatives ashedges requires that, at inception and over the term of the arrangement, the hedged item and related derivative meet the requirements for hedge accounting.The rules and interpretations related to derivatives accounting are complex. Failure to apply this complex guidance correctly will result in all changes in the fairvalue of the derivative being reported in earnings, without regard to the offsetting changes in the fair value of the hedged item.
In evaluating whether a particular relationship qualifies for hedge accounting, we test effectiveness at inception and each reporting period thereafter bydetermining whether changes in the fair value of the derivative offset, within a specified range, changes in the fair value of the hedged item. If fair value changesfail this test, we discontinue applying hedge accounting to that relationship prospectively. Fair values of both the derivative instrument and the hedged item arecalculated using internal valuation models incorporating market-based assumptions, subject to third-party confirmation, as applicable.
See Notes 1, 9, 20 and 29 to the consolidated financial statements for further information about our use of derivatives.
FAIR VALUE MEASUREMENTS
Assets and liabilities measured at fair value every reporting period include investments in debt and equity securities and derivatives. Other assets and liabilitiesare subject to fair value measurements only in certain circumstances, including purchase accounting applied to assets and liabilities acquired in a businesscombination, impaired loans that have been reduced based on the fair value of the underlying collateral, cost and equity method investments and long-livedassets that are written down to fair value when they are impaired. Upon closing an acquisition, we estimate the fair values of assets and liabilities acquired andintegrate the acquisition as soon as practicable. The size, scope and complexity of an acquisition will affect the time it takes to obtain the necessary informationto record the acquired assets and liabilities at fair value. It may take up to one year to finalize the initial fair value estimates used in the preliminary purchaseaccounting. Accordingly, it is reasonably likely that our initial estimates will be subsequently revised, which could affect carrying amounts of goodwill, intangiblesand potentially other assets and liabilities in our financial statements. Assets that are written down to fair value when impaired are not subsequently adjusted tofair value unless further impairment occurs.
A fair value measurement is determined as the price we would receive to sell an asset or pay to transfer a liability in an orderly transaction between marketparticipants at the measurement date. In the absence of active markets for the identical assets or liabilities, such measurements involve developing assumptionsbased on market observable data and, in the absence of such data, internal information that is consistent with what market participants would use in ahypothetical transaction that occurs at the measurement date. The determination of fair value often involves significant judgments about assumptions such asdetermining an appropriate discount rate that factors in both risk and liquidity premiums, identifying the similarities and differences in market transactions,weighting those differences accordingly and then making the appropriate adjustments to those market transactions to reflect the risks specific to our asset beingvalued.
See Notes 1 , 3, 8, 19, 20 and 29 to the consolidated financial statements for further information on fair value measurements and related matters.
GE 2016 FORM 10-K 94

OTHER LOSS CONTINGENCIES
Other loss contingencies are uncertain and unresolved matters that arise in the ordinary course of business and result from events or actions by others thathave the potential to result in a future loss. Such contingencies include, but are not limited to environmental obligations, litigation, regulatory proceedings,product quality and losses resulting from other events and developments.
When a loss is considered probable and reasonably estimable, we record a liability in the amount of our best estimate for the ultimate loss. When there appearsto be a range of possible costs with equal likelihood, liabilities are based on the low-end of such range. However, the likelihood of a loss with respect to aparticular contingency is often difficult to predict and determining a meaningful estimate of the loss or a range of loss may not be practicable based on theinformation available and the potential effect of future events and decisions by third parties that will determine the ultimate resolution of the contingency.Moreover, it is not uncommon for such matters to be resolved over many years, during which time relevant developments and new information must becontinuously evaluated to determine both the likelihood of potential loss and whether it is possible to reasonably estimate a range of possible loss. When a lossis probable but a reasonable estimate cannot be made, disclosure is provided.
Disclosure also is provided when it is reasonably possible that a loss will be incurred or when it is reasonably possible that the amount of a loss will exceed therecorded provision. We regularly review all contingencies to determine whether the likelihood of loss has changed and to assess whether a reasonable estimateof the loss or range of loss can be made. As discussed above, development of a meaningful estimate of loss or a range of potential loss is complex when theoutcome is directly dependent on negotiations with or decisions by third parties, such as regulatory agencies, the court system and other interested parties.Such factors bear directly on whether it is possible to reasonably estimate a range of potential loss and boundaries of high and low estimates.
See Note 23 to the consolidated financial statements for further information.
GE 2016 FORM 10-K 95

OTHER ITEMSNEW ACCOUNTING STANDARDS
ASU NO. 2016-16, ACCOUNTINGFORINCOMETAXES:INTRA-ENTITYASSETTRANSFERSOFASSETSOTHERTHANINVENTORY
In October 2016, the Financial Accounting Standards Board (FASB) issued Accounting Standards Update (ASU) No. 2016-16, AccountingforIncomeTaxes:Intra-EntityAssetTransfersofAssetsOtherthanInventory. The ASU eliminates the deferral of the tax effects of intra-entity asset transfers other than inventory.As a result, the tax expense from the intercompany sale of assets, other than inventory, and associated changes to deferred taxes will be recognized when thesale occurs even though the pre-tax effects of the transaction have not been recognized. The effect of the adoption of the standard will depend on the natureand amount of future transactions.
ASU NO. 2016-02, LEASES
In February 2016, the FASB issued ASU No. 2016-02, Leases. The new standard establishes a right-of-use (ROU) model that requires a lessee to record aROU asset and a lease liability on the balance sheet for all leases with terms longer than 12 months. Leases will be classified as either finance or operating, withclassification affecting the pattern of expense recognition. Similarly, lessors will be required to classify leases as sales-type, finance or operating, withclassification affecting the pattern of income recognition. Classification for both lessees and lessors will be based on an assessment of whether risks andrewards as well as substantive control have been transferred through a lease contract. The new standard is effective for fiscal years beginning after December15, 2018, including interim periods within those fiscal years, with early adoption permitted. A modified retrospective transition approach is required for leasesexisting at, or entered into after, the beginning of the earliest comparative period presented in the financial statements, with certain practical expedientsavailable. While we continue to evaluate the effect of the standard on our ongoing financial reporting, we anticipate that the adoption of the ASU may materiallyaffect our Statement of Financial Position.
ASU NO. 2014-09, REVENUEFROMCONTRACTSWITHCUSTOMERS
BACKGROUND
In May 2014, the FASB issued a new comprehensive set of revenue recognition principles (ASU No. 2014-09, RevenuefromContractswithCustomers) thatsupersedes most existing U.S. GAAP revenue recognition guidance (including ASC 605-35, RevenueRecognition-Construction-TypeandProduction-TypeContracts). The new standard will become effective for annual reporting periods beginning after December 15, 2017. We will adopt the standard on January 1,2018, will apply it retrospectively to all periods presented and will elect the practical expedient for contract modifications. Since the issuance of the new standardby the FASB, we have engaged in a collaborative process with our industry peers and worked with standard setters on important interpretive matters with theobjective of ensuring consistency in the application of the standard.
TRANSITION METHOD FOR APPLYING THE NEW STANDARD
Companies can use either a full retrospective or modified retrospective method to adopt the standard. Under the full retrospective method, all periods presentedwill be updated upon adoption to conform to the new standard and a cumulative adjustment for effects on periods prior to 2016 will be recorded to retainedearnings as of January 1, 2016. Under the modified retrospective approach, prior periods are not updated to be presented on an accounting basis that isconsistent with 2018. Rather, a cumulative adjustment for effects of applying the new standard to periods prior to 2018 is recorded to retained earnings as ofJanuary 1, 2018. Because only 2018 revenues reflect application of the new standard, incremental disclosures are required to present the 2018 revenues underthe prior standard.
As noted above, we have elected to apply the full retrospective approach. We chose that approach because we believe that it is the most helpful to ourinvestors. First and foremost, when we adopt the standard in 2018 we will provide investors with a consistent view of historical trends, as 2016 and 2017 will beon a basis consistent with 2018.
GE 2016 FORM 10-K 96

CHANGE IN TIMING AND PRESENTATION, NO IMPACT TO CASH OR ECONOMICS
The new standard requires companies to identify contractual performance obligations and determine whether revenue should be recognized at a point in time orover time based on when control of goods and services transfer to a customer. As a result, we expect significant changes in the presentation of our financialstatements, including: (1) timing of revenue recognition, and (2) changes in classification between revenue and costs. The new standard will have no cashimpact and, as such, does not affect the economics of our underlying customer contracts. The effect of applying the new guidance to our existing book ofcontracts will result in lower reported earnings in 2018 (and comparative periods previously reported) and in the early years after adoption. However, we expectto experience an increase in reported earnings, on that existing book of contracts, as they mature. The new standard will provide for a better alignment of cashand earnings for the affected long-term customer contracts and we expect that it will enhance comparability across industry peers.
SPECIFIC EFFECT ON GE BUSINESSES
Power and Aviation Service Agreements - For our long-term product service agreements, primarily in our Power and Aviation businesses, we expect tocontinue to recognize revenue based on costs incurred plus an estimated margin rate (over time model). However, the new standard provides prescriptiveguidance tied to several factors for determining what constitutes the proper scope of a customer contract for accounting purposes. These factors includeoptional purchases, contract modifications, and termination clauses. For example, under the new standard contract modifications will be accounted forprospectively by recognizing the financial effect of the modification over the remaining life of the contract. Under existing accounting guidance revisions toestimated margin rates resulting from modifications were reflected as cumulative effect adjustments to earnings in the current period.
Aviation Commercial Engines - Consistent with industry peers, the financial presentation of our Aviation Commercial engines business will be significantlyaffected as they will be accounted for as of a point in time, which is a change from our current long-term contract accounting process. Our current processapplies contract-specific estimated margin rates, which include the effect of estimated cost improvements, to costs incurred. This change is required becauseour commercial engine contracts do not transfer control to the customer during the manufacturing process. Each install and spare engine will be accounted foras a separate performance obligation, reflecting the actual price and manufacturing costs of such engines. We expect that the most significant effect of thischange will be reflected when we have new engine launches, where the cost of earlier production units is higher than the cost of later production units becauseof cost improvements.
All Other Large Equipment - For the remainder of our equipment businesses, the new revenue standard requires emphasis on transfer of control rather thanrisks and rewards, which may accelerate timing of revenue recognition versus our current practices. For example, in our Renewable Energy business we wait forrisk of loss to be assumed by the customer before recognizing revenue, which generally occurs later than when control is transferred.
CURRENT RANGE OF FINANCIAL STATEMENT EFFECT
We will adopt the new standard as of January 1, 2018. When we report our 2018 results, the comparative results for 2017 and 2016 will be updated to reflect theapplication of the requirements of the new standard to these periods. Based on our assessment and best estimates to date, we expect a non-cash charge toour January 1, 2016 retained earnings balance of approximately $4 billion. We estimate that the charge will comprise approximately $1 billion related tocommercial aircraft engines and $3 billion related primarily to our Services businesses (predominately in Power and Aviation). Beyond those effects, we expectapplication of the new guidance will result in increases and decreases in revenue within our segments, which will largely offset overall and will be immaterial at atotal company level. We estimate that our 2016 restated earnings per share will be lower by approximately $0.10. We anticipate that 2018 earnings per sharewill be lower by approximately $0.05 compared to what our results would be under existing revenue recognition guidance. These amounts include significantestimates and will remain subject to change as we complete our evaluation of the new standard and reflect actual activity for 2017.
To summarize, we will adopt the new standard in 2018, at which time we will update prior periods to be presented on a consistent basis. As discussed above,we anticipate the dilutive effect of the new standard in the year of adoption to be approximately $0.05 EPS and the effect will be less dilutive for years after initialadoption. However, this expectation is based on many variables, which are subject to change. Importantly, application of the new guidance has no effect on thecash we expect to receive nor the economics of these contracts. Rather, it will simply more closely align revenue with cash, which we believe will be helpful toour investors.
GE 2016 FORM 10-K 97

GE DIGITAL
In late 2015, we created GE Digital, whose activities are focused on assisting in the market development of our digital product offerings through software design,fulfillment and product management, while also interfacing with our customers. Digital revenues include internally developed software (including Predix) andassociated hardware, and software solutions that improve our customers' asset performance. These revenues are largely generated from our operatingbusinesses and are included in their segment results.
GE Digital revenues of $3.6 billion increased $0.5 billion, or 16%, in 2016 and were principally driven by expansion of our Digital offerings in GE's Power, EnergyConnections & Lighting and Oil & Gas segments.
GE Digital orders of $4.0 billion increased $0.7 billion, or 22%, in 2016 principally driven by expansion of our Digital offerings in GE's Power, EnergyConnections & Lighting, Oil & Gas segments and in Digital Core, partially offset by a market-driven slowdown in Transportation.
One aspect of our Digital transformation includes an initiative to digitize the operations of GE. These investments include applications and analytics that improvethe productivity of our internal processes across engineering, services, sourcing, and commercial – collectively referred to as the Digital Thread. During 2016,we internally invested $0.4 billion through various digitally-driven productivity initiatives, yielding $0.7 billion of gross productivity, principally related to ourservices businesses. Costs associated with revenue-generating activities are recorded within the results of our segments and at Corporate and are reflected intheir respective margin rates.
In addition, we made several acquisitions to further enhance and expand our digital capabilities:
· On January 10, 2017, we completed the acquisition of ServiceMax, a leader in cloud-based field service management (FSM) solutions, for $0.9 billion.This acquisition is expected to provide enhanced capabilities to advance our Industrial Internet vision, enabling customers to immediately gain morevalue from their assets and find greater efficiency in their field service processes.
· On November 9, 2016, we acquired the remaining 89% of Bit Stew, a software company specializing in gathering data from connected devices incomplex industrial systems to help companies plan predictive maintenance and optimize productivity, for $0.1 billion.
· On October 26, 2016, we acquired Wise.io, a leading machine learning and intelligent systems company, for less than $0.1 billion. This acquisition isexpected to further accelerate development of advanced machine learning and data science offerings in the Predix platform.
· On September 14, 2016, we acquired the remaining 74% of the software developer Meridium Inc. for $0.4 billion. The acquisition is expected toenhance and accelerate our Asset Performance Management capabilities across our industrial businesses.
GE 2016 FORM 10-K 98

IRAN THREAT REDUCTION AND SYRIA HUMAN RIGHTS ACT OF 2012
The Company is making the following disclosure pursuant to Section 13(r) of the Securities Exchange Act of 1934.Under Section 13(r) of the Securities Exchange Act of 1934, enacted in 2012, GE is required to disclose in its periodic reports if it or any of its affiliates knowinglyengaged in business activities relating to Iran, even if those activities are conducted in accordance with authorizations subsequently issued by the U.S.Government. Reportable activities include investments that significantly enhance Iran's ability to develop petroleum resources valued at $20 million or more inthe aggregate during a twelve-month period. Reporting is also required for transactions related to Iran's domestic production of refined petroleum products orIran's ability to import refined petroleum products valued at $5 million or more in the aggregate during a twelve-month period.
In January 2016, the U.S. Department of Treasury's Office of Foreign Assets Control (OFAC) issued General License H authorizing U.S.-owned or controlledforeign entities to engage in transactions with Iran if these entities meet the requirements of the general license. Pursuant to this authorization, a non-U.S.affiliate of GE's Power business received a purchase order during the third quarter of 2016 for the sale of spare parts to an Iranian entity to provide electricityand steam to an area of Iran that includes certain oil refineries. During the fourth quarter of 2016, the non-U.S. affiliate received purchase orders directly fromone of the end users for €7.1 million ($7.9 million) of the work contemplated under the original purchase order. As a result, the original purchase order will berevised. As of December 31, 2016, gross revenues attributable to these purchase orders was €0.9 million ($1.0 million), and net profits attributable to thesetransactions was €0.5 million ($0.6 million). The non-U.S. affiliate intends to continue this activity.
Another non-U.S. affiliate of GE's Oil & Gas business received four purchase orders during the fourth quarter of 2016 for the sale of goods pursuant to GeneralLicense H that could potentially enhance Iran's ability to develop petroleum resources. The purchase orders cover the sale of spare parts for gas turbineequipment for ultimate end use by an Iranian company in gas production projects in Iran and have a total value of €16.8 million ($17.6 million). The non-U.S.affiliate has also begun operational activities related to previously reported contracts. A second non-U.S. affiliate of GE's Oil & Gas business received apurchase order pursuant to General License H valued at €0.2 million ($0.2 million) during the fourth quarter of 2016 for the sale of services associated with thecommissioning of gas compressors in Iran. As of December 31, 2016, these non-US affiliates have not recognized any revenue, but have incurred €2.7 million($2.9 million) in costs. The non-U.S. affiliates intend to continue this activity.
For additional information on business activities related to Iran, please refer to the Other Items section within MD&A of our Form 10-Q for the quarter endedSeptember 30, 2016.
GE 2016 FORM 10-K 99

ENVIRONMENTAL MATTERS
Our operations, like operations of other companies engaged in similar businesses, involve the use, disposal and cleanup of substances regulated underenvironmental protection laws. We are involved in a number of remediation actions to clean up hazardous wastes as required by federal and state laws. Suchstatutes require that responsible parties fund remediation actions regardless of fault, legality of original disposal or ownership of a disposal site. Expenditures forsite remediation actions amounted to approximately $0.2 billion, $0.3 billion and $0.4 billion for the years 2016, 2015 and 2014, respectively. We presentlyexpect that such remediation actions will require average annual expenditures of about $0.2 billion in 2017 and about $0.1 billion in 2018.
As previously reported, in 2000, GE and the Environmental Protection Agency (EPA) entered into a consent decree relating to PCB cleanup of the HousatonicRiver in Massachusetts. Following EPA's release in September 2015 of an intended final remediation decision, GE and EPA engaged in mediation and the firststep of the dispute resolution process contemplated by the consent decree. In October 2016, EPA issued its final remediation decision pursuant to the consentdecree. GE and several other interested parties have appealed that decision to EPA's Environmental Appeals Board. A decision of the Board can ultimately beappealed to the United States Court of Appeals for the First Circuit. EPA may not implement any remedy until all appeals are exhausted. As of December 31,2016, and based on its assessment of current facts and circumstances and its defenses, GE believes that it has recorded adequate reserves to cover futureobligations associated with an expected final remedy.
RESEARCH AND DEVELOPMENT
(In millions) 2016 2015 2014 Total R&D $ 5,466 $ 5,278 $ 5,273Less customer funded R&D (principally the U.S. Government) (611) (803) (721)Less partner funded R&D (73) (226) (319)GE funded R&D $ 4,782 $ 4,249 $ 4,233 Of the total Research and Development, the segments with the most significant expenditures for the years ended December 31, 2016, 2015 and 2014 were:Aviation $1,595 million, $1,893 million and $1,965 million, respectively; Healthcare $938 million, $905 million, and $817 million, respectively; and Power $695million, $721 million and $641 million, respectively. The remaining segments and Corporate, including Global Research Center, had combined expenditures of$2,238 million, $1,759 million and $1,850 million, for the years ended December 31, 2016, 2015 and 2014 respectively.
OTHER
We own, or hold licenses to use, numerous patents. New patents are continuously being obtained through our research and development activities as existingpatents expire. Patented inventions are used both within the Company and are licensed to others.
GE is a trademark and service mark of General Electric Company.
Because of the diversity of our products and services, as well as the wide geographic dispersion of our production facilities, we use numerous sources for thewide variety of raw materials needed for our operations. We have not been adversely affected by our inability to obtain raw materials.
Sales of goods and services to agencies of the U.S. Government as a percentage of revenues follow.
2016 2015 2014 Total sales to U.S. Government agencies 3% 3% 3%Aviation segment defense-related sales 2 2 3
GE 2016 FORM 10-K 100
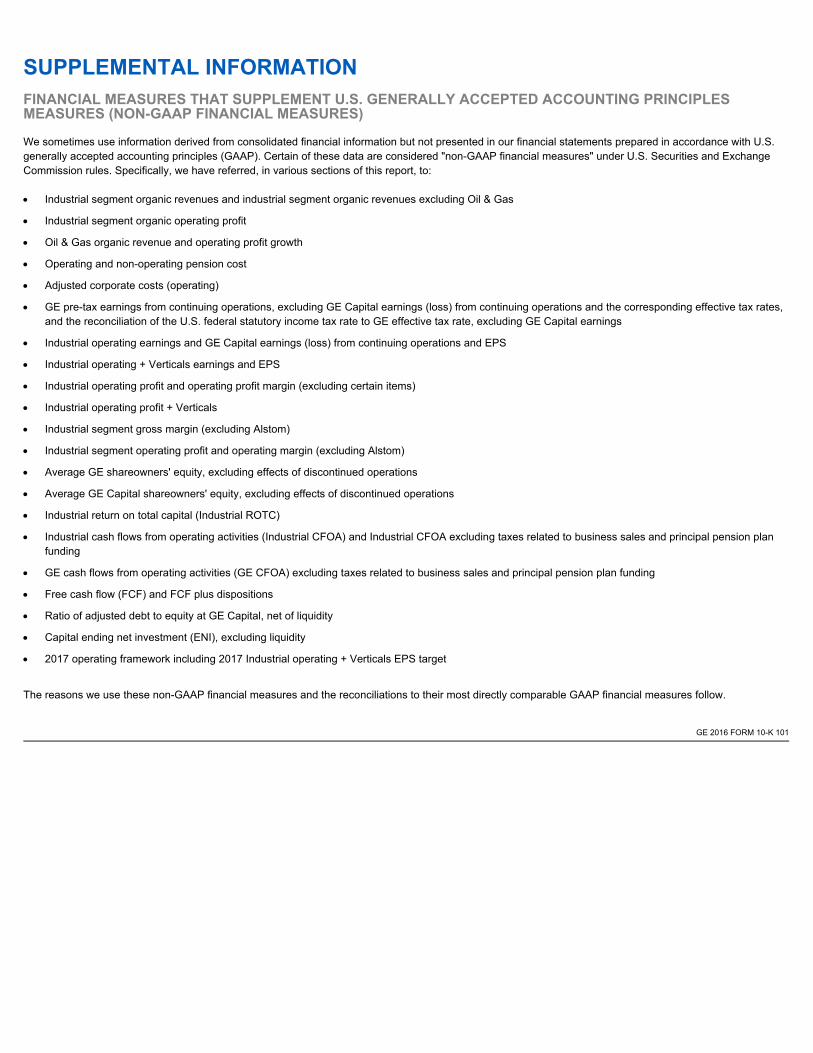
SUPPLEMENTAL INFORMATIONFINANCIAL MEASURES THAT SUPPLEMENT U.S. GENERALLY ACCEPTED ACCOUNTING PRINCIPLESMEASURES (NON-GAAP FINANCIAL MEASURES)
We sometimes use information derived from consolidated financial information but not presented in our financial statements prepared in accordance with U.S.generally accepted accounting principles (GAAP). Certain of these data are considered "non-GAAP financial measures" under U.S. Securities and ExchangeCommission rules. Specifically, we have referred, in various sections of this report, to:
· Industrial segment organic revenues and industrial segment organic revenues excluding Oil & Gas
· Industrial segment organic operating profit
· Oil & Gas organic revenue and operating profit growth
· Operating and non-operating pension cost
· Adjusted corporate costs (operating)
· GE pre-tax earnings from continuing operations, excluding GE Capital earnings (loss) from continuing operations and the corresponding effective tax rates,and the reconciliation of the U.S. federal statutory income tax rate to GE effective tax rate, excluding GE Capital earnings
· Industrial operating earnings and GE Capital earnings (loss) from continuing operations and EPS
· Industrial operating + Verticals earnings and EPS
· Industrial operating profit and operating profit margin (excluding certain items)
· Industrial operating profit + Verticals
· Industrial segment gross margin (excluding Alstom)
· Industrial segment operating profit and operating margin (excluding Alstom)
· Average GE shareowners' equity, excluding effects of discontinued operations
· Average GE Capital shareowners' equity, excluding effects of discontinued operations
· Industrial return on total capital (Industrial ROTC)
· Industrial cash flows from operating activities (Industrial CFOA) and Industrial CFOA excluding taxes related to business sales and principal pension planfunding
· GE cash flows from operating activities (GE CFOA) excluding taxes related to business sales and principal pension plan funding
· Free cash flow (FCF) and FCF plus dispositions
· Ratio of adjusted debt to equity at GE Capital, net of liquidity
· Capital ending net investment (ENI), excluding liquidity
· 2017 operating framework including 2017 Industrial operating + Verticals EPS target
The reasons we use these non-GAAP financial measures and the reconciliations to their most directly comparable GAAP financial measures follow.
GE 2016 FORM 10-K 101

INDUSTRIAL SEGMENT ORGANIC REVENUES AND INDUSTRIAL SEGMENT ORGANIC REVENUES EXCLUDING OIL & GAS (Dollars in millions) 2016 2015 V% Industrial segment revenues (GAAP) $ 113,156 $ 108,796 4%Adjustments: Acquisitions 13,207 1,961 Business dispositions (other than dispositions of businesses acquired for investment) 1,256 6,838 Currency exchange rates (808) - Industrial segment organic revenues (Non-GAAP) $ 99,501 $ 99,997 -%Adjustment: Plus Alstom November and December(a) 3,202 1,812 Industrial segment organic revenues including Alstom results for November and December of both 2015 and 2016 (Non-GAAP) $ 102,702 $ 101,809 1% Oil & Gas revenues (GAAP) $ 12,898 $ 16,450 (22)%Adjustments: Acquisitions 140 - Business dispositions (other than dispositions of businesses acquired for investment) - 57 Currency exchange rates (290) - Oil & Gas organic revenues (Non-GAAP) $ 13,048 $ 16,394 (20)%Adjustment: Plus Alstom November and December(a) 28 - Oil & Gas organic revenues including Alstom results for November and December of both 2015 and 2016 (Non-GAAP) $ 13,075 $ 16,394 (20)%Industrial segment organic revenues including Alstom results for November and December of both 2015 and 2016 and excluding Oil & Gas (Non-GAAP) $ 89,627 $ 85,416 5% (Dollars in millions) 2015 2014 V% Industrial segment revenues (GAAP) $ 108,796 $ 109,727 (1)%Adjustments: Acquisitions 2,204 46 Business dispositions (other than dispositions of businesses acquired for investment) 108 1,224 Currency exchange rates (4,791) - Industrial segment organic revenues (Non-GAAP) $ 111,276 $ 108,457 3% Oil & Gas revenues (GAAP) $ 16,450 $ 19,085 (14)%Adjustments: Acquisitions 145 30 Business dispositions (other than dispositions of businesses acquired for investment) 25 319 Currency exchange rates (1,597) - Oil & Gas organic revenues (Non-GAAP) $ 17,878 $ 18,735 (5)%
Industrial segment organic revenues excluding Oil & Gas (Non-GAAP) $ 93,398 $ 89,723 4%
(Dollars in millions) 2014 2013 V% Industrial segment revenues (GAAP) $ 109,727 $ 103,383 6%Adjustments: Acquisitions 2,170 463 Business dispositions (other than dispositions of businesses acquired for investment) 246 1,712 Currency exchange rates (545) - Industrial segment organic revenues (Non-GAAP) $ 107,856 $ 101,208 7% Oil & Gas revenues (GAAP) $ 18,676 $ 16,975 10%Adjustments: Acquisitions 1,221 319 Business dispositions (other than dispositions of businesses acquired for investment) 109 726 Currency exchange rates (67) - Oil & Gas organic revenues (Non-GAAP) $ 17,413 $ 15,930 9%Industrial segment organic revenues excluding Oil & Gas (Non-GAAP) $ 90,443 $ 85,279 6%

(a) Alstom was acquired in November 2015. This adjustment results in the inclusion of Alstom revenues from November and December of both 2015 and 2016 in theadjusted organic revenue growth measure as described below.
GE 2016 FORM 10-K 102

Organic revenue growth measures revenue growth excluding the effects of acquisitions, business dispositions and currency exchange rates. We believe that thismeasure provides management and investors with a more complete understanding of underlying operating results and trends of established, ongoing operationsby excluding the effect of acquisitions, dispositions and currency exchange, which activities are subject to volatility and can obscure underlying trends. We alsobelieve that presenting organic revenue growth separately for our industrial businesses provides management and investors with useful information about thetrends of our industrial businesses and enables a more direct comparison to other non-financial businesses and companies. Management recognizes that theterm "organic revenue growth" may be interpreted differently by other companies and under different circumstances. Although this may have an effect oncomparability of absolute percentage growth from company to company, we believe that these measures are useful in assessing trends of the respectivebusinesses or companies and may therefore be a useful tool in assessing period-to-period performance trends.
We integrate acquisitions as soon as possible. Revenues from the date we complete the acquisition through the end of the fourth quarter following theacquisition are considered the acquisition effect of such business for purposes of calculating organic revenue. As such, organic revenue excludes Alstomrevenues from November 3, 2015 through December 31, 2016. However, because of the significance of Alstom to our results and the exclusion of Alstomrevenues for more than 12 months in calculating organic revenue growth, we believe investors would also find it helpful to see the revenue growth of theindustrial segments adjusted to include Alstom's November and December revenues in an organic measure. As a result, we have also presented an adjustedorganic revenue growth measure on that basis.
We also believe that variability in the revenue of our Oil & Gas business may obscure underlying trends of our other industrial businesses. As a result, we havealso presented our organic revenue growth measure excluding the revenues of our Oil & Gas business.
INDUSTRIAL SEGMENT ORGANIC OPERATING PROFIT (Dollars in millions) 2016 2015 V% Industrial segment profit (GAAP) $ 17,598 $ 17,966 (2)%Adjustments: Acquisitions 739 (151) Business dispositions (other than dispositions of businesses acquired for investment) 181 649 Currency exchange rates (33) - Industrial segment organic operating profit (Non-GAAP) $ 16,712 $ 17,469 (4)% (Dollars in millions) 2015 2014 V% Industrial segment profit (GAAP) $ 17,966 $ 17,764 1%Adjustments: Acquisitions (132) (1) Business dispositions (other than dispositions of businesses acquired for investment) 3 195 Currency exchange rates (670) - Industrial segment organic operating profit (Non-GAAP) $ 18,766 $ 17,570 7% Industrial segment organic operating profit growth measures Industrial segment profit excluding the effects of acquisitions, business dispositions and currencyexchange rates. We believe that this measure provides management and investors with a more complete understanding of underlying operating results andtrends of established, ongoing operations by excluding the effect of acquisitions, dispositions and currency exchange, which activities are subject to volatility andcan obscure underlying trends. We also believe that presenting industrial segment organic operating profit growth separately for our industrial businessesprovides management and investors with useful information about the trends of our industrial businesses and enables a more direct comparison to other non-financial businesses and companies. Management recognizes that the term "Industrial segment organic operating profit growth" may be interpreted differently byother companies and under different circumstances. Although this may have an effect on comparability of absolute percentage growth from company tocompany, we believe that these measures are useful in assessing trends of the respective businesses or companies and may therefore be a useful tool inassessing period-to-period performance trends.
GE 2016 FORM 10-K 103

OIL & GAS ORGANIC REVENUE GROWTH (Dollars in millions) 2015 2014 V% Oil & Gas segment revenue (GAAP) $ 16,450 $ 19,085 (14)%Adjustments: Acquisitions 145 30 Business dispositions (other than dispositions of businesses acquired for investment) 25 319 Currency exchange rates (1,597) - Oil & Gas organic revenue (Non-GAAP) $ 17,878 $ 18,735 (5)%
OIL & GAS ORGANIC OPERATING PROFIT GROWTH (Dollars in millions) 2015 2014 V% Oil & Gas segment profit (GAAP) $ 2,427 $ 2,758 (12)%Adjustments: Acquisitions 8 - Business dispositions (other than dispositions of businesses acquired for investment) 1 18 Currency exchange rates (349) - Oil & Gas organic profit (Non-GAAP) $ 2,768 $ 2,739 1% Organic revenue and operating profit growth measure revenue and profit excluding the effects of acquisitions, business dispositions and currency exchangerates. We believe that these measures provide management and investors with a more complete understanding of underlying operating results and trends ofestablished, ongoing operations by excluding the effect of acquisitions, dispositions and currency exchange, which activities are subject to volatility and canobscure underlying trends. Management recognizes that the terms "organic revenue growth" and "organic operating profit growth" may be interpreted differentlyby other companies and under different circumstances. Although this may have an effect on comparability of absolute percentage growth from company tocompany, we believe that these measures are useful in assessing trends of the Oil & Gas business and may therefore be a useful tool in assessing period-to-period performance trends.
OPERATING AND NON-OPERATING PENSION COST (In millions) 2016 2015 2014 2013 Service cost for benefits earned $ 1,237 $ 1,424 $ 1,205 $ 1,535Prior service cost amortization 303 205 214 246Curtailment loss 31 105 65 -Operating pension cost (Non-GAAP) 1,571 1,734 1,484 1,781 Expected return on plan assets (3,336) (3,302) (3,190) (3,500)Interest cost on benefit obligations 2,939 2,778 2,745 2,460Net actuarial loss amortization 2,449 3,288 2,565 3,664Non-operating pension cost (Non-GAAP) 2,052 2,764 2,120 2,624Total principal pension plans cost (GAAP) $ 3,623 $ 4,498 $ 3,604 $ 4,405 We have provided the operating and non-operating components of cost for our principal pension plans. Operating pension cost comprises the service cost ofbenefits earned, prior service cost amortization and curtailment loss for our principal pension plans. Non-operating pension cost comprises the expected returnon plan assets, interest cost on benefit obligations and net actuarial loss amortization for our principal pension plans. We believe that the operating componentsof pension cost better reflect the ongoing service-related cost of providing pension benefits to our employees. We believe that the operating and non-operatingcomponents of cost for our principal pension plans, considered along with the corresponding GAAP measure, provide management and investors with additionalinformation for comparison of our pension plan cost and operating results with the pension plan cost and operating results of other companies.
GE 2016 FORM 10-K 104

ADJUSTED CORPORATE COSTS (OPERATING) (In millions) 2016 2015 2014 2013 Total Corporate Items and Eliminations (GAAP) $ (4,226) $ (5,108) $ (6,225) $ (6,002)Less: non-operating pension cost (Non-GAAP) (2,052) (2,764) (2,120) (2,624)Total Corporate costs (operating) (Non-GAAP) $ (2,175) $ (2,344) $ (4,105) $ (3,378)Less: restructuring and other charges, gains (losses), NBCU settlement and NBCU LLC (134) (237) (1,697) (17)Adjusted total corporate costs (operating) (Non-GAAP) $ (2,040) $ (2,107) $ (2,408) $ (3,361) Operating corporate costs exclude non-service-related pension costs of our principal pension plans, which comprise interest costs, expected return on planassets and amortization of actuarial gains/losses. Service cost, prior service cost and curtailment loss components of our principal pension plans are included inoperating corporate costs. We believe that these components of pension cost better reflect the ongoing service-related costs of providing pension benefits to ouremployees. Accordingly, we believe that our measure of operating corporate costs provides management and investors with a useful measure of the operationalcosts incurred outside of our businesses. We believe that this measure, considered along with the corresponding GAAP measure, provides management andinvestors with additional information for comparison of our operating corporate costs to the operating corporate costs of other companies.
We also believe that adjusting operating corporate costs to exclude the effects of items that are not closely associated with ongoing corporate operations, suchas earnings of previously divested businesses, gains and losses on disposed and held for sale businesses, restructuring and other charges, a settlement andNBCU LLC provides management and investors with a meaningful measure that increases the period-to-period comparability of our ongoing corporate costs .
GE PRE-TAX EARNINGS FROM CONTINUING OPERATIONS, EXCLUDING GE CAPITAL EARNINGS (LOSS) FROMCONTINUING OPERATIONS AND THE CORRESPONDING EFFECTIVE TAX RATES (Dollars in millions) 2016 2015 2014 GE earnings from continuing operations before income taxes (GAAP) $ 9,815$ 3,252$ 11,119Less: GE Capital earnings (loss) from continuing operations (1,251) (7,672) 1,532Total $ 11,066$ 10,924$ 9,587 GE provision for income taxes (GAAP) $ 967$ 1,506$ 1,634GE effective tax rate, excluding GE Capital earnings (Non-GAAP) 8.7 % 13.8 % 17.0 % RECONCILIATION OF U.S. FEDERAL STATUTORY INCOME TAX RATE TO GE EFFECTIVE TAX RATE, EXCLUDING GE CAPITAL EARNINGS 2016 2015 2014 U.S. federal statutory income tax rate 35.0 % 35.0 % 35.0 % Reduction in rate resulting from: Tax on global activities including exports (18.5) (15.8) (13.9) U.S. business credits (0.8) (1.2) (1.1) All other – net (7.0) (4.2) (3.0) (26.3) (21.2) (18.0) GE effective tax rate, excluding GE Capital earnings 8.7 % 13.8 % 17.0 %
We believe that the GE effective tax rate is best analyzed in relation to GE earnings before income taxes excluding the GE Capital net earnings from continuingoperations, as GE tax expense does not include taxes on GE Capital earnings. Management believes that in addition to the Consolidated and GE Capital taxrates shown in Note 14 to the consolidated financial statements, this supplemental measure provides investors with useful information as it presents the GEeffective tax rate that can be used in comparing the GE results to other non-financial services businesses.
GE 2016 FORM 10-K 105

INDUSTRIAL OPERATING EARNINGS AND GE CAPITAL EARNINGS (LOSS) FROM CONTINUING OPERATIONS AND EPS (Dollars in millions; except per share amounts) 2016 2015 2014 2013 Consolidated earnings from continuing operations attributable to GE common shareowners (GAAP) $ 9,128 $ 1,663 $ 9,535 $ 7,618 Non-operating pension cost (pre-tax) 2,052 2,764 2,120 2,624 Tax effect on non-operating pension cost(a) (718) (967) (742) (919)Adjustment: non-operating pension cost (net of tax) 1,334 1,797 1,378 1,705Operating earnings (Non-GAAP) $ 10,462 $ 3,460 $ 10,913 $ 9,323 Adjustment: GE Capital earnings (loss) from continuing operations attributable to GE common shareowners (1,251) (7,983) 1,209 401Industrial operating earnings (Non-GAAP) $ 11,713 $ 11,443 $ 9,705 $ 8,922 Earnings (loss) per share (EPS) - diluted(b) Consolidated EPS from continuing operations attributable to GE common shareowners (GAAP) $ 1.00 $ 0.17 $ 0.94 $ 0.74Adjustment: non-operating pension cost (net of tax) 0.15 0.18 0.14 0.17Operating EPS (Non-GAAP) 1.14 0.35 1.08 0.90GE Capital EPS from continuing operations attributable to GE common shareowners (GAAP) (0.14) (0.80) 0.12 0.04Industrial operating EPS (Non-GAAP) $ 1.28 $ 1.14 $ 0.96 $ 0.87 (a) The tax effect of non-operating pension costs was calculated using a 35% U.S. federal statutory tax rate, based on its applicability to such cost.(b) Earnings-per-share amounts are computed independently. As a result, the sum of per-share amounts may not equal the total.
Operating earnings excludes non-service-related pension costs of our principal pension plans comprising interest cost, expected return on plan assets andamortization of actuarial gains/losses. The service cost, prior service cost and curtailment loss components of our principal pension plans are included inoperating earnings. We believe that these components of pension cost better reflect the ongoing service-related costs of providing pension benefits to ouremployees. As such, we believe that our measure of operating earnings provides management and investors with a useful measure of the operational results ofour business. Other components of GAAP pension cost are mainly driven by capital allocation decisions and market performance, and we manage theseseparately from the operational performance of our businesses. Neither GAAP nor operating pension costs are necessarily indicative of the current or futurecash flow requirements related to our pension plans. We also believe that this measure, considered along with the corresponding GAAP measure, providesmanagement and investors with additional information for comparison of our operating results to the operating results of other companies. We believe thatpresenting operating earnings separately for our industrial businesses also provides management and investors with useful information about the relative size ofour industrial and financial services businesses in relation to the total company.
GE 2016 FORM 10-K 106

INDUSTRIAL OPERATING + VERTICALS EARNINGS AND EPS (Dollars in millions; except per share amounts) 2016 2015 2014 2013 GE Capital earnings (loss) from continuing operations attributable to GE common shareowners (GAAP) $ (1,251) $ (7,983) $ 1,209 $ 401Adjustment: GE Capital other continuing earnings (loss) (Other Capital) (3,143) (9,649) (399) (1,009)Verticals earnings(a) 1,892 1,666 1,608 1,410 Industrial operating earnings (Non-GAAP) $ 11,713 $ 11,443 $ 9,705 $ 8,922Verticals earnings(a) 1,892 1,666 1,608 1,410Industrial operating earnings + Verticals earnings (Non-GAAP) $ 13,605 $ 13,109 $ 11,313 $ 10,332Adjustment: Non-operating pension cost and other Capital (4,477) (11,446) (1,777) (2,714)Earnings (loss) from continuing operations attributable to GE common shareowners (GAAP) $ 9,128 $ 1,663 $ 9,535 $ 7,618 Earnings (loss) per share - diluted(b) Industrial operating EPS (Non-GAAP) $ 1.28 $ 1.14 $ 0.96 $ 0.87Verticals EPS 0.21 0.17 0.16 0.14Industrial operating + Verticals EPS (Non-GAAP) $ 1.49 $ 1.31 $ 1.12 $ 1.00Adjustment: Non-operating pension cost and other Capital (0.49) (1.14) (0.18) (0.27)EPS from continuing operations (GAAP) $ 1.00 $ 0.17 $ 0.94 $ 0.74 (a) Verticals include businesses expected to be retained (GECAS, Energy Financial Services, Industrial Finance and run-off insurance activities), including allocated
corporate costs of $100 million, $133 million, $233 million and $233 million after tax for the years ended December 31, 2016, 2015, 2014 and 2013, respectively.
(b) Earnings-per-share amounts are computed independently. As a result, the sum of per-share amounts may not equal the total.
As described above, Verticals represents the GE Capital businesses that we expect to retain. We believe that presenting Industrial operating + Verticalsearnings-per-share amounts provides management and investors with a useful measure to evaluate the performance of the businesses we expect to retain afterthe disposition of most of our financial services business.
See below for a graphic presentation of the reconciliation between GAAP EPS from continuing operations to the Industrial operating + Verticals EPS.
GE 2016 FORM 10-K 107

INDUSTRIAL OPERATING + VERTICALS EARNINGS AND EPS(a)
Industrial operating & Verticals$1.49 Non-operating pension & other Capital$(0.49)
Industrial operating & Verticals$1.31 Non-operating pension & other Capital$(1.14)
GAAP Continuing EPS $1.00 $0.17
Industrial operating & Verticals$1.12 Non-operating pension & other Capital$(0.18)
Industrial operating & Verticals$1.00 Non-operating pension & otherCapital$(0.27)
GAAP Continuing EPS $0.94 $0.74
(a) Earnings-per - share amounts are computed independently. As a result, the sum of per share amounts may not equal the total.
GE 2016 FORM 10-K 108

INDUSTRIAL OPERATING PROFIT AND OPERATING PROFIT MARGIN (EXCLUDING CERTAIN ITEMS) (Dollars in millions) 2016 2015 2014 2013 2012 Revenues GE total revenues and other income $ 113,676 $ 100,700 $ 109,546 $ 104,599 $ 104,900 Less: GE Capital earnings (loss) from continuing operations (1,251) (7,672) 1,532 699 1,368 GE revenues and other income excluding GE Capital earnings (loss) (Industrial revenues) (GAAP) $ 114,927 $ 108,371 $ 108,014 $ 103,900 $ 103,532 Less: gains 3,444 1,497 91 453 186 Less: NBCU - - - 1,528 1,615 Adjusted Industrial revenues (Non-GAAP) $ 111,483 $ 106,874 $ 107,923 $ 101,919 $ 101,731 Less: Alstom revenues 13,015 1,956 - - - Adjusted Industrial revenues ex. Alstom (Non-GAAP) $ 98,468 $ 104,918 $ 107,923 $ 101,919 $ 101,731 Costs GE total costs and expenses $ 103,860 $ 97,447 $ 98,427 $ 95,068 $ 94,081 Less: GE interest and other financial charges 2,026 1,706 1,579 1,333 1,353 Industrial costs excluding interest and other financial charges (GAAP) $ 101,834 $ 95,741 $ 96,848 $ 93,735 $ 92,728 Less: gains (cost basis) - - - 6 - Less: non-operating pension cost (pre-tax) 2,052 2,764 2,120 2,624 2,132 Less: restructuring and other charges 3,578 1,734 1,788 1,992 732 Less: noncontrolling interests and 2015 GE Capital preferred stock dividends 279 229 372 53 (37) Adjusted Industrial costs (Non-GAAP) $ 95,925 $ 91,015 $ 92,567 $ 89,060 $ 89,901 Less: Alstom costs and expenses 12,243 2,110 - - - Adjusted Industrial costs ex. Alstom (Non-GAAP) $ 83,682 $ 88,905 $ 92,567 $ 89,060 $ 89,901 Industrial profit (GAAP) $ 13,093 $ 12,630 $ 11,166 $ 10,165 $ 10,804 Industrial margins (GAAP) 11.4% 11.7% 10.3% 9.8% 10.4% Industrial operating profit (Non-GAAP) $ 15,558 $ 15,859 $ 15,356 $ 12,859 $ 11,831 Industrial operating profit margins (Non-GAAP) 14.0% 14.8% 14.2% 12.6% 11.6% Industrial operating profit ex. Alstom (Non-GAAP) $ 14,786 $ 16,013 $ 15,356 $ 12,859 $ 11,830 Industrial operating profit margins ex. Alstom (Non-GAAP) 15.0% 15.3% 14.2% 12.6% 11.6% . We have presented our Industrial operating profit and operating profit margin excluding gains, non-operating pension costs (pre-tax), restructuring and other,noncontrolling interests, GE Capital preferred stock dividends, as well as the results of Alstom. We believe that Industrial operating profit and operating profitmargin adjusted for these items are meaningful measures because they increase the comparability of period-to-period results .
INDUSTRIAL OPERATING PROFIT + VERTICALS (Dollars in millions) 2016 2015 2014 2013 Industrial operating profit (Non-GAAP)(a) $ 15,558 $ 15,859 $ 15,356 $ 12,859Vertical earnings(b) 1,892 1,666 1,606 1,410Industrial operating profit + Verticals (Non-GAAP) $ 17,450 $ 17,525 $ 16,962 $ 14,269 . (a) See Industrial Operating Profit and Operating Profit Margin reconciliation above for computation.
(b) See Industrial Operating + Verticals earnings and EPS reconciliation above for computation.
We have presented our measure of Industrial operating profit and Vertical earnings, which is the sum of the Industrial operating profit used in measuring theoperating margins of our industrial businesses and the net earnings of our Verticals businesses. See the reconciliations for these measures for additionalinformation about the basis for the measures and explanation of why we believe these individual measures are helpful to management and our investors. Wealso believe that this measure, which combines an industrial business measure with the results of our Vertical financial services business provides managementand investors with a measure that is aligned with the way in which we manage these businesses.
GE 2016 FORM 10-K 109

INDUSTRIAL SEGMENT GROSS MARGIN (EXCLUDING ALSTOM) (Dollars in millions) 2016 2015 Industrial Sales $ 110,835 $ 106,206Less: Corporate sales and eliminations (2,071) (1,858)Industrial segment sales 112,906 108,064Less: Alstom sales 13,096 1,953Industrial segment sales excluding Alstom $ 99,810 $ 106,111 Industrial cost of sales $ 85,712 $ 80,828Less: Corporate cost of sales and eliminations 3,315 2,026Industrial segment cost of sales 82,397 78,802Less: Alstom cost of sales 10,364 1,730Industrial segment cost of sales excluding Alstom $ 72,033 $ 77,072 Industrial segment gross margin $ 30,509 $ 29,262Industrial segment gross margin percentage 27.0% 27.1% Industrial segment gross margin excluding Alstom $ 27,777 $ 29,039Industrial segment gross margin percentage excluding Alstom 27.8% 27.4% We have presented our segment gross margin excluding the results of our fourth quarter 2015 Alstom power and grid acquisition. We believe that industrialsegment gross margin adjusted for the Alstom impacts is a meaningful measure because it increases the comparability of period-to-period results.
INDUSTRIAL SEGMENT OPERATING PROFIT AND OPERATING PROFIT MARGIN (EXCLUDING ALSTOM) (Dollars in millions) 2016 2015 2014 2013 2012 Revenues Total industrial segment revenues (GAAP) $ 113,156 $ 108,796$ 109,727 $ 103,383 $ 102,548 Less: Alstom revenues 13,015 1,956 - - - Total industrial segment operating revenues excluding Alstom (Non-GAAP) $ 100,141 $ 106,840$ 109,727 $ 103,383 $ 102,548 Segment profit (loss) Total industrial segment operating profit (GAAP) $ 17,598 $ 17,966$ 17,764 $ 16,220 $ 15,487 Total industrial segment operating profit margin (GAAP) 15.6% 16.5% 16.2% 15.7% 15.1% Less: Alstom profit (loss) $ 772 $ (154)$ - $ - $ - Total industrial segment operating profit excluding Alstom (Non-GAAP) $ 16,826 $ 18,120$ 17,764 $ 16,220 $ 15,487 Total industrial segment operating profit margin excluding Alstom (Non-GAAP) 16.8% 17.0% 16.2% 15.7% 15.1% . We have presented our segment gross margin excluding the results of our fourth quarter 2015 Alstom power and grid acquisition. We believe that industrialsegment gross margin adjusted for the Alstom impacts is a meaningful measure because it increases the comparability of period-to-period results.
We have also presented results of our Power, Renewable Energy and Energy Connections & Lighting segments excluding the effects of the fourth quarterAlstom power and grid acquisition. These measurements included revenues, operating profit and margin excluding Alstom, the reconciliations for which areincluded in the segment sections within MD&A. We believe that metrics adjusted for the Alstom impacts are meaningful measures because they increase thecomparability of period-to-period results .
GE 2016 FORM 10-K 110

AVERAGE GE SHAREOWNERS' EQUITY, EXCLUDING EFFECTS OF DISCONTINUED OPERATIONS(a) (In millions) 2016 2015 2014 2013 2012 Average GE shareowners' equity(a) (GAAP) $ 86,412 $ 111,140 $ 131,914 $ 124,501 $ 120,401Less the effects of the average net investment in discontinued operations 2,854 27,910 45,455 44,948 41,399Average GE shareowners' equity, excluding effects of discontinued operations(b) (Non-GAAP) $ 83,558 $ 83,230 $ 86,459 $ 79,553 $ 79,002 (a) On an annual basis, calculated using a five-point average.
(b) Used for computing Industrial return on total capital (ROTC).
Our Industrial ROTC calculation excludes earnings (losses) of discontinued operations from the numerator because GAAP requires us to display those earnings(losses) in the Statement of Earnings. Those earnings (losses) from discontinued operations include an allocation of interest expense either directly attributableor related to discontinued operations. Net investment in discontinued operations is calculated as assets of discontinued operations less liabilities of discontinuedoperations, including an allocation of GE Capital debt. Our calculation of average GE shareowners' equity may not be directly comparable to similarly titledmeasures reported by other companies. We believe that it is a clearer way to measure the ongoing trend in return on total capital for the continuing operations ofour businesses given the extent that discontinued operations have affected our reported results. We believe that this results in a more relevant measure formanagement and investors to evaluate performance of our continuing operations, on a consistent basis, and to evaluate and compare the performance of ourcontinuing operations with the ongoing operations of other businesses and companies.
Definitions indicating how the above-named ratios are calculated using average GE shareowners' equity, excluding effects of discontinued operations, can befound in the Other Items and Measures section within the MD&A.
AVERAGE GE CAPITAL SHAREOWNERS' EQUITY, EXCLUDING EFFECTS OF DISCONTINUED OPERATIONS(a) (In millions) 2016 2015 2014 2013 2012 Average GE Capital shareowners' equity(a) (GAAP) $ 34,382 $ 67,930 $ 85,370 $ 83,358 $ 79,873 Less the effects of the average net investment in discontinued operations 2,955 28,028 45,589 45,023 41,504 Average GE Capital shareowners' equity, excluding effects of discontinued operations(b) (Non-GAAP) $ 31,427 $ 39,902 $ 39,781 $ 38,335 $ 38,369 (a) On an annual basis, calculated using a five-point average.(b) Used for computing Industrial return on total capital (ROTC).
Our Industrial ROTC calculation excludes earnings (losses) of discontinued operations from the numerator because GAAP requires us to display those earnings(losses) in the Statement of Earnings. Our calculation of average GE Capital shareowners' equity may not be directly comparable to similarly titled measuresreported by other companies. We believe that it is a clearer way to measure the ongoing trend in return on total capital for the continuing operations of ourbusinesses given the extent that discontinued operations have affected our reported results. We believe that this results in a more relevant measure formanagement and investors to evaluate performance of our continuing operations, on a consistent basis, and to evaluate and compare the performance of ourcontinuing operations with the ongoing operations of other businesses and companies.
GE 2016 FORM 10-K 111

INDUSTRIAL RETURN ON TOTAL CAPITAL (INDUSTRIAL ROTC) (Dollars in millions) 2016 2015 2014 2013 2012 Earnings from continuing operations (GAAP) $ 9,494 $ 1,700 $ 9,490 $ 7,881 $ 8,816Less: GE Capital earnings (loss) from continuing operations (606) (7,718) 1,537 716 1,378Plus: GE after-tax interest 1,499 1,262 1,026 865 880Adjusted Industrial return (Non-GAAP) $ 11,599 $ 10,680 $ 8,979 $ 8,030 $ 8,318 Average GE shareholders' equity, excluding effects of discontinued operations(a) $ 83,558 $ 83,230 $ 86,459 $ 79,553 $ 79,002Less: average GE Capital's shareholders' equity, excluding effects of discontinued operations(a) 31,427 39,902 39,781 38,335 38,369Average Industrial shareholders' equity, excluding effects of discontinued operations 52,131 43,328 46,678 41,218 40,633Plus: average debt(a) 21,491 18,411 15,724 13,652 12,899Plus: other, net(b) 1,924 1,486 1,743 1,367 (1,106)Adjusted Industrial capital (Non-GAAP) $ 75,546 $ 63,225 $ 64,145 $ 56,237 $ 52,426 Industrial ROTC 15.4 % 16.9 % 14.0 % 14.3 % 15.9 % (a) On an annual basis, calculated using a five-point average.
(b) Includes average noncontrolling interests, calculated using a five-point average partially offset by the estimated value of assets held by GE to support GE Capital.
Our Industrial ROTC calculation excludes earnings (losses) of discontinued operations from the numerator. We believe that this is a clearer way to measure theongoing trend in return on Industrial capital for the continuing operations of the business to the extent that discontinued operations have affected our reportedresults. Our Industrial shareowners' equity used in the denominator is adjusted for debt, redeemable noncontrolling interests and noncontrolling interests. Webelieve that these adjustments provide a more meaningful denominator in measuring the return on our industrial businesses. Industrial ROTC was 15.4% in2016 versus 16.9% in 2015 and 14.0% in 2014. In 2016, an 8.6% increase in the adjusted Industrial return was combined with a 19.5% increase in the adjustedIndustrial capital. This increase in capital was principally driven by increased debt and effects from Alstom redeemable noncontrolling interests. Our calculationof the return on Industrial capital may not be directly comparable to similarly titled measures reported by other companies. We believe that the adjustmentsdescribed above result in a more relevant measure for management and investors to evaluate performance of our Industrial continuing operations, on aconsistent basis, and to evaluate and compare the performance of our Industrial continuing operations with the continuing operations of other businesses andcompanies.
GE 2016 FORM 10-K 112

INDUSTRIAL CASH FLOWS FROM OPERATING ACTIVITIES (INDUSTRIAL CFOA) AND INDUSTRIAL CFOAEXCLUDING TAXES RELATED TO BUSINESS SALES AND PRINCIPAL PENSION PLAN FUNDING (In millions) 2016 2015 2014 2013 Cash from GE's operating activities (continuing operations), as reported (GAAP) $ 29,960 $ 16,354 $ 15,171 $ 14,255
Adjustment: dividends from GE Capital 20,095 4,300 3,000 5,985Industrial CFOA (Non-GAAP) $ 9,865 $ 12,054 $ 12,171 $ 8,270Adjustment: taxes related to business sales 1,398 184 - 3,184Adjustment: Principal pension plan funding 347 - - -Industrial CFOA excluding deal-related taxes and Principal pension plan funding (Non-GAAP) $ 11,610 $ 12,238 $ 12,171 $ 11,454
GE CASH FLOWS FROM OPERATING ACTIVITIES (GE CFOA) EXCLUDING TAXES RELATED TO BUSINESS SALESAND PRINCIPAL PENSION PLAN FUNDING (In millions) 2016 2015 2014 2013 Cash from GE's operating activities (continuing operations), as reported (GAAP) $ 29,960 $ 16,354 $ 15,171 $ 14,255Adjustment: taxes related to business sales 1,398 184 - 3,184Adjustment: Principal pension plan funding 347 - - -GE CFOA excluding deal-related taxes and Principal pension plan funding (Non-GAAP) $ 31,705 $ 16,538 $ 15,171 $ 17,439
We define "Industrial CFOA" as GE's cash from operating activities (continuing operations) less the amount of dividends received by GE from GE Capital. Thisreflects the effects of intercompany transactions, which include, but are not limited to, the following: GE Capital working capital solutions to optimize GE cashmanagement; GE Capital enabled GE industrial orders; aircraft engines, power equipment and healthcare equipment manufactured by GE that are installed onGE Capital investments, including leased equipment; expenses related to parent-subsidiary pension plans; buildings and equipment leased between GE and GECapital, including sale-leaseback transactions; information technology (IT) and other services sold to GE Capital by GE; and various investments, loans andallocations of GE corporate overhead costs.
We believe that investors may find it useful to compare GE's operating cash flows without the effect of GE Capital dividends, since these dividends are notrepresentative of the operating cash flows of our industrial businesses and can vary from period to period based upon the results of the financial servicesbusinesses. We also believe that investors may find it useful to compare Industrial CFOA and GE CFOA excluding the effects of taxes paid related to the salesof the Appliances, Signaling and NBCU LLC businesses and contributions to our principal pension plans. Management recognizes that these measures may notbe comparable to cash flow results of companies which contain both industrial and financial services businesses, but believes that this comparison is aided bythe provision of additional information about the amounts of dividends paid by our financial services business and the separate presentation in our financialstatements of the GE Capital cash flows. We believe that our measure of Industrial CFOA, and both Industrial CFOA and GE CFOA excluding such sale-relatedtaxes and pension contributions (representing net sale proceeds associated with the July 1, 2016 sale of GEAM to State Street Corporation) providesmanagement and investors with useful measures to compare the capacity of our industrial operations to generate operating cash flow with the operating cashflow of other non-financial businesses and companies and as such provides useful measures to supplement the reported GAAP CFOA measure.
GE 2016 FORM 10-K 113

FREE CASH FLOW (FCF) AND FCF PLUS DISPOSITIONS (In millions) 2016 2015 2014 Cash from GE's operating activities (continuing operations) (GAAP) $ 29,960 $ 16,354 $ 15,171Less: GE additions to property, plant and equipment 3,758 3,785 3,970Plus: GE dispositions of property, plant and equipment 1,080 939 615Free cash flow (Non-GAAP) 27,282 13,508 11,816Plus: GE proceeds from principal business dispositions 5,357 1,725 602Free cash flow plus dispositions (Non-GAAP) 32,639 15,233 12,418 We define free cash flow as GE's cash from operating activities (continuing operations) less GE additions to property, plant and equipment and plus GEdispositions of property, plant and equipment, which are included in cash flows from investing activities. We believe that free cash flow is a useful financial metricto assess our ability to pursue opportunities to enhance our growth. We also believe that presenting free cash flow plus proceeds from business dispositionsprovides investors with useful information about the company's actual performance against performance targets. Management recognizes that the term freecash flow may be interpreted differently by other companies and under different circumstances. Although this may have an effect on comparability of absolutepercentage growth from company to company, we believe that these measures are useful in assessing trends of the respective businesses or companies andmay therefore be a useful tool in assessing period-to-period performance trends.
RATIO OF ADJUSTED DEBT TO EQUITY AT GE CAPITAL, NET OF LIQUIDITY December 31 (Dollars in millions) 2016 2015 2014 2013 2012 GE Capital debt $ 117,303 $ 180,178 $ 245,252 $ 283,820 $ 315,172Plus: debt of businesses held for sale and discontinued operations 2,076 31,075 105,687 86,546 81,229Adjusted GE Capital debt 119,379 211,253 350,939 370,366 396,401Less: liquidity(a) 49,100 70,497 54,109 65,492 52,810Less: cash of businesses held for sale and discontinued operations 1,429 20,395 22,243 9,617 9,308 $ 68,849 $ 120,361 $ 274,587 $ 295,256 $ 334,283 GE Capital equity $ 24,677 $ 46,227 $ 87,499 $ 82,694 $ 81,889 Ratio 2.79:1 2.6:1 3.14:1 3.57:1 4.08:1 (a) Liquidity includes cash and equivalents and $11.5 billion of high quality investments at December 31, 2016.
We have provided the GE Capital ratio of debt to equity on a basis that reflects the use of liquidity as a reduction of debt. For purposes of this ratio, we have alsoadjusted cash and debt balances to include amounts classified as assets and liabilities of businesses held for sale and discontinued operations. We believe thatthis is a useful comparison to a GAAP-based ratio of debt to equity because liquidity balances may be used to reduce debt. The usefulness of this supplementalmeasure may be limited, however, as the total amount of liquidity at any point in time may be different than the amount that could practically be applied toreduce outstanding debt. Despite this potential limitation, we believe that this measure, considered along with the corresponding GAAP measure, providesinvestors with additional information that may be more comparable to other financial institutions and businesses.
GE 2016 FORM 10-K 114

CAPITAL ENDING NET INVESTMENT (ENI), EXCLUDING LIQUIDITY December 31 (In billions) 2016 2015 2014(a) GE Capital total assets (GAAP) $ 183.0 $ 311.5 $ 500.2 Less: assets of discontinued operations 14.8 120.9 1.2 Less: non-interest bearing liabilities 37.4 38.8 60.5Capital ENI (Non-GAAP) 130.7 151.8 438.5 Less: liquidity(b) 49.1 70.5 75.5Capital ENI, excluding liquidity (Non-GAAP) $ 81.6 $ 81.3 $ 363.0 Plus: Discontinued operations ENI 11.2 84.9 (0.1)Total ENI (excluding liquidity) including discontinued operations (Non-GAAP) $ 92.8 $ 166.2 $ 362.9 (a) As originally reported.(b) Liquidity includes cash and equivalents and $11.5 billion of high quality investments at December 31, 2016.
We use ENI to measure the size of our Capital segment. We believe that this measure is a useful indicator of the capital (debt or equity) required to fund abusiness as it adjusts for non-interest bearing current liabilities generated in the normal course of business that do not require a capital outlay. We also believethat by excluding liquidity, we provide a meaningful measure of assets requiring capital to fund our Capital segment as a substantial amount of liquidity resultedfrom debt issuances to pre-fund future debt maturities and will not be used to fund additional assets. Liquidity consists of cash and equivalents and certain highquality investments. As a general matter, investments included in liquidity are expected to be highly liquid, giving us the ability to readily convert them to cash.Providing this measure will help investors measure how we are performing against our previously communicated goal to reduce the size of our financial servicessegment.
2017 OPERATING FRAMEWORK INCLUDING 2017 INDUSTRIAL OPERATING + VERTICALS EPS TARGET 2017 Industrial operating + Verticals EPS Target $1.60-1.70 Items not included in non-GAAP metric:
1) Non-operating pension cost, which we estimate to be approximately $(0.16) – (0.17) per share.2) Capital Other continuing earnings (excluding Verticals), which we estimate to be approximately $(0.03) – (0.12) per share. This amount is affected by,
among other things:• The timing of when, and the amount by which, the Company pays down GE Capital's outstanding debt; and• The timing and magnitude of the remaining costs associated with GE Capital's Exit Plan.
Note: The company cannot provide an equivalent GAAP EPS guidance range without unreasonable effort because of the uncertainty of the amount and timingof events affecting earnings as we execute the GE Capital Exit Plan. Although we have attempted to estimate GE Capital's Other continuing earnings for thepurpose of explaining the probable significance of this component, as described under number 2, this calculation involves a number of unknown variables,resulting in a GAAP range that we believe is too large and variable to be meaningful.
It is also impractical to provide a reconciliation for our organic revenue, Industrial operating margin expansion and Free Cash Flow plus Dispositions targets asthese involve a number of unknown variables including the effects of future acquisitions, dispositions, restructuring activities, property plant and equipmentpurchases and dispositions and currency exchange.
GE 2016 FORM 10-K 115

OTHER FINANCIAL DATASELECTED FINANCIAL DATA(Dollars in millions; per-share amounts in dollars) 2016 2015 2014 2013 2012 General Electric Company and Consolidated Affiliates Revenues and other income $ 123,693 $ 117,386 $ 117,184 $ 113,245 $ 112,588 Earnings from continuing operations attributable to the Company 9,784 1,681 9,535 7,618 8,646 Earnings (loss) from discontinued operations, net of taxes, attributable to the Company (952) (7,807) 5,698 5,439 4,995 Net earnings (loss) attributable to the Company 8,831 (6,126) 15,233 13,057 13,641 Dividends declared(a) 9,054 9,161 8,948 8,060 7,372 Return on average GE shareowners' equity 10.9% 1.6% 10.8% 9.5% 10.9% Per common share Earnings from continuing operations – diluted $ 1.00 $ 0.17 $ 0.94 $ 0.74 $ 0.82 Earnings (loss) from discontinued operations – diluted (0.10) (0.78) 0.56 0.53 0.47 Net earnings (loss) – diluted 0.89 (0.61) 1.50 1.27 1.29 Earnings from continuing operations – basic 1.01 0.17 0.95 0.74 0.82 Earnings (loss) from discontinued operations – basic (0.11) (0.78) 0.57 0.53 0.47 Net earnings (loss) – basic 0.90 (0.62) 1.51 1.28 1.29 Dividends declared 0.93 0.92 0.89 0.79 0.70 Stock price range 33.00 -27.10 31.49 -19.37 27.94-23.69 28.09-20.68 23.18-18.02 Year-end closing stock price 31.60 31.15 25.27 28.03 20.99 Cash and equivalents 48,129 70,483 70,025 79,175 68,225 Total assets of continuing operations 350,368 372,120 330,637 332,998 338,675 Total assets 365,183 493,071 653,931 662,202 690,415 Long-term borrowings 105,080 144,659 185,832 216,640 228,443 Common shares outstanding – average (in thousands) 9,025,479 9,944,179 10,044,995 10,222,198 10,522,922 Common shareowner accounts – average 450,000 470,000 490,000 512,000 537,000 Employees at year end United States 104,000 125,000 136,000 135,000 134,000 Other countries 191,000 208,000 169,000 172,000 171,000 Total employees(c) 295,000 333,000 305,000 307,000 305,000 GE data Short-term borrowings(d) $ 20,482 $ 19,792 $ 3,872 $ 1,841 $ 6,041 Long-term borrowings(d) 58,810 83,309 12,421 11,484 11,393 Redeemable noncontrolling interests 3,025 2,972 98 176 183 Noncontrolling interests 1,378 1,378 825 835 777 GE shareowners' equity 75,828 98,274 128,159 130,566 123,026 Total capital invested $ 159,523 $ 205,725 $ 145,375 $ 144,903 $ 141,420 Industrial return on total capital(b)* 15.4% 16.9% 14.0% 14.3% 15.9% Borrowings as a percentage of total capital invested(b) 49.7% 50.1% 11.2% 9.2% 12.3%GE Capital data Revenues $ 10,905 $ 10,801 $ 11,320 $ 11,267 $ 11,268 Earnings (loss) from continuing operations attributable to GE Capital (595) (7,654) 1,532 699 1,368 Earnings (loss) from discontinued operations, net of taxes, attributable to GE Capital (954) (7,485) 5,860 5,540 4,901 Less net earnings (loss) attributable to noncontrolling interests, discontinued operations (1) 312 157 36 53 Net earnings (loss) attributable to GE Capital (1,548) (15,450) 7,234 6,204 6,216 Net earnings (loss) attributable to GE Capital common shareowner (2,204) (15,780) 6,912 5,906 6,092 GE Capital shareowners' equity 24,677 46,227 87,499 82,694 81,889 Total borrowings(e) 117,303 180,178 245,252 283,820 315,172 Ratio of debt to equity at GE Capital(f) 4.75:1 3.90:1 2.80:1 3.43:1 3.85:1 Total assets(g) $ 182,970 $ 311,508 $ 499,614 $ 517,717 $ 538,802 Transactions between GE and GE Capital have been eliminated from the consolidated information.(a) Included $656 million and $18 million of preferred stock dividends in 2016 and 2015, respectively.(b) Indicated terms are defined in the Other Terms used by GE section within the MD&A.(c) For 2015, includes 55,500 employees as a result of the Alstom acquisition.(d) Excluding assumed debt of GE Capital, GE total borrowings is $20,512 million at December 31, 2016.(e) Included $58,780 million of GE Capital debt assumed by GE and maintained as intercompany payable to GE at December 31, 2016.(f) Ratios of 2.79:1, 2.6:1, 3.14:1, 3.57:1, and 4.08:1 for 2016, 2015, 2014, 2013 and 2012, respectively, net of liquidity*. For purposes of these ratios, cash and debt
balances have been adjusted to include amounts classified as assets and liabilities of businesses held for sale and discontinued operations.(g) GE Capital's total assets includes deferred income tax liabilities, which are presented within assets for purposes of our consolidating balance sheet presentation.*Non-GAAP Financial Measure
GE 2016 FORM 10-K 116

PURCHASES OF EQUITY SECURITIES BY THE ISSUER AND AFFILIATED PURCHASERS Approximate dollar value Total number of shares that of shares may yet be purchased purchased as part of under our Total number Average our share share of shares price paid repurchase repurchase Period purchased(a) per share program(b) program(b) (Shares in thousands) 2016 October 32,338 $ 27.39 32,265 November 20,805 30.16 20,791 December(c) 74,390 31.60 74,390 Total 127,533 $ 30.30 127,446 $ 24.7 billion (a) This category included 87 thousand shares repurchased from our various benefit plans.(b) Shares were repurchased through the 2015 GE Share Repurchase Program (the Program). As of December 31, 2016, we were authorized to repurchase up to $50.0
billion of our common stock through 2018 and we had repurchased a total of approximately $25.3 billion under the Program. The Program is flexible and shares willbe acquired with a combination of borrowings and free cash flow from the public markets and other sources, including GE Stock Direct, a stock purchase plan that isavailable to the public. The total amount remaining under our share repurchase program excludes an unsettled amount of $0.3 billion under an accelerated sharerepurchase (ASR) agreement.
(c) Includes 59,177 thousand shares repurchased at an average price of $31.60 per share pursuant to an ASR agreement.
GE 2016 FORM 10-K 117

RISK MANAGEMENT
A disciplined approach to risk is important in a diversified organization like ours to ensure that we are executing according to our strategic objectives and that weonly accept risk for which we are adequately compensated. We evaluate risk at the individual transaction level, and evaluate aggregated risk at the customer,industry, geographic and collateral-type levels, where appropriate.
RESPONSIBILITIESGE BOARD OF DIRECTORS
The GE Board of Directors (Board) has oversight for risk management with a focus on the most significant risks facing the Company, including strategic,operational, financial and legal and compliance risks. Throughout the year, the Board and the committees to which it has delegated responsibility dedicate aportion of their meetings to review and discuss specific risk topics in greater detail.
COMMITTEES
The Board has delegated responsibility for the oversight of specific risks to Board committees as follows:
THE AUDIT COMMITTEE oversees the policies, processes and risks relating to the financial statements, financial reporting processes, regulatory,compliance and litigation risks and auditing. The Audit Committee discusses with management the Company's risk assessment and risk management practicesand, when reviewing and approving the annual audit plan for the Company's internal audit function, prioritizes audit focus areas based on their potential risk. TheAudit Committee also oversees the Company's financial risk exposures related to GE Capital, following the dissolution of the GE Capital Committee effectiveDecember 31, 2016.
THE GOVERNANCE & PUBLIC AFFAIRS COMMITTEE oversees risk related to the Company's governance structure and processes and risks arisingfrom related-person transactions. It also reviews and discusses with management risks related to GE's public policy initiatives and activities and positions oncorporate social responsibilities, and it oversees the Company's environmental, health and safety compliance and related risks.
T HE MANAGEMENT DEVELOPMENT & COMPENSATION COMMITTEE oversees risk associated with management resources and structure,succession planning and management development and selection processes, and it reviews executive compensation practices at GE to confirm that payarrangements incentivize leaders to improve the Company's competitive position without encouraging excessive risk taking. The Management Development andCompensation Committee reviews and discusses, at least annually, the relationship between risk management policies and practices, corporate strategy andsenior executive compensation.
THE TECHNOLOGY & INDUSTRIAL RISK COMMITTEE oversees the Company's overall strategic direction and investment in research and developmentand technological and scientific initiatives. It also reviews and identifies specific technology, science and innovation matters and risks, including industrial,product, market and cybersecurity risk, that could have a significant impact on Company operations.
SENIOR MANAGEMENT
The GE Board's risk oversight process builds upon management's risk assessment and mitigation processes, which include standardized reviews of long-termstrategic and operational planning; executive development and evaluation; compliance under the Company's The Spirit & The Letter, laws and regulations; theCompany's integrity programs; health, safety and environmental compliance; financial reporting and controllership; and information technology and cybersecurityprograms.
GE 2016 FORM 10-K 118

OPERATING REVIEWS
CORPORATE AUDIT STAFF is responsible for reviewing the governance, processes, controls and accuracy of GE's financial reporting and, in concert withGE's Global Law & Policy function, GE's compliance reporting .
COMPLIANCE RISK REVIEWS are performed by the Policy Compliance Review Board, a management-level committee that assists in assessing andmitigating compliance risk. Members of the Policy Compliance Review Board, which include the Company's general counsel as chair, the Chief Financial Officerand other senior-level functional leaders, participated in ten compliance operating reviews in 2016.
GE BLUEPRINT REVIEWS are integrated business planning reviews across GE that evaluate strategic objectives, operating and organizationalperformance, and enterprise risks. Blueprint reviews are held at least four times per year and include the most senior GE business leaders.
RISK MANAGERS
Risk assessment and risk management are the responsibility of management and are carried out through risk managers who are operationally integrated intoeach of our businesses. These risk managers bring deep domain expertise to the businesses' operations and core processes. Both risk managers and thebusiness leadership teams have specific, enterprise risk focused goals and objectives that are aligned with our overall risk framework.
RISK MITIGATION & COMMUNICATIONRisks identified through our risk management processes are prioritized and, depending on the probability and severity of the risk, escalated as appropriate.Senior management discusses these risks periodically and assigns responsibility for them to the businesses. The assigned owners continually monitor, evaluateand report on risks for which they bear responsibility. Enterprise risk leaders within each business and corporate function are responsible to present riskassessments and key risks to senior management at least annually.
Depending on the nature of the risk involved and the particular business or function affected, we use a wide variety of risk mitigation strategies, includingdelegations of authority, standardized processes and strategic planning reviews, operating reviews, insurance, and hedging. As a matter of policy, we generallyhedge the risk of fluctuations in foreign currency exchange rates, interest rates and commodity prices. Our service businesses employ a comprehensive tollgateprocess leading up to and through the execution of a contractual service agreement to mitigate legal, financial and operational risks. Furthermore, we centrallymanage some risks by purchasing insurance, the amount of which is determined by balancing the level of risk retained or assumed with the cost of transferringrisk to others. We manage the risk of fluctuations in economic activity and customer demand by monitoring industry dynamics and responding accordingly,including by adjusting capacity, implementing cost reductions and engaging in mergers, acquisitions, dispositions and restructuring.
GE 2016 FORM 10-K 119

RISK FACTORSThe following discussion of risk factors contains "forward-looking statements," as discussed in the Forward-Looking Statements section. These risk factors maybe important to understanding any statement in this Annual Report on Form 10-K or elsewhere. The following information should be read in conjunction with theManagement's Discussion and Analysis of Financial Condition and Results of Operations (MD&A) section and the consolidated financial statements and relatednotes.
We leverage the risk framework in each of our businesses, which have adopted approaches that correspond to the Company's overall risk policies, guidelinesand review mechanisms. Our risk framework operates at the business and functional levels and is designed to identify, evaluate and mitigate risks within each ofthe risk categories below.
Our businesses routinely encounter and address risks, some of which will cause our future results to be different – sometimes materially different – than wepresently anticipate. Below, we describe certain important strategic, operational, financial, and legal and compliance risks. Our reactions to material futuredevelopments as well as our competitors' reactions to those developments will affect our future results.
STRATEGIC RISKS
Strategic risk relates to the Company's future business plans and strategies, including the risks associated with: the global macro-environment in which weoperate; mergers and acquisitions and restructuring activity; intellectual property; and other risks, including the demand for our products and services,competitive threats, the success of investments in our Digital business, technology and other product and service innovations, and public policy.
Global macro-environment - Our growth is subject to global economic and political risks.We operate in virtually every part of the world and serve customers in approximately 180 countries. In 2016, 57% of our revenue was attributable to activitiesoutside the United States. Our operations and the execution of our business plans and strategies are subject to the effects of global competition and geopoliticalrisks. They are also affected by local economic environments, including low interest rates, inflation, recession, currency volatility, currency controls and actual oranticipated default on sovereign debt. Political changes and trends such as populism, economic nationalism and sentiment toward multinational companies andresulting changes to trade, tax or other laws and policies may be disruptive, and can interfere with our global operating model, our supply chain, our customersand all of our activities in a particular location. While some global economic and political risks can be hedged using derivatives or other financial instruments andsome are insurable, such attempts to mitigate these risks are costly and not always successful, and our ability to engage in such mitigation may decrease orbecome even more costly as a result of more volatile market conditions.
GE 2016 FORM 10-K 120

M&A/restructuring - The success of our business depends on achieving our strategic objectives, including through acquisitions and businessintegrations, joint ventures, dispositions and restructurings.With respect to acquisitions, joint ventures and restructuring actions, we may not achieve expected returns and other benefits as a result of various factors,including integration and collaboration challenges, such as personnel and technology. Restructuring actions in connection with acquisitions or otherwise mayalso give rise to reputational risk, or such actions may not achieve anticipated cost savings and may result in lower margin rates. For example, our anticipatedreturns from mergers and acquisitions such as the Alstom acquisition in 2015 or the combination of our Oil & Gas business with Baker Hughes that wasannounced in October 2016 include cost and growth synergy benefits over a multi-year period that we may not fully realize. We also participate in a number ofjoint ventures with other companies or government enterprises in various markets around the world, including joint ventures where we may have a lesser degreeof control over the business operations, which may expose us to additional operational, financial, legal or compliance risks. We have been selling financialassets and businesses in numerous transactions in connection with the GE Capital Exit Plan, and we also continue to evaluate the potential disposition of otherassets and businesses that may no longer help us meet our objectives. When we decide to sell assets or a business, we may encounter difficulty in findingbuyers or executing alternative exit strategies on acceptable terms in a timely manner, which could delay the accomplishment of our strategic objectives.Alternatively, we may dispose of a business at a price or on terms that are less favorable than we had anticipated, or with the exclusion of assets that must bedivested or run off separately. After reaching an agreement with a buyer or seller for the acquisition or disposition of a business, such as the proposedcombination of our Oil & Gas business with Baker Hughes, the transaction remains subject to necessary regulatory and governmental approvals on acceptableterms as well as the satisfaction of pre-closing conditions, which may prevent us from completing the transaction. Dispositions may also involve continuedfinancial involvement in the divested business, such as through continuing equity ownership, transition service agreements, guarantees, indemnities or othercurrent or contingent financial obligations. Under these arrangements, performance by the divested businesses or other conditions outside our control couldaffect our future financial results.
Intellectual property - Our intellectual property portfolio may not prevent competitors from independently developing products and services similarto or duplicative to ours, and the value of our intellectual property may be negatively impacted by external dependencies.Our patents and other intellectual property may not prevent competitors from independently developing or selling products and services similar to or duplicativeof ours, and there can be no assurance that the resources invested by us to protect our intellectual property will be sufficient or that our intellectual propertyportfolio will adequately deter misappropriation or improper use of our technology. We could also face competition in some countries where we have notinvested in an intellectual property portfolio. If we are not able to protect our intellectual property, the value of our brand and other intangible assets may bediminished, and our business may be adversely affected. We also face attempts to gain unauthorized access to our IT systems or products for the purpose ofimproperly acquiring our trade secrets or confidential business information. The theft or unauthorized use or publication of our trade secrets and otherconfidential business information as a result of such an incident could adversely affect our competitive position and the value of our investment in research anddevelopment. In addition, we may be the target of enforcement of patents by third parties, including aggressive and opportunistic enforcement claims by non-practicing entities. Regardless of the merit of such claims, responding to infringement claims can be expensive and time-consuming. If GE is found to infringeany third-party rights, we could be required to pay substantial damages or we could be enjoined from offering some of our products and services. The value of,or our ability to use, our intellectual property may also be negatively impacted by dependencies on third parties, such as our ability to obtain or renew onreasonable terms licenses that we need in the future, or our ability to secure or retain ownership or rights to use data in certain software analytics or servicesofferings.
GE 2016 FORM 10-K 121

OPERATIONAL RISKS
Operational risk relates to risks arising from systems, processes, people and external events that affect the operation of our businesses. It includes product lifecycle and execution; product safety and performance; information management and data protection and security, including cybersecurity; supply chain andbusiness disruption; and other risks, including human resources and reputation.
Operations - We may face operational challenges that could have a material adverse effect on our business, reputation, financial position and resultsof operations, and we are dependent on the maintenance of existing product lines, market acceptance of new product and service introductions andproduct and service innovations for continued revenue and earnings growth.We produce highly sophisticated products and provide specialized services for both our and third-party products that incorporate or use leading-edgetechnology, including both hardware and software. Many of our products and services involve complex industrial machinery or infrastructure projects, such ascommercial jet engines, offshore oil and gas drilling or nuclear power generation, and accordingly the impact of a catastrophic product failure or similar eventcould be significant. While we have built extensive operational processes to ensure that our product design, manufacture and servicing, and other services thatwe provide, meet the most rigorous quality standards, there can be no assurance that we or our customers or other third parties will not experience operationalprocess failures or other problems, including through cyber attacks and other intentional acts, that could result in potential product, safety, regulatory orenvironmental risks. Despite the existence of crisis management or business continuity plans, operational failures or quality issues, including as a result oforganizational changes, attrition or labor relations, could have a material adverse effect on our business, reputation, financial position and results of operations.For projects where we take on the full scope of engineering, procurement, construction or other services, the potential risk is greater that operational, quality orother issues at particular projects could adversely affect GE's results of operations. The markets in which we operate are also subject to technological changeand require skilled talent. Our long-term operating results and competitive position depend substantially upon our ability to continually develop, introduce, andmarket new and innovative products and services, to modify existing products and services, to customize products and services, to anticipate and respond tomarket and technological changes driven by emerging risks and opportunities such as increased digitization or climate change and to deliver products, servicesand outcomes in line with our projected performance and/or cost estimates.
Cybersecurity - Increased cybersecurity requirements, vulnerabilities, threats and more sophisticated and targeted computer crime could pose a riskto our systems, networks, products, solutions, services and data. Increased global cybersecurity vulnerabilities, threats and more sophisticated and targeted cyber-related attacks pose a risk to the security of GE's and itscustomers', partners', suppliers' and third-party service providers' products, systems and networks and the confidentiality, availability and integrity of GE's and itscustomers' data. While we attempt to mitigate these risks by employing a number of measures, including employee training, monitoring and testing, andmaintenance of protective systems and contingency plans, we remain potentially vulnerable to additional known or unknown threats. We also may have accessto sensitive, confidential or personal data or information in certain of our businesses that is subject to privacy and security laws, regulations or customer-imposedcontrols. Despite our efforts to protect sensitive, confidential or personal data or information, we may be vulnerable to material security breaches, theft,misplaced or lost data, programming errors, employee errors and/or malfeasance that could potentially lead to the compromising of sensitive, confidential orpersonal data or information, improper use of our systems, software solutions or networks, unauthorized access, use, disclosure, modification or destruction ofinformation, defective products, production downtimes and operational disruptions. In addition, a cyber-related attack could result in other negativeconsequences, including damage to our reputation or competitiveness, remediation or increased protection costs, litigation or regulatory action.
Supply chain - Significant raw material shortages, supplier capacity constraints, supplier production disruptions, supplier quality and sourcingissues or price increases could increase our operating costs and adversely impact the competitive positions of our products.Our reliance on third-party suppliers, contract manufacturers and service providers, and commodity markets to secure raw materials, parts, components andsub-systems used in our products exposes us to volatility in the prices and availability of these materials, parts, components, systems and services. Some ofthese suppliers or their sub-suppliers are limited- or sole-source suppliers. A disruption in deliveries from our third-party suppliers, contract manufacturers orservice providers, capacity constraints, production disruptions, price increases, or decreased availability of raw materials or commodities, including as a result ofcatastrophic events, could have an adverse effect on our ability to meet our commitments to customers or increase our operating costs. Quality, capability andsourcing issues experienced by third-party providers can also adversely affect our costs, margin rates and the quality and effectiveness of our products andservices and result in liability and reputational harm.
GE 2016 FORM 10-K 122

FINANCIAL RISKS
Financial risk relates to our ability to meet financial obligations and mitigate exposure to broad market risks, including volatility in foreign currency exchangerates and interest rates and commodity prices; credit risk; and liquidity risk, including risk related to our credit ratings and our availability and cost of funding.Credit risk is the risk of financial loss arising from a customer or counterparty failure to meet its contractual obligations. We face credit risk in our industrialbusinesses, as well as in our GE Capital investing, lending and leasing activities and derivative financial instruments activities. Liquidity risk refers to thepotential inability to meet contractual or contingent financial obligations (whether on- or off-balance sheet) as they arise, and could potentially impact aninstitution's financial condition or overall safety and soundness.
Economy/counterparties - A deterioration of conditions in the global economy, the major industries we serve or the financial markets, or thesoundness of financial institutions and governments we deal with, may adversely affect our business and results of operations.The business and operating results of our industrial businesses have been, and will continue to be, affected by worldwide economic conditions, includingconditions in the air and rail transportation, power generation, oil and gas, renewables, healthcare and other major industries we serve. Existing or potentialcustomers may delay or cancel plans to purchase our products and services, including large infrastructure projects, and may not be able to fulfill their obligationsto us in a timely fashion as a result of business deterioration, cash flow shortages, low oil prices or difficulty obtaining financing due to slow global economicgrowth and other challenges affecting the global economy. The airline industry, for example, is highly cyclical, and the level of demand for air travel is correlatedto the strength of the U.S. and international economies. An extended period of slow growth in the U.S. or internationally that results in the loss of business andleisure traffic could have a material adverse effect on our airline customers and the viability of their business. Service contract cancellations or customerdynamics such as early aircraft retirements, reduced electricity demand in our Power and Renewable Energy businesses or declines in orders, projectcommencement delays and pricing pressures on our Oil & Gas business from low oil prices could affect our ability to fully recover our contract costs andestimated earnings. Further, our vendors may be experiencing similar conditions, which may impact their ability to fulfill their obligations to us. We may also facegreater challenges collecting on receivables with customers that are sovereign governments or located in emerging markets. If slow growth in the globaleconomy continues for a significant period or there is significant deterioration in the global economy, our results of operations, financial position and cash flowscould be materially adversely affected.
GE Capital also has exposure to many different industries and counterparties, including sovereign governments, and routinely executes transactions withcounterparties in the financial services industry, including brokers and dealers, commercial banks, investment banks and other institutional clients. Many ofthese transactions expose GE Capital to credit risk in the event of default of its counterparty or client. If conditions in the financial markets deteriorate, they mayadversely affect the business and results of operations of GE Capital, as well as the soundness of financial institutions, governments and other counterpartieswe deal with. In addition, GE Capital's credit risk may be increased when the value of collateral held cannot be realized through sale or is liquidated at pricesinsufficient to recover the full amount of the loan or derivative exposure due to it. GE Capital also has exposure to these financial institutions in the form of cashon deposit and unsecured debt instruments held in its investment portfolios. GE Capital has policies relating to credit rating requirements and to exposure limitsto counterparties (as described in Notes 20 and 29 to the consolidated financial statements), which are designed to limit credit and liquidity risk. There can be noassurance, however, that any losses or impairments to the carrying value of financial assets would not materially and adversely affect GE Capital's business,financial position, results of operations or capacity to provide financing to support orders from GE's industrial businesses.
GE 2016 FORM 10-K 123

Funding access/costs - Failure to maintain our credit ratings, or conditions in the financial and credit markets, could adversely affect our access tocapital markets, funding costs and related margins, liquidity and competitive position.The major debt rating agencies routinely evaluate our debt. This evaluation is based on a number of factors, which include financial strength as well astransparency with rating agencies and timeliness of financial reporting. As of December 31, 2016, GE and GE Capital's long-term unsecured debt credit ratingfrom both Standard and Poor's Ratings Service (S&P) and from Fitch Ratings Service (Fitch) was AA- (the fourth highest of 22 rating categories) with a stableoutlook. The long-term unsecured debt credit rating from Moody's Investors Service (Moody's) for GE and for GE Capital was A1 (the fifth highest of 21 creditratings), both with stable outlooks. As of December 31, 2016, GE and GE Capital's short-term credit rating from S&P was A-1+ (the highest rating category of sixcategories), from Fitch was F1+ (the highest rating category of six categories) and from Moody's was P-1 (the highest rating category of four categories). Therecan be no assurance that we will be able to maintain our credit ratings and failure to do so could adversely affect our cost of funds and related margins, liquidity,competitive position and access to capital markets. In addition, various debt and derivative instruments, guarantees and covenants would require postingadditional capital or collateral in the event of a ratings downgrade, which, depending on the extent of the downgrade, could have a material adverse effect on ourliquidity and capital position.Furthermore, to the extent that we rely on the availability of the unsecured debt markets to access funding for term and commercial paper maturities for 2017and beyond, external conditions in the financial and credit markets may limit the availability of funding at particular times or increase the cost of funding, whichcould affect our overall profitability. Factors that may affect the availability of funding or cause an increase in our funding costs include decreased capacity andincreased competition among commercial paper issuers, and potential impacts arising in the United States, Europe or China from developments in sovereigndebt situations, currency movements or other potential market disruptions. If GE or GE Capital's cost of funding were to increase, it may adversely affect ourcompetitive position and result in lower net interest margins, earnings and cash flows as well as lower returns on shareowners' equity and invested capital.
Social costs - Sustained increases in pension and healthcare benefits costs may reduce our profitability.Our results of operations may be positively or negatively affected by the amount of income or expense we record for our defined benefit pension plans. GAAPrequires that we calculate income or expense for the plans using actuarial valuations. These valuations reflect assumptions about financial market and othereconomic conditions, which may change based on changes in key economic indicators. The most significant year-end assumptions we use to estimate pensionexpense for 2017 are the discount rate and the expected long-term rate of return on the plan assets. In addition, we are required to make an annualmeasurement of plan assets and liabilities, which may result in a significant reduction or increase to equity. At the end of 2016, the GE Pension Plan wasunderfunded, on a GAAP basis, by $19.1 billion, and the GE Supplementary Pension Plan, an unfunded plan, had a projected benefit obligation of $6.5 billion.Although GAAP expense and pension funding contributions are not directly related, key economic factors that affect GAAP expense would also likely affect theamount of cash we would contribute to pension plans as required under the Employee Retirement Income Security Act (ERISA). Failure to achieve expectedreturns on plan assets driven by various factors, which could include a continued environment of low interest rates or sustained market volatility, could alsoresult in an increase to the amount of cash we would be required to contribute to pension plans. In addition, there may be upward pressure on the cost ofproviding healthcare benefits to current employees and retirees. Although we have actively sought to control increases in these costs, there can be noassurance that we will succeed in limiting cost increases, and continued upward pressure could reduce our profitability. For a discussion regarding how ourfinancial statements can be affected by our pension and healthcare benefit obligations, see the Other Consolidated Information – Postretirement Benefit Planssection and Notes 12 and 29 to the consolidated financial statements. See also the Critical Accounting Estimates – Pension Assumptions section for adiscussion regarding how our financial statements can be affected by our pension plan accounting policies.
GE 2016 FORM 10-K 124

LEGAL & COMPLIANCE RISKS
Legal and compliance risk relates to risks arising from the government and regulatory environment and action and from legal proceedings and compliance withintegrity policies and procedures, including those relating to financial reporting, environmental health and safety. Government and regulatory risk includes therisk that the government or regulatory actions will impose additional cost on us or require us to make adverse changes to our business models or practices.
Regulatory - We are subject to a wide variety of laws, regulations and government policies that may change in significant ways.Our businesses are subject to regulation under a wide variety of U.S. federal and state and non-U.S. laws, regulations and policies. There can be no assurancethat laws, regulations and policies will not be changed in ways that will require us to modify our business models and objectives or affect our returns oninvestments by restricting existing activities and products, subjecting them to escalating costs or prohibiting them outright. In particular, legislative, regulatory orother actions that U.S. and non-U.S. governments have undertaken or are considering in areas such data privacy and sovereignty, foreign exchangeintervention in response to currency volatility, currency controls that could restrict the movement of liquidity from particular jurisdictions, trade controls or tariffson imports and exports in the U.S. or other countries, complex economic sanctions and tax reform may have an effect on GE's, GE Capital's or other regulatedsubsidiaries' structure, operations, sales, liquidity, capital requirements, effective tax rate and performance. For example, efforts by public and private sectors tocontrol the growth of healthcare costs may lead to lower reimbursements and increased utilization controls related to the use of our products by healthcareproviders. Continued government scrutiny, including reviews of the U.S. Food and Drug Administration (U.S. FDA) medical device pre-market authorization andpost-market surveillance processes, may impact the requirements for marketing our products and slow our ability to introduce new products, resulting in anadverse impact on our business. Furthermore, we have been, and expect to continue, participating in U.S. and international governmental programs, whichrequire us to comply with strict governmental regulations. Inability to comply with these regulations could adversely affect our status in these projects andadversely affect our results of operations, financial position and cash flows.
Legal proceedings - We are subject to legal proceedings and legal compliance risks.We are subject to a variety of legal proceedings and legal compliance risks in virtually every part of the world, including the matters described in the LegalProceedings section. We, our representatives, and the industries in which we operate are subject to continuing scrutiny by regulators and other governmentalauthorities in the U.S., the European Union and other jurisdictions, which may, in certain circumstances, lead to enforcement actions, adverse changes to ourbusiness practices, fines and penalties or the assertion of private litigation claims and damages that could be material. For example, in connection with ouracquisition of Alstom's Thermal, Renewables and Grid businesses in November 2015, we are subject to legacy legal proceedings and legal compliance risksthat relate to claimed anti-competitive conduct or improper payments by Alstom in the pre-acquisition period. In addition, our discontinued U.S. mortgagebusiness, WMC, is a defendant in 11 civil lawsuits arising out of its origination and sale of mortgages from 2005 through 2007, and we learned in December2015 that, as part of continuing industry-wide investigation of subprime mortgages, the Civil Division of the U.S. Department of Justice is investigating potentialviolations of the Financial Institutions Reform, Recovery, and Enforcement Act of 1989 (FIRREA) by WMC and its affiliates. We have established reserves forthese and other legal matters as appropriate; however, the estimation of legal reserves or possible losses involves significant judgment and may not reflect thefull range of uncertainties and unpredictable outcomes inherent in litigation and investigations, and the actual losses arising from particular matters may exceedour current estimates and adversely affect our results of operations. Additionally, we and our subsidiaries are subject to remedial actions to clean upcontaminated sites as required by federal and state laws, such as the anticipated remediation for a stretch of the Housatonic River in Massachusetts, asdescribed in the Environmental Matters section. While we believe that we have adopted appropriate risk management and compliance programs, the global anddiverse nature of our operations and the current enforcement environment mean that legal and compliance risks will continue to exist with respect to ourcontinuing and discontinued operations, and additional legal proceedings and other contingencies, the outcome of which cannot be predicted with certainty, willarise from time to time. Moreover, we are increasingly selling products and services in growth markets where claims arising from a catastrophic product failure,alleged violations of law or other incidents involving our products and services may be adjudicated within legal systems that are less developed and less reliablethan those of the U.S. or other more developed markets, and this can create additional uncertainty about the outcome of proceedings before courts or othergovernmental bodies in such markets. See the Legal Proceedings section and Note 23 to the consolidated financial statements for additional information aboutlegal proceedings and other loss contingencies.
GE 2016 FORM 10-K 125

LEGAL PROCEEDINGSWMC .There are 11 lawsuits in which our discontinued U.S. mortgage business, WMC, is a party. The adverse parties in 10 of these cases are securitizationtrustees or parties claiming to act on their behalf. While the alleged claims for relief vary from case to case, the complaints and counterclaims in these actionsgenerally assert claims for breach of contract, indemnification, and/or declaratory judgment, and seek specific performance (repurchase) and/or monetarydamages. Beginning in the fourth quarter 2013, WMC entered into settlements that reduced its exposure on claims asserted in certain securitizations, and theclaim amounts reported herein reflect the effect of these settlements.
Five WMC cases are pending in the United States District Court for the District of Connecticut. Four of these cases were initiated in 2012, and one was initiatedin the third quarter 2013. Deutsche Bank National Trust Company (Deutsche Bank) is the adverse party in four cases, and Law Debenture Trust Company ofNew York (Law Debenture) is the adverse party in one case. The Deutsche Bank complaints assert claims on approximately $4,300 million of mortgage loansand seek to recover damages in excess of approximately $1,800 million. The Law Debenture complaint asserts claims on approximately $800 million ofmortgage loans, and alleges losses on these loans in excess of approximately $425 million. In September, WMC and Deutsche Bank agreed to settle all claimsarising out of the four securitizations at issue in the Connecticut lawsuits, subject to judicial approvals. In October, Deutsche Bank filed petitions for instruction inCalifornia state court seeking judicial instructions that Deutsche Bank's entry into the settlement agreements was a reasonable exercise of its discretion andapproving the distribution of settlement proceeds pursuant to the terms of each trust's governing documents.
Four cases are pending against WMC in New York State Supreme Court, all of which were initiated by securitization trustees or securities administrators. Thesecases involve, in the aggregate, claims involving approximately $4,559 million of mortgage loans. One of these lawsuits was initiated by Deutsche Bank in thesecond quarter 2013 and names as defendants WMC and Barclays Bank PLC. It involves claims against WMC on approximately $1,000 million of mortgageloans and does not specify the amount of damages sought. In September 2016, WMC and Deutsche Bank agreed to settle all claims arising out of the twosecuritizations at issue in this lawsuit, subject to judicial approvals. In October 2016, Deutsche Bank filed petitions for instruction in California state courtseeking judicial instructions that Deutsche Bank's entry into the settlement agreements was a reasonable exercise of its discretion and approving the distributionof settlement proceeds pursuant to the terms of each trust's governing documents. The second case, in which the plaintiff is The Bank of New York Mellon(BNY), was initiated in the fourth quarter 2012 and names as defendants WMC, J.P. Morgan Mortgage Acquisition Corporation and JPMorgan Chase Bank, N.A.BNY asserts claims on approximately $1,300 million of mortgage loans, and seeks to recover damages in excess of $650 million. The third case was initiated byBNY in November 2013 and names as defendants WMC, J.P. Morgan Mortgage Acquisition Corporation and JPMorgan Chase Bank, N.A. In this case, BNYasserts claims on approximately $1,300 million of mortgage loans, and seeks to recover damages in excess of $600 million. On September 18, 2015, the courtgranted defendants' motion to dismiss this case on statute of limitations grounds, and the plaintiff filed a notice of appeal on October 21, 2015. The fourth casewas filed in October 2014 and names as defendants WMC, J.P. Morgan Mortgage Acquisition Corporation and JPMorgan Chase Bank, N.A. The plaintiff, BNY,asserts claims on approximately $959 million of mortgage loans and seeks to recover damages in excess of $475 million.
One case is pending against WMC in the United States District Court for the Southern District of New York. The case was initiated by the Federal HousingFinance Agency (FHFA) in the fourth quarter 2012. In the second quarter 2013, Deutsche Bank, in its role as securitization trustee, intervened as a plaintiff andfiled a complaint relating to approximately $1,300 million of loans and alleging losses in excess of approximately $100 million. In December 2013, the DistrictCourt issued an order denying WMC's motion to dismiss but, on its own motion, ordered re-briefing on several issues raised by WMC's motion to dismiss inFebruary 2015. On July 10, 2015, the District Court entered an order dismissing the lawsuit as time-barred under the applicable statute of limitations. DeutscheBank filed a notice of appeal from this order of dismissal on August 13, 2015, and the United States Court of Appeals for the Second Circuit heard oral argumenton June 10, 2016. In September 2016, WMC and Deutsche Bank agreed to settle all claims arising out of the securitization at issue in this lawsuit, subject tojudicial approval. In October 2016, Deutsche Bank filed a petition for instruction in California state court seeking judicial instructions that Deutsche Bank's entryinto the settlement agreement was a reasonable exercise of its discretion and approving the distribution of settlement proceeds pursuant to the terms of thetrust's governing documents. The court has scheduled the initial hearing on this petition, and the other petitions filed by Deutsche Bank referenced above, forApril 2017.
GE 2016 FORM 10-K 126

The amounts of the claims at issue in these cases (discussed above) reflect the purchase price or unpaid principal balances of the mortgage loans at issue atthe time of purchase and do not give effect to pay downs, accrued interest or fees, or potential recoveries based upon the underlying collateral. All of themortgage loans involved in these lawsuits are included in WMC's reported claims at December 31, 2016. See Note 23 to the consolidated financial statementsfor additional information.
On January 23, 2017, the ResCap Liquidating Trust, as successor to Residential Funding Company, LLC (RFC), filed a lawsuit seeking unspecified damagesagainst WMC in the United States District Court for the District of Minnesota arising from alleged breaches in representations and warranties made by WMC inconnection with the sale of approximately $840 million in loans to RFC over a period of time preceding RFC's filing for bankruptcy protection in May 2012.
In December 2015, we learned that, as part of continuing industry-wide investigation of subprime mortgages, the Civil Division of the U.S. Department of Justiceis investigating potential violations of the Financial Institutions Reform, Recovery, and Enforcement Act of 1989 (FIRREA) by WMC and its affiliates arising out ofthe origination, purchase or sale of residential mortgage loans between January 1, 2005 and December 31, 2007. The Justice Department subsequently issuedsubpoenas to WMC and GE Capital, and we are cooperating with the Justice Department's investigation.
Alstom legacy matters . In connection with our acquisition of Alstom's Thermal, Renewables and Grid businesses in November 2015, we are subject tolegacy legal proceedings and legal compliance risks that relate to claimed anti-competitive conduct or improper payments by Alstom in the pre-acquisitionperiod. See Note 23 to the consolidated financial statements for additional information. As previously reported, in September 2013 the Israeli Antitrust Authorityissued a decision whereby Alstom, Siemens AG and ABB Ltd. were held liable for an alleged anti-competitive arrangement in the gas-insulated switchgearsmarket in Israel. While there was no fine in connection with that decision, claimants brought civil actions in 2013 seeking damages of approximately $950 millionand $600 million, respectively, related to the alleged conduct underlying the decision that are pending before the Central District Court in Israel. In December2016, all parties agreed in principle to participate in a formal mediation in 2017 with the goal of reaching a global settlement of the two civil actions.
Environmental matters .As previously reported, in 2000, GE and the Environmental Protection Agency (EPA) entered into a consent decree relating to PCBcleanup of the Housatonic River in Massachusetts. Following EPA's release in September 2015 of an intended final remediation decision, GE and EPA engagedin mediation and the first step of the dispute resolution process contemplated by the consent decree. In October 2016, EPA issued its final remediation decisionpursuant to the consent decree. GE and several other interested parties have appealed that decision to EPA's Environmental Appeals Board. A decision of theEnvironmental Appeals Board can ultimately be appealed to the United States Court of Appeals for the First Circuit. EPA may not implement any remedy until allappeals are exhausted. As of December 31, 2016, and based on its assessment of current facts and circumstances and its defenses, GE believes that it hasrecorded adequate reserves to cover future obligations associated with an expected final remedy. See Note 23 to the consolidated financial statements foradditional information.
GE 2016 FORM 10-K 127

MANAGEMENT AND AUDITOR'S REPORTS
MANAGEMENT'S DISCUSSION OF FINANCIAL RESPONSIBILITY
We believe that great companies are built on a foundation of reliable financial information and compliance with the spirit and letter of the law. For GeneralElectric Company, that foundation includes rigorous management oversight of, and an unyielding dedication to, controllership. The financial disclosures in thisreport are one product of our commitment to high-quality financial reporting. In addition, we make every effort to adopt appropriate accounting policies, wedevote our full resources to ensuring that those policies are applied properly and consistently and we do our best to fairly present our financial results in amanner that is complete and understandable.
Members of our corporate leadership team review each of our businesses routinely on matters that range from overall strategy and financial performance tostaffing and compliance. Our business leaders monitor financial and operating systems, enabling us to identify potential opportunities and concerns at an earlystage and positioning us to respond rapidly. Our Board of Directors oversees management's business conduct, and our Audit Committee, which consists entirelyof independent directors, oversees our internal control over financial reporting. We continually examine our governance practices in an effort to enhance investortrust and improve the Board's overall effectiveness. The Board and its committees annually conduct a performance self-evaluation and recommendimprovements. Our lead director chaired four meetings of our independent directors this year, helping us sharpen our full Board meetings to better coversignificant topics. Compensation policies for our executives are aligned with the long-term interests of GE investors.
We strive to maintain a dynamic system of internal controls and procedures—including internal control over financial reporting—designed to ensure reliablefinancial recordkeeping, transparent financial reporting and disclosure, and protection of physical and intellectual property. We recruit, develop and retain aworld-class financial team. Our internal audit function, including members of our Corporate Audit Staff, conducts thousands of financial, compliance and processimprovement audits each year. Our Audit Committee oversees the scope and evaluates the overall results of these audits, and in 2016, members of thatCommittee regularly attended GE Capital Board of Directors, Corporate Audit Staff and Controllership Council meetings. Our global integrity policies—"The Spirit& The Letter"—require compliance with law and policy, and pertain to such vital issues as upholding financial integrity and avoiding conflicts of interest. Theseintegrity policies are available in 35 languages, and are provided to all of our employees, holding each of them accountable for compliance. Our strongcompliance culture reinforces these efforts by requiring employees to raise any compliance concerns and by prohibiting retribution for doing so. To facilitateopen and candid communication, we have designated ombudspersons throughout the Company to act as independent resources for reporting integrity orcompliance concerns. We hold our directors, consultants, agents and independent contractors to the same integrity standards.
We are keenly aware of the importance of full and open presentation of our financial position and operating results, and rely for this purpose on our disclosurecontrols and procedures, including our Disclosure Committee, which comprises senior executives with detailed knowledge of our businesses and the relatedneeds of our investors. We ask this committee to review our compliance with accounting and disclosure requirements, to evaluate the fairness of our financialand non-financial disclosures, and to report their findings to us. In 2016, we further ensured strong disclosure by holding approximately 140 analyst and investormeetings with GE leadership present.
We welcome the strong oversight of our financial reporting activities by our independent registered public accounting firm, KPMG LLP, engaged by and reportingdirectly to the Audit Committee. U.S. legislation requires management to report on internal control over financial reporting and for auditors to render an opinionon such controls. Our report and the KPMG LLP report for 2016 follow.
GE 2016 FORM 10-K 128

MANAGEMENT'S ANNUAL REPORT ON INTERNAL CONTROL OVER FINANCIAL REPORTING
Management is responsible for establishing and maintaining adequate internal control over financial reporting for the Company. With our participation, anevaluation of the effectiveness of our internal control over financial reporting was conducted as of December 31, 2016, based on the framework and criteriaestablished in InternalControl–IntegratedFramework(2013)issued by the Committee of Sponsoring Organizations of the Treadway Commission.
Based on this evaluation, our management has concluded that our internal control over financial reporting was effective as of December 31, 2016 .
Our independent registered public accounting firm has issued an audit report on our internal control over financial reporting. Their report follows.
/s/ Jeffrey R. Immelt /s/ Jeffrey S. BornsteinJeffrey R. Immelt Jeffrey S. BornsteinChairman of the Board andChief Executive Officer February 24, 2017
Senior Vice President andChief Financial Officer
DISCLOSURE CONTROLS
Under the direction of our Chief Executive Officer and Chief Financial Officer, we evaluated our disclosure controls and procedures and internal control overfinancial reporting and concluded that our disclosure controls and procedures were effective as of December 31, 2016.
Other than as explained below, there have been no changes in the Company's internal control over financial reporting during the quarter ended December 31,2016, that have materially affected, or are reasonably likely to materially affect, its internal control over financial reporting.
On November 2, 2015, we closed the acquisition of Alstom's Thermal, Renewable, and Grid businesses. During 2016, we completed our purchase priceallocations and transitioned the acquired businesses to our accounting and reporting policies. We also commenced integrating their systems and processes intoour framework of internal controls over financial reporting. As part of this process, we have enhanced and augmented the internal controls of the acquiredbusinesses to raise them to a level that meets U.S. requirements. Efforts to further improve those controls are continuing.
GE 2016 FORM 10-K 129

REPORT OF INDEPENDENT REGISTERED PUBLIC ACCOUNTING FIRMThe Board of Directors and Shareownersof General Electric Company:
We have audited the accompanying statement of financial position of General Electric Company and consolidated affiliates (the "Company") as of December 31, 2016 and2015, and the related statements of earnings, comprehensive income, changes in shareowners' equity, and cash flows for each of the years in the three-year period endedDecember 31, 2016. We also have audited the Company's internal control over financial reporting as of December 31, 2016, based on criteria established in Internal Control –Integrated Framework (2013) issued by the Committee of Sponsoring Organizations of the Treadway Commission ("COSO"). The Company's management is responsible forthese consolidated financial statements, for maintaining effective internal control over financial reporting, and for its assessment of the effectiveness of internal control overfinancial reporting, included in the accompanying Management's Annual Report on Internal Control over Financial Reporting. Our responsibility is to express an opinion onthese consolidated financial statements and an opinion on the Company's internal control over financial reporting based on our audits.
We conducted our audits in accordance with the standards of the Public Company Accounting Oversight Board (United States). Those standards require that we plan andperform the audits to obtain reasonable assurance about whether the financial statements are free of material misstatement and whether effective internal control over financialreporting was maintained in all material respects. Our audits of the consolidated financial statements included examining, on a test basis, evidence supporting the amounts anddisclosures in the financial statements, assessing the accounting principles used and significant estimates made by management, and evaluating the overall financialstatement presentation. Our audit of internal control over financial reporting included obtaining an understanding of internal control over financial reporting, assessing the riskthat a material weakness exists, and testing and evaluating the design and operating effectiveness of internal control based on the assessed risk. Our audits also includedperforming such other procedures as we considered necessary in the circumstances. We believe that our audits provide a reasonable basis for our opinions.
A company's internal control over financial reporting is a process designed to provide reasonable assurance regarding the reliability of financial reporting and the preparation offinancial statements for external purposes in accordance with generally accepted accounting principles. A company's internal control over financial reporting includes thosepolicies and procedures that (1) pertain to the maintenance of records that, in reasonable detail, accurately and fairly reflect the transactions and dispositions of the assets ofthe company; (2) provide reasonable assurance that transactions are recorded as necessary to permit preparation of financial statements in accordance with generallyaccepted accounting principles, and that receipts and expenditures of the company are being made only in accordance with authorizations of management and directors of thecompany; and (3) provide reasonable assurance regarding prevention or timely detection of unauthorized acquisition, use, or disposition of the company's assets that couldhave a material effect on the financial statements.
Because of its inherent limitations, internal control over financial reporting may not prevent or detect misstatements. Also, projections of any evaluation of effectiveness tofuture periods are subject to the risk that controls may become inadequate because of changes in conditions, or that the degree of compliance with the policies or proceduresmay deteriorate.
In our opinion, the consolidated financial statements referred to above present fairly, in all material respects, the financial position of General Electric Company andconsolidated affiliates as of December 31, 2016 and 2015, and the results of their operations and their cash flows for each of the years in the three-year period endedDecember 31, 2016, in conformity with U.S. generally accepted accounting principles. Also in our opinion, the Company maintained, in all material respects, effective internalcontrol over financial reporting as of December 31, 2016, based on criteria established in Internal Control – Integrated Framework (2013) issued by COSO.
Our audits of the consolidated financial statements were made for the purpose of forming an opinion on the consolidated financial statements taken as a whole. Theaccompanying consolidating information appearing on pages 133, 137, and 139 is presented for purposes of additional analysis of the consolidated financial statements ratherthan to present the financial position, results of operations, and cash flows of the individual entities. The consolidating information has been subjected to the auditingprocedures applied in the audits of the consolidated financial statements and, in our opinion, is fairly stated in all material respects in relation to the consolidated financialstatements taken as a whole.
/s/ KPMG LLPKPMG LLPBoston, Massachusetts February 24, 2017
GE 2016 FORM 10-K 130

AUDITED FINANCIAL STATEMENTS AND NOTESStatement of Earnings 132Consolidated Statement of Comprehensive Income (Loss) 134Consolidated Statement of Changes in Shareowners' Equity 135Statement of Financial Position 136Statement of Cash Flows 138Notes to Consolidated Financial Statements 1 Basis of Presentation and Summary of Significant Accounting Policies 140 2 Businesses Held for Sale and Discontinued Operations 149 3 Investment Securities 153 4 Current Receivables 155 5 Inventories 156 6 GE Capital Financing Receivables and Allowance for Losses on Financing Receivables 156 7 Property, Plant and Equipment 157 8 Acquisitions, Goodwill and Other Intangible Assets 158 9 Contract Assets and All Other Assets 164 10 Borrowings 165 11 Investment Contracts, Insurance Liabilities and Insurance Annuity Benefits 167 12 Postretirement Benefit Plans 167 13 All Other Liabilities 172 14 Income Taxes 172 15 Shareowners' Equity 176 16 Other Stock-related Information 181 17 Other Income 184 18 Earnings Per Share Information 184 19 Fair Value Measurements 185 20 Financial Instruments 189 21 Variable Interest Entities 195 22 Receivables Facility 197 23 Commitments, Guarantees, Product Warranties and Other Loss Contingencies 198 24 Intercompany Transactions 202 25 Operating Segments 203 26 Cash Flows Information 205 27 Cost Information 207 28 Guarantor Financial Information 208 29 Supplemental Information 215 30 Quarterly Information (unaudited) 221
GE 2016 FORM 10-K 131

FINANCIAL STATEMENTS STATEMENT OF EARNINGS General Electric Company and consolidated affiliatesFor the years ended December 31 (In millions; per-share amounts in dollars) 2016 2015 2014 Revenues and other income Sales of goods $ 75,414 $ 74,510 $ 76,568Sales of services 34,976 31,298 30,190Other income (Note 17) 4,005 2,227 778GE Capital earnings (loss) from continuing operations - - -GE Capital revenues from services 9,297 9,350 9,648 Total revenues and other income 123,693 117,386 117,184 Costs and expenses (Note 27) Cost of goods sold 62,440 59,905 61,257Cost of services sold 25,043 22,788 22,447Selling, general and administrative expenses 18,377 17,831 16,848Interest and other financial charges 5,025 3,463 2,723Investment contracts, insurance losses and insurance annuity benefits 2,797 2,605 2,530Other costs and expenses 982 2,608 1,115 Total costs and expenses 114,663 109,200 106,921 Earnings from continuing operations before income taxes 9,030 8,186 10,263Benefit (provision) for income taxes (Note 14) 464 (6,485) (773)Earnings from continuing operations 9,494 1,700 9,490Earnings (loss) from discontinued operations, net of taxes (Note 2) (954) (7,495) 5,855Net earnings (loss) 8,540 (5,795) 15,345Less net earnings (loss) attributable to noncontrolling interests (291) 332 112Net earnings (loss) attributable to the Company 8,831 (6,126) 15,233Preferred stock dividends (656) (18) -Net earnings (loss) attributable to GE common shareowners $ 8,176 $ (6,145) $ 15,233 Amounts attributable to GE common shareowners Earnings from continuing operations $ 9,494 $ 1,700 $ 9,490 Less net earnings (loss) attributable to noncontrolling interests, continuing operations (290) 19 (45) Earnings from continuing operations attributable to the Company 9,784 1,681 9,535 Preferred stock dividends (656) (18) - Earnings from continuing operations attributable to GE common shareowners 9,128 1,663 9,535 Earnings (loss) from discontinued operations, net of taxes (954) (7,495) 5,855 Less net earnings (loss) attributable to noncontrolling interests, discontinued operations (1) 312 157Net earnings (loss) attributable to GE common shareowners $ 8,176 $ (6,145) $ 15,233 Per-share amounts (Note 18) Earnings from continuing operations Diluted earnings per share $ 1.00 $ 0.17 $ 0.94 Basic earnings per share $ 1.01 $ 0.17 $ 0.95 Net earnings (loss) Diluted earnings (loss) per share $ 0.89 $ (0.61) $ 1.50 Basic earnings (loss) per share $ 0.90 $ (0.62) $ 1.51 Dividends declared per common share $ 0.93 $ 0.92 $ 0.89 Amounts may not add due to rounding.
See Note 3 for other-than-temporary impairment amounts on investment securities.

See accompanying notes.
GE 2016 FORM 10-K 132

STATEMENT OF EARNINGS (CONTINUED) For the years ended December 31 GE(a) Financial Services (GE Capital)(In millions; per-share amounts in dollars) 2016 2015 2014 2016 2015 2014 Revenues and other income Sales of goods $ 75,580 $ 74,565 $ 76,715 $ 115 $ 79 $ 121Sales of services 35,255 31,641 30,594 - - -Other income (Note 17) 4,092 2,165 707 - - -GE Capital earnings (loss) from continuing operations (1,251) (7,672) 1,532 - - -GE Capital revenues from services - - - 10,790 10,722 11,199 Total revenues and other income 113,676 100,700 109,546 10,905 10,801 11,320 Costs and expenses (Note 27) Cost of goods sold 62,628 59,970 61,420 93 69 104Cost of services sold 23,084 20,858 20,456 2,238 2,273 2,394Selling, general and administrative expenses 16,123 14,914 14,972 2,947 3,512 2,689Interest and other financial charges 2,026 1,706 1,579 3,790 2,301 1,638Investment contracts, insurance losses and insurance annuity benefits - - - 2,861 2,737 2,660Other costs and expenses - - - 1,013 2,647 1,159 Total costs and expenses 103,860 97,447 98,427 12,942 13,539 10,645 Earnings (loss) from continuing operations before income taxes 9,815 3,252 11,119 (2,037) (2,739) 676Benefit (provision) for income taxes (Note 14) (967) (1,506) (1,634) 1,431 (4,979) 861Earnings (loss) from continuing operations 8,849 1,746 9,485 (606) (7,718) 1,537Earnings (loss) from discontinued operations, net of taxes (Note 2) (952) (7,807) 5,698 (954) (7,485) 5,860Net earnings (loss) 7,896 (6,061) 15,182 (1,560) (15,202) 7,397Less net earnings (loss) attributable to noncontrolling interests (279) 83 (50) (12) 248 162Net earnings (loss) attributable to the Company 8,176 (6,145) 15,233 (1,548) (15,450) 7,234Preferred stock dividends - - - (656) (330) (322)Net earnings (loss) attributable to GE common shareowners $ 8,176 $ (6,145) $ 15,233 $ (2,204) $ (15,780) $ 6,912 Amounts attributable to GE common shareowners: Earnings (loss) from continuing operations $ 8,849 $ 1,746 $ 9,485 $ (606) $ (7,718) $ 1,537 Less net earnings (loss) attributable to noncontrolling interests, continuing operations (279) 83 (50) (10) (64) 5 Earnings (loss) from continuing operations attributable to the Company 9,128 1,663 9,535 (595) (7,654) 1,532Preferred stock dividends - - - (656) (330) (322) Earnings (loss) from continuing operations attributable to GE common shareowners 9,128 1,663 9,535 (1,251) (7,983) 1,209 Earnings (loss) from discontinued operations, net of taxes (952) (7,807) 5,698 (954) (7,485) 5,860 Less net earnings (loss) attributable to noncontrolling interests, discontinued operations - - - (1) 312 157Net earnings (loss) attributable to GE common shareowners $ 8,176 $ (6,145) $ 15,233 $ (2,204) $ (15,780) $ 6,912 (a) Represents the adding together of all affiliated companies except GE Capital, which is presented on a one-line basis. See Note 1.
Amounts may not add due to rounding.In the consolidating data on this page, "GE" means the basis of consolidation as described in Note 1 to the consolidated financial statements; "GE Capital" means GE CapitalGlobal Holdings, LLC (GECGH) and its predecessor General Electric Capital Corporation (GECC) and all of their affiliates and associated companies. Separate information isshown for "GE" and "Financial Services (GE Capital)." Transactions between GE and GE Capital have been eliminated from the "General Electric Company and consolidatedaffiliates" columns on the prior page.
GE 2016 FORM 10-K 133

GENERAL ELECTRIC COMPANY AND CONSOLIDATED AFFILIATES CONSOLIDATED STATEMENT OF COMPREHENSIVE INCOME (LOSS) For the years ended December 31 (In millions) 2016 2015 2014
Net earnings (loss) $ 8,540 $ (5,795) $ 15,345
Less net earnings (loss) attributable to noncontrolling interests (291) 332 112
Net earnings (loss) attributable to the Company $ 8,831 $ (6,126) $ 15,233
Other comprehensive income (loss) Investment securities $ 203 $ (553) $ 708
Currency translation adjustments (1,311) (3,137) (2,730)
Cash flow hedges 93 99 234
Benefit plans (1,068) 5,165 (7,278)
Other comprehensive income (loss) (2,083) 1,575 (9,066)
Less other comprehensive income (loss) attributable to noncontrolling interests (14) (69) (13)Other comprehensive income (loss) attributable to the Company $ (2,069) $ 1,644 $ (9,053) Comprehensive income (loss) $ 6,457 $ (4,220) $ 6,278
Less comprehensive income (loss) attributable to noncontrolling interests (305) 263 99
Comprehensive income (loss) attributable to the Company $ 6,762 $ (4,483) $ 6,180
Amounts presented net of taxes. See Note 15 for further information about other comprehensive income (loss) and noncontrolling interests.
Amounts may not add due to rounding.
See accompanying notes.
GE 2016 FORM 10-K 134

GENERAL ELECTRIC COMPANY AND CONSOLIDATED AFFILIATES CONSOLIDATED STATEMENT OF CHANGES IN SHAREOWNERS' EQUITY (In millions) 2016 2015 2014 GE shareowners' equity balance at January 1 $ 98,274 $ 128,159 $ 130,566Net earnings (loss) attributable to the Company 8,831 (6,126) 15,233Dividends and other transactions with shareowners (9,054) (9,155) (8,948)Redemption value adjustment for redeemable noncontrolling interests (266) (25) (2)Other comprehensive income (loss) attributable to the Company (2,069) 1,644 (9,053)Net sales (purchases) of shares for treasury(a)(b) (19,499) (20,946) (32)Changes in other capital (389) 4,724 396Ending balance at December 31 75,828 98,274 128,159Noncontrolling interests 1,663 1,864 8,674Total equity balance at December 31 $ 77,491 $ 100,138 $ 136,833 (a) 2015 included $(20,383) million related to the split-off of Synchrony Financial from GE, where GE shares were exchanged for shares of Synchrony Financial.(b) 2016 included $(11,370) million of GE shares purchased under accelerated share repurchase (ASR) agreements.
Amounts may not add due to rounding.
See Note 15 for further information about changes in shareowners' equity.
See accompanying notes.
GE 2016 FORM 10-K 135

STATEMENT OF FINANCIAL POSITION
General Electric Company
and consolidated affiliatesDecember 31 (In millions, except share amounts) 2016 2015 Assets Cash and equivalents $ 48,129 $ 70,483Investment securities (Note 3) 44,313 31,973Current receivables (Note 4) 24,076 27,022Inventories (Note 5) 22,354 22,515Financing receivables – net (Note 6) 12,242 12,052Other GE Capital receivables 5,944 6,782Property, plant and equipment – net (Note 7) 50,518 54,095Receivable from GE Capital (debt assumption) - -Investment in GE Capital - -Goodwill (Note 8) 70,438 65,526Other intangible assets – net (Note 8) 16,436 17,797Contract assets (Note 9) 25,162 21,156All other assets (Note 9) 27,176 36,797Deferred income taxes (Note 14) 1,833 3,105Assets of businesses held for sale (Note 2) 1,745 2,818Assets of discontinued operations (Note 2) 14,815 120,951Total assets(a) $ 365,183 $ 493,071 Liabilities and equity Short-term borrowings (Note 10) $ 30,714 $ 49,860Accounts payable, principally trade accounts 14,435 13,680Progress collections and price adjustments accrued 16,760 15,776Dividends payable 2,107 2,167Other GE current liabilities 17,564 23,597Non-recourse borrowings of consolidated securitization entities (Note 10) 417 3,083Long-term borrowings (Note 10) 105,080 144,659Investment contracts, insurance liabilities and insurance annuity benefits (Note 11) 26,086 25,692Non-current compensation and benefits 43,780 40,487All other liabilities (Note 13) 22,912 23,611Liabilities of businesses held for sale (Note 2) 656 861Liabilities of discontinued operations (Note 2) 4,158 46,487Total liabilities(a) 284,668 389,961 Redeemable noncontrolling interests (Note 15) 3,025 2,972 Preferred stock (5,944,250 shares outstanding at both December 31, 2016 and December 31, 2015) 6 6Common stock (8,742,614,000 and 9,379,288,000 shares outstanding at December 31, 2016 and December 31, 2015, respectively) 702 702Accumulated other comprehensive income (loss) – net attributable to GE(b) Investment securities 674 460 Currency translation adjustments (6,816) (5,499) Cash flow hedges 12 (80) Benefit plans (12,469) (11,410)Other capital 37,224 37,613Retained earnings 139,532 140,020Less common stock held in treasury (83,038) (63,539)Total GE shareowners' equity 75,828 98,274Noncontrolling interests(c) (Note 15) 1,663 1,864Total equity (Note 15) 77,491 100,138Total liabilities, redeemable noncontrolling interests and equity $ 365,183 $ 493,071 (a) Our consolidated assets at December 31, 2016 included total assets of $6,332 million of certain variable interest entities (VIEs) that can only be used to settle the
liabilities of those VIEs. These assets included current receivables and net financing receivables of $1,722 million and investment securities of $982 million withincontinuing operations and assets of discontinued operations of $692 million. Our consolidated liabilities at December 31, 2016 included liabilities of certain VIEs forwhich the VIE creditors do not have recourse to GE. These liabilities included non-recourse borrowings of consolidated securitization entities (CSEs) of $(417) millionwithin continuing operations. See Note 21.
(b) The sum of accumulated other comprehensive income (loss) (AOCI) attributable to the Company was $(18,598) million and $(16,529) million at December 31, 2016and December 31, 2015, respectively.
(c) Included AOCI attributable to noncontrolling interests of $(278) million and $(264) million at December 31, 2016 and December 31, 2015, respectively.

Amounts may not add due to rounding.
See accompanying notes.
GE 2016 FORM 10-K 136

STATEMENT OF FINANCIAL POSITION (CONTINUED) GE(a) Financial Services (GE Capital)December 31 (In millions, except share amounts) 2016 2015 2016 2015 Assets Cash and equivalents $ 10,525 $ 10,372 $ 37,604 $ 60,111Investment securities (Note 3) 137 151 44,180 31,827Current receivables (Note 4) 12,715 14,707 - -Inventories (Note 5) 22,263 22,449 91 66Financing receivables – net (Note 6) - - 26,041 25,003Other GE Capital receivables - - 15,576 15,455Property, plant and equipment – net (Note 7) 19,103 20,145 32,225 34,781Receivable from GE Capital (debt assumption) 58,780 84,704 - -Investment in GE Capital 24,677 46,227 - -Goodwill (Note 8) 68,070 63,157 2,368 2,370Other intangible assets – net (Note 8) 16,131 17,365 305 435Contract assets (Note 9) 25,162 21,156 - -All other assets (Note 9) 12,007 12,813 14,608 25,081Deferred income taxes (Note 14) 6,666 7,666 (4,833) (4,561)Assets of businesses held for sale (Note 2) 1,629 2,818 - -Assets of discontinued operations (Note 2) 9 9 14,806 120,942Total assets $ 277,874 $ 323,737 $ 182,970 $ 311,508 Liabilities and equity Short-term borrowings(b) (Note 10) $ 20,482 $ 19,792 $ 23,443 $ 48,617Accounts payable, principally trade accounts 20,876 19,250 1,605 1,745Progress collections and price adjustments accrued 16,838 15,776 - -Dividends payable 2,107 2,167 - -Other GE current liabilities 17,564 23,595 - -Non-recourse borrowings of consolidated securitization entities (Note 10) - - 417 3,083Long-term borrowings(b) (Note 10) 58,810 83,309 93,443 128,478Investment contracts, insurance liabilities and insurance annuity benefits (Note 11) - - 26,546 26,155Non-current compensation and benefits 42,770 39,472 1,001 1,006All other liabilities (Note 13) 17,506 16,217 7,430 9,351Liabilities of businesses held for sale (Note 2) 656 1,409 - -Liabilities of discontinued operations (Note 2) 35 128 4,123 46,359Total liabilities 197,644 221,115 158,008 264,795 Redeemable noncontrolling interests (Note 15) 3,025 2,972 - - Preferred stock (5,944,250 shares outstanding at both December 31, 2016 and December 31, 2015) 6 6 6 6Common stock (8,742,614,000 and 9,379,288,000 shares outstanding at December 31, 2016 and December 31, 2015, respectively) 702 702 - -Accumulated other comprehensive income (loss) – net attributable to GE Investment securities 674 460 656 456 Currency translation adjustments (6,816) (5,499) (740) (898) Cash flow hedges 12 (80) 43 (112) Benefit plans (12,469) (11,410) (622) (540)Other capital 37,224 37,613 12,669 12,326Retained earnings 139,532 140,020 12,664 34,988Less common stock held in treasury (83,038) (63,539) - -Total GE shareowners' equity 75,828 98,274 24,677 46,227Noncontrolling interests (Note 15) 1,378 1,378 285 486Total equity (Note 15) 77,205 99,651 24,962 46,713Total liabilities, redeemable noncontrolling interests and equity $ 277,874 $ 323,737 $ 182,970 $ 311,508 (a) Represents the adding together of all affiliated companies except GE Capital, which is presented on a one-line basis. See Note 1.
(b) On December 2, 2015, senior unsecured notes and commercial paper was assumed by GE upon its merger with GE Capital resulting in an intercompany payable toGE. The short-term borrowings were $11,696 million (which includes a loan amount of $1,329 million from GE Capital to GE) and $17,642 million and the long-termborrowings were $47,084 million and $67,062 million at December 31, 2016 and December 31, 2015, respectively. See Note 10 for additional information.
Amounts may not add due to rounding.
In the consolidating data on this page, "GE" means the basis of consolidation as described in Note 1 to the consolidated financial statements; "GE Capital" means GE CapitalGlobal Holdings, LLC (GECGH) and its predecessor General Electric Capital Corporation (GECC) and all of their affiliates and associated companies. Separate information isshown for "GE" and "Financial Services (GE Capital)." Transactions between GE and GE Capital have been eliminated from the "General Electric Company and consolidated

affiliates" columns on the prior page.
GE 2016 FORM 10-K 137

STATEMENT OF CASH FLOWS General Electric Company and consolidated affiliatesFor the years ended December 31 (In millions) 2016 2015 2014 Cash flows – operating activities Net earnings (loss) $ 8,540 $ (5,795) $ 15,345Less net earnings (loss) attributable to noncontrolling interests (291) 332 112Net earnings (loss) attributable to the Company 8,831 (6,126) 15,233(Earnings) loss from discontinued operations 954 7,495 (5,855)Adjustments to reconcile net earnings attributable to the Company to cash provided from operating activities: Depreciation and amortization of property, plant and equipment 4,997 4,847 4,953 Earnings from continuing operations retained by GE Capital - - - Deferred income taxes 814 383 (882) Decrease (increase) in GE current receivables 1,514 (52) (1,913) Decrease (increase) in inventories (1,389) (314) (872) Increase (decrease) in accounts payable 1,198 (541) 565 Increase (decrease) in GE progress collections 1,836 (996) (515) All other operating activities (12,655) 7,160 5,318Cash from (used for) operating activities – continuing operations 6,099 11,856 16,033Cash from (used for) operating activities – discontinued operations (6,343) 8,034 11,676Cash from (used for) operating activities (244) 19,891 27,709 Cash flows – investing activities Additions to property, plant and equipment (7,199) (7,309) (7,134)Dispositions of property, plant and equipment 4,424 3,020 2,923Net decrease (increase) in GE Capital financing receivables 200 1,043 1,260Proceeds from sale of discontinued operations 59,890 79,615 232Proceeds from principal business dispositions 5,357 2,283 630Net cash from (payments for) principal businesses purchased (2,271) (12,027) (2,091)All other investing activities 2,212 (5,013) 23,410Cash from (used for) investing activities – continuing operations 62,613 61,613 19,229Cash from (used for) investing activities – discontinued operations (13,412) (2,125) (24,263)Cash from (used for) investing activities 49,202 59,488 (5,034) Cash flows – financing activities Net increase (decrease) in borrowings (maturities of 90 days or less) (1,135) (24,459) (6,409)Newly issued debt (maturities longer than 90 days) 1,492 13,951 14,629Repayments and other reductions (maturities longer than 90 days) (58,768) (47,038) (38,410)Net dispositions (purchases) of GE shares for treasury (21,429) (1,099) (1,218)Dividends paid to shareowners (8,806) (9,295) (8,852)All other financing activities (1,274) (1,605) (652)Cash from (used for) financing activities – continuing operations (89,920) (69,547) (40,912)Cash from (used for) financing activities – discontinued operations 789 (6,507) 23,956Cash from (used for) financing activities (89,131) (76,054) (16,956)Effect of currency exchange rate changes on cash and equivalents (1,146) (3,464) (3,492)Increase (decrease) in cash and equivalents (41,319) (138) 2,224Cash and equivalents at beginning of year 90,879 91,017 88,792Cash and equivalents at end of year 49,558 90,879 91,017Less cash and equivalents of discontinued operations at end of year 1,429 20,395 20,991Cash and equivalents of continuing operations at end of year $ 48,129 $ 70,483 $ 70,025Supplemental disclosure of cash flows information Cash paid during the year for interest $ (5,779) $ (8,764) $ (9,539)Cash recovered (paid) during the year for income taxes (7,469) (2,486) (2,955) Amounts may not add due to rounding.
See accompanying notes.
GE 2016 FORM 10-K 138

STATEMENT OF CASH FLOWS (CONTINUED) GE(a) Financial Services (GE Capital)For the years ended December 31 (In millions) 2016 2015 2014 2016 2015 2014 Cash flows – operating activities Net earnings (loss) $ 7,896 $ (6,061) $ 15,182 $ (1,560) $ (15,202) $ 7,397Less net earnings (loss) attributable to noncontrolling interests (279) 83 (50) (12) 248 162Net earnings (loss) attributable to the Company 8,176 (6,145) 15,233 (1,548) (15,450) 7,234(Earnings) loss from discontinued operations 952 7,807 (5,698) 954 7,485 (5,860)Adjustments to reconcile net earnings attributable to the Company to cash provided from operating activities: Depreciation and amortization of property, plant and equipment 2,597 2,473 2,508 2,384 2,436 2,529 Earnings from continuing operations retained by GE Capital(b) 21,345 12,284 1,625 - - - Deferred income taxes 1,107 (1,800) (476) (293) 2,183 (406) Decrease (increase) in GE current receivables 929 666 (473) - - - Decrease (increase) in inventories (1,337) (282) (877) (10) (14) 27 Increase (decrease) in accounts payable 1,716 276 884 17 (189) 258 Increase (decrease) in GE progress collections 1,913 (1,010) (528) - - - All other operating activities (7,438) 2,083 2,973 (3,054) 5,087 2,480Cash from (used for) operating activities – continuing operations 29,960 16,354 15,171 (1,552) 1,537 6,263Cash from (used for) operating activities – discontinued operations (90) (12) (2) (6,253) 8,046 11,678Cash from (used for) operating activities 29,870 16,342 15,169 (7,805) 9,583 17,941 Cash flows – investing activities Additions to property, plant and equipment (3,758) (3,785) (3,970) (3,769) (4,237) (3,818)Dispositions of property, plant and equipment 1,080 939 615 3,637 2,526 2,331Net decrease (increase) in GE Capital financing receivables - - - (1,279) 226 (161)Proceeds from sale of discontinued operations - - - 59,890 79,615 232Proceeds from principal business dispositions 5,357 1,725 602 - 532 -Net cash from (payments for) principal businesses purchased (2,271) (10,350) (2,091) - (1,677) -All other investing activities (2,392) (1,308) (1,062) 1,639 (4,690) 24,574Cash from (used for) investing activities – continuing operations (1,984) (12,779) (5,906) 60,118 72,295 23,158Cash from (used for) investing activities – discontinued operations 90 12 2 (13,501) (2,137) (24,263)Cash from (used for) investing activities (1,894) (12,767) (5,905) 46,617 70,158 (1,105) Cash flows – financing activities Net increase (decrease) in borrowings (maturities of 90 days or less) 1,595 603 243 (1,655) (24,834) (7,078)Newly issued debt (maturities longer than 90 days) 5,307 3,560 3,084 1,174 10,391 11,545Repayments and other reductions (maturities longer than 90 days) (4,156) (2,190) (323) (58,285) (44,848) (38,087)Net dispositions (purchases) of GE shares for treasury (21,429) (1,099) (1,218) - - -Dividends paid to shareowners (8,474) (9,289) (8,851) (20,427) (4,620) (3,322)All other financing activities (273) 203 346 (1,127) (1,362) (679)Cash from (used for) financing activities – continuing operations (27,430) (8,211) (6,719) (80,320) (65,273) (37,621)Cash from (used for) financing activities – discontinued operations - - - 789 (6,507) 23,956Cash from (used for) financing activities (27,430) (8,211) (6,719) (79,531) (71,780) (13,665)Effect of currency exchange rate changes on cash and equivalents (392) (908) (312) (754) (2,556) (3,180)Increase (decrease) in cash and equivalents 153 (5,544) 2,234 (41,473) 5,406 (9)Cash and equivalents at beginning of year 10,372 15,916 13,682 80,506 75,100 75,109Cash and equivalents at end of year 10,525 10,372 15,916 39,033 80,506 75,100Less cash and equivalents of discontinued operations at end of year - - - 1,429 20,395 20,991Cash and equivalents of continuing operations at end of year $ 10,525 $ 10,372 $ 15,916 $ 37,604 $ 60,111 $ 54,109Supplemental disclosure of cash flows information Cash paid during the year for interest $ (1,753) $ (1,327) $ (1,248) $ (4,982) $ (8,047) $ (8,910)Cash recovered (paid) during the year for income taxes (2,612) (1,636) (1,337) (4,857) (850) (1,618) (a) Represents the adding together of all affiliated companies except GE Capital, which is presented on a one-line basis.(b) Represents GE Capital earnings/loss from continuing operations attributable to the Company, net of GE Capital dividends paid to GE.
Amounts may not add due to rounding.In the consolidating data on this page, "GE" means the basis of consolidation as described in Note 1 to the consolidated financial statements; "GE Capital" means GE CapitalGlobal Holdings, LLC (GECGH) and its predecessor General Electric Capital Corporation (GECC) and all of their affiliates and associated companies. Separate information isshown for "GE" and "Financial Services (GE Capital)." Transactions between GE and GE Capital have been eliminated from the "Consolidated" columns and are discussed inNote 24.

GE 2016 FORM 10-K 139

NOTES TO CONSOLIDATED FINANCIAL STATEMENTSNOTE 1. BASIS OF PRESENTATION AND SUMMARY OF SIGNIFICANT ACCOUNTING POLICIESCONSOLIDATION
Our financial statements consolidate all of our affiliates – entities in which we have a controlling financial interest, most often because we hold a majority votinginterest. To determine if we hold a controlling financial interest in an entity, we first evaluate if we are required to apply the variable interest entity (VIE) model tothe entity, otherwise, the entity is evaluated under the voting interest model.
Where we hold current or potential rights that give us the power to direct the activities of a VIE that most significantly impact the VIE's economic performance,combined with a variable interest that gives us the right to receive potentially significant benefits or the obligation to absorb potentially significant losses, we havea controlling financial interest in that VIE. Rights held by others to remove the party with power over the VIE are not considered unless one party can exercisethose rights unilaterally. When changes occur to the design of an entity, we reconsider whether it is subject to the VIE model. We continuously evaluate whetherwe have a controlling financial interest in a VIE.
We hold a controlling financial interest in other entities where we currently hold, directly or indirectly, more than 50% of the voting rights or where we exercisecontrol through substantive participating rights or as a general partner. Where we are a general partner, we consider substantive removal rights held by otherpartners in determining if we hold a controlling financial interest. We reevaluate whether we have a controlling financial interest in these entities when our votingor substantive participating rights change.
Associated companies are unconsolidated VIEs and other entities in which we do not have a controlling financial interest, but over which we have significantinfluence, most often because we hold a voting interest of 20% to 50%. Associated companies are accounted for as equity method investments. Our share ofthe results of associated companies are presented on a one-line basis. Investments in, and advances to, associated companies are presented on a one-linebasis in the caption "All other assets" in our Statement of Financial Position, net of allowance for losses, which represents our best estimate of probable lossesinherent in such assets.
FINANCIAL STATEMENT PRESENTATION
We have reclassified certain prior-year amounts to conform to the current-year's presentation. Certain columns and rows may not add due to the use of roundednumbers. Percentages presented are calculated from the underlying numbers in millions.
Upon closing an acquisition, we consolidate the acquired business as soon as practicable. The size, scope and complexity of an acquisition can affect the timenecessary to adjust the acquired company's accounting policies, procedures, and books and records to our standards. Accordingly, it is possible that changeswill be necessary to the carrying amounts and presentation of assets and liabilities in our financial statements as the acquired company is fully assimilated.
Financial data and related measurements are presented in the following categories:
GE. This represents the adding together of all affiliates except GE Capital, whose continuing operations are presented on a one-line basis, giving effect to theelimination of transactions among such affiliates.
GE Capital . This refers to GE Capital Global Holdings, LLC (GECGH), or its predecessor General Electric Capital Corporation (GECC), and is the addingtogether of all affiliates of GE Capital giving effect to the elimination of transactions among such affiliates.
Consolidated . This represents the adding together of GE and GE Capital, giving effect to the elimination of transactions between GE and GE Capital.
Operating Segments . These comprise our eight businesses, focused on the broad markets they serve: Power, Renewable Energy, Oil & Gas, Aviation,Healthcare, Transportation, Energy Connections & Lighting and Capital.
GE 2016 FORM 10-K 140

Unless otherwise indicated, information in these notes to consolidated financial statements relates to continuing operations. Certain of our operations have beenpresented as discontinued. See Note 2.
The effects of translating to U.S. dollars the financial statements of non-U.S. affiliates whose functional currency is other than the U.S. dollar are included inshareowners' equity. Asset and liability accounts are translated at year-end exchange rates, while revenues and expenses are translated at average rates forthe respective periods.
Preparing financial statements in conformity with U.S. generally accepted accounting principles (GAAP) requires us to make estimates based on assumptionsabout current, and for some estimates future, economic and market conditions which affect reported amounts and related disclosures in our financialstatements. Although our current estimates contemplate current conditions and how we expect them to change in the future, as appropriate, it is reasonablypossible that actual conditions could be worse than anticipated in those estimates, which could materially affect our results of operations and financial position.Among other effects, such changes could result in future impairments of investment securities, goodwill, intangibles and long-lived assets, incremental losses onfinancing receivables, establishment of valuation allowances on deferred tax assets, incremental fair value marks on businesses and assets held for sale carriedat lower of cost or market, and increased tax liabilities and insurance reserves.
ACCOUNTING PRINCIPLES AND POLICIES
Our financial statements are prepared in conformity with GAAP.
SALES OF GOODS AND SERVICES
We record all sales of goods and services only when a firm sales agreement is in place, delivery has occurred or services have been rendered and collectabilityof the fixed or determinable sales price is reasonably assured.
Arrangements for the sale of goods and services sometimes include multiple components. Most of our multiple component arrangements involve the sale ofgoods and services in the Healthcare segment. Our arrangements with multiple components usually involve an upfront deliverable of large machinery orequipment and future service deliverables such as installation, commissioning, training or the future delivery of ancillary products. In most cases, the relativevalues of the undelivered components are not significant to the overall arrangement and are typically delivered within three to six months after the core producthas been delivered. In such agreements, selling price is determined for each component and any difference between the total of the separate selling prices andtotal contract consideration (i.e., discount) is allocated pro rata across each of the components in the arrangement. The value assigned to each component isobjectively determined and obtained primarily from sources such as the separate selling price for that or a similar item or from competitor prices for similar items.If such evidence is not available, we use our best estimate of selling price, which is established consistent with the pricing strategy of the business and considersproduct configuration, geography, customer type, and other market specific factors.
Except for goods sold under long-term agreements, we recognize sales of goods under the provisions of U.S. Securities and Exchange Commission (SEC) StaffAccounting Bulletin (SAB) 104, RevenueRecognition. In arrangements where we sell products that provide the customer with a right of return, we use ouraccumulated experience to estimate and provide for such returns when we record the sale. In situations where arrangements include customer acceptanceprovisions based on seller or customer-specified objective criteria, we recognize revenue when we have reliably demonstrated that all specified acceptancecriteria have been met or when formal acceptance occurs, respectively. In arrangements where we provide goods for trial and evaluation purposes, we onlyrecognize revenue after customer acceptance occurs. Unless otherwise noted, we do not provide for anticipated losses before we record sales.
GE 2016 FORM 10-K 141

We recognize revenue on agreements for sales of goods and services under power generation unit and uprate contracts, nuclear fuel assemblies, larger oildrilling equipment projects, aeroderivative unit contracts, military development contracts, locomotive production contracts, and long-term construction projects,using long-term construction and production contract accounting. We estimate total long-term contract revenue net of price concessions as well as total contractcosts. For goods sold under power generation unit and uprate contracts, nuclear fuel assemblies, aeroderivative unit contracts, military development contractsand locomotive production contracts, we recognize sales as we complete major contract-specified deliverables, most often when customers receive title to thegoods or accept the services as performed. For larger oil drilling equipment projects and long-term construction projects, we recognize sales based on ourprogress toward contract completion measured by actual costs incurred in relation to our estimate of total expected costs. We measure long-term contractrevenues by applying our contract-specific estimated margin rates to incurred costs. We routinely update our estimates of future costs for agreements in processand report any cumulative effects of such adjustments in current operations. We provide for any loss that we expect to incur on these agreements when that lossis probable.
We recognize revenue upon delivery for sales of aircraft engines and military propulsion equipment. Delivery of commercial engines and non-U.S. militaryequipment occurs on shipment; delivery of military propulsion equipment sold to the U.S. government or agencies thereof occurs upon receipt of a MaterialInspection and Receiving Report, DD Form 250 or Memorandum of Shipment. Commercial aircraft engines are complex equipment manufactured to customerorder under a variety of sometimes complex, long-term agreements. We measure sales of commercial aircraft engines by applying our contract-specificestimated margin rates to incurred costs. We routinely update our estimates of future revenues and costs for commercial aircraft engine agreements in processand report any cumulative effects of such adjustments in current operations. Significant components of our revenue and cost estimates include priceconcessions and performance-related guarantees as well as material, labor and overhead costs. We measure revenue for military propulsion equipment andspare parts not subject to long-term product services agreements based on the specific contract on a specifically measured output basis. We provide for anyloss that we expect to incur on these agreements when that loss is probable; consistent with industry practice, for commercial aircraft engines, we make suchprovision only if such losses are not recoverable from future highly probable sales of spare parts and services for those engines.
We sell product services under long-term product maintenance or extended warranty agreements in our Aviation, Power, Oil & Gas and Transportationsegments, where costs of performing services are incurred on other than a straight-line basis. We also sell similar long-term product services in our Healthcareand Renewable Energy segments, where such costs generally are expected to be incurred on a straight-line basis. For the Aviation, Power, Oil & Gas andTransportation agreements, we recognize related sales based on the extent of our progress toward completion measured by actual costs incurred in relation tototal expected costs. We routinely update our estimates of future costs for agreements in process and report any cumulative effects of such adjustments incurrent operations. For the Healthcare and Renewable Energy agreements, we recognize revenues on a straight-line basis and expense related costs asincurred. We provide for any loss that we expect to incur on any of these agreements when that loss is probable.
GE CAPITAL REVENUES FROM SERVICES (EARNED INCOME)
We use the interest method to recognize income on loans. Interest on loans includes origination, commitment and other non-refundable fees related to funding(recorded in earned income on the interest method). We stop accruing interest at the earlier of the time at which collection of an account becomes doubtful orthe account becomes 90 days past due. Previously recognized interest income that was accrued but not collected from the borrower is reversed, unless theterms of the loan agreement permit capitalization of accrued interest to the principal balance. Payments received on nonaccrual loans are applied to reduce theprincipal balance of the loan.
We resume accruing interest on nonaccrual, non-restructured commercial loans only when (a) payments are brought current according to the loan's originalterms and (b) future payments are reasonably assured. When we agree to restructured terms with the borrower, we resume accruing interest only when it isreasonably assured that we will recover full contractual payments, and such loans pass underwriting reviews equivalent to those applied to new loans.
We recognize financing lease income on the interest method to produce a level yield on funds not yet recovered. Estimated unguaranteed residual values arebased upon management's best estimates of the value of the leased asset at the end of the lease term. We use various sources of data in determining theseestimates, including information obtained from third parties, which is adjusted for the attributes of the specific asset under lease. Guarantees of residual valuesby unrelated third parties are included within minimum lease payments. Significant assumptions we use in estimating residual values include estimated net cashflows over the remaining lease term, anticipated results of future remarketing, and estimated future component part and scrap metal prices, discounted at anappropriate rate.
GE 2016 FORM 10-K 142

We recognize operating lease income on a straight-line basis over the terms of underlying leases.
BUSINESSES AND ASSETS HELD FOR SALE
Businesses and assets held for sale represent components that meet accounting requirements to be classified as held for sale and are presented as singleasset and liability amounts in our financial statements with a valuation allowance, if necessary, to recognize the net carrying amount at the lower of cost or fairvalue, less cost to sell. Financing receivables that no longer qualify to be presented as held for investment must be classified as assets held for sale andrecognized in our financial statements at the lower of cost or fair value, less cost to sell, with that amount representing a new cost basis at the date of transfer.
The determination of fair value for businesses and assets held for sale involves significant judgments and assumptions. Development of estimates of fair valuesin this circumstance is complex and is dependent upon, among other factors, the nature of the potential sales transaction (for example, asset sale versus sale oflegal entity), composition of assets and/or businesses in the disposal group, the comparability of the disposal group to market transactions, negotiations withthird party purchasers etc. Such factors bear directly on the range of potential fair values and the selection of the best estimates. Key assumptions weredeveloped based on market observable data and, in the absence of such data, internal information that is consistent with what market participants would use ina hypothetical transaction.
We review all businesses and assets held for sale each reporting period to determine whether the existing carrying amounts are fully recoverable in comparisonto estimated fair values.
DEPRECIATION AND AMORTIZATION
The cost of GE manufacturing plant and equipment is generally depreciated on a straight-line basis over its estimated economic life.
The cost of GE Capital equipment leased to others on operating leases is depreciated on a straight-line basis to estimated residual value over the lease term orover the estimated economic life of the equipment.
LOSSES ON FINANCING RECEIVABLES
Our financing receivables portfolio consists of a variety of loans and leases, including both larger-balance, non-homogeneous loans and leases and smaller-balance homogeneous loans and leases. We routinely evaluate our entire portfolio for potential specific credit or collection issues that might indicate animpairment.
Losses on financing receivables are recognized when they are incurred, which requires us to make our best estimate of probable losses inherent in the portfolio.The method for calculating the best estimate of losses depends on the size, type and risk characteristics of the related financing receivable. Such an estimaterequires consideration of historical loss experience, adjusted for current conditions, and judgments about the probable effects of relevant observable data,including present economic conditions such as delinquency rates, financial health of specific customers and market sectors, collateral values, and the presentand expected future levels of interest rates. The underlying assumptions, estimates and assessments we use to provide for losses are updated periodically toreflect our view of current conditions. Changes in such estimates can significantly affect the allowance and provision for losses. It is possible that we willexperience credit losses that are different from our current estimates. Write-offs are deducted from the allowance for losses when we judge the principal to beuncollectible and subsequent recoveries are added to the allowance at the time cash is received on a written-off account.
PARTIAL SALES OF BUSINESS INTERESTS
Gains or losses on sales of affiliate shares where we retain a controlling financial interest are recorded in equity. Gains or losses on sales that result in our lossof a controlling financial interest are recorded in earnings along with remeasurement gains or losses on any investments in the entity that we retained.
GE 2016 FORM 10-K 143

CASH AND EQUIVALENTS
Debt securities and money market instruments with original maturities of three months or less are included in cash equivalents unless designated as available-for-sale and classified as investment securities.
INVESTMENT SECURITIES
We report investments in debt and marketable equity securities, and certain other equity securities, at fair value. See Note 19 for further information on fairvalue. Unrealized gains and losses on available-for-sale investment securities are included in shareowners' equity, net of applicable taxes and otheradjustments.
We regularly review investment securities for impairment using both quantitative and qualitative criteria. For debt securities, if we do not intend to sell thesecurity or it is not more likely than not that we will be required to sell the security before recovery of our amortized cost, we evaluate other qualitative criteria todetermine whether we do not expect to recover the amortized cost basis of the security, such as the financial health of and specific prospects for the issuer,including whether the issuer is in compliance with the terms and covenants of the security. We also evaluate quantitative criteria including determining whetherthere has been an adverse change in expected future cash flows. If we do not expect to recover the entire amortized cost basis of the security, we consider thesecurity to be other-than-temporarily impaired (OTTI), and we record the difference between the security's amortized cost basis and its recoverable amount inearnings and the difference between the security's recoverable amount and fair value in other comprehensive income. If we intend to sell the security or it ismore likely than not we will be required to sell the security before recovery of its amortized cost basis, the security is also considered OTTI and we recognize theentire difference between the security's amortized cost basis and its fair value in earnings. For equity securities, we consider the length of time and magnitude ofthe amount that each security is in an unrealized loss position. If we do not expect to recover the entire amortized cost basis of the security, we consider thesecurity to be other-than-temporarily impaired, and we record the difference between the security's amortized cost basis and its fair value in earnings.
Realized gains and losses are accounted for on the specific identification method. Unrealized gains and losses on investment securities classified as trading andcertain retained interests are included in earnings.
INVENTORIES
All inventories are stated at the lower of cost or realizable values. Cost for a portion of GE U.S. inventories is determined on a last-in, first-out (LIFO) basis. Costof other GE inventories is determined on a first-in, first-out (FIFO) basis. LIFO was used for 34% of GE inventories in both 2016 and 2015.
GOODWILL AND OTHER INTANGIBLE ASSETS
We do not amortize goodwill, but test it at least annually for impairment at the reporting unit level. A reporting unit is the operating segment, or one level belowthat operating segment (the component level) if discrete financial information is prepared and regularly reviewed by segment management. However,components are aggregated as a single reporting unit if they have similar economic characteristics. We recognize an impairment charge if the carrying amountof a reporting unit exceeds its fair value and the carrying amount of the reporting unit's goodwill exceeds the implied fair value of that goodwill. We use a marketapproach, when available and appropriate, or the income approach, or a combination of both to establish fair values. When a portion of a reporting unit isdisposed, goodwill is allocated to the gain or loss on disposition based on the relative fair values of the business or businesses disposed and the portion of thereporting unit that will be retained.
We amortize the cost of other intangibles over their estimated useful lives unless such lives are deemed indefinite. The cost of intangible assets is generallyamortized on a straight-line basis over the asset's estimated economic life, except that individually significant customer-related intangible assets are amortized inrelation to total related sales. Amortizable intangible assets are reviewed for impairment whenever events or changes in circumstances indicate that the relatedcarrying amounts may not be recoverable. In these circumstances, they are tested for impairment based on undiscounted cash flows and, if impaired, writtendown to fair value based on either discounted cash flows or appraised values. Intangible assets with indefinite lives are tested annually for impairment andwritten down to fair value as required.
GE 2016 FORM 10-K 144

INVESTMENT CONTRACTS, INSURANCE LIABILITIES AND INSURANCE ANNUITY BENEFITS
Our run-off insurance activities include providing insurance and reinsurance for life and health risks and providing certain annuity products. Two primary producttypes are provided: traditional insurance contracts and investment contracts. Insurance contracts are contracts with significant mortality and/or morbidity risks,while investment contracts are contracts without such risks.
For short-duration insurance contracts, including accident and health insurance, we report premiums as earned income over the terms of the relatedagreements, generally on a pro-rata basis. For traditional long-duration insurance contracts, including long-term care, term, whole life and annuities payable forthe life of the annuitant, we report premiums as earned income when due.
Premiums received on investment contracts (including annuities without significant mortality risk) are not reported as revenues but rather as deposit liabilities.We recognize revenues for charges and assessments on these contracts, mostly for mortality, contract initiation, administration and surrender. Amounts creditedto policyholder accounts are charged to expense.
Liabilities for traditional long-duration insurance contracts represent the present value of such benefits less the present value of future net premiums based onmortality, morbidity, interest and other assumptions at the time the policies were issued or acquired. Liabilities for investment contracts equal the account value,that is, the amount that accrues to the benefit of the contract or policyholder including credited interest and assessments through the financial statement date.
Liabilities for unpaid claims and estimated claim settlement expenses represent our best estimate of the ultimate obligations for reported and incurred-but-not-reported claims and the related estimated claim settlement expenses. Liabilities for unpaid claims and estimated claim settlement expenses are continuallyreviewed and adjusted through current operations.
FAIR VALUE MEASUREMENTS
The following sections describe the valuation methodologies we use to measure financial and non-financial instruments accounted for at fair value includingcertain assets within our pension plans and retiree benefit plans.
For financial assets and liabilities measured at fair value on a recurring basis, fair value is the price we would receive to sell an asset or pay to transfer a liabilityin an orderly transaction with a market participant at the measurement date. In the absence of active markets for the identical assets or liabilities, suchmeasurements involve developing assumptions based on market observable data and, in the absence of such data, internal information that is consistent withwhat market participants would use in a hypothetical transaction that occurs at the measurement date.
Observable inputs reflect market data obtained from independent sources, while unobservable inputs reflect our market assumptions. Preference is given toobservable inputs. These two types of inputs create the following fair value hierarchy:
Level 1 – Quoted prices for identical instruments in active markets.Level 2 – Quoted prices for similar instruments in active markets; quoted prices for identical or similar instruments in markets that are not active; and
model-derived valuations whose inputs are observable or whose significant value drivers are observable.Level 3 – Significant inputs to the valuation model are unobservable.
We maintain policies and procedures to value instruments using the best and most relevant data available. In addition, we have risk management teams thatreview valuation, including independent price validation for certain instruments. With regard to Level 3 valuations (including instruments valued by third parties),we perform a variety of procedures to assess the reasonableness of the valuations. Such reviews include an evaluation of instruments whose fair value changeexceeds predefined thresholds (and/or does not change) and consider the current interest rate, currency and credit environment, as well as other publisheddata, such as rating agency market reports and current appraisals. These reviews are performed within each business by the asset and risk managers. Adetailed review of methodologies and assumptions is performed by individuals independent of the business for individual measurements with a fair valueexceeding predefined thresholds. This detailed review may include the use of a third-party valuation firm.
GE 2016 FORM 10-K 145

RECURRING FAIR VALUE MEASUREMENTS
The following sections describe the valuation methodologies we use to measure different financial instruments at fair value on a recurring basis.
Investments in Debt and Equity Securities. When available, we use quoted market prices to determine the fair value of investment securities, and they areincluded in Level 1. Level 1 securities primarily include publicly traded equity securities.
For large numbers of investment securities for which market prices are observable for identical or similar investment securities but not readily accessible foreach of those investments individually (that is, it is difficult to obtain pricing information for each individual investment security at the measurement date), weobtain pricing information from an independent pricing vendor. The pricing vendor uses various pricing models for each asset class that are consistent with whatother market participants would use. The inputs and assumptions to the model of the pricing vendor are derived from market observable sources including:benchmark yields, reported trades, broker/dealer quotes, issuer spreads, benchmark securities, bids, offers, and other market-related data. Since many fixedincome securities do not trade on a daily basis, the methodology of the pricing vendor uses available information as applicable such as benchmark curves,benchmarking of like securities, sector groupings, and matrix pricing. The pricing vendor considers available market observable inputs in determining theevaluation for a security. Thus, certain securities may not be priced using quoted prices, but rather determined from market observable information. Theseinvestments are included in Level 2 and primarily comprise our portfolio of corporate fixed income, and government, mortgage and asset-backed securities. Ininfrequent circumstances, our pricing vendors may provide us with valuations that are based on significant unobservable inputs, and in those circumstances weclassify the investment securities in Level 3.
Annually, we conduct reviews of our primary pricing vendor to validate that the inputs used in that vendor's pricing process are deemed to be market observableas defined in the standard. While we are not provided access to proprietary models of the vendor, our reviews have included on-site walk-throughs of the pricingprocess, methodologies and control procedures for each asset class and level for which prices are provided. Our reviews also include an examination of theunderlying inputs and assumptions for a sample of individual securities across asset classes, credit rating levels and various durations. In addition, the pricingvendor has an established challenge process in place for all security valuations, which facilitates identification and resolution of potentially erroneous prices. Webelieve that the prices received from our pricing vendor are representative of prices that would be received to sell the assets at the measurement date (exitprices) and are classified appropriately in the hierarchy.
We use non-binding broker quotes and other third-party pricing services as our primary basis for valuation when there is limited, or no, relevant market activityfor a specific instrument or for other instruments that share similar characteristics. We have not adjusted the prices we have obtained. Investment securitiespriced using non-binding broker quotes and other third-party pricing services are included in Level 3. As is the case with our primary pricing vendor, third-partybrokers and other third-party pricing services do not provide access to their proprietary valuation models, inputs and assumptions. Accordingly, our riskmanagement personnel conduct reviews of vendors, as applicable, similar to the reviews performed of our primary pricing vendor. In addition, we conductinternal reviews of pricing for all such investment securities quarterly to ensure reasonableness of valuations used in our financial statements. These reviews aredesigned to identify prices that appear stale, those that have changed significantly from prior valuations, and other anomalies that may indicate that a price maynot be accurate. Based on the information available, we believe that the fair values provided by the brokers and other third-party pricing services arerepresentative of prices that would be received to sell the assets at the measurement date (exit prices).
Derivatives. We use closing prices for derivatives included in Level 1, which are traded either on exchanges or liquid over-the-counter markets.
The majority of our derivatives are valued using internal models. The models maximize the use of market observable inputs including interest rate curves andboth forward and spot prices for currencies and commodities. Derivative assets and liabilities included in Level 2 primarily represent interest rate swaps, cross-currency swaps and foreign currency and commodity forward and option contracts.
Derivative assets and liabilities included in Level 3 primarily represent equity derivatives and interest rate products that contain embedded optionality orprepayment features.
GE 2016 FORM 10-K 146

NON-RECURRING FAIR VALUE MEASUREMENTS
Certain assets are measured at fair value on a non-recurring basis. These assets are not measured at fair value on an ongoing basis, but are subject to fairvalue adjustments only in certain circumstances. These assets can include loans and long-lived assets that have been reduced to fair value when they are heldfor sale, impaired loans that have been reduced based on the fair value of the underlying collateral, cost and equity method investments and long-lived assetsthat are written down to fair value when they are impaired and the remeasurement of retained investments in formerly consolidated subsidiaries upon a changein control that results in deconsolidation of a subsidiary, if we sell a controlling interest and retain a noncontrolling stake in the entity. Assets that are writtendown to fair value when impaired and retained investments are not subsequently adjusted to fair value unless further impairment occurs.
The following sections describe the valuation methodologies we use to measure financial and non-financial instruments accounted for at fair value on a non-recurring basis and for certain assets within our pension plans and retiree benefit plans at each reporting period, as applicable.
Financing Receivables and Loans Held for Sale. When available, we use observable market data, including pricing on recent closed market transactions, tovalue loans that are included in Level 2. When this data is unobservable, we use valuation methodologies using current market interest rate data adjusted forinherent credit risk, and such loans are included in Level 3. When appropriate, loans may be valued using collateral values (see Long-Lived Assets below).
Cost and Equity Method Investments. Cost and equity method investments are valued using market observable data such as quoted prices when available.When market observable data is unavailable, investments are valued using a discounted cash flow model, comparative market multiples or a combination ofboth approaches as appropriate and other third-party pricing sources. These investments are generally included in Level 3.
Investments in private equity, real estate and collective funds held within our pension plans, are generally valued using the net asset value (NAV) per share as apractical expedient for fair value provided certain criteria are met. The NAVs are determined based on the fair values of the underlying investments in the funds.On January 1, 2016, we adopted guidance whereby investments that are measured at fair value using the NAV practical expedient are no longer classified in thefair value hierarchy.
Long-lived Assets . Fair values of long-lived assets, including aircraft, are primarily derived internally and are based on observed sales transactions for similarassets. In other instances, for example, collateral types for which we do not have comparable observed sales transaction data, collateral values are developedinternally and corroborated by external appraisal information. Adjustments to third-party valuations may be performed in circumstances where marketcomparables are not specific to the attributes of the specific collateral or appraisal information may not be reflective of current market conditions due to thepassage of time and the occurrence of market events since receipt of the information.
Retained Investments in Formerly Consolidated Subsidiaries. Upon a change in control that results in deconsolidation of a subsidiary, the fair valuemeasurement of our retained noncontrolling stake is valued using market observable data such as quoted prices when available, or if not available, an incomeapproach, a market approach, or a combination of both approaches as appropriate. In applying these methodologies, we rely on a number of factors, includingactual operating results, future business plans, economic projections, market observable pricing multiples of similar businesses and comparable transactions,and possible control premium. These investments are generally included in Level 1 or Level 3, as appropriate, determined at the time of the transaction.
ACCOUNTING CHANGES
On September 30, 2016, we adopted ASU 2016-09, ImprovementstoEmployeeShare-BasedPaymentAccounting, which was intended to simplify severalaspects of the accounting for employee share-based payment transactions including the accounting for income taxes, forfeitures, and statutory tax withholdingrequirements, as well as classification in the statement of cash flows.
We adopted the standard on a prospective basis with the effect of adoption reflected for the interim periods after the year beginning January 1, 2016 as requiredby the standard. The primary effects of adoption were the recognition of excess tax benefits in our provision for income taxes rather than paid-in capital and thereclassification of cash flows related to excess tax benefits from a financing activity to an operating activity for the periods beginning January 1, 2016. We willcontinue to estimate the number of awards that are expected to vest in our determination of the related periodic compensation cost.
GE 2016 FORM 10-K 147

As a result of the adoption, our provision for income taxes decreased by $97 million for the nine months ended September 30, 2016, for the excess tax benefitsrelated to share-based payments in its provision for income taxes. Application of the cash flow presentation requirements from January 1, 2016, resulted in anincrease to cash from operating activities and a decrease to cash from financing activities of $137 million for the nine months ended September 30, 2016.
On January 1, 2016, we adopted ASU 2015-16, SimplifyingtheAccountingforMeasurement-PeriodAdjustments, which eliminated the requirement for anacquirer in a business combination to account for measurement-period adjustments retrospectively. See Note 8 for further discussion of the purchaseaccounting effects of recent acquisitions.
On January 1, 2016, we adopted ASU 2015-03, SimplifyingthePresentationofDebtIssuanceCosts, which requires that debt issuance costs related to arecognized debt liability to be presented on the balance sheet as a direct deduction from the debt liability, similar to the presentation of debt premiums anddiscounts. ASU 2015-03 applies retrospectively and does not change the recognition and measurement requirements for debt issuance costs. The adoption ofASU 2015-03 resulted in the reclassification of $674 million of unamortized debt issuance costs related to the Company's borrowings from all other assets toshort-term and long-term borrowings within our consolidated balance sheet as of December 31, 2015.
On January 1, 2016, we adopted ASU 2015-02, AmendmentstotheConsolidationAnalysis. The ASU amended the consolidation guidance for VIEs andgeneral partners' investment in limited partnerships and modified the evaluation of whether limited partnerships and similar legal entities are VIEs or votinginterest entities.
Upon adoption, we deconsolidated three investment funds managed by GE Asset Management (GEAM) that had been accounted for under the guidance priorto the issuance of ASU 2009-17, ImprovementstoFinancialReportingbyEnterprisesInvolvedwithVariableInterestEntities, by virtue of the deferral providedby ASU 2010-10, AmendmentsforCertainInvestmentFunds. We concluded that GEAM's management contracts were no longer variable interests in the threeinvestment funds and therefore continued consolidation was not appropriate. We deconsolidated net assets and noncontrolling interests of $123 million,respectively.
In addition, many of the limited partnerships in which Energy Financial Services invests became VIEs because the limited partners have no participating rights orsubstantive removal rights over the general partners. The general partners continue to control these limited partnerships, however, our disclosed exposure tounconsolidated VIEs in Note 21 increased by $6,110 million as a result.
On January 1, 2014, we adopted ASU 2013-11, PresentationofanUnrecognizedTaxBenefitWhenaNetOperatingLossCarryforward,aSimilarTaxLoss,oraTaxCreditCarryforwardExists. Under the new guidance, an unrecognized tax benefit is required to be presented as a reduction to a deferred tax asset if thedisallowance of the tax position would reduce the available tax loss or tax credit carryforward instead of resulting in a cash tax liability. The ASU appliesprospectively to all unrecognized tax benefits that exist as of the adoption date and reduced both deferred tax assets and income tax liabilities (includingamounts reported in assets and liabilities of discontinued operations) by $1,224 million as of January 1, 2014.
ACCELERATED SHARE REPURCHASE AGREEMENTS
During 2016, we entered into accelerated share repurchase (ASR) agreements to repurchase shares of GE common stock. Under an ASR agreement, theCompany pays a specified amount to a financial institution and receives an initial delivery of shares based on the terms of the agreement. Upon settlement ofthe agreement, the financial institution delivers additional shares, or the Company returns shares, with the final net number of shares calculated based on thevolume-weighted average price of GE common stock over the term of the agreement, less an agreed upon discount. When certain conditions are met, thetransaction is accounted for as an equity transaction and the shares are included in treasury stock when received, at which time there is an immediate reductionin the weighted- average number of common shares used in calculating earnings per share. See Note 15 for additional information.
GE 2016 FORM 10-K 148

NOTE 2. BUSINESSES HELD FOR SALE AND DISCONTINUED OPERATIONS
ASSETS AND LIABILITIES OF BUSINESSES HELD FOR SALE
In the fourth quarter of 2016, we classified our Water business within our Power segment with assets of $1,617 million and liabilities of $656 million, as held forsale. We expect to complete a sale of the business within the next twelve months.
In the third quarter of 2016, we classified a business at Aviation with assets of $601 million and liabilities of $58 million, as held for sale and adjusted the carryingvalue of the business to fair value, which resulted in a $145 million after-tax loss (including a $120 million loss on the planned disposal). In the fourth quarter of2016, we ceased negotiations with the potential buyer due to economic and strategic reasons, and concluded that a sale of the business within the next twelvemonths was no longer probable. As a result, we reclassified the business to held and used and reversed through income approximately $50 million of the after-tax loss recorded in the third quarter of 2016 primarily related to allocated goodwill that is not impaired and retained customer contracts.
On March 30, 2016, we announced an agreement to sell GE Asset Management (GEAM), GE's asset management arm with assets under management ofapproximately $100 billion, to State Street Corporation. On July 1, 2016, we completed the sale for proceeds of $437 million and recognized an after-tax gain of$260 million. During the fourth quarter of 2016, net sale proceeds associated with U.S. pension plans of $330 million were deposited into the GE Pension Trust,increasing trust assets used to pay GE Pension Plan benefits.
On January 15, 2016, we announced the signing of an agreement to sell our Appliances business to Qingdao Haier Co., Ltd. (Haier). On June 6, 2016, wecompleted the sale for proceeds of $5,568 million (including $773 million from sale of receivables originated in our Appliances business and sold from GECapital to Haier) and recognized an after-tax gain of approximately $1,825 million in 2016.
FINANCIAL INFORMATION FOR ASSETS AND LIABILITIES OF BUSINESSES HELD FOR SALE December 31 (In millions) 2016 2015 Assets Current receivables $ 366 $ 79Inventories 211 583Property, plant, and equipment – net 632 1,208Goodwill 212 370Other intangible assets – net 123 162Contract assets 125 -Other 76 416Assets of businesses held for sale $ 1,745 $ 2,818
Liabilities Accounts payable(a) $ 190 $ 503Progress collections and price adjustments accrued 141 -Other current liabilities 133 325Other 192 33Liabilities of businesses held for sale $ 656 $ 861 (a) Included transactions in our industrial businesses that were made on an arms-length basis with GE Capital, consisting primarily of GE Capital services for material
procurement. These intercompany balances included within our held for sale businesses are reported in the GE and GE Capital columns of our financial statements,but are eliminated in deriving our consolidated financial statements.
NBCU
As previously disclosed, Comcast Corporation was obligated to share with us potential tax savings associated with its purchase of our interest in NBCULLC. During the second quarter of 2015, we recognized $450 million of pre-tax income related to the settlement of this obligation.
GE 2016 FORM 10-K 149

DISCONTINUED OPERATIONSDiscontinued operations primarily relate to our financial services businesses as a result of the GE Capital Exit Plan and include our Consumer business, most ofour CLL business, our Real Estate business and our U.S. mortgage business (WMC). All of these operations were previously reported in the Capital segment.Results of operations, financial position and cash flows for these businesses are separately reported as discontinued operations for all periods presented.
We have entered into Transitional Service Agreements (TSA) with and provided certain indemnifications to buyers of GE Capital's assets. Under the TSAs, GECapital provides various services for terms generally between 12 and 24 months and receives a level of cost reimbursement from the buyers. See Note 23 forfurther information about indemnifications.
FINANCIAL INFORMATION FOR DISCONTINUED OPERATIONS (In millions) 2016 2015 2014 Operations Total revenues and other income $ 2,968 $ 23,003 $ 31,136 Earnings (loss) from discontinued operations before income taxes $ (162) $ 887 $ 6,615Benefit (provision) for income taxes(a) 460 (791) (776)Earnings (loss) from discontinued operations, net of taxes $ 298 $ 96 $ 5,839 Disposals Gain (loss) on disposals before income taxes $ (750) $ (6,612) $ 14Benefit (provision) for income taxes(a) (502) (979) 1Gain (loss) on disposals, net of taxes $ (1,252) $ (7,591) $ 15 Earnings (loss) from discontinued operations, net of taxes(b)(c) $ (954) $ (7,495) $ 5,855 (a) GE Capital's total tax benefit (provision) for discontinued operations and disposals included current tax benefit (provision) of $945 million, $(6,834) million and $(925)
million for the years ended December 31, 2016, 2015 and 2014, respectively, including current U.S. Federal tax benefit (provision) of $1,224 million, $(6,245) millionand $80 million for the years ended December 31, 2016, 2015 and 2014, respectively, and deferred tax benefit (provision) of $(988) million, $5,073 million and $154million for the years ended December 31, 2016, 2015 and 2014, respectively.
(b) The sum of GE industrial earnings (loss) from discontinued operations, net of taxes, and GE Capital earnings (loss) from discontinued operations, net of taxes, afteradjusting for earnings (loss) attributable to noncontrolling interests related to discontinued operations, is reported within GE industrial earnings (loss) fromdiscontinued operations, net of taxes, on the Consolidated Statement of Earnings (Loss).
(c) Earnings (loss) from discontinued operations attributable to the Company, before income taxes, was $(911) million, $(6,038) million, and $6,472 million for the yearsended December 31, 2016, 2015, and 2014, respectively.
December 31 (In millions) 2016 2015 Assets Cash and equivalents $ 1,429 $ 20,395Investment securities 2,626 8,478Financing receivables – net - 3,205Other receivables 310 1,221Property, plant and equipment – net 274 7,537Goodwill 67 7,764Other intangible assets - net 5 80Deferred income taxes 487 2,447Financing receivables held for sale 8,547 69,847Valuation allowance on disposal group classified as discontinued operations (726) (6,374)Other 1,797 6,350Assets of discontinued operations $ 14,815 $ 120,951 Liabilities Short-term borrowings $ 3 $ 739Accounts payable 164 2,870Non-recourse borrowings 1,519 3,994Bank deposits 529 25,613Long-term borrowings 25 730All other liabilities 1,652 11,053Deferred income taxes 221 1,437Other 45 52Liabilities of discontinued operations $ 4,158 $ 46,487
GE 2016 FORM 10-K 150

CONSUMER
In connection with the GE Capital Exit Plan, we announced the planned disposition of our Consumer business (including Synchrony Financial) and classified thebusiness as discontinued operations. We closed a vast majority of our Consumer business dispositions (including the split-off of Synchrony Financial) in 2015and 2016.
FINANCIAL INFORMATION FOR CONSUMER (In millions) 2016 2015 2014 Operations Total revenues and other income $ 1,168 $ 11,690 $ 15,023 Interest $ (180) $ (2,081) $ (2,611)Selling, general, and administrative expenses (522) (3,940) (4,572)Cost of services sold - (1) -Provision for losses on financing receivables 1 (5,029) (3,544)Investment contracts, insurance losses and insurance annuity benefits (3) (12) (18)Other costs and expenses (89) (392) (388)Earnings (loss) from discontinued operations, before income taxes 375 236 3,891Benefit (provision) for income taxes (171) (878) (736)Earnings (loss) from discontinued operations, net of taxes $ 204 $ (642) $ 3,155 Disposals Gain (loss) on disposals before income taxes $ 273 $ 2,739 $ -Benefit (provision) for income taxes (607) 363 -Gain (loss) on disposals, net of taxes $ (334) $ 3,102 $ - Earnings (loss) from discontinued operations, net of taxes(a) $ (130) $ 2,460 $ 3,155 (a) Earnings (loss) from discontinued operations attributable to the Company, before income taxes, was $652 million, $2,670 million, and $3,752 million for the years
ended December 31, 2016, 2015, and 2014, respectively.
COMMERCIAL LENDING AND LEASING
In connection with the GE Capital Exit Plan, we announced the planned disposition of most of our CLL business and classified this portion of the business asdiscontinued operations. We closed substantially all of our CLL business dispositions in 2015 and 2016.
FINANCIAL INFORMATION FOR COMMERCIAL LENDING AND LEASING (In millions) 2016 2015 2014 Operations Total revenues and other income $ 1,732 $ 10,580 $ 13,413 Interest $ (518) $ (2,365) $ (3,069)Selling, general and administrative expenses (1,585) (3,576) (3,598)Cost of services sold - (1,735) (3,859)Provision for losses on financing receivables (2) (1,753) (456)Other costs and expenses (89) (127) (135)Earnings (loss) from discontinued operations, before income taxes (463) 1,024 2,296Benefit (provision) for income taxes 319 (186) (487)Earnings (loss) from discontinued operations, net of taxes $ (144) $ 838 $ 1,808 Disposals Gain (loss) on disposals before income taxes $ (971) $ (8,013) $ -Benefit (provision) for income taxes 43 (698) -Gain (loss) on disposals, net of taxes $ (928) $ (8,711) $ - Earnings (loss) from discontinued operations, net of taxes(a) $ (1,072) $ (7,873) $ 1,808 (a) Earnings (loss) from discontinued operations attributable to the Company, before income taxes, was $(1,436) million, $(6,996) million, and $2,279 million for the
years ended December 31, 2016, 2015, and 2014, respectively.
GE 2016 FORM 10-K 151

REAL ESTATE
In connection with the GE Capital Exit Plan, we announced the planned disposition of our Real Estate business and classified the business as discontinuedoperations. We closed substantially all of our Real Estate business dispositions in 2015 and 2016.
FINANCIAL INFORMATION FOR REAL ESTATE (In millions) 2016 2015 2014 Operations Total revenues and other income $ 79 $ 911 $ 2,969 Interest $ (42) $ (457) $ (1,079)Selling, general and administrative (112) (444) (484)Cost of services sold - (5) -Provision for losses on financing receivables - 5 86Other costs and expenses (3) (158) (712)Earnings (loss) from discontinued operations, before income taxes (78) (149) 780Benefit (provision) for income taxes 70 168 224Earnings (loss) from discontinued operations, net of taxes $ (8) $ 19 $ 1,003 Disposals Gain (loss) on disposals before income taxes $ (52) $ (1,338) $ -Benefit (provision) for income taxes 62 (639) -Gain (loss) on disposals, net of taxes $ 10 $ (1,977) $ - Earnings (loss) from discontinued operations, net of taxes(a) $ 2 $ (1,958) $ 1,003 (a) Earnings (loss) from discontinued operations attributable to the Company, before income taxes, was $(130) million, $(1,486) million, and $778 million for the years
ended December 31, 2016, 2015, and 2014, respectively.
GE 2016 FORM 10-K 152

NOTE 3. INVESTMENT SECURITIESSubstantially all of our investment securities are classified as available-for-sale and comprise mainly investment-grade debt securities supporting obligations toannuitants and policyholders in our run-off insurance operations. We do not have any securities classified as held-to-maturity.
2016 2015 Gross Gross Gross Gross Amortized unrealized unrealized Estimated Amortized unrealized unrealized EstimatedDecember 31 (In millions) cost gains losses fair value cost gains losses fair value GE Debt U.S. corporate $ 1 $ - $ - $ 2 $ 2 $ - $ - $ 3 Corporate – non-U.S. - - - - 1 - - 1 U.S. government and federal agency 49 - - 49 49 - - 49Equity 54 34 (1) 86 87 13 (2) 98 104 34 (1) 137 139 14 (2) 151 GE Capital Debt U.S. corporate 20,048 3,081 (85) 23,044 19,971 2,669 (285) 22,355 State and municipal 3,916 412 (92) 4,236 3,910 407 (73) 4,245 Mortgage and asset-backed 2,787 111 (37) 2,861 2,995 157 (35) 3,116 Corporate – non-U.S. 11,917 98 (27) 11,987 759 96 (9) 846 Government – non-U.S. 1,137 127 (2) 1,262 279 136 - 415 U.S. government and federal agency 656 33 (25) 664 623 104 - 727Equity 105 22 (1) 126 112 16 (4) 123 40,565 3,883 (268) 44,180 28,648 3,585 (407) 31,827 Eliminations (4) - - (4) (4) - - (4)Total $ 40,665 $ 3,917 $ (269) $ 44,313 $ 28,783 $ 3,599 $ (409) $ 31,973
Our corporate debt portfolio comprises securities issued by public and private corporations in various industries, mainly in the U.S. Substantially all of ourcorporate debt securities are rated investment grade by the major rating agencies.
Mortgage and asset-backed securities substantially comprises commercial and residential mortgage-backed securities. Substantially all of these securities haveinvestment-grade credit ratings. Our commercial mortgage-backed securities (CMBS) portfolio is collateralized by both diversified pools of mortgages that wereoriginated for securitization (conduit CMBS) and pools of large loans backed by high-quality properties (large loan CMBS). Our residential mortgage-backedsecurities (RMBS) portfolio is collateralized primarily by pools of individual, direct mortgage loans, of which substantially all are in a senior position in the capitalstructure of the deals, not by other structured products such as collateralized debt obligations.
The fair value of investment securities increased to $44,313 million at December 31, 2016, from $31,973 million at December 31, 2015, primarily due to highernet purchases of Corporate – non-U.S. debt securities and higher net unrealized gains in U.S. Corporate.
GE 2016 FORM 10-K 153

ESTIMATED FAIR VALUE AND GROSS UNREALIZED LOSSES OF AVAILABLE-FOR-SALE INVESTMENT SECURITIES In loss position for Less than 12 months 12 months or more Gross Gross Estimated unrealized Estimated unrealized (In millions) fair value(a) losses(a) fair value losses December 31, 2016 Debt U.S. corporate $ 1,692 $ (55) $ 359 $ (30) State and municipal 674 (27) 158 (64) Mortgage and asset-backed 822 (21) 132 (16) Corporate – non-U.S. 5,352 (26) 14 (1) Government - non-U.S. 313 (2) - - U.S. government and federal agency 236 (25) - - Equity 9 (1) - - Total $ 9,098 $ (157) $ 663 $ (111) December 31, 2015 Debt U.S. corporate $ 2,966 $ (218) $ 433 $ (67) State and municipal 494 (20) 155 (53) Mortgage and asset-backed 719 (20) 84 (16) Corporate – non-U.S. 56 (4) 14 (4) Equity 36 (6) - - Total $ 4,273 $ (269) $ 686 $ (140) (a) Includes the estimated fair value of and gross unrealized losses on equity securities held by GE.
Unrealized losses are not indicative of the amount of credit loss that would be recognized and at December 31, 2016 are primarily due to increases in marketyields subsequent to our purchase of the securities. We presently do not intend to sell the vast majority of our debt securities that are in unrealized loss positionsand believe that it is not more likely than not that we will be required to sell the vast majority of these securities before anticipated recovery of our amortized cost.The methodologies and significant inputs used to measure the amount of credit loss for our investment securities during 2016 have not changed.
PRE-TAX, OTHER-THAN-TEMPORARY IMPAIRMENTS ON INVESTMENT SECURITIES (In millions) 2016 2015 2014 Total recognized $ 31 $ 64 $ 316Recognized in AOCI - - (4)Recognized in earnings(a) $ 31 $ 64 $ 312 (a) Included equity securities of $11 million, $5 million and $219 million in 2016, 2015 and 2014, respectively.
CONTRACTUAL MATURITIES OF INVESTMENT IN AVAILABLE-FOR-SALE DEBT SECURITIES(EXCLUDING MORTGAGE AND ASSET-BACKED SECURITIES) Amortized Estimated(In millions) cost fair value Due Within one year $ 7,139 $ 7,148 After one year through five years 7,947 8,124 After five years through ten years 4,996 5,410 After ten years 17,641 20,562
We expect actual maturities to differ from contractual maturities because borrowers have the right to call or prepay certain obligations.
GE 2016 FORM 10-K 154

GROSS REALIZED GAINS AND LOSSES ON AVAILABLE-FOR-SALE INVESTMENT SECURITIES (In millions) 2016 2015 2014 GE Gains $ 11 $ 7 $ 3Losses, including impairments (12) (36) (218)Net (2) (29) (215) GE Capital Gains 50 121 87Losses, including impairments (43) (51) (104)Net 7 70 (16)Total $ 6 $ 41 $ (231) Although we generally do not have the intent to sell any specific securities at the end of the period, in the ordinary course of managing our investment securitiesportfolio, we may sell securities prior to their maturities for a variety of reasons, including diversification, credit quality, yield and liquidity requirements and thefunding of claims and obligations to policyholders.
Proceeds from investment securities sales and early redemptions by issuers totaled $1,718 million, $5,746 million, and $1,898 million for the years endedDecember 31, 2016, 2015, and 2014, respectively. In 2016 and 2015, investment securities sales were principally of U.S. government and federal agency andmortgage and asset-backed securities.
NOTE 4. CURRENT RECEIVABLES
Consolidated(a)(b) GE(c)December 31 (In millions) 2016 2015 2016 2015 Power $ 7,688 $ 6,675 $ 3,632 $ 4,377Renewable Energy 1,903 2,336 1,293 1,418Oil & Gas 4,259 4,958 2,478 2,764Energy Connections & Lighting 2,716 4,432 1,675 2,173Aviation 3,542 4,133 1,731 1,876Healthcare 3,996 4,022 2,068 1,943Transportation 377 609 186 193Corporate items and eliminations 454 372 499 464 24,935 27,538 13,562 15,209Less Allowance for Losses(d) (858) (515) (847) (502)Total $ 24,076 $ 27,022 $ 12,715 $ 14,707 (a) Included GE industrial customer receivables sold to a GE Capital affiliate and reported as financing receivables by GE Capital of $12,304 million and $13,041 million
at December 31, 2016 and 2015, respectively. The December 31, 2016 total included a deferred purchase price receivable of $483 million from the refinancing of ourReceivables Facility described in Note 22.
(b) In order to manage credit exposure, the Company sells additional current receivables to third parties outside the Receivables Facility described in Note 22. Inconnection with certain of these sales, we provide servicing activities and limited recourse to the purchasers. At December 31, 2016 and 2015, GE serviced $2,962million and $2,167 million, respectively, of these receivables that remain outstanding. Of these balances, $458 million and $378 million at December 31, 2016 and2015, respectively, were current receivables serviced by GE Capital that GE sold directly to third-parties. At December 31, 2016 and 2015, our maximum exposure toloss under the limited recourse arrangements is $215 million and $154 million, respectively.
(c) GE current receivables of $299 million and $251 million at December 31, 2016 and 2015, respectively, arose from sales, principally of Aviation goods and services,on open account to various agencies of the U.S. government. As a percentage of GE revenues, approximately 3% of GE sales of goods and services were to theU.S. government in 2016, compared with 4% in 2015 and 3% in 2014.
(d) The 2016 increase in allowance for losses is primarily due to Alstom purchase price adjustments of $263 million.
GE current receivables balances at December 31, 2016 and 2015, before allowance for losses, included $8,927 million and $10,535 million, respectively, fromsales of goods and services to customers . The remainder of the balances primarily relates to supplier advances, revenue sharing programs and other non-income based tax receivables.
GE 2016 FORM 10-K 155

NOTE 5. INVENTORIES December 31 (In millions) 2016 2015 Raw materials and work in process $ 12,636 $ 13,415Finished goods 8,798 8,265Unbilled shipments 536 628 21,971 22,308Revaluation to LIFO 383 207Total inventories $ 22,354 $ 22,515
NOTE 6. GE CAPITAL FINANCING RECEIVABLES AND ALLOWANCE FOR LOSSES ON FINANCINGRECEIVABLESFINANCING RECEIVABLES – NET December 31 (In millions) 2016 2015 Loans, net of deferred income $ 21,101 $ 20,115Investment in financing leases, net of deferred income 4,998 4,969 26,099 25,084Allowance for losses (58) (81)Financing receivables – net $ 26,041 $ 25,003
NET INVESTMENT IN FINANCING LEASES Total financing leases Direct financing leases(a) Leveraged leases(b)December 31 (In millions) 2016 2015 2016 2015 2016 2015 Total minimum lease payments receivable $ 5,466 $ 5,901 $ 3,274 $ 3,251 $ 2,191 $ 2,649 Less principal and interest on third-party non-recourse debt (1,053) (1,482) - - (1,053) (1,482)Net rentals receivable 4,412 4,419 3,274 3,251 1,138 1,167Estimated unguaranteed residual value of leased assets 1,985 2,057 927 928 1,058 1,129Less deferred income (1,400) (1,507) (909) (913) (491) (593)Investment in financing leases, net of deferred income(c) $ 4,998 $ 4,969 $ 3,292 $ 3,266 $ 1,706 $ 1,703 (a) Included $30 million and $24 million of initial direct costs on direct financing leases at December 31, 2016 and 2015, respectively.(b) Included pre-tax income of $74 million and $61 million and income tax of $28 million and $23 million during 2016 and 2015, respectively. Net investment credits
recognized on leveraged leases during 2016 and 2015 were insignificant.(c) See Note 14 for deferred tax amounts related to financing leases.
CONTRACTUAL MATURITIES Total Net rentals (In millions) loans receivable Due in 2017 $ 12,853 $ 851 2018 1,718 845 2019 2,327 685 2020 1,149 528 2021 1,114 398 2022 and later 1,940 1,106 Total $ 21,101 $ 4,412 We expect actual maturities to differ from contractual maturities.
GE 2016 FORM 10-K 156

We manage our financing receivables portfolio using delinquency and nonaccrual data as key performance indicators. At December 31, 2016, $811 million(3.1%), $407 million (1.6%) and $322 million (1.2%) of financing receivables were over 30 days past due, over 90 days past due and on nonaccrual,respectively. Of the $322 million of nonaccrual financing receivables at December 31, 2016, the vast majority are secured by collateral and $68 million arecurrently paying in accordance with the contractual terms. At December 31, 2015, $622 million (2.5%), $201 million (0.8%) and $256 million (1.0%) of financingreceivables were over 30 days past due, over 90 days past due and on nonaccrual, respectively.
The recorded investment in impaired loans at December 31, 2016 and December 31, 2015 was $262 million and $175 million, respectively. The method used tomeasure impairment for these loans is primarily based on collateral value. At December 31, 2016, troubled debt restructurings included in impaired loans were$176 million.
NOTE 7. PROPERTY, PLANT AND EQUIPMENT
Depreciable lives-new Original Cost Net Carrying ValueDecember 31 (Dollars in millions) (in years) 2016 2015 2016 2015 GE Land and improvements 8(a) $ 932 $ 888 $ 910 $ 870 Buildings, structures and related equipment 8-40 9,680 10,050 6,016 5,440 Machinery and equipment 4-20 24,596 24,515 9,369 9,986 Leasehold costs and manufacturing plant under construction 1-10 3,407 4,359 2,809 3,849
38,615 39,812 19,103 20,145
GE Capital(b) Land and improvements, buildings, structures and related equipment 1-10(a) 238 267 68 101 Equipment leased to others Aircraft(c) 15-20 47,360 50,339 31,786 34,316 All other 3-35 587 543 371 364
48,185 51,149 32,225 34,781Eliminations (925) (939) (809) (831)Total $ 85,875 $ 90,022 $ 50,518 $ 54,095
(a) Depreciable lives exclude land.(b) Included $1,457 million and $1,024 million of original cost of assets leased to GE with accumulated amortization of $147 million and $83 million at December 31,
2016 and 2015, respectively.(c) The GECAS business of GE Capital recognized impairment losses of $99 million and $168 million in 2016 and 2015, respectively. These losses are recorded in the
caption "Cost of services sold" in the Statement of Earnings to reflect adjustments to fair value based on management's best estimates, which are benchmarkedagainst third-party appraiser current market values for aircraft of similar type and age.
Consolidated depreciation and amortization related to property, plant and equipment was $4,997 million, $4,847 million and $4,953 million in 2016, 2015 and2014, respectively. Amortization of GE Capital equipment leased to others was $2,231 million, $2,266 million and $2,386 million in 2016, 2015 and 2014,respectively.
Noncancellable future rentals due from customers for equipment on operating leases at December 31, 2016, are as follows:
(In millions) Due in 2017 $ 3,684 2018 3,307 2019 2,912 2020 2,575 2021 2,144 2022 and later 6,338Total $ 20,961
GE 2016 FORM 10-K 157

NOTE 8. ACQUISITIONS, GOODWILL AND OTHER INTANGIBLE ASSETSACQUISITIONS
In the fourth quarter of 2016, we acquired two European 3-D printing companies in our Aviation segment. On November 17, 2016, we acquired an additional61.9% of the shares of Arcam AB, a Swedish company specializing in electron beam melting systems, for $422 million to bring our total ownership stake to76.2%. Upon gaining control, we fair valued the business including our previously held 14.3% equity interest. The preliminary purchase price allocation resultedin goodwill of approximately of $495 million and amortizable intangible assets of approximately $95 million. On December 8, 2016, we acquired 75% of ConceptLaser GmbH, a German company specializing in powder -bed based laser metal printing, for $573 million. GE holds a call option on the 25% noncontrollinginterest that is exercisable for a one-year period beginning on the third anniversary of the acquisition date. The non-controlling interest holds a put option that isexercisable for a one-year period beginning on the fifth anniversary of the closing date. The preliminary purchase price allocation resulted in goodwill ofapproximately of $550 million and amortizable intangible assets of approximately $170 million. The allocation of purchase prices will be finalized uponcompletion of post-closing procedures.
On November 9, 2016, we acquired the remaining 89% of Bit Stew, a software company specializing in gathering data from connected devices in complexindustrial systems to help companies plan predictive maintenance and optimize productivity, for $129 million. Upon gaining control, we fair valued the businessincluding our previously held 11% equity interest. The preliminary purchase price allocation resulted in goodwill of approximately $110 million and amortizableintangible assets of approximately $50 million. The allocation of the purchase price will be finalized upon completion of post-closing procedures.
On October 31, 2016, we announced an agreement with Baker Hughes Incorporated (Baker Hughes) to combine GE's Oil & Gas business and Baker Hughes tocreate a new company. The transaction will be executed using a partnership structure, pursuant to which GE Oil & Gas and Baker Hughes will each contributetheir operating assets to a newly formed partnership. GE will have a 62.5% interest in this partnership and existing Baker Hughes shareholders will have a37.5% interest through a newly NYSE listed corporation. Baker Hughes shareholders will also receive a special one-time cash dividend of $17.50 per share atclosing. GE will contribute $7.4 billon to the new partnership to fund the cash dividend to existing Baker Hughes shareholders. The transaction is subject to theapproval of Baker Hughes shareholders, regulatory approvals and other customary closing conditions .
On September 14, 2016, we acquired the remaining 74% of the software developer Meridium Inc. for $370 million. Upon gaining control, we fair valued thebusiness including our previously held 26% equity interest. The preliminary purchase price allocation resulted in goodwill of approximately $350 million andamortizable intangible assets of approximately $165 million. The allocation of the purchase price will be finalized upon completion of post-closing procedures.
On May 10, 2016, we announced the pending acquisition of the heat recovery steam generator (HRSG) business from Doosan Engineering & Construction(Doosan) for $250 million. On August 16, 2016, we acquired 80% of the HRSG business for approximately $220 million. The remaining 20% of the HRSGbusiness continues to be subject to local regulatory requirements and we expect a staggered close beginning in the first quarter of 2017 through the first half of2017. The preliminary purchase price allocation resulted in goodwill of approximately $170 million and amortizable intangible assets of approximately $35million. The allocation of the purchase price will be finalized upon completion of post-closing procedures.
On January 30, 2015, we acquired Milestone Aviation Group (Milestone Aviation), a helicopter leasing business, for approximately $1,750 million, which isincluded in our Capital segment. The purchase price allocation resulted in goodwill of approximately $730 million and amortizable intangible assets ofapproximately $345 million.
On November 2, 2015, we acquired the Thermal, Renewables and Grid businesses from Alstom. The purchase price was €9,200 million ($10,124 million), net ofcash acquired of approximately €1,600 million ($1,765 million). In order to obtain approval by the European Commission and the Department of Justice, GEpledged to sell certain of Alstom's gas-turbine assets and its Power Systems Manufacturing subsidiary to Ansaldo Energia SpA (Ansaldo) after the close of thetransaction for approximately €120 million. The purchase price will be paid by Ansaldo over a period of five years. The transaction closed on February 25, 2016.
We formed three consolidated joint ventures with Alstom in grid technology, renewable energy, and global nuclear and French steam power. In addition, GEcontributed its Digital Energy business to the grid technology joint venture.
GE 2016 FORM 10-K 158

Alstom holds redemption rights with respect to its interest in the grid technology and renewable energy joint ventures, which, if exercised, would require us topurchase all of their interest during September 2018 or September 2019. Alstom also holds similar redemption rights for the global nuclear and French steampower joint venture that are exercisable during the first full calendar quarter immediately following the fifth or sixth anniversary of the acquisition date. Theredemption price would generally be equal to Alstom's initial investment plus annual accretion of 3% for the grid technology and renewable energy joint venturesand plus annual accretion of 2% for the nuclear and French steam power joint venture, with potential upside sharing based on an EBITDA multiple. Alstom alsoholds additional redemption rights in other limited circumstances as well as a call option to require GE to sell all of its interests in the renewable energy jointventure at the higher of fair value or Alstom's initial investment plus annual accretion of 3% during the month of May in the years 2016 through 2019 and alsoupon a decision to IPO the joint venture.
GE holds a call option on Alstom's interest in the global nuclear and French steam power joint venture at the same amount as Alstom's redemption price in theevent that Alstom exercises its put option in the grid technology or renewable energy joint ventures. GE also has call options on Alstom's interest in the threejoint ventures in other limited circumstances. In addition, the French Government holds a preferred interest in the global nuclear and French steam power jointventure, giving it certain protective rights.
The acquisition and alliances with Alstom will have a significant effect on our Power, Energy Connections and Renewable Energy segments, and to a lesserextent our Oil & Gas segment. The financial impact of acquired businesses on individual segments will be affected by a number of variables, including operatingperformance, purchase accounting effects and realized synergies. In addition, due to the amount of time that elapsed between signing and closing, thecommercial operations of the businesses were negatively affected primarily as a result of uncertainty among Alstom customers regarding the execution of thetransaction. This affected the overall valuation of the acquired businesses at the time of close and, accordingly, is reflected among the initial and adjustedamounts assigned to the assets and liabilities recorded in purchase accounting.
ALSTOM ACQUISITION ACCOUNTING UPDATE
The total consideration for the acquired businesses, at the time of close in November 2015 included our purchase price of $10,124 million (net of cash acquired)and a preliminary valuation of noncontrolling interests, of approximately $3,600 million for a total of approximately $13,700 million. In the fourth quarter of 2015,the preliminary allocation of purchase price resulted in goodwill, intangible assets and unfavorable customer contract liabilities of approximately $13,500 million,$5,200 million, and $1,100 million respectively. The amount of goodwill recognized compared with identifiable intangible assets is affected by estimated GE-specific synergies, which are not permitted to be included in the measurement of identifiable intangibles. Such synergies include additional revenue from cross-selling complementary product lines. The preliminary fair value of the associated noncontrolling interests consisted of approximately $2,900 million for Alstom'sredeemable noncontrolling interests in the three joint ventures (presented separately from total equity in the consolidated statement of financial position) and$700 million for all other noncontrolling interests.
Through the fourth quarter of 2016, we adjusted the preliminary allocation of purchase price, which has now resulted in goodwill, intangible assets, andunfavorable customer contract liabilities, of $17,304 million, $4,370 million, and $2,720 million, respectively as of the acquisition date. These adjustments, whichare necessary to reflect acquired assets and liabilities of the acquired businesses at fair value, reflected revisions in 2016, primarily related to cash flow andother valuation assumptions for customer contracts, increases to legal reserves, and other fair value adjustments related to acquired assets and liabilities. Theapproximate amounts of significant purchase accounting adjustments recorded since the date of acquisition include a reduction in the book value of assets soldto Ansaldo of $405 million, adjustments to the fair value of derivative contracts of $335 million, decreases in inventory balances of $130 million, increases tolegal reserves of $990 million, a reduction in the book value of aged accounts receivable of $175 million and other project related costs such as warrantyprovisions and liquidating damages of $665 million. In addition, the fair value of all other noncontrolling interests decreased by $55 million.
See Note 23 for further information about legal reserves for Alstom legacy matters.
In addition to purchase price allocation based on the fair value of acquired assets and liabilities, other adjustments were necessary to reflect differencesbetween IFRS and GAAP, as applied to differences in facts and circumstances between those businesses as part of Alstom and as part of GE post acquisition.The table below presents consideration paid, amounts of assets acquired and liabilities assumed as of the acquisition date, inclusive of the purchase accountingadjustments and IFRS to GAAP adjustments recorded as of December 31, 2016, and the fair value of the non-controlling interest .
GE 2016 FORM 10-K 159

ASSETS ACQUIRED AND LIABILITIES ASSUMED AT THE ACQUISITION DATE Balance at(In millions) December 31, 2016 Assets Cash and equivalents $ 1,766Current receivables 4,064Inventories 4,663Property, plant and equipment 2,782Goodwill 17,304Other intangible assets 4,370All other assets, net(a) 3,673Total Assets $ 38,622 Liabilities Accounts payable $ 1,908Progress collections 2,919Accrued contract liabilities 10,714All other liabilities(b) 7,658Total Liabilities $ 23,199 Redeemable noncontrolling interests 2,921 Noncontrolling interest 612 Total purchase price 11,890Less cash acquired 1,766Total purchase price, net of cash acquired $ 10,124 (a) Included approximately $156 million of net deferred tax assets, including approximately $52 million of non-U.S. loss carry forwards net of valuation allowances and
offsetting liabilities for unrecognized benefits. Also included approximately $76 million of indemnification receivables for liabilities for unrecognized income taxbenefits and other tax uncertainties.
(b) Included approximately $859 million of liabilities for unrecognized income tax benefits and other uncertain taxes and approximately $772 million of pension and otheremployee related costs .
GOODWILL
CHANGES IN GOODWILL BALANCES 2016 2015 Dispositions, Dispositions, currency currency Balance at exchange Balance at Balance at exchange Balance at(In millions) January 1 Acquisitions and other December 31 January 1 Acquisitions and other December 31 Power $ 16,736 $ 3,347 $ (268) $ 19,816 $ 7,769 $ 9,582 $ (615) $ 16,736Renewable Energy 2,580 (46) (27) 2,507 984 1,631 (35) 2,580Oil & Gas 10,594 - (231) 10,363 10,572 22 - 10,594Aviation 8,567 1,045 (158) 9,455 8,952 - (385) 8,567Healthcare 17,353 191 (120) 17,424 17,532 11 (190) 17,353Transportation 851 41 6 899 887 - (36) 851Energy Connections & Lighting 6,441 846 (420) 6,868 4,796 2,314 (669) 6,441Capital 2,370 - (1) 2,368 1,680 728 (37) 2,370Corporate 34 487 218 739 34 - - 34Total $ 65,526 $ 5,911 $ (1,000) $ 70,438 $ 53,207 $ 14,287 $ (1,968) $ 65,526 Goodwill balances increased by $4,912 million in 2016, primarily as a result of the Alstom acquisition purchase accounting adjustments and other acquisitions,partially offset by currency exchange effects of a stronger U.S. dollar against other major currencies.
Goodwill balances increased $12,319 million in 2015, primarily as a result of the Alstom and Milestone Aviation acquisitions, partially offset by currencyexchange effects of the stronger U.S. dollar and disposals.
GE 2016 FORM 10-K 160

We test goodwill for impairment annually in the third quarter of each year using data as of July 1 of that year. The impairment test consists of two steps: in stepone, the carrying value of the reporting unit is compared with its fair value; in step two, which is applied when the carrying value is more than its fair value, theamount of goodwill impairment, if any, is derived by deducting the fair value of the reporting unit's assets and liabilities from the fair value of its equity, andcomparing that amount with the carrying amount of goodwill. We determined fair values for each of the reporting units using the market approach, whenavailable and appropriate, or the income approach, or a combination of both. We assess the valuation methodology based upon the relevance and availability ofthe data at the time we perform the valuation. If multiple valuation methodologies are used, the results are weighted appropriately.
Valuations using the market approach are derived from metrics of publicly traded companies or historically completed transactions of comparable businesses.The selection of comparable businesses is based on the markets in which the reporting units operate giving consideration to risk profiles, size, geography, anddiversity of products and services. A market approach is limited to reporting units for which there are publicly traded companies that have the characteristicssimilar to our businesses.
Under the income approach, fair value is determined based on the present value of estimated future cash flows, discounted at an appropriate risk-adjusted rate.We use our internal forecasts to estimate future cash flows and include an estimate of long-term future growth rates based on our most recent views of the long-term outlook for each business. Actual results may differ from those assumed in our forecasts. We derive our discount rates using a capital asset pricing modeland analyzing published rates for industries relevant to our reporting units to estimate the cost of equity financing. We use discount rates that are commensuratewith the risks and uncertainty inherent in the respective businesses and in our internally developed forecasts. Discount rates used in our reporting unit valuationsranged from 9.5% to 16.5%.
During the third quarter of 2016, we performed our annual impairment test of goodwill for all of our reporting units. Based on the results of our step one testing,the fair values of each of the GE reporting units exceeded their carrying values; therefore, the second step of the impairment test was not required to beperformed for any of our reporting units and no goodwill impairment was recognized.
While all of our reporting units passed step one of our annual impairment testing in 2016, we identified four reporting units for which the fair value was notsubstantially in excess of its carrying value. Due to the continuation of depressed oil and natural gas prices, the fair value of our Energy Financial Servicesreporting unit, within our Capital operating segment, continues to be impacted and was in excess of its carrying value by approximately 2%. Based on the resultsof the step one testing, we further substantiated our Energy Financial Services goodwill balance by performing the second step analysis in which the implied fairvalue of goodwill exceeded its carrying value by approximately $670 million. We continued to monitor the volatility in the oil and gas environment during thefourth quarter and updated our analysis using data as of October 1, 2016. This analysis indicated that the fair value of our Energy Financial Services reportingunit was significantly in excess of its carrying value. The improvement in fair value over its carrying value was driven by higher forecasted investment and returnperformance, reflecting stabilization in the commodities markets. The estimated fair value of the Energy Financial Services reporting unit is based on a numberof assumptions about future business performance and investment, including the performance of our renewable investment portfolio and the expected proceedsand timing of non-strategic investment divestitures. While all reporting units within our Oil & Gas operating segment are significantly in excess of their carryingvalue, the business continues to experience declines in orders, project commencement delays and pricing pressures, which affect their fair value. While thegoodwill of the Energy Financial Services and Oil & Gas reporting units are not currently impaired, we will continue to monitor the oil & gas industry and theimpact it may have on these businesses.
In addition, due to a decline in order growth and an increase in the order-to-cash cycle, the fair value of the Power Conversion reporting unit, within our EnergyConnections operating segment, was impacted and was in excess of its carrying value by approximately 9%. Due to continued decline in order growth andincrease to the order-to-cash cycle, we performed an impairment test in the fourth quarter using data as of December 1, 2016, which resulted in the fair value ofour Power Conversion reporting unit to be in excess of its carrying value by approximately 8%. The goodwill associated with our Power Conversion reporting unitwas $987 million at December 31, 2016, representing approximately 1% of our total goodwill. While the goodwill of the reporting unit is not currently impaired,there could be an impairment in the future as a result of changes in certain assumptions. For example, the reporting unit's fair value could be adversely affectedand result in an impairment of goodwill if actual cash flows are below estimated cash flows, the estimated cash flows are discounted at a higher risk-adjustedrate or market multiples decrease.
GE 2016 FORM 10-K 161

Finally, two reporting unit fair values were impacted as a result of the Alstom transaction. Subsequent to the close of the acquisition of Alstom, we formed twonew reporting units, Grid Solutions and Hydro. The Alstom Grid business was combined with our Digital Energy business, within our Energy Connectionsoperating segment, to create the new Grid Solutions reporting unit and the Alstom Hydro business is a newly created reporting unit within our Renewable Energyoperating segment. Since fair values equaled carrying value at the time of acquisition, this caused the fair values of these reporting units not to be significantly inexcess of their carrying values. As the fair values of these reporting units are not significantly in excess of their carrying values, we performed impairment testsin the fourth quarter using data as of December 1, 2016, which resulted in the fair value of the Hydro reporting unit approximating its carrying value and theexcess of fair value over carrying value of the Grid Solutions reporting unit being approximately 3%. The goodwill associated with our Hydro and Grid Solutionsreporting units was $899 million and $4,405 million, respectively, representing approximately 1% and 6% of our total goodwill at December 31, 2016. While thegoodwill of these reporting units are not currently impaired, there could be an impairment in the future as a result of changes in certain assumptions. Forexample, the fair value of these reporting units could be adversely affected and result in impairments of goodwill if expected synergies of the acquisition withAlstom are not realized or if the reporting units were not able to execute on customer opportunities, the estimated cash flows are discounted at a higher risk-adjusted rate or market multiples decrease.
As of December 31, 2016, we believe that the goodwill is recoverable for all of the reporting units; however, there can be no assurances that the goodwill will notbe impaired in future periods.
In 2015, we identified one reporting unit for which the fair value was not substantially in excess of its carrying value. Due to the sharp decline experienced in oilprices and the prospect of a continuation of prevailing oil prices, the fair value of our Energy Financial Services reporting unit, within our Capital operatingsegment, had been affected and was in excess of its carrying value by approximately 13%. Due to the continued decline in oil prices, we performed animpairment test in the fourth quarter using data as of December 31, 2015, which resulted in the fair value of our Energy Financial Services reporting unit being inexcess of its carrying value by approximately 12%. In the current year, the fair value of the Energy Financial Services reporting unit continues to be impacted bythe market conditions within the oil & gas industry as discussed above.
In 2015, although not impaired, our Oil & Gas business had also experienced declines in orders, project commencement delays and pricing pressures, whichaffected the fair value of our Oil & Gas reporting units. Our Oil & Gas business continues to be affected by the overall market conditions as discussed above.
Estimating the fair value of reporting units requires the use of estimates and significant judgments that are based on a number of factors including actualoperating results. It is reasonably possible that the judgments and estimates described above could change in future periods.
OTHER INTANGIBLE ASSETS
OTHER INTANGIBLE ASSETS - NET December 31 (In millions) 2016 2015 Intangible assets subject to amortization $ 16,336 $ 17,688Indefinite-lived intangible assets(a) 100 109Total $ 16,436 $ 17,797 (a) Indefinite-lived intangible assets principally comprise trademarks and in-process research and development.
GE 2016 FORM 10-K 162

INTANGIBLE ASSETS SUBJECT TO AMORTIZATION 2016 2015 Gross Gross carrying Accumulated carrying Accumulated December 31 (In millions) amount amortization Net amount amortization Net Customer-related $ 9,172 $ (2,408) $ 6,764 $ 9,758 $ (2,113) $ 7,645Patents and technology 8,693 (3,325) 5,368 8,543 (3,096) 5,447Capitalized software 7,652 (4,538) 3,114 7,375 (4,136) 3,239Trademarks 1,165 (307) 858 1,337 (282) 1,055Lease valuations 143 (59) 84 167 (22) 145Present value of future profits(a) 684 (684) - 651 (651) -All other 273 (124) 149 267 (108) 159Total $ 27,781 $ (11,444) $ 16,336 $ 28,098 $ (10,408) $ 17,688 (a) Balances at December 31, 2016 and 2015 reflect adjustments of $241 million and $266 million, respectively, to the present value of future profits in our run-off
insurance operation to reflect the effects that would have been recognized had the related unrealized investment securities holding gains and losses actually beenrealized.
GE amortization expense related to intangible assets subject to amortization was $1,704 million, $1,505 million and $1,386 million in 2016, 2015 and 2014,respectively. GE Capital amortization expense related to intangible assets subject to amortization was $131 million, $148 million and $84 million in 2016, 2015and 2014, respectively. Estimated GE Consolidated annual pre-tax amortization for intangible assets over the next five calendar years follows.
ESTIMATED 5 YEAR CONSOLIDATED AMORTIZATION (In millions) 2017 2018 2019 2020 2021 Estimated annual pre-tax amortization $ 2,058 $ 1,947 $ 1,846 $ 1,666 $ 1,519
During 2016 we recorded additions to intangible assets subject to amortization of $2,313 million. The components of finite-lived intangible assets acquiredduring 2016 and their respective weighted-average amortizable periods follow.
COMPONENTS OF FINITE-LIVED INTANGIBLE ASSETS ACQUIRED DURING 2016 Weighted-average Gross amortizable period(In millions) carrying value (in years) Customer-related $ 387 15.3Patents and technology 804 12.4Capitalized software 1,107 5.0Trademarks 11 7.2All other 3 3.0
GE 2016 FORM 10-K 163

NOTE 9. CONTRACT ASSETS AND ALL OTHER ASSETS
December 31 (In millions) 2016 2015 GE Revenue in excess of billings Long-term product service agreements(a) $ 12,752 $ 10,346 Long-term equipment contract revenue(b) 5,859 5,645Total revenue in excess of billings 18,611 15,991 Deferred inventory costs(c) 3,349 2,328Non-recurring engineering costs(d) 2,185 1,790Other 1,018 1,048Contract assets $ 25,162 $ 21,156 (a) Long-term product service agreement balances are presented net of related billings in excess of revenues of $3,750 million and $2,602 million at December 31, 2016
and 2015, respectively.(b) Reflects revenues earned in excess of billings on our long-term contracts to construct technically complex equipment (such as gas power systems).(c) Represents cost deferral for shipped goods (such as components for wind turbine assembly within our Renewable Energy segment) and other costs for which the
criteria for revenue recognition has not yet been met.(d) Included costs incurred prior to production (e.g., requisition engineering) for long-term equipment production contracts, primarily within our Aviation segment, which
are allocated ratably to each unit produced.
Contract assets increased $4,006 million in 2016, which was primarily driven by a change in estimated profitability within our long-term product serviceagreements resulting in an adjustment of $2,216 million, as well as an increase in deferred inventory costs.
December 31 (In millions) 2016 2015 GE Investments Associated companies $ 3,574 $ 3,582 Other 631 644 4,205 4,226Long-term receivables, including notes 2,433 2,310Derivative instruments 313 733Other(a) 5,055 5,544 12,007 12,813GE Capital Investments Associated companies 8,124 8,373 Assets held for sale(b) 2,361 857 Time deposits(c) - 10,386 Other 122 97 10,607 19,713Derivative instruments 32 549Advances to suppliers 1,632 1,809Other(d) 2,337 3,010 14,608 25,081Eliminations 561 (1,097)All Other Assets $ 27,176 $ 36,797 (a) Primarily included $3,320 million and $3,494 million of prepaid insurance, taxes and other expenses and $789 million and $1,030 million of deferred charges at
December 31, 2016 and 2015, respectively.(b) Assets were classified as held for sale on the date a decision was made to dispose of them through sale or other means. At December 31, 2016 and 2015, such
assets consisted primarily of loans, aircraft and equipment, and were accounted for at the lower of carrying amount or estimated fair value less costs to sell.(c) Balances at December 31, 2015 included $10,386 million of high quality interest bearing deposits with European branches of global banks, predominantly in the U.K.,
that matured in April 2016.(d) Balances at December 31, 2016 and 2015 i ncluded deferred acquisition cost adjustments of $558 million and $544 million, respectively, in our run-off insurance
operations to reflect the effects that would have been recognized had the related unrealized investment securities holding gains and losses actually been realized.
GE 2016 FORM 10-K 164

NOTE 10. BORROWINGS
December 31 (Dollars in millions) 2016 2015
Short-term borrowings Amount Average
Rate(a) Amount Average
Rate(a) GE Commercial paper $ 1,500 0.60% $ 500 0.15%Current portion of long-term borrowings 17,109 3.16 17,770 2.10 Other 1,874 1,522 Total GE short-term borrowings(b) 20,482 19,792 GE Capital Commercial paper U.S. 5,002 0.59 650 0.46 Non-U.S. - - 4,351 0.01 Current portion of long-term borrowings(c) 6,517 1.64 24,969 4.28 Intercompany payable to GE(d) 11,696 17,642 Other 229 1,005 Total GE Capital short-term borrowings 23,443 48,617 Eliminations(d) (13,212) (18,549) Total short-term borrowings $ 30,714 $ 49,860
Long-term borrowings Maturities Amount Average
Rate(a) Amount Average
Rate(a) GE Senior notes 2018-2054 $ 54,396 3.35% $ 72,471 3.23%Subordinated notes 2021-2037 2,768 3.73 2,940 3.68 Subordinated debentures(e) 2067 719 6.12 6,600 6.14 Other 928 1,298 Total GE long-term borrowings(b) 58,810 83,309 GE Capital Senior notes 2018-2039 44,131 2.45 59,107 2.54 Subordinated notes 236 251 - Intercompany payable to GE(d) 47,084 67,062 Other(c) 1,992 2,058 Total GE Capital long-term borrowings 93,443 128,478 Eliminations(d) (47,173) (67,128) Total long-term borrowings $ 105,080 $ 144,659 Non-recourse borrowings of consolidated securitization entities(f) 2017-2018 $ 417 2.23% $ 3,083 1.00%Total borrowings $ 136,210 $ 197,602 (a) Based on year-end balances and year-end local currency effective interest rates, including the effects from hedging.(b) Excluding assumed debt of GE Capital, the total amount of GE borrowings was $20,512 million at December 31, 2016.(c) Included $2,665 million and $2,679 million of funding secured by aircraft and other collateral at December 31, 2016 and December 31, 2015, respectively, of which
$1,419 million and $1,534 million is non-recourse to GE Capital at December 31, 2016 and December 31, 2015, respectively.(d) The amount of the intercompany payable to GE was $58,780 million as of December 31, 2016, which includes a reduction in the short-term intercompany payable to
GE for a $(1,329) million loan which bears the right of offset against amounts owed under the assumed debt agreement. The remaining short-term loan balance waspaid in January 2017.
(e) Included $719 million and $2,587 million of subordinated debentures at December 31, 2016 and December 31, 2015, respectively, which constitute the sole assets oftrusts that have issued trust preferred securities and where GE owns 100% of the common securities of the trusts. Obligations associated with these trusts areunconditionally guaranteed by GE.
(f) Included $320 million and $918 million of current portion of long-term borrowings at December 31, 2016 and December 31, 2015, respectively. See Note 21.
GE 2016 FORM 10-K 165

On June 3, 2016, GE commenced an offering to exchange $19.6 billion of all the outstanding, unregistered senior notes that were issued by GE CapitalInternational Funding Company Unlimited Company in a private offering on October 26, 2015, for identical, registered 2.342% Senior Notes due 2020, 3.373%Senior Notes due 2025 and 4.418% Senior Notes due 2035. The exchange offer was completed on July 8, 2016.
As discussed in Note 1, the adoption of ASU 2015-03 resulted in the reclassification of $674 million of unamortized debt issuance costs related to theCompany's borrowings, of which $641 million was reclassified in long-term borrowings and $33 million was reclassified in short-term borrowings, within ourconsolidated balance sheet as of December 31, 2015.
On April 10, 2015, GE provided a full and unconditional guarantee on the payment of the principal and interest on all tradable senior and subordinatedoutstanding long-term debt securities and all commercial paper issued or guaranteed by GE Capital. $92,537 million of such debt was assumed by GE onDecember 2, 2015 upon its merger with GE Capital resulting in an intercompany payable to GE. At December 31, 2016, the amount of the intercompanypayable to GE was $58,780 million, which includes a reduction in the short-term intercompany payable to GE for a $(1,329) million loan to GE which bears theright of offset against amounts owed under the assumed debt agreement. The remaining short-term loan balance was paid in January 2017. The Guaranteeapplies to approximately $47,476 million of GE Capital debt. Prior to the merger $35,999 million (representing $31,154 million of outstanding principal and$4,846 million of premium) of GE Capital debt was exchanged into a new GE Capital international entity, including $16,372 million, which matured on April 15,2016.
See Notes 20 and 29 for additional information about borrowings and associated swaps .
Liquidity is affected by debt maturities and our ability to repay or refinance such debt. Long-term debt maturities over the next five years follow.
(In millions) 2017 2018 2019 2020 2021 GE(a) $ 17,109 $ 7,899 $ 3,787 $ 6,996 $ 4,708GE Capital 6,517(b) 5,578 4,111 11,107 2,131 (a) Included borrowings assumed by GE as part of the merger, for which GE has an offsetting amount due from GE Capital, of $13,024 million, $7,709 million, $3,729
million, $6,223 million and $4,672 million in 2017, 2018, 2019, 2020 and 2021, respectively.
(b) Fixed and floating rate notes of $498 million contain put options with exercise dates in 2017, and which have final maturity beyond 2021.
GE 2016 FORM 10-K 166

NOTE 11. INVESTMENT CONTRACTS, INSURANCE LIABILITIES AND INSURANCE ANNUITY BENEFITS
Investment contracts, insurance liabilities and insurance annuity benefits comprise mainly obligations to annuitants and policyholders in our run-off insuranceoperations.
December 31 (In millions) 2016 2015 Life insurance benefits(a) $ 18,741 $ 18,555Investment contracts 2,813 2,955Other(b) 4,992 4,646 26,546 26,155Eliminations (460) (463)Total $ 26,086 $ 25,692 (a) Life insurance benefits are accounted for mainly by a net-level-premium method using estimated yields generally ranging from 3.0% to 8.5% in both 2016 and 2015.
(b) Substantially all unpaid claims and claims adjustment expenses and unearned premiums.
When insurance affiliates cede insurance risk to third parties, such as reinsurers, they are not relieved of their primary obligation to policyholders. When losseson ceded risks give rise to claims for recovery, we establish allowances for probable losses on such receivables from reinsurers as required. Reinsurancerecoverables are included in the caption "Other receivables" on our Consolidated Statement of Financial Position, and amounted to $2,038 million and $1,880million at December 31, 2016 and 2015, respectively.
We recognize reinsurance recoveries as a reduction of the Consolidated Statement of Earnings caption "Investment contracts, insurance losses and insuranceannuity benefits." Reinsurance recoveries were $370 million, $351 million and $228 million in 2016, 2015 and 2014, respectively.
NOTE 12. POSTRETIREMENT BENEFIT PLANS
ABOUT OUR PLANS
We sponsor a number of pension plans, including our two principal pension plans for certain U.S. employees as well as other affiliate pension plans. Ourprincipal pension plans, the GE Pension Plan and the GE Supplementary Pension Plan, are discussed below. A summary of other postretirement plans is alsoprovided.
The GE Pension Plan is a defined benefit plan that covers 238,000 retirees and beneficiaries, 168,000 vested former employees and 61,000 active employees.This plan is closed to new participants. The GE Supplementary Pension Plan is an unfunded plan that provides supplementary benefits to higher-level, longer-service employees. The GE Supplementary Pension Plan annuity benefit is closed to new participants and has been replaced by an installment benefit. We usea December 31 measurement date for these plans.
On our balance sheet, we measure our plan assets at fair value and the obligations at the present value of the estimated payments to plan participants.Participants earn benefits based on their service and pay. Those estimated payment amounts are determined based on assumptions. Differences between ouractual results and what we assumed are recorded in a separate component of equity each period. These differences are amortized into earnings over theremaining average future service of active employees or the expected life of participants, as applicable, who participate in the plan.
GE 2016 FORM 10-K 167

THE COST OF OUR PLANS
The amount we report in our earnings as pension cost consists of the following components:
· Service cost – the cost of benefits earned by active employees who participate in the plan.
· Prior service cost amortization – the cost of changes to our benefits plans (plan amendments) related to prior service performed.
· Expected return on plan assets – the return we expect to earn on plan investments used to pay future benefits.
· Interest cost – the accrual of interest on the pension obligations due to the passage of time.
· Net actuarial loss (gain) amortization – differences between our estimates, (for example, discount rate, expected return on plan assets) and our actualexperience which are initially recorded in equity and amortized into earnings.
· Curtailment loss – earnings effects of amounts previously deferred which have been accelerated because of an event that shortens future service oreliminates benefits (for example, a sale of a business).
Pension cost components follow.
COST OF PENSION PLANS Principal pension plans(In millions) 2016 2015 2014 Service cost for benefits earned $ 1,237 $ 1,424 $ 1,205Prior service cost amortization 303 205 214Expected return on plan assets (3,336) (3,302) (3,190)Interest cost on benefit obligations 2,939 2,778 2,745Net actuarial loss amortization 2,449 3,288 2,565Curtailment loss 31 105 65Pension cost $ 3,623 $ 4,498 $ 3,604
ASSUMPTIONS USED IN PENSION CALCULATIONS
Accounting requirements necessitate the use of assumptions to reflect the uncertainties and the length of time over which the pension obligations will be paid.The actual amount of future benefit payments will depend upon when participants retire, the amount of their benefit at retirement and how long they live. Toreflect the obligations in today's dollars, we discount the future payments using a rate that matches the time frame over which the payments will be made. Wealso need to assume a long-term rate of return that will be earned on investments used to fund these payments.
The assumptions used to measure our pension benefit obligations follow .
ASSUMPTIONS USED TO MEASURE PENSION BENEFIT OBLIGATIONS Principal pension plansDecember 31 2016 2015 2014 Discount rate 4.11% 4.38% 4.02%Compensation increases 3.80 3.80 4.10
The discount rate used to measure the pension obligations at the end of the year is also used to measure pension cost in the following year. The assumptionsused to measure pension cost follow .
ASSUMPTIONS USED TO MEASURE PENSION COST Principal pension plansDecember 31 2016 2015 2014 Discount rate 4.38% 4.02% 4.85%Expected return on assets 7.50 7.50 7.50
GE 2016 FORM 10-K 168

We evaluate these assumptions annually. We evaluate other assumptions periodically, such as retirement age, mortality and turnover, and update them asnecessary to reflect our actual experience and expectations for the future.
We determine the discount rate using the weighted-average yields on high-quality fixed-income securities that have maturities consistent with the timing ofbenefit payments. Lower discount rates increase the size of the benefit obligation and pension expense in the following year; higher discount rates reduce thesize of the benefit obligation and subsequent-year pension expense.
The expected return on plan assets is the estimated long-term rate of return that will be earned on the investments used to fund the pension obligations. Todetermine this rate, we consider the current and target composition of plan investments, our historical returns earned, and our expectations about the future.
The compensation assumption is used to estimate the annual rate at which pay of plan participants will grow. If the rate of growth assumed increases, the sizeof the pension obligations will increase, as will the amount recorded in shareowners' equity and amortized to earnings in subsequent periods.
Further information about our pension assumptions, including a sensitivity analysis of certain assumptions, can be found in the Critical Accounting Estimates –Pension Assumptions within Management's Discussion and Analysis of Financial Condition and Results of Operations (MD&A) .
FUNDED STATUS Principal pension plansDecember 31 (in millions) 2016 2015 Projected benefit obligations $ 71,501 $ 68,722Fair value of plan assets 45,893 45,720Underfunded $ 25,608 $ 23,002
PROJECTED BENEFIT OBLIGATIONS (PBO) Principal pension plans (In millions) 2016 2015 Balance at January 1 $ 68,722 $ 70,735 Service cost for benefits earned 1,237 1,424 Interest cost on benefit obligations 2,939 2,778 Participant contributions 115 155 Plan amendments - 902 Actuarial loss (gain) 1,874(a) (4,017)(b)Benefits paid (3,386) (3,255) Balance at December 31(c) $ 71,501 $ 68,722 (a) Principally associated with discount rate and mortality assumption changes.
(b) Principally associated with discount rate changes.
(c) The PBO for the GE Supplementary Pension Plan, which is an unfunded plan, was $6,531 million and $6,099 million at year-end 2016 and 2015, respectively.
GE 2016 FORM 10-K 169

THE COMPOSITION OF OUR PLAN ASSETS
The fair value of our pension plans' investments is presented below. The inputs and valuation techniques used to measure the fair value of these assets aredescribed in Note 1 and have been applied consistently.
Principal pension plansDecember 31 (in millions) 2016 2015 Equity securities U.S. equity securities(a) $ 12,130 $ 12,447 Non-U.S. equity securities(a) 9,029 9,088Debt securities Fixed income and cash investment funds 4,897 3,252 U.S. corporate(b) 5,252 5,529 Other debt securities(c) 5,066 5,131Private equities(a) 4,492 4,885Real estate(a) 3,244 3,186Other investments(d) 1,783 2,202Total plan assets $ 45,893 $ 45,720 (a) Included direct investments and investment funds.(b) Primarily represented investment-grade bonds of U.S. issuers from diverse industries.(c) Primarily represented investments in residential and commercial mortgage-backed securities, non-U.S. corporate and government bonds and U.S. government,
federal agency, state and municipal debt.(d) Substantially all represented hedge fund investments and net unsettled transaction-related investment activity.
Plan assets valued using NAV as a practical expedient amounted to $16,894 million and $15,430 million as of December 31, 2016 and 2015, respectively. Thepercentages of plan assets valued using NAV by investment fund type for equity securities, fixed income and cash, and alternative investments were 12%, 8%and 17% as of December 31, 2016, respectively, and 10%, 7% and 17% as of December 31, 2015, respectively.
Those investments that were measured at fair value using practical expedient were excluded from the fair value hierarchy. The practical expedient was notapplied for investments with a fair value of $2,504 million and $2,492 million in 2016 and 2015, respectively and those investments were classified within Level3. The remaining investments were substantially all considered Level 1 and 2.
FAIR VALUE OF PLAN ASSETS Principal pension plans(In millions) 2016 2015 Balance at January 1 $ 45,720 $ 48,280Actual gain on plan assets 2,892 307Employer contributions 552 233Participant contributions 115 155Benefits paid (3,386) (3,255)Balance at December 31 $ 45,893 $ 45,720
AMOUNTS INCLUDED IN SHAREOWNERS' EQUITY
Amounts included in shareowners' equity that will be amortized in future reporting periods follow.
Principal pension plansDecember 31 (in millions) 2016 2015 Prior service cost $ 1,138 $ 1,473Net actuarial loss 16,664 16,795Total $ 17,802 $ 18,268 In 2017, we estimate that we will amortize $295 million of prior service cost and $2,840 million of net actuarial loss from shareowners' equity into pension cost.Comparable amounts amortized in 2016 were $303 million and $2,449 million, respectively.
GE 2016 FORM 10-K 170

OTHER PENSION AND POSTRETIREMENT PLANS
We also administer other pension plans, including legacy plans that were part of acquisitions. Other pension plans in 2016 included 49 U.S. and non-U.S.pension plans with assets or obligations greater than $50 million. These other pension plans cover 60,000 retirees and beneficiaries, 59,000 vested formeremployees and 33,000 active employees. We also sponsor a number of postretirement health and life insurance benefit plans (retiree benefit plans). Principalretiree benefit plans cover approximately 187,000 retirees and dependents.
Summarized information about these plans follows.
COST OF BENEFIT PLANS Other pension plans Principal retiree benefit plans(In millions) 2016 2015 2014 2016 2015 2014
Benefit plan cost $ 374 $ 373 $ 412 $ 115 $ 174 $ 789
FUNDED STATUS Principal retiree Other pension plans benefit plansDecember 31 (In millions) 2016 2015 2016 2015
Benefit obligations $ 22,543 $ 21,618 $ 6,289 $ 6,757Fair value of plan assets 17,091 17,368 575 695Underfunded $ 5,452 $ 4,250 $ 5,714 $ 6,062
AMOUNTS INCLUDED IN SHAREOWNERS' EQUITY
Amounts included in shareowners' equity that will be amortized in future reporting periods follow. Principal retiree Other pension plans benefit plansDecember 31 (In millions) 2016 2015 2016 2015 Prior service credit $ (88) $ (29) $ (2,975) $ (3,132)Net actuarial loss (gain) 4,800 3,080 (682) (464)Total $ 4,712 $ 3,051 $ (3,657) $ (3,596) In 2017, we estimate that we will amortize $5 million of prior service credit and $520 million of net actuarial loss for the other pension plans from shareowners'equity into pension cost. For principal retiree benefit plans, the estimated prior service credit and net actuarial gain to be amortized in 2017 will be $170 millionand $80 million, respectively. Comparable amounts amortized in 2016, respectively, were $1 million of prior service credit and $256 million of net actuarial lossfor the other pension plans and $164 million of prior service credit and $50 million of net actuarial gain for the principal retiree benefit plans.
OUR FUNDING POLICY
Our policy for funding the GE Pension Plan is to contribute amounts sufficient to meet minimum funding requirements under employee benefit and tax laws. Wemay decide to contribute additional amounts beyond this level. We made a contribution of $330 million to the GE Pension Plan in 2016. We did not make anycontributions to the GE Pension Plan in 2015. We expect to contribute approximately $1,720 million to the GE Pension Plan in 2017.
We expect to pay approximately $250 million for benefit payments under our GE Supplementary Pension Plan and administrative expenses of our principalpension plans and expect to contribute approximately $910 million to other pension plans in 2017. In 2016, comparative amounts were $222 million and $795million, respectively.
We fund retiree health benefits on a pay-as-you-go basis and the retiree life insurance trust at our discretion. We expect to contribute approximately $460 millionin 2017 to fund such benefits. In 2016, we contributed $410 million for these plans.
See Note 29 for further information about our pension plans and principal retiree benefit plans.
GE 2016 FORM 10-K 171

NOTE 13. ALL OTHER LIABILITIESThis caption includes liabilities for various items including deferred income, interest on tax liabilities, unrecognized tax benefits, environmental remediation, legalreserves, asset retirement obligations, derivative instruments, product warranties and a variety of sundry items.
See Note 14 for further information on interest on tax liabilities and unrecognized tax benefits. See Notes 20 and 29 for further information on derivativeinstruments. See Note 23 for further information on environmental matters, legal reserves and product warranties .
NOTE 14. INCOME TAXES
GE and GE Capital file a consolidated U.S. federal income tax return. This enables GE and GE Capital to use tax deductions and credits of one member of thegroup to reduce the tax that otherwise would have been payable by another member of the group. The effective tax rate reflects the benefit of these taxreductions in the consolidated return. GE makes cash payments to GE Capital for tax reductions and GE Capital pays for tax increases at the time GE's taxpayments are due.
Our businesses are subject to regulation under a wide variety of U.S. federal, state and foreign tax laws, regulations and policies. Changes to these laws orregulations may affect our tax liability, return on investments and business operations.
THE GE CAPITAL EXIT PLAN
In conjunction with the GE Capital Exit Plan, GE Capital significantly reduced its non-U.S. assets while continuing to operate appropriately capitalized non-U.S.businesses with substantial assets related to GE Capital's vertical financing businesses, including Energy Financial Services, GECAS and HealthcareEquipment Finance. As a result of the GE Capital Exit Plan, GE Capital recognized a tax expense of $6,327 million in continuing operations during 2015. Thisprimarily consisted of $3,548 million of tax expense related to the repatriation of excess foreign cash and the write-off of deferred tax assets of $2,779 millionthat will no longer be supported under this plan.
The repatriation of cash included approximately $10 billion of foreign earnings that, prior to the approval of the GE Capital Exit Plan, were indefinitely reinvestedin GE Capital's international operations. GE Capital's indefinitely reinvested earnings were also reduced by charges recognized in connection with thedisposition of international assets. The remainder of the indefinitely reinvested earnings will continue to be reinvested in the significant international base ofassets that will remain after the GE Capital Exit Plan is fully executed. The write-off of deferred tax assets largely related to our Treasury operations in Irelandwhere it was no longer apparent that the tax benefits would be realized upon implementation of the GE Capital Exit Plan. These charges, which increased the2015 Consolidated effective tax rate by 77.3 percentage points, are reported in the lines "Tax on global activities including exports", and "All other-net" in theReconciliation of U.S. federal statutory income tax rate to actual income tax rate."
(BENEFIT) PROVISION FOR INCOME TAXES (In millions) 2016 2015 2014 GE Current tax expense (benefit) $ (140) $ 3,307 $ 2,110Deferred tax expense (benefit) from temporary differences 1,107 (1,800) (476) 967 1,506 1,634GE Capital Current tax expense (benefit) (1,138) 2,796 (455)Deferred tax expense (benefit) from temporary differences (293) 2,183 (406) (1,431) 4,979 (861)Consolidated Current tax expense (benefit) (1,278) 6,103 1,655Deferred tax expense (benefit) from temporary differences 814 383 (882)Total $ (464) $ 6,485 $ 773
GE 2016 FORM 10-K 172

CONSOLIDATED EARNINGS (LOSS) FROM CONTINUING OPERATIONS BEFORE INCOME TAXES (In millions) 2016 2015 2014 U.S. earnings $ 2,145 $ (309) $ 3,176Non-U.S. earnings 6,885 8,495 7,087Total $ 9,030 $ 8,186 $ 10,263
CONSOLIDATED (BENEFIT) PROVISION FOR INCOME TAXES (In millions) 2016 2015 2014 U.S. Federal Current $ (2,646) $ 1,549 $ (122) Deferred (754) 492 261Non - U.S. Current 1,730 4,867 2,035 Deferred 1,239 (121) (982)Other (33) (302) (419)Total $ (464) $ 6,485 $ 773
RECONCILIATION OF U.S. FEDERAL STATUTORY INCOME TAX RATE TO ACTUAL INCOME TAX RATE Consolidated GE GE Capital 2016 2015 2014 2016 2015 2014 2016 2015 2014 U.S. federal statutory income tax rate 35.0% 35.0% 35.0% 35.0% 35.0% 35.0% 35.0% 35.0% 35.0% Increase (reduction) in rate resulting from inclusion of after-tax earnings of GE Capital in before-tax earnings of GE - - - 4.5 82.4 (4.8) - - - Tax on global activities including exports (23.7) 54.1 (17.7) (20.8) (52.8) (12.0) 4.9 (224.5) (72.0) U.S. business credits(a) (4.5) (4.7) (3.3) (0.9) (4.1) (1.0) 15.7 9.2 (34.5) All other – net(b) (11.9) (5.2) (6.5) (7.9) (14.2) (2.5) 14.7 (1.5) (55.9) (40.1) 44.2 (27.5) (25.1) 11.3 (20.3) 35.3 (216.8) (162.4) Actual income tax rate (5.1)% 79.2% 7.5% 9.9% 46.3% 14.7% 70.3% (181.8)% (127.4)% (a) U.S. general business credits, primarily the credit for energy produced from renewable sources, the advanced energy project credit and the credit for research
performed in the U.S.
(b) Included (7.7)% and (7.1)% in consolidated and GE, respectively, related to deductible stock losses in 2016. Included (4.2)% and (10.6)% in consolidated and GE,respectively, related to deductible stock losses in 2015. Also includes, for each period, the expense or (benefit) for "Other" taxes reported above in the consolidated(benefit) provision for income taxes, net of 35% federal effect.
UNRECOGNIZED TAX POSITIONS
Annually, we file over 6,000 income tax returns in over 300 global taxing jurisdictions. We are under examination or engaged in tax litigation in many of thesejurisdictions. The Internal Revenue Service (IRS) is currently auditing our consolidated U.S. income tax returns for 2012-2013. In addition, certain other U.S. taxdeficiency issues and refund claims for previous years are still unresolved. It is reasonably possible that a portion of the unresolved items could be resolvedduring the next 12 months, which could result in a decrease in our balance of "unrecognized tax benefits" – that is, the aggregate tax effect of differencesbetween tax return positions and the benefits recognized in our financial statements. The IRS had disallowed the tax loss on our 2003 disposition of ERC LifeReinsurance Corporation. We contested the disallowance of this loss. In August 2016, the government approved a final settlement of the case and the balanceof unrecognized tax benefits and associated interest was adjusted to reflect the agreed settlement. During 2015, the IRS completed the audit of ourconsolidated U.S. income tax returns for 2010-2011, except for certain issues that were completed in 2016. We believe that there are no other jurisdictions inwhich the outcome of unresolved issues or claims is likely to be material to our results of operations, financial position or cash flows. We further believe that wehave made adequate provision for all income tax uncertainties. Resolution of audit matters, including the IRS audit of our consolidated U.S. income tax returnsfor 2010-2011 and the resolution of the ERC Life Reinsurance Corporation case, reduced our 2016 consolidated income tax rate by 5.3 percentage points.Resolution of audit matters, including the IRS audit of our consolidated U.S. income tax returns for 2010-2011, reduced our 2015 consolidated income tax rateby 4.4 percentage points.
GE 2016 FORM 10-K 173

The balance of unrecognized tax benefits, the amount of related interest and penalties we have provided and what we believe to be the range of reasonablypossible changes in the next 12 months were:
UNRECOGNIZED TAX BENEFITS December 31, (In millions) 2016 2015 Unrecognized tax benefits $ 4,692 $ 6,778Portion that, if recognized, would reduce tax expense and effective tax rate(a) 2,886 4,723Accrued interest on unrecognized tax benefits 615 805Accrued penalties on unrecognized tax benefits 118 98Reasonably possible reduction to the balance of unrecognized tax benefits in succeeding 12 months 0-600 0-700Portion that, if recognized, would reduce tax expense and effective tax rate(a) 0-500 0-200 (a) Some portion of such reduction may be reported as discontinued operations.
UNRECOGNIZED TAX BENEFITS RECONCILIATION (In millions) 2016 2015 Balance at January 1 $ 6,778 $ 5,619Additions for tax positions of the current year 248 720Additions for tax positions of prior years(a) 521 1,296Reductions for tax positions of prior years (2,016) (754)Settlements with tax authorities (823) (70)Expiration of the statute of limitations (16) (33)Balance at December 31 $ 4,692 $ 6,778 (a) For 2015, the amount shown as "additions for tax positions of prior years" relates primarily ($1,054 million) to the preliminary estimate of uncertain tax liabilities for
acquired Alstom businesses. Of the total 2015 additions for tax positions of prior years, $445 million relates to amounts that would not affect tax expense ifrecognized.
We classify interest on tax deficiencies as interest expense; we classify income tax penalties as provision for income taxes. For the years ended December 31,2016, 2015 and 2014, $(105) million, $48 million and $(68) million of interest expense (income), respectively, and $(4) million, $(4) million and (45) of taxexpense (income) related to penalties, respectively, were recognized in the Statement of Earnings.
DEFERRED INCOME TAXES
Deferred income tax balances reflect the effects of temporary differences between the carrying amounts of assets and liabilities and their tax bases, as well asfrom net operating loss and tax credit carryforwards, and are stated at enacted tax rates expected to be in effect when taxes are actually paid or recovered.Deferred income tax assets represent amounts available to reduce income taxes payable on taxable income in future years. We evaluate the recoverability ofthese future tax deductions and credits by assessing the adequacy of future expected taxable income from all sources, including reversal of taxable temporarydifferences, forecasted operating earnings and available tax planning strategies. To the extent we do not consider it more likely than not that a deferred taxasset will be recovered, a valuation allowance is established.
We have not provided U.S. deferred taxes on cumulative earnings of non-U.S. affiliates and associated companies that have been reinvested indefinitely. Theseearnings relate to ongoing operations and, at December 31, 2016 and 2015, were approximately $82 billion and $104 billion, respectively. Most of theseearnings have been reinvested in active non-U.S. business operations and we do not intend to repatriate these earnings to fund U.S. operations. Because of theavailability of U.S. foreign tax credits, it is not practicable to determine the U.S. federal income tax liability that would be payable if such earnings were notreinvested indefinitely. Deferred taxes are provided for earnings of non-U.S. affiliates and associated companies when we plan to remit those earnings.
GE 2016 FORM 10-K 174

Aggregated deferred income tax amounts are summarized below.
December 31 (In millions) 2016 2015 Assets GE $ 21,106 $ 20,539GE Capital 5,093 4,643 26,199 25,182Liabilities GE (14,440) (12,873)GE Capital (9,926) (9,204) (24,366) (22,077)Net deferred income tax asset (liability) $ 1,833 $ 3,105
COMPONENTS OF THE NET DEFERRED INCOME TAX ASSET (LIABILITY) December 31 (In millions) 2016 2015 GE Principal pension plans $ 8,963 $ 8,051Other non-current compensation and benefits 4,230 4,133Provision for expenses 2,633 2,827Retiree insurance plans 2,000 2,122Non-U.S. loss carryforwards(a) 1,444 1,940Contract assets (6,677) (5,143)Intangible assets (2,962) (3,192)Depreciation (1,755) (1,688)Investment in global subsidiaries (899) (915)Other – net (311) (469) 6,666 7,666GE Capital Operating leases (3,582) (3,863)Financing leases (1,632) (1,665)Energy investments (1,410) (1,276)Investment in global subsidiaries (343) 5Intangible assets (125) (103)Non-U.S. loss carryforwards(a) 1,323 2,262Other – net 936 79 (4,833) (4,561)Net deferred income tax asset (liability) $ 1,833 $ 3,105 (a) Net of valuation allowances of $2,450 million and $2,184 million for GE and $391 million and $109 million for GE Capital, for 2016 and 2015, respectively. Of the net
deferred tax asset as of December 31, 2016, of $2,767 million, $6 million relates to net operating loss carryforwards that expire in various years ending fromDecember 31, 2016 through December 31, 2018; $472 million relates to net operating losses that expire in various years ending from December 31, 2020 throughDecember 31, 2036 and $2,289 million relates to net operating loss carryforwards that may be carried forward indefinitely.
GE 2016 FORM 10-K 175

NOTE 15. SHAREOWNERS' EQUITY
(In millions) 2016 2015 2014 Preferred stock issued $ 6 $ 6 $ -Common stock issued $ 702 $ 702 $ 702Accumulated other comprehensive income (loss) Balance at January 1 $ (16,529) $ (18,172) $ (9,119)Other comprehensive income (loss) before reclassifications (4,602) (3,312) (12,088)Reclassifications from other comprehensive income 2,533 4,956 3,035Other comprehensive income (loss), net, attributable to GE (2,069) 1,644 (9,053)Balance at December 31 $ (18,598) $ (16,529) $ (18,172)Other capital Balance at January 1 $ 37,613 $ 32,889 $ 32,494Gains (losses) on treasury stock dispositions and other(a)(b) (389) 4,724 396Balance at December 31 $ 37,224 $ 37,613 $ 32,889Retained earnings Balance at January 1 $ 140,020 $ 155,333 $ 149,051Net earnings (loss) attributable to the Company 8,831 (6,126) 15,233Dividends and other transactions with shareowners (9,054) (9,161) (8,948)Redemption value adjustment on redeemable noncontrolling interests (266) (25) (2)Balance at December 31 $ 139,532 $ 140,020 $ 155,333Common stock held in treasury Balance at January 1 $ (63,539) $ (42,593) $ (42,561)Purchases(c)(d) (22,073) (23,762) (1,950)Dispositions 2,574 2,816 1,917Balance at December 31 $ (83,038) $ (63,539) $ (42,593)Total equity GE shareowners' equity balance at December 31 $ 75,828 $ 98,274 $ 128,159Noncontrolling interests balance at December 31 1,663 1,864 8,674Total equity balance at December 31 $ 77,491 $ 100,138 $ 136,833 (a) Included $440 million related to the excess of the net proceeds from the Synchrony Financial IPO over the carrying value of the interest sold in 2014.
(b) Included $4,949 million related to issuance of new preferred stock in exchange for existing GE Capital preferred stock in 2015.
(c) Included $(20,383) million related to the split-off of Synchrony Financial from GE, where GE shares were exchanged for shares of Synchrony Financial in 2015.
(d) Included $(11,370) million of GE shares purchased under accelerated share repurchase (ASR) agreements in 2016.
GE 2016 FORM 10-K 176

SHARES OF GE PREFERRED STOCK
At December 31, 2014, GECC had outstanding 50,000 shares of non-cumulative A, B and C Series perpetual preferred stock at an average dividend rate of6.44% with a face value of $5,000 million. In connection with the GE Capital Exit Plan, on December 3, 2015, these shares were converted into a correspondingSeries A, B, and C of fixed-to-floating rate non-cumulative perpetual preferred stock issued by GE with face value of $2,778 million, $2,073 million, and $1,094million, respectively, for a cumulative face value of $5,944 million and an initial average fixed dividend rate of 4.07%. The incremental shares were issued inorder to compensate preferred holders for the lower dividend rate. Subsequent to the issuance of the preferred stock on December 3, 2015, in response toinvestor feedback, GE launched an exchange offer on December 18, 2015 that allowed GE preferred stock investors to exchange their existing Series A, B andC preferred stock into a Series D GE preferred stock. These Series D instruments bear an initial fixed interest rate of 5.00% through January 21, 2021, will beara floating rate equal to three-month LIBOR plus 3.33% thereafter and are callable on January 21, 2021. On January 20, 2016, $2,687 million of Series A, $2,008million of Series B and $999 million of Series C were exchanged into $5,694 million Series D GE preferred stock. In addition to interim dividends and accretion of$129 million, a deemed dividend of $232 million was recorded in the year ended December 31, 2016. The deemed dividend included $195 million for the amountby which the fair value of the Series D GE preferred stock exceeded the fair value of the original GECC Series A, B and C preferred stock, and a cash paymentof $37 million to the GE Series A and B preferred stockholders who exchanged into the Series D GE preferred stock. Post exchange, $91 million of Series A,$64 million of Series B and $95 million of Series C GE preferred stock remain outstanding. The carrying value of the GE preferred stock at December 31, 2016was $5,283 million and will increase to $5,944 million through periodic accretion to the respective call dates of each series. Principal and accretion for thepreferred stock is recorded in other capital in the consolidated Statement of Financial Position and dividends and accretion are presented under the caption"Preferred stock dividends" in the Statement of Earnings (Loss). Dividends on GE preferred stock are payable semi-annually, in June and December andaccretion is recorded on a quarterly basis.
In conjunction with the exchange of the GE Capital preferred stock into GE preferred stock and the exchange of Series A, B and C preferred stock into Series Dpreferred stock, GE Capital issued preferred stock to GE for which the amount and terms mirror the GE preferred stock held by external investors ( $5,283million carrying value at December 31, 2016).
GE has 50.0 million authorized shares of preferred stock ($1.00 par value). 5,944,250 shares were issued and outstanding as of December 31, 2016 and 2015,respectively. No shares were issued and outstanding as of December 31, 2014.
SHARES OF GE COMMON STOCK
On April 10, 2015, the GE Board has authorized a new repurchase program of up to $50.0 billion in common stock, excluding the Synchrony Financial exchangewe completed in 2015. Under our share purchase programs, on a book basis, we repurchased shares of 725.8 million, 109.8 million and 73.6 million for a total of$22,005 million, $3,320 million and $1,901 million for the years ended 2016, 2015, and 2014, respectively. During 2016, we repurchased $11,370 million of ourcommon stock under the accelerated share repurchase (ASR) agreements.
In December 2016, we entered into an ASR agreement with a financial institution which allowed us to repurchase GE common stock at a price below its volumeweighted-average price during a given period. During the fourth quarter, we paid $2,200 million and received and classified as treasury shares an initialdelivery of 59,177,215 shares based on then-current market prices. The payment was recorded as a reduction to shareowners' equity, consisting of a $1,870million increase in treasury stock, which reflects the value of the shares received upon initial delivery, and a $330 million decrease in other capital, which reflectsthe value of the stock held back pending final delivery.
We accounted for the ASR as two separate transactions: (i) 59,177,215 shares of common stock initially delivered to GE and $1,870 million was accountedfor as a treasury stock transaction and (ii) the unsettled contract of $330 million was determined to be a forward contract indexed to GE's own common stock.The initial delivery of 59,177,215 shares resulted in an immediate reduction of the outstanding shares used to calculate the weighted-average common sharesoutstanding for basic and diluted earnings per share. GE has determined that the forward contract, indexed to its own common stock, met all the criteria forequity classification.
In the first quarter of 2017, we received the remaining 10,773,050 shares based on the final volume weighted-average price less the negotiated discount.
GE 2016 FORM 10-K 177
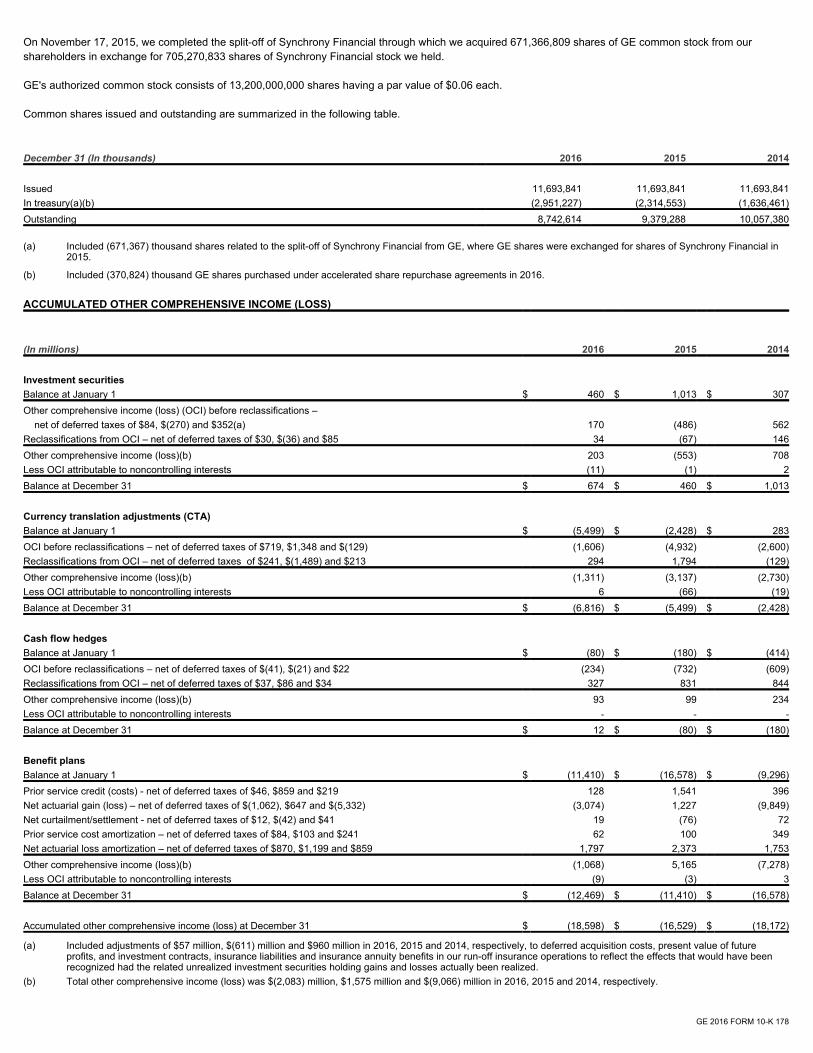
On November 17, 2015, we completed the split-off of Synchrony Financial through which we acquired 671,366,809 shares of GE common stock from ourshareholders in exchange for 705,270,833 shares of Synchrony Financial stock we held.
GE's authorized common stock consists of 13,200,000,000 shares having a par value of $0.06 each.
Common shares issued and outstanding are summarized in the following table.
December 31 (In thousands) 2016 2015 2014 Issued 11,693,841 11,693,841 11,693,841In treasury(a)(b) (2,951,227) (2,314,553) (1,636,461)Outstanding 8,742,614 9,379,288 10,057,380 (a) Included (671,367) thousand shares related to the split-off of Synchrony Financial from GE, where GE shares were exchanged for shares of Synchrony Financial in
2015.
(b) Included (370,824) thousand GE shares purchased under accelerated share repurchase agreements in 2016.
ACCUMULATED OTHER COMPREHENSIVE INCOME (LOSS) (In millions) 2016 2015 2014 Investment securities Balance at January 1 $ 460 $ 1,013 $ 307Other comprehensive income (loss) (OCI) before reclassifications – net of deferred taxes of $84, $(270) and $352(a) 170 (486) 562Reclassifications from OCI – net of deferred taxes of $30, $(36) and $85 34 (67) 146Other comprehensive income (loss)(b) 203 (553) 708Less OCI attributable to noncontrolling interests (11) (1) 2Balance at December 31 $ 674 $ 460 $ 1,013 Currency translation adjustments (CTA) Balance at January 1 $ (5,499) $ (2,428) $ 283OCI before reclassifications – net of deferred taxes of $719, $1,348 and $(129) (1,606) (4,932) (2,600)Reclassifications from OCI – net of deferred taxes of $241, $(1,489) and $213 294 1,794 (129)Other comprehensive income (loss)(b) (1,311) (3,137) (2,730)Less OCI attributable to noncontrolling interests 6 (66) (19)Balance at December 31 $ (6,816) $ (5,499) $ (2,428) Cash flow hedges Balance at January 1 $ (80) $ (180) $ (414)OCI before reclassifications – net of deferred taxes of $(41), $(21) and $22 (234) (732) (609)Reclassifications from OCI – net of deferred taxes of $37, $86 and $34 327 831 844Other comprehensive income (loss)(b) 93 99 234Less OCI attributable to noncontrolling interests - - -Balance at December 31 $ 12 $ (80) $ (180) Benefit plans Balance at January 1 $ (11,410) $ (16,578) $ (9,296)Prior service credit (costs) - net of deferred taxes of $46, $859 and $219 128 1,541 396Net actuarial gain (loss) – net of deferred taxes of $(1,062), $647 and $(5,332) (3,074) 1,227 (9,849)Net curtailment/settlement - net of deferred taxes of $12, $(42) and $41 19 (76) 72Prior service cost amortization – net of deferred taxes of $84, $103 and $241 62 100 349Net actuarial loss amortization – net of deferred taxes of $870, $1,199 and $859 1,797 2,373 1,753Other comprehensive income (loss)(b) (1,068) 5,165 (7,278)Less OCI attributable to noncontrolling interests (9) (3) 3Balance at December 31 $ (12,469) $ (11,410) $ (16,578) Accumulated other comprehensive income (loss) at December 31 $ (18,598) $ (16,529) $ (18,172)
(a) Included adjustments of $57 million, $(611) million and $960 million in 2016, 2015 and 2014, respectively, to deferred acquisition costs, present value of futureprofits, and investment contracts, insurance liabilities and insurance annuity benefits in our run-off insurance operations to reflect the effects that would have beenrecognized had the related unrealized investment securities holding gains and losses actually been realized.
(b) Total other comprehensive income (loss) was $(2,083) million, $1,575 million and $(9,066) million in 2016, 2015 and 2014, respectively.
GE 2016 FORM 10-K 178


RECLASSIFICATION OUT OF AOCI (In millions) 2016 2015 2014 Statement of earnings caption Available-for-sale securities Realized gains (losses) on sale/impairment of securities $ (63) $ 103 $ (231) Total revenues and other income(a) Income taxes 30 (36) 85 Benefit (provision) for income taxes(b) Net of tax $ (34) $ 67 $ (146) Currency translation adjustments Gains (losses) on dispositions $ (535) $ (305) $ (85) Total revenues and other income(c) Income taxes 241 (1,489) 213 Benefit (provision) for income taxes(d) Net of tax $ (294) $ (1,794) $ 129 Cash flow hedges Gains (losses) on interest rate derivatives $ (79) $ (130) $ (234) Interest and other financial charges Foreign exchange contracts (247) (801) (666) (e) Other (38) 13 22 (f) Total before tax (364) (918) (878) Income taxes 37 86 34 Benefit (provision) for income taxes Net of tax $ (327) $ (831) $ (844) Benefit plan items Curtailment gain (loss) $ (31) $ 118 $ (113) (g) Amortization of prior service costs (146) (203) (590) (g) Amortization of actuarial gains (losses) (2,667) (3,572) (2,612) (g) Total before tax (2,844) (3,657) (3,315) Income taxes 966 1,260 1,141 Benefit (provision) for income taxes Net of tax $ (1,878) $ (2,397) $ (2,174) Total reclassification adjustments (net of tax) $ (2,533) $ (4,956) $ (3,035) (a) Included $(70) million, $61 million and an insignificant amount in 2016, 2015 and 2014, respectively, in earnings (loss) from discontinued operations, net of taxes.
(b) Included $32 million, $(30) million and $3 million in 2016, 2015 and 2014, respectively, in earnings (loss) from discontinued operations, net of taxes.
(c) Included $(453) million, $(224) million and $(51) million in 2016, 2015 and 2014, respectively, in earnings (loss) from discontinued operations, net of taxes.
(d) Included $241 million, $(1,506) million and $213 million in 2016, 2015 and 2014, respectively, in earnings (loss) from discontinued operations, net of taxes.
(e) Included $(182) million, $(758) million and $(607) million in GE Capital revenues from services and $(65) million, $(43) million and $(59) million in interest and otherfinancial charges in 2016, 2015 and 2014, respectively.
(f) Primarily recorded in costs and expenses.
(g) Curtailment gain (loss), amortization of prior service costs and actuarial gains and losses reclassified out of AOCI are included in the computation of net periodicpension costs. See Notes 12 and 29 for further information.
NONCONTROLLING INTERESTS
Noncontrolling interests in equity of consolidated affiliates includes common shares in consolidated affiliates and preferred stock issued by our affiliates.
Prior to the fourth quarter of 2015, the preferred stock issued by GECC was classified as noncontrolling interests in our consolidated Statement of FinancialPosition, with dividends presented as noncontrolling interest in our consolidated Statement of Earnings. As discussed previously in this note, this preferred stockwas converted to a corresponding series of preferred stock issued by GE and on January 20, 2016 a substantial majority of those shares were exchanged intoGE Series D preferred stock. Effective with these changes, the preferred stock issued by GE is reflected in our shareowners' equity and dividends are presentedas a reduction of net earnings attributable to GE in the statement of earnings (under the caption "Preferred stock dividends") for the year ended December 31,2015 and subsequently.
GE 2016 FORM 10-K 179

CHANGES TO NONCONTROLLING INTERESTS (In millions) 2016 2015 2014 Balance at January 1 $ 1,864 $ 8,674 $ 6,217Net earnings (loss) (46) 377 183GECC preferred stock(a) - (4,949) -GECC preferred stock dividend - (311) (322)Dividends (72) (43) (74)Dispositions (232) 189 (81)Synchrony Financial(b) - (2,840) 2,393Other (including AOCI)(c)(d)(e)(f) 150 767 358Balance at December 31 $ 1,663 $ 1,864 $ 8,674 (a) Included $(4,949) million related to the issuance of GE preferred stock in exchange for existing GECC preferred stock in 2015. GE preferred stock is reflected in
shareowners' equity in the consolidated Statement of Financial Position.(b) Related to the split-off of Synchrony Financial from GE in 2015, where GE shares were exchanged for shares of Synchrony Financial; related to the Synchrony
Financial IPO in 2014.(c) Included $695 million related to the Alstom acquisition in 2015.(d) Included $155 million related to Arcam AB acquisition in our Aviation segment in 2016.(e) Included $(123) million for deconsolidation of investment funds managed by GE Asset Management (GEAM) upon the adoption of ASU 2015-2, Amendmentstothe
ConsolidationAnalysisin 2016. See Note 1.(f) Includes research & development partner funding arrangements, acquisitions and eliminations.
REDEEMABLE NONCONTROLLING INTERESTS
Redeemable noncontrolling interest presented in our Statement of Financial Position includes common shares issued by our affiliates that are redeemable at theoption of the holder of those interests.
As part of the Alstom acquisition, we formed three joint ventures in which the noncontrolling interests hold certain redemption rights. These joint ventures andthe associated redemption rights are discussed in Note 8. Our retained earnings will be adjusted for subsequent changes in the redemption value of thenoncontrolling interest in these entities to the extent that the redemption value exceeds the carrying amount of the noncontrolling interest.
CHANGES TO REDEEMABLE NONCONTROLLING INTERESTS (In millions) 2016 2015 2014 Balance at January 1 $ 2,972 $ 98 $ 178Net (loss) (244) (46) (71)Dividends (17) (11) (12)Redemption value adjustment 266 25 2Other(a)(b) 49 2,906 1Balance at December 31 $ 3,025 $ 2,972 $ 98 (a) Included $2,875 million related to joint ventures formed by GE and Alstom as part of the Alstom acquisition in 2015.(b) Included $204 million related to the Concept Laser GmbH acquisition in our Aviation segment in 2016.
OTHER
Common dividends from GE Capital to GE totaled $20,118 million, $4,311 million and $3,000 million for the years ended 2016, 2015 and 2014, respectively.Dividends on GE preferred stock totaled $656 million and $18 million, including cash dividends of $332 million and $8 million for the years ended 2016 and2015, respectively. There were no dividends on GE preferred stock in 2014.
GE 2016 FORM 10-K 180

NOTE 16. OTHER STOCK-RELATED INFORMATION
SHARE-BASED COMPENSATION
We grant stock options, restricted stock units and performance share units to employees under the 2007 Long-Term Incentive Plan. Grants made under all plansmust be approved by the Management Development and Compensation Committee of GE's Board of Directors, which is composed entirely of independentdirectors.
STOCK OPTIONS
Under our stock option program, an employee receives an award that provides the opportunity in the future to purchase GE shares at the market price of ourstock on the date the award is granted (the strike price). The options become exercisable in equal amounts over a five-year vesting period and expire 10 yearsfrom the grant date if they are not exercised. Stock options have no financial statement effect on the date they are granted but rather are reflected over timethrough recording compensation expense and increasing shareowners' equity. We record compensation expense based on the estimated fair value of theawards expected to vest, and that amount is amortized as compensation expense on a straight-line basis over the five-year vesting period. Accordingly, totalexpense related to the award is reduced by the fair value of options that are expected to be forfeited by employees that leave GE prior to vesting. We estimateforfeitures based on our experience and adjust the expense to reflect actual forfeitures over the vesting period. The offset to the expense we record is reflectedas an increase in the "Other capital" component of shareowners' equity.
(In millions, after tax) 2016 2015 2014 Compensation expense $ 207 $ 234 $ 215
We estimate the fair value of each stock option award on the date of grant using a Black-Scholes option pricing model. The table below provides the weighted-average grant-date fair values, key assumptions and other inputs into the pricing model. With the exception of the dividend yield assumption, an increase in anyindividual assumption will increase the estimated fair value of the option, all other things being equal.
2016 2015 2014 Weighted-average grant-date fair value of stock options $ 3.61 $ 4.64 $ 5.26 Stock Option Valuation Assumptions: Risk-free interest rate 1.4% 2.0% 2.3% Dividend yield 3.4% 3.4% 3.1% Expected volatility 20.0% 25.0% 26.0% Expected option life (in years) 6.5 6.8 7.3 Other pricing model inputs: Weighted-average grant-date market price of GE stock (strike price) $ 29.63 $ 25.79 $ 26.11
GE 2016 FORM 10-K 181

The table below shows the amount and weighted-average strike price of options granted during 2016, as well as those outstanding and exercisable at year-end2016.
As of December 31, 2016 unless, otherwise stated (in thousands, except per-share data) Stock options granted during 2016 30,948Weighted-average strike price of awards granted in 2016 $ 29.63Stock options outstanding 420,303Weighted-average strike price of stock options outstanding $ 22.29Stock options exercisable 301,952Weighted-average strike price of stock options exercisable $ 20.73
When an employee exercises an option, we issue treasury shares to satisfy the requirements of the option.
2016 2015 2014 Stock options exercised (in thousands) 56,973 65,764 30,433 Cash received from stock options exercised (in millions) $ 1,037 $ 1,098 $ 439
Outstanding stock option awards may be dilutive to earnings per share when they are in the money (the market price of GE stock is greater than the strike priceof the option). When an option is dilutive, it increases the number of shares used in the diluted earnings per share calculation, which will decrease earnings pershare. However, the effect stock options have on the number of shares added to the diluted earnings per share calculation is not one-for-one. The averageamount of unrecognized compensation expense (the portion of the fair value of these option awards not yet amortized) and the market price of GE stock duringthe reporting period affect how many of these potential shares are included in the calculation. The calculation assumes that the proceeds received from theexercise and the unrecognized compensation expense are used to buy back shares, which reduces the dilutive impact.
As of December 31, 2016, there was $427 million of unrecognized compensation expense related to unvested options, which will be amortized over theremaining vesting period (the weighted-average period is approximately 2 years). Of that total, approximately $118 million, after tax, is estimated to be recordedas compensation expense in 2017.
The dilutive effect of in-the-money options on our earnings per share from continuing operations has been $0.01 or less per share (1% or less) for the last threeyears. See Note 18 for additional information about earnings per share .
RESTRICTED STOCK
A restricted stock award provides an employee with the right to receive shares of GE stock when the restrictions lapse, which occurs in equal amounts over thevesting period. Upon vesting, each unit of restricted stock is converted into GE common stock on a one-for - one basis using treasury stock shares. The expenseto be recognized on a restricted stock unit is based upon the market price on the grant date (which is its fair value) multiplied by the number of units expected tovest. Accordingly, total expense related to the award is reduced by the fair value of restricted stock units that are expected to be forfeited by employees thatleave GE prior to lapse of the restrictions. That amount is amortized as compensation expense on a straight-line basis over a five-year vesting period. Weestimate forfeitures based on our experience and adjust the expense to reflect actual forfeitures over the vesting period. The offset to compensation expense isan increase in the "Other capital" component of shareowners' equity.
(In millions, after tax) 2016 2015 2014 Compensation expense(a) $ 90 $ 72 $ 56(a) Included $11 million of compensation expense related to performance share units in 2016 .
GE 2016 FORM 10-K 182

The fair value of a restricted stock unit at the grant date is equal to the market price of our stock on the grant date.
2016 2015 2014 Weighted-average grant-date fair value of restricted stock awards $ 30.20 $ 26.74 $ 26.08
As of December 31, 2016, unless otherwise stated (in thousands, except per-share data) Restricted stock units granted during 2016 8,933Non-vested restricted stock units outstanding 17,859Weighted-average fair value at grant date of non-vested stock $ 27.72
The table below provides information about the units of restricted stock that vested for each of the years presented.
(In thousands) 2016 2015 2014 Restricted stock units vested during the year ended 4,427 3,899 3,305
As of December 31, 2016, there was $346 million of total unrecognized compensation expense related to unvested restricted stock units, which will be amortizedover the remaining vesting period (the weighted-average period is approximately 2 years). Of that total, approximately $75 million, after tax, is estimated to berecorded as compensation expense in 2017 .
OTHER INFORMATION
When options are exercised and restricted stock units vest, we issue shares from treasury stock , which increases shares outstanding. The "Other capital"component of shareowners' equity is adjusted for differences between the strike price of GE stock and the average cost of our treasury stock. We also recordthe difference between the tax benefits assumed (based on the fair value of the award on the grant date) and the actual tax benefit in our provision for incometaxes. Any excess tax benefit is recorded as cash flows from operating activities in our Statement of Cash Flows. The table below provides information about taxbenefits related to all share-based compensation arrangements.
(In millions) 2016 2015 2014 Income tax benefit recognized in earnings $ 274 $ 148 $ 147 Excess of actual tax deductions over amounts assumed recognized in equity(a) - 167 86 (a) We adopted ASU 2016-09 in September 2016. The primary effects of adoption were the recognition of excess tax benefits in our provision for income taxes rather
than paid-in capital and the reclassification of cash flows related to excess tax benefits from a financing activity to an operating activity for the periods beginningJanuary 1, 2016. See Note 1 for further information.
Share-based compensation programs serve as a means to attract and retain talented employees and are an important element of their total compensation. Theintrinsic value of a stock option award is the amount by which the award is in the money and represents the potential value to the employee upon exercise of theoption. The intrinsic value of restricted stock units is the value of the shares awarded at the current market price. The table below provides information about theintrinsic value of option and restricted stock awards. Aggregate intrinsic As of December 31, 2016, unless otherwise stated (in millions) value Stock options outstanding $ 3,984 Stock options exercised in 2016 723 Non-vested restricted stock units outstanding 564 Restricted stock units vested in 2016 137
GE 2016 FORM 10-K 183

NOTE 17. OTHER INCOME
(In millions) 2016 2015 2014 GE Purchases and sales of business interests(a) $ 3,701 $ 1,020 $ 188Licensing and royalty income 175 168 288Associated companies 76 45 176Net interest and investment income(b) 167 65 (77)Other items(c) (27) 868 132
4,092 2,165 707Eliminations (87) 62 71Total $ 4,005 $ 2,227 $ 778
(a) Included a pre-tax gain of $3,136 million on the sale of our Appliances business and $398 million on the sale of GE Asset Management in 2016. Included a pre-tax
gain of $623 million on the sale of our Signaling business in 2015. See Note 2.(b) Included other-than-temporary impairments on investment securities of $(217) million in 2014.(c) In 2015, included a $450 million NBCU tax settlement and a $175 million break-up fee from Electrolux. Included net gains on asset sales of $101 million, $90 million
and $127 million in 2016, 2015 and 2014, respectively.
NOTE 18. EARNINGS PER SHARE INFORMATION
2016 2015 2014(In millions; per-share amounts in dollars) Diluted Basic Diluted Basic Diluted Basic Amounts attributable to the Company: Consolidated Earnings (loss) from continuing operations for per-share calculation(a)(b) $ 9,764 $ 9,769 $ 1,680 $ 1,679 $ 9,523 $ 9,523Preferred stock dividends declared (656) (656) (18) (18) - -Earnings (loss) from continuing operations attributable to common shareowners for per-share calculation(a)(b) $ 9,108 $ 9,113 $ 1,662 $ 1,661 $ 9,523 $ 9,523Earnings (loss) from discontinued operations for per-share calculation(a)(b) (955) (950) (7,795) (7,795) 5,691 5,691Net earnings (loss) attributable to GE common shareowners for per-share calculation(a)(b) $ 8,157 $ 8,163 $ (6,135) $ (6,135) $ 15,213 $ 15,212 Average equivalent shares Shares of GE common stock outstanding 9,025 9,025 9,944 9,944 10,045 10,045Employee compensation-related shares (including stock options) and warrants 105 - 72 - 78 -Total average equivalent shares 9,130 9,025 10,016 9,944 10,123 10,045 Per-share amounts Earnings (loss) from continuing operations $ 1.00 $ 1.01 $ 0.17 $ 0.17 $ 0.94 $ 0.95Earnings (loss) from discontinued operations (0.10) (0.11) (0.78) (0.78) 0.56 0.57Net earnings (loss) 0.89 0.90 (0.61) (0.62) 1.50 1.51 Our unvested restricted stock unit awards that contain non-forfeitable rights to dividends or dividend equivalents are considered participating securities and, therefore, areincluded in the computation of earnings per share pursuant to the two-class method. Application of this treatment had an insignificant effect.
(a) Included a dilutive adjustment of an insignificant amount of dividend equivalents in each of the three years presented.(b) Included in 2016 is a dilutive adjustment for the change in income for forward purchase contracts that may be settled in stock.
For the years ended December 31, 2016, 2015 and 2014, there were approximately 22 million, 97 million and 98 million, respectively, of outstanding stockawards that were not included in the computation of diluted earnings per share because their effect was antidilutive.
In December 2016, we entered into an ASR agreement to repurchase shares of GE common stock. See Note 15 for additional information. The initial delivery of59,177,215 shares resulted in an immediate reduction of the outstanding shares used to calculate the weighted-average common shares outstanding for basicand diluted earnings per share. GE has determined that the forward contract, indexed to its own common stock, met all the criteria for equity classification. Therewas no dilutive impact on earnings per share related to the forward contract.
GE 2016 FORM 10-K 184

Earnings-per-share amounts are computed independently for earnings (loss) from continuing operations, earnings (loss) from discontinued operations and netearnings (loss). As a result, the sum of per-share amounts from continuing operations and discontinued operations may not equal the total per-share amountsfor net earnings.
NOTE 19. FAIR VALUE MEASUREMENTS
RECURRING FAIR VALUE MEASUREMENTS
Our assets and liabilities measured at fair value on a recurring basis include investment securities mainly supporting obligations to annuitants and policyholdersin our run-off insurance operations and derivatives.
ASSETS AND LIABILITIES MEASURED AT FAIR VALUE ON A RECURRING BASIS Netting (In millions) Level 1(a) Level 2(a) Level 3 adjustment(b) Net balanceDecember 31, 2016 Assets Investment securities Debt U.S. corporate $ - $ 19,647 $ 3,399 $ - $ 23,046 State and municipal - 4,163 73 - 4,236 Mortgage and asset-backed - 2,852 9 - 2,861 Corporate – non-U.S. - 11,299 688 - 11,987 Government – non-U.S. - 1,262 - - 1,262 U.S. government and federal agency - 482 232 - 714 Equity 188 14 6 - 208Derivatives(c) - 5,444 23 (5,121) 345Total $ 188 $ 45,163 $ 4,429 $ (5,121) $ 44,658 Liabilities Derivatives $ - $ 4,880 $ 2 $ (4,449) $ 434Other(e) - 1,143 - - 1,143Total $ - $ 6,024 $ 2 $ (4,449) $ 1,577 December 31, 2015 Assets Investment securities Debt U.S. corporate $ - $ 19,351 $ 3,006 $ - $ 22,358 State and municipal - 4,215 30 - 4,245 Mortgage and asset-backed - 3,084 32 - 3,116 Corporate – non-U.S. 12 544 290 - 847 Government – non-U.S. 5 410 - - 415 U.S. government and federal agency 49 404 323 - 776 Equity 194 9 13 - 216Derivatives(c) - 7,312 79 (6,110) 1,281Other(d) - - 259 - 259Total $ 260 $ 35,331 $ 4,033 $ (6,110) $ 33,512Liabilities Derivatives $ - $ 5,677 $ 4 $ (4,968) $ 713Other(e) - 1,182 - - 1,182Total $ - $ 6,860 $ 4 $ (4,968) $ 1,895 (a) There were $12 million of Corporate – non-U.S. securities and $50 million of U.S. government and federal agency securities transferred from Level 1 to Level 2 in the
twelve months ended December 31, 2016 primarily attributable to changes in valuation approach. There were no securities transferred between Level 1 and Level 2in the year ended December 31, 2015.
(b) The netting of derivative receivables and payables (including the effects of any collateral posted or received) is permitted when a legally enforceable master nettingagreement exists.
(c) The fair value of derivatives includes an adjustment for non-performance risk. At December 31, 2016 and December 31, 2015, the cumulative adjustment for non-performance risk was $(3) million and insignificant, respectively. See Notes 20 and 29 for additional information on the composition of our derivative portfolio.
(d) Includes private equity investments.(e) Primarily represents the liabilities associated with certain of our deferred incentive compensation plans.
GE 2016 FORM 10-K 185

LEVEL3INSTRUMENTS
The majority of our Level 3 balances consist of investment securities classified as available-for-sale with changes in fair value recorded in shareowners' equity.
CHANGES IN LEVEL 3 INSTRUMENTS FOR THE YEARS ENDED DECEMBER 31 Net change in Net Net unrealized realized/ realized/ gains unrealized unrealized (losses) gains gains relating to (losses) (losses) Transfers Transfers instruments Balance at included in included into out of Balance at still held at(In millions) January 1 earnings(a) in AOCI Purchases Sales Settlements Level 3(b) Level 3(b) December 31 December 31(c)2016 Investment securities Debt U.S. corporate $ 3,006$ 9$ 137 $ 468 $ (70) $ (155) $ 32 $ (29) $ 3,399 $ - State and municipal 30 - 1 43 - (1) - - 73 - Mortgage and asset-backed 32 (19) 1 - - (6) - - 9 - Corporate – non-U.S. 290 28 - 461 (82) (1) 2 (10) 688 - U.S. government and federal agency 323 - (90) - - (1) - - 232 - Equity 13 (7) 2 - (1) (2) - - 6 -Derivatives(d)(e) 88 (18) - 1 - (59) - 8 21 (21)Other 259 - - - - - - (259) - -Total $ 4,042$ (7)$ 51 $ 974 $ (152) $ (226) $ 35 $ (290) $ 4,427 $ (21)2015 Investment securities Debt U.S. corporate $ 3,053$ 3$ (165) $ 362 $ (80) $ (137) $ - $ (30) $ 3,006 $ - State and municipal 58 - (2) - - (9) - (17) 30 - Mortgage and asset-backed 146 (19) (9) - (32) (4) - (49) 32 - Corporate – non-U.S. 337 - (6) 9 (49) (1) - - 290 - Government – non-U.S. 2 - - - - - - (2) - - U.S. government and federal agency 266 - 58 - - (1) - - 323 - Equity 9 2 (5) - - (4) 10 - 13 -Derivatives(d)(e) 29 25 - - - (6) 40 - 88 22Other 277 8 - - (26) - - - 259 5Total $ 4,175$ 19$ (128) $ 370 $ (187) $ (161) $ 51 $ (98) $ 4,042 $ 27 (a) Earnings effects are primarily included in the "GE Capital revenues from services" and "Interest and other financial charges" captions in the Statement of Earnings.(b) Transfers in and out of Level 3 are considered to occur at the beginning of the period. Transfers out of Level 3 for the twelve months ended December 31, 2016 were
primarily a result of the adoption of ASU 2015-02, AmendmentstotheConsolidationAnalysis. See Note 1.(c) Represents the amount of unrealized gains or losses for the period included in earnings.(d) Represents derivative assets net of derivative liabilities and includes cash accruals of none and $13 million not reflected in the fair value hierarchy table for the twelve
months ended December 31, 2016 and 2015, respectively.
(e) Gains (losses) included in net realized/unrealized gains (losses) included in earnings were offset by the earnings effects from the underlying items that wereeconomically hedged. See Notes 20 and 29 .
GE 2016 FORM 10-K 186

The following table represents non-recurring fair value amounts (as measured at the time of the adjustment) for those assets remeasured to fair value on a non-recurring basis during the fiscal year and still held at December 31, 2016 and December 31, 2015.
Remeasured during the years ended December 31 2016 2015(In millions) Level 2 Level 3 Level 2 Level 3 Financing receivables and financing receivables held for sale $ - $ 30 $ - $ 154Cost and equity method investments - 103 1 436Long-lived assets 17 1,055 2 882Total $ 17 $ 1,189 $ 3 $ 1,471
The following table represents the fair value adjustments to assets measured at fair value on a non-recurring basis and still held at December 31, 2016 and2015 .
December 31 (In millions) 2016 2015 Financing receivables and financing receivables held for sale $ (14) $ (69)Cost and equity method investments (44) (506)Long-lived assets (196) (1,603)Total $ (254) $ (2,177)
GE 2016 FORM 10-K 187

LEVEL 3 MEASUREMENTS - SIGNIFICANT UNOBSERVABLE INPUTS Range(Dollars in millions) Fair value Valuation technique Unobservable inputs (weighted-average) December 31, 2016 Recurring fair value measurements Investment securities – Debt U.S. corporate $ 809 Income approach Discount rate(a) 1.4%-17.4% (8.1%) State and municipal 20 Income approach Discount rate(a) 3.7%-3.7% (3.7%) Mortgage and asset-backed 1 Income approach Discount rate(a) 2.7%-6.9% (4.3%) Non-recurring fair value measurementsFinancing receivables and financing receivables held for sale $ 30 Income approach Discount rate(a) 2.5%-30.0% (20.3%) Cost and equity method investments 94 Income approach Discount rate(a) 9.0%-30.0% (11.8%) Long-lived assets 683 Income approach Discount rate(a) 2.5%-20.0% (10.4%) December 31, 2015 Recurring fair value measurements Investment securities – Debt U.S. corporate $ 834 Income approach Discount rate(a) 1.7%-14.1% (8.6%) Mortgage and asset-backed 31 Income approach Discount rate(a) 5.0%-12.0% (10.5%) Corporate – non-U.S. 236 Income approach Discount rate(a) 6.5%-14.0% (7.5%)Other financial assets 259 Income approach, EBITDA multiple 6.1X-15.0X (9.9X) Market comparables Capitalization rate 7.8%-7.8% (7.8%) Non-recurring fair value measurementsFinancing receivables and financing receivables held for sale $ 146 Income approach Discount rate(a) 6.5%-30.0% (10.7%) Cost and equity method investments 293 Income approach Discount rate(a) 9.5%-35.0% (14.4%) Long-lived assets 830 Income approach Discount rate(a) 1.8%-11.7% (10.5%) (a) Discount rates are determined based on inputs that market participants would use when pricing investments, including credit and liquidity risk. An increase in the
discount rate would result in a decrease in the fair value.
At December 31, 2016 and December 31, 2015, other Level 3 recurring fair value measurements of $3,598 million and $2,637 million, respectively, and non-recurring measurements of $379 million and $122 million, respectively, are valued using non-binding broker quotes or other third-party sources. At December31, 2016 and December 31, 2015, other recurring fair value measurements of an insignificant amount and $32 million, respectively, and non-recurring fair valuemeasurements of $2 million and $80 million, respectively, were individually insignificant and utilize a number of different unobservable inputs not subject tomeaningful aggregation.
GE 2016 FORM 10-K 188

NOTE 20. FINANCIAL INSTRUMENTSThe following table provides information about assets and liabilities not carried at fair value. The table excludes finance leases and non-financial assets andliabilities. Substantially all of the assets discussed below are considered to be Level 3. The vast majority of our liabilities' fair values can be determined based onsignificant observable inputs and thus considered Level 2. Few of the instruments are actively traded and their fair values must often be determined usingfinancial models. Realization of the fair value of these instruments depends upon market forces beyond our control, including marketplace liquidity.
2016 2015 Carrying Carrying amount Estimated amount EstimatedDecember 31 (In millions) (net) fair value (net) fair value GE Assets Investments and notes receivable $ 1,526 $ 1,595 $ 1,104 $ 1,174Liabilities Borrowings(a)(b) 19,184 19,923 18,397 18,954 Borrowings (debt assumed)(a)(c) 60,109 66,998 84,704 92,231 GE Capital Assets Loans 21,060 20,830 20,061 19,774 Time deposits(d) - - 10,386 10,386 Other commercial mortgages 1,410 1,472 1,381 1,447 Loans held for sale 473 473 342 342 Other financial instruments(e) 121 150 94 110Liabilities Borrowings(a)(f)(g)(h) 58,523 62,024 95,474 99,396 Investment contracts 2,813 3,277 2,955 3,441 (a) See Note 10.
(b) Included $115 million and $116 million of accrued interest in estimated fair value at December 31, 2016 and December 31, 2015, respectively.(c) Included $803 million and $1,006 million of accrued interest in estimated fair value at December 31, 2016 and December 31, 2015, respectively.(d) Balances at December 31, 2015 comprised high quality interest bearing deposits with European branches of global banks, predominantly in the U.K., that matured in
April 2016.(e) Principally comprises cost method investments.(f) Fair values exclude interest rate and currency derivatives designated as hedges of borrowings. Had they been included, the fair value of borrowings at December 31,
2016 and December 31, 2015 would have been reduced by $2,397 million and $3,001 million, respectively.(g) Included $775 million and $1,103 million of accrued interest in estimated fair value at December 31, 2016 and December 31, 2015, respectively.(h) Excluded $58,780 million and $84,704 million of intercompany payable to GE at December 31, 2016 and December 31, 2015 respectively, which includes a reduction
in the short-term intercompany payable to GE for a $(1,329) million loan to GE, which bears the right of offset against amounts owed under the assumed debtagreement. The remaining short-term loan balance was paid in January 2017.
A description of how we estimate fair values follows:
Loans. Based on a discounted future cash flows methodology, using current market interest rate data adjusted for inherent credit risk or quoted market pricesand recent transactions, if available.
Borrowings. Based on valuation methodologies using current market interest rate data that are comparable to market quotes adjusted for our non-performancerisk.
Investment contracts. Based on expected future cash flows, discounted at currently offered rates for immediate annuity contracts or the income approach forsingle premium deferred annuities.
Time deposits. Carrying value approximates fair value as these financial instruments have limited credit risk, short-term maturities and interest rates thatapproximate market.
GE 2016 FORM 10-K 189

All other instruments. Based on observable market transactions and/or valuation methodologies using current market interest rate data adjusted for inherentcredit risk.
Assets and liabilities that are reflected in the accompanying financial statements at fair value are not included in the above disclosures; such items include cashand equivalents, investment securities and derivative financial instruments.
Additional information about notional amounts of loan commitments follows.
NOTIONAL AMOUNTS OF LOAN COMMITMENTS December 31 (In millions) 2016 2015 Ordinary course of business lending commitments(a) $ 687 $ 531Unused revolving credit lines 238 279 (a) Excluded investment commitments of $522 million and $782 million at December 31, 2016 and December 31, 2015, respectively.
SECURITIES REPURCHASE AND REVERSE REPURCHASE ARRANGEMENTS
Our issuances of securities repurchase agreements are insignificant. No repurchase agreements were accounted for as off-book financing and we do notengage in securities lending transactions. At December 31, 2016, we were party to no repurchase agreements.
We also enter into reverse securities repurchase agreements, primarily for short-term investment with maturities of 90 days or less. At December 31, 2016, wewere party to reverse repurchase agreements totaling $6.9 billion, which were reported in cash and equivalents on the financial statements. Under these reversesecurities repurchase agreements, we typically lend available cash at a specified rate of interest and hold U.S. or highly-rated European government securitiesas collateral during the term of the agreement. Collateral value is in excess of amounts loaned under the agreements.
DERIVATIVES AND HEDGING
In this section, we explain how we use derivatives to manage our risks and how these financial instruments are reflected in our financial statements. Our use ofderivatives relates solely to risk management; we do not use derivatives for speculation. As discussed elsewhere in this report, we are executing a plan toreduce the size and scope of our financial services business, with the intention of principally retaining those activities that support our industrial businesses. Theaffected businesses have either been sold or are held for sale and are presented as discontinued operations in our financial statements as of December 31,2016. As a result of these actions, the significance of financial services hedging activity will diminish significantly in the future.
RISK MANAGEMENT STRATEGY
In our industrial businesses, we buy, manufacture and sell components and products across global markets. These activities expose us to changes in foreigncurrency exchange rates and commodity prices, which can adversely affect revenues earned and costs of operating our industrial businesses. When thecurrency in which we sell equipment differs from the primary currency of one of our industrial businesses (known as its functional currency) and the exchangerate fluctuates, it will affect the revenue we earn on the sale. These sales and purchase transactions also create receivables and payables denominated inforeign currencies, which expose us to foreign currency gains and losses based on changes in exchange rates. Changes in the price of a raw material that weuse in manufacturing can affect the cost of manufacturing. We use derivatives to mitigate or eliminate these exposures.
With respect to our ongoing financial services activities, our key exposures relate to interest rate and currency risk. To the extent feasible, we seek to ensurethat the characteristics of the debt we have issued align with the assets being funded. The form (fixed rate or floating rate) and currency denomination of thedebt we issue depends on a number of considerations, the most important of which are market factors (demand, pricing, etc.) that affect the economics of theissuance. If the form and currency denomination of the debt does not match the assets being funded, we typically execute derivatives to meet this objectivewithin defined limits.
GE 2016 FORM 10-K 190

FORMS OF HEDGING
In this section we explain the hedging methods we use and their effects on our financial statements.
Cash flow hedges – We use cash flow hedging primarily to reduce or eliminate the effects of foreign exchange rate changes on purchase and sale contracts inour industrial businesses and to convert foreign currency debt that we have issued in our financial services business back to our functional currency.Accordingly, the vast majority of our derivative activity in this category consists of currency exchange contracts. As a result of acquisitions in our industrialbusinesses, we expect to significantly expand our foreign currency hedging activity related to long-term contracts. We also use commodity derivatives to reduceor eliminate price risk on raw materials purchased for use in manufacturing.
Under hedge accounting, the derivative carrying amount is measured at fair value each period and any resulting gain or loss is recorded in a separatecomponent of shareowners' equity. Differences between the derivative and the hedged item may cause changes in their fair values to not offset completely,which is referred to as ineffectiveness. When the hedged transaction occurs, these amounts are released from shareowners' equity, in order that the transactionwill be reflected in earnings at the rate locked in by the derivative. The effect of the hedge is reported in the same financial statement line item as the earningseffects of the hedged transaction. The table below summarizes how the derivative is reflected in the balance sheet and in earnings under hedge accounting. Theeffect of the hedged forecasted transaction is not presented in this table but offsets the earnings effect of the derivative.
As part of our ongoing effort to reduce borrowings, we may repurchase debt that was in a cash flow hedge accounting relationship. At the time of determiningthat the debt cash flows are probable of not occurring, any related OCI will be released to earnings.
FINANCIAL STATEMENT EFFECTS - CASH FLOW HEDGES (In millions) 2016 2015 Balance sheet changes Fair value of derivatives increase (decrease) $ (274) $ (911) Shareowners' equity (increase) decrease 274 913 Earnings (loss) related to ineffectiveness 1 2Earnings (loss) effect of derivatives(a) (364) (918) (a) Offsets earnings effect of the hedged forecasted transaction
The following table explains the effect of changes in market rates on the fair value of derivatives we use most commonly in cash flow hedging arrangements.
Interest rate forwards/swaps Interest rate increases Interest rate decreases Pay fixed rate/receive floating rate Fair value increases Fair value decreases
Currency forwards/swaps U.S. dollar strengthens U.S. dollar weakens
Pay U.S. dollars/receive foreign currency Fair value decreases Fair value increases
Commodity derivatives Price increases Price decreases Receive commodity/ pay fixed price Fair value increases Fair value decreases
Fair value hedges – These derivatives are used to hedge the effects of interest rate and currency exchange rate changes on debt that we have issued. Wehave issued mostly fixed rate debt that is used to fund both fixed and floating rate assets. In instances where fixed rate debt is funding floating rate assets, wehave an exposure to changes in interest rates. We enter into interest rate swaps that receive a fixed rate and pay a floating rate of interest to align with thatportion of our debt which funds floating rate assets. These swaps typically match the maturity of the associated debt being hedged.
GE 2016 FORM 10-K 191

Under hedge accounting, the derivative is measured at fair value and the carrying amount of the hedged debt is adjusted for the change in value related to theexposure being hedged, with both adjustments offset to earnings as interest expense. For example, the earnings effect of an increase in the fair value of thederivative will be largely offset by the earnings effect of an increase in the carrying amount of the hedged debt. Differences between the terms of the derivativeand the hedged debt may cause changes in their fair values to not offset completely, which is referred to as ineffectiveness. The table below summarizes howthe derivative and the hedged debt are reflected in the balance sheet and in earnings under hedge accounting. The effect on interest expense of changing fromthe fixed rate on the debt to the floating rate on the swap is not shown in this table.
FINANCIAL STATEMENT EFFECTS - FAIR VALUE HEDGES (In millions) 2016 2015 Balance sheet changes Fair value of derivative increase (decrease) $ 170 $ (151) Adjustment to carrying amount of hedged debt (increase) decrease (433) 75 Earnings (loss) related to hedge ineffectiveness (263) (75)
The effect of changes in market interest rates on the fair value of derivatives we use most commonly in fair value hedging arrangements is presented below.
Interest rate forwards/swaps Interest rate increases Interest rate decreases Pay floating rate/receive fixed rate Fair value decreases Fair value increases
Net investment hedges – We invest in foreign operations that conduct their financial services activities in currencies other than the U.S. dollar. We hedge thecurrency risk associated with those investments primarily using short-term currency exchange contracts under which we receive U.S. dollars and pay foreigncurrency and non-derivatives instruments such as debt denominated in a foreign currency.
Under hedge accounting, the portion of the fair value change of the derivative or debt instrument that relates to changes in spot currency exchange rates isoffset in a separate component of shareowners' equity. For example, an increase in the fair value of the derivative related to changes in spot exchange rates willbe offset by a corresponding increase in the currency translation component of shareowners' equity. The portion of the fair value change of the derivative relatedto differences between spot and forward rates, which primarily relates to the interest component, is recorded in earnings each period as interest expense. As aresult of this hedging strategy, the investments in foreign operations of our financial services business are largely unaffected by changes in currency exchangerates. The amounts recorded in shareowners' equity only affect earnings if the hedged investment is sold, substantially liquidated, or control is lost.
FINANCIAL STATEMENT EFFECTS - NET INVESTMENT HEDGES (In millions) 2016 2015 Balance sheet changes Fair value of derivatives increase (decrease) $ 639 $ 4,871 Fair value of non-derivatives (increase) decrease 1,819 (849) Shareowners' equity (increase) decrease (2,376) (4,131) Earnings (loss) related to spot-forward differences 82 (109)Earnings (loss) related to reclassification upon sale or liquidation(a) (528) 4,547(a) Included $(529) million and $4,549 million recorded in discontinued operations in the twelve months ended December 31, 2016 and 2015, respectively.
The effect of changes in currency exchange rates on the fair value of derivatives we use in net investment hedging arrangements is presented below .
Currency forwards/swaps U.S. dollar strengthens U.S. dollar weakens Receive U.S. dollars/pay foreign currency Fair value increases Fair value decreases
GE 2016 FORM 10-K 192

Economic Hedges - These derivatives are not designated as hedges from an accounting standpoint (and therefore we do not apply hedge accounting to therelationship) but otherwise serve the same economic purpose as other hedging arrangements. Economic hedges are used when changes in the carryingamount of the hedged item are already recorded in earnings in the same period as the derivative, making hedge accounting unnecessary. For example, in ourindustrial businesses we record the effects of spot exchange rate changes on our foreign currency payables and receivables in earnings each period along withthe fair value changes on the foreign currency forward contracts used as economic hedges. In these cases, the earnings effects of the derivative and hedgeditem largely offset. We also use economic hedges when we have exposures to currency exchange risk for which we are unable to meet the requirements forhedge accounting. For example, we use currency forwards as an economic hedge of forecasted foreign currency cash flows under long-term contracts. In thiscase, the forecast period is so long that it is difficult to meet the hedge accounting requirement that the occurrence of the hedged transactions is probable. Forthese types of economic hedges, changes in the fair value of the derivative are recorded in earnings currently but changes in the value of the forecasted foreigncurrency cash flows are only recognized in earnings when they occur. As a result, even though the derivative is an effective economic hedge, there is a neteffect on earnings in each period due to differences in the timing of earnings recognition between the derivative and the hedged item.
The table below provides information about the earnings effects of all derivatives that serve as economic hedges. These derivatives are marked to fair valuethrough earnings each period. For our financial services business, these gains and losses are reported in "GE Capital revenues from services". For our industrialbusinesses, the effects are reported in "Other income" or "Other costs and expenses". The offsetting earnings effects associated with hedged assets andliabilities are also displayed in the table below. In general, the earnings effects of the hedged item are recorded in the same financial statement line as thederivative. The earnings effect of economic hedges, after considering offsets related to earnings effects of hedged assets and liabilities, is substantially offset bychanges in the fair value of forecasted transactions that have not yet affected earnings.
FINANCIAL STATEMENT EFFECTS - ECONOMIC HEDGES (In millions) 2016 2015 Balance sheet changes Change in fair value of economic hedge increase (decrease) $ (2,456) $ (2,720) Change in carrying amount of item being hedged increase (decrease) 2,107 2,543 Earnings (loss) effect of economic hedges(a) (348) (177) (a) Offset by the future earnings effects of economically hedged item.
The table below explains the effects of market rate changes on the fair value of derivatives we use most commonly as economic hedges.
Interest rate forwards/swaps interest rate Interest rate increases Interest rate decreases Pay floating rate/receive fixed rate Fair value decreases Fair value increases
Currency forwards/swaps U.S. dollar strengthens U.S. dollar weakens
Pay U.S. dollars/receive foreign currency Fair value decreases Fair value increases Receive U.S. dollars/pay foreign currency Fair value increases Fair value decreases
Commodity derivatives Price increases Price decreases
Receive commodity/ pay fixed price Fair value increases Fair value decreases
NOTIONAL AMOUNT OF DERIVATIVES
The notional amount of a derivative is the number of units of the underlying (for example, the notional principal amount of the debt in an interest rate swap). Thenotional amount is used to compute interest or other payment streams to be made under the contract and is a measure of our level of activity. We generallydisclose derivative notional amounts on a gross basis. A substantial majority of the outstanding notional amount of $181 billion at December 31, 2016 is relatedto managing interest rate and currency risk between financial assets and liabilities in our financial services business. The remaining derivative notional amountprimarily relates to hedges of anticipated sales and purchases in foreign currency, commodity purchases and contractual terms in contracts that are consideredembedded derivatives.
GE 2016 FORM 10-K 193

The table below provides additional information about how derivatives are reflected in our financial statements. Derivative assets and liabilities are recorded atfair value exclusive of interest earned or owed on interest rate derivatives, which is presented separately on our Statement of Financial Position. Cash collateraland securities held as collateral represent assets that have been provided by our derivative counterparties as security for amounts they owe us (derivatives thatare in an asset position).
CARRYING AMOUNTS RELATED TO DERIVATIVES December 31 (In millions) 2016 2015 Derivative assets $ 5,467 $ 7,391Derivative liabilities (4,883) (5,681)Accrued interest 792 1,014Cash collateral & credit valuation adjustment (672) (1,141)Net Derivatives 703 1,583Securities held as collateral (442) (1,277)Net amount $ 262 $ 306
EFFECTS OF DERIVATIVES ON EARNINGS
All derivatives are marked to fair value on our balance sheet, whether they are designated in a hedging relationship for accounting purposes or are used aseconomic hedges. As discussed in the previous sections, each type of hedge affects the financial statements differently. In fair value and economic hedges,both the hedged item and the hedging derivative largely offset in earnings each period. In cash flow and net investment hedges, the effective portion of thehedging derivative is offset in separate components of shareowners' equity and ineffectiveness is recognized in earnings. The table below summarizes theseoffsets and the net effect on pre-tax earnings.
(In millions) Effect on hedging instrument Effect on underlying Effect on earnings 2016 Cash flow hedges $ (274) $ 274 $ 1Fair value hedges 170 (433) (263)Net investment hedges(a) 2,458 (2,376) 82Economic hedges(b) (2,456) 2,107 (348)Total $ (528)
2015 Cash flow hedges $ (911) $ 913 $ 2Fair value hedges (151) 75 (75)Net investment hedges(a) 4,022 (4,131) (109)Economic hedges(b) (2,720) 2,543 (177)Total $ (359) The amounts in the table above generally do not include associated derivative accruals in income or expense.
(a) Both derivatives and non-derivatives hedging instruments are included.(b) Net effect is substantially offset by the change in fair value of the hedged item that will affect earnings in future periods.
See Note 15 for additional information about changes in shareowners' equity related to hedging and amounts released to earnings. See Note 29 for othersupplemental information about derivatives and hedging.
GE 2016 FORM 10-K 194

NOTE 21. VARIABLE INTEREST ENTITIES (VIE)
A VIE is an entity that has one of three characteristics: (1) it is controlled by someone other than its shareowners or partners, (2) its shareowners or partners arenot economically exposed to the entity's earnings (for example, they are protected against losses), or (3) it was thinly capitalized when it was formed.
In the normal course of our business we become involved with VIEs either because we help create them or we invest in them. Our VIEs either provide goodsand services to customers or provide financing to third parties for the purchase of GE goods and services. If we control the VIE, we consolidate it and providedisclosures below. However, if the VIE is a business and use of its assets is not limited to settling its liabilities, ongoing disclosures are not required.
CONSOLIDATED VARIABLE INTEREST ENTITIES
Our most significant consolidated VIEs are the three joint ventures that were formed as part of the Alstom acquisition. These joint ventures include gridtechnology, renewable energy, and global nuclear and French steam power and have combined assets, liabilities and redeemable noncontrolling interest as ofDecember 31, 2016 and 2015 of $14,460 million, $9,922 million and $2,709 million and $11,536 million, $8,739 million and $2,859 million, respectively. Thesejoint ventures are considered VIEs because the equity held by Alstom does not participate fully in the earnings of the ventures due to the contractual featuresallowing Alstom to sell their interests back to GE. We consolidate these ventures because we control all their significant activities. These joint ventures are in allother respects regular businesses and are therefore exempt from ongoing disclosure requirements for VIEs provided below.
The table below provides information about VIEs that are subject to ongoing disclosure requirements. Substantially all of these entities were created to help ourcustomers finance the purchase of GE goods and services or to purchase GE current and customer notes receivable originating from sales of goods andservices. These entities have no features that could expose us to losses that would significantly exceed the difference between the consolidated assets andliabilities.
GE 2016 FORM 10-K 195

ASSETS AND LIABILITIES OF CONSOLIDATED VIEs GE Capital Current Customer
(In millions) GE receivables(a) Notesreceivables(b) Other Total
December 31, 2016 Assets Financing receivables, net $ - $ - $ - $ 1,035 $ 1,035Current receivables 57 - 670 - 727Investment securities - - - 982 982Other assets 492(c) - 1,122 1,747 3,361Total $ 549 $ - $ 1,792 $ 3,764 $ 6,105 Liabilities Borrowings $ 1 $ - $ - $ 818 $ 819Non-recourse borrowings - - 401 16 417Other liabilities 457(c) - 1,378 1,482 3,317Total $ 458 $ - $ 1,779 $ 2,316 $ 4,553 December 31, 2015 Assets Financing receivables, net $ - $ - $ - $ 882 $ 882Current receivables 385 3,506 - - 3,891Investment securities - - - 1,404 1,404Other assets 2,482 24 - 1,068 3,574Total $ 2,867 $ 3,530 $ - $ 3,354 $ 9,751 Liabilities Borrowings $ 221 $ - $ - $ 960 $ 1,181Non-recourse borrowings - 3,022 - 61 3,083Other liabilities 2,289 34 - 1,234 3,557Total $ 2,510 $ 3,056 $ - $ 2,255 $ 7,821 (a) In the second quarter of 2016, we completed the sale of our Appliances business to Haier and sold all of the Appliances current receivables purchased by the
securitization trust to Haier for $773 million. At December 31, 2015, the current receivables securitization included $737 million of current receivables purchased fromAppliances.In the fourth quarter of 2016, we completed the restructure of our Receivables Facility described in Note 22. The restructured facility does not use a consolidated VIE.
(b) In the first quarter of 2016, two funding vehicles were established to purchase customer notes receivable from GE, one of which is partially funded by third-party debt.(c) In the first quarter of 2016, we purchased the minority interest in an Oil & Gas joint venture and as a result the entity is no longer a VIE. Consolidated VIE assets and
liabilities were reduced by $1,240 million and $1,284 million, respectively.
Total revenues from our consolidated VIEs were $1,141 million, $1,638 million and $1,457 million for the years ended December 31, 2016, 2015 and 2014,respectively. Related expenses consisted primarily of cost of goods and services of $692 million, $1,232 million and $823 million for the years ended December31, 2016, 2015 and 2014, respectively.
Where we provide servicing for third-party investors, we are contractually permitted to commingle cash collected from customers on financing receivables sold tothird-party investors with our own cash prior to payment to third-party investors, provided our short-term credit rating does not fall below A-1/P1. These third-party investors also owe us amounts for purchased financial assets and scheduled interest and principal payments. At December 31, 2016 and 2015, theamounts of commingled cash owed to the third-party investors were $1,117 million and $1,093 million, respectively, and the amounts owed to us by third-partyinvestors were $5 million and $7 million, respectively.
UNCONSOLIDATED VARIABLE INTEREST ENTITIES
We become involved with unconsolidated VIEs primarily through assisting in the formation and financing of the entity. We do not consolidate these entitiesbecause we do not have power over decisions that significantly affect their economic performance. Our investments in unconsolidated VIEs, at December 31,2016 and 2015 were $6,346 million and $787 million, respectively. Obligations to make additional investments in these entities are not significant.
GE 2016 FORM 10-K 196

Our investments in long-lived, capital-intensive energy limited partnerships through Energy Financial Services became non-consolidated VIEs in accordancewith our January 2016 adoption of ASU 2015-2, AmendmentstotheConsolidatedAnalysis(see Note 1). In these partnerships we are the sole limited partnerand had no participating rights or substantive removal rights over the general partners. The general partners of these entities, who possess the technical andindustry expertise necessary to operate and manage their activities, continue to control these limited partnerships. As a result of this accounting change, ourdisclosed investments in unconsolidated VIEs increased by $6,077 million, without additional funds being advanced to these entities.
NOTE 22. RECEIVABLES FACILITY
Since 2002, the Company, as part of its working capital management, has sold current receivables to trusts in which third-party investors invest (the ReceivablesFacility). We use the cash generated from those sales to fund GE working capital earlier than we would otherwise receive payment from our customers and tomanage credit exposures.
In 2010, we consolidated the trust that existed at that time pursuant to a change in the accounting guidance and subsequently reported both current receivablesowned by the trust and the associated non-recourse third-party debt of the trust as assets and liabilities of a consolidated VIE on the Statement of FinancialPosition. Our economic exposure to the sold receivables remained the same before and after we consolidated the trust.
In the fourth quarter of 2016, we completed a refinancing of the Receivables Facility. The total facility size remained at $3,000 million. As a result of thisrefinancing, the current receivables are now purchased directly by third-party investors, who make their own arrangements to fund the purchase, and we nolonger use the trust we used prior to the refinancing. Upon sale of the receivables, we receive proceeds of cash and a deferred purchase price (DPP). The DPPis an interest in specified assets of the purchasers (the receivables sold by GE Capital) that entitles GE Capital to the residual cash flows of those specifiedassets. The third-party purchasers have no recourse to other assets of GE Capital in the event of non-payment by the debtors. Where the purchasing entity is abank multi-seller commercial paper conduit, assets transferred by other parties to that entity form a majority of the entity's assets.
The amount of customer receivables sold and outstanding under the Receivables Facility at December 31, 2016 was $2,575 million, and the consolidatedcustomer receivables financed by third-party investors at December 31, 2015 was $3,506 million.
The amount of DPP due to GE Capital was $483 million at December 31, 2016, and is classified as "Current receivables" in the consolidated column of theStatement of Financial Position and as "Financing receivables" in the GE Capital column of the Statement of Financial Position.
Because of the refinancing, GE Capital's financing receivables decreased by approximately $2,092 million as of December 31, 2016 when compared toDecember 31, 2015. The Company's economic exposure under the Receivables Facility, represented by the DPP, remained the same before and after wecompleted the refinancing of the Receivables Facility.
Given the short-term nature of the underlying receivables, discount rates and prepayments are not factors in determining the value of the DPP. Collections onthe DPP are presented within Cash flows from operating activities in the consolidated column in the Statement of Cash Flows. As the performance of thetransferred current receivables is similar to the performance of our other current receivables, delinquencies are not expected to be significant.
GE 2016 FORM 10-K 197

NOTE 23. COMMITMENTS, GUARANTEES, PRODUCT WARRANTIES AND OTHER LOSS CONTINGENCIES
COMMITMENTS
The GE Capital Aviation Services (GECAS) business in GE Capital had placed multiple-year orders for various Boeing, Airbus and other aircraft manufacturerswith list prices approximating $32,958 million and secondary orders with airlines for used aircraft of approximately $1,275 million at December 31, 2016. In ourAviation segment, we had committed to provide financing assistance of $2,230 million of future customer acquisitions of aircraft equipped with our engines .
GUARANTEES
Our guarantees are provided in the ordinary course of business. We underwrite these guarantees considering economic, liquidity and credit risk of thecounterparty. We believe that the likelihood is remote that any such arrangements could have a significant adverse effect on our financial position, results ofoperations or liquidity. We record liabilities for guarantees at estimated fair value, generally the amount of the premium received, or if we do not receive apremium, the amount based on appraisal, observed market values or discounted cash flows. Any associated expected recoveries from third parties are recordedas other receivables, not netted against the liabilities.
At December 31, 2016, we were committed under the following guarantee arrangements beyond those provided on behalf of VIEs. See Note 21 .
Credit Support. We have provided $1,352 million of credit support on behalf of certain customers or associated companies, predominantly joint ventures andpartnerships, using arrangements such as standby letters of credit and performance guarantees. These arrangements enable these customers and associatedcompanies to execute transactions or obtain desired financing arrangements with third parties. Should the customer or associated company fail to perform underthe terms of the transaction or financing arrangement, we would be required to perform on their behalf. Under most such arrangements, our guarantee issecured, usually by the asset being purchased or financed, or possibly by certain other assets of the customer or associated company. The length of thesecredit support arrangements parallels the length of the related financing arrangements or transactions. The liability for such credit support was $44 million atDecember 31, 2016 .
Indemnification Agreements – Continuing Operations .We have agreements that require us to fund up to $222 million at December 31, 2016 under residualvalue guarantees on a variety of leased equipment. Under most of our residual value guarantees, our commitment is secured by the leased asset. The liabilityfor these indemnification agreements was $7 million at December 31, 2016.
At December 31, 2016, we also had $973 million of other indemnification commitments, substantially all of which relate to representations and warranties insales of businesses or assets. The liability for these indemnification commitments was $228 million at December 31, 2016 .
Indemnification Agreements – Discontinued Operations. At December 31, 2016 , we provided specific indemnifications to buyers of GE Capital's assetsthat amounted to $2,638 million, for which we have recognized related liabilities of $285 million. In addition, in connection with the 2015 public offering and saleof Synchrony Financial, GE Capital indemnified Synchrony Financial and its directors, officers, and employees against the liabilities of GECC's businesses otherthan historical liabilities of the businesses that are part of Synchrony Financial's ongoing operations.
Contingent Consideration. These are agreements to provide additional consideration to a buyer or seller in a business combination if contractually specifiedconditions related to the acquisition or disposition are achieved. Amount of contingent consideration was insignificant at December 31, 2016.
GE 2016 FORM 10-K 198

PRODUCT WARRANTIES
We provide for estimated product warranty expenses when we sell the related products. Because warranty estimates are forecasts that are based on the bestavailable information – mostly historical claims experience – claims costs may differ from amounts provided. An analysis of changes in the liability for productwarranties follows.
(In millions) 2016 2015 2014 Balance at January 1 $ 1,723 $ 1,199 $ 1,370Current-year provisions 791 649 593Expenditures (729) (718) (714)Other changes(a) 135 593 (50)Balance at December 31 $ 1,920 $ 1,723 $ 1,199 (a) Included $634 million related to Alstom acquisition in 2015 .
OTHER LOSS CONTINGENCIES
LEGAL MATTERS
WMC. During the fourth quarter of 2007, we completed the sale of WMC, our U.S. mortgage business. WMC substantially discontinued all new loan originationsby the second quarter of 2007, and is not a loan servicer. In connection with the sale, WMC retained certain representation and warranty obligations related toloans sold to third parties prior to the disposal of the business and contractual obligations to repurchase previously sold loans that had an early payment default.All claims received by WMC for early payment default have either been resolved or are no longer being pursued. The remaining active claims have been brought by securitization trustees or administrators seeking recovery from WMC for alleged breaches of representationsand warranties on mortgage loans that serve as collateral for residential mortgage-backed securities (RMBS). At December 31, 2016, such claims consisted of$1,060 million of individual claims generally submitted before the filing of a lawsuit (compared to $2,887 million at December 31, 2015) and $5,456 million ofadditional claims asserted against WMC in litigation without making a prior claim (Litigation Claims) (compared to $8,047 million at December 31, 2015). Thetotal amount of these claims, $6,516 million, reflects the purchase price or unpaid principal balances of the loans at the time of purchase and does not giveeffect to pay downs or potential recoveries based upon the underlying collateral, which in many cases are substantial, nor to accrued interest or fees. WMCbelieves that repurchase claims brought based upon representations and warranties made more than six years before WMC was notified of the claim would bedisallowed in legal proceedings under applicable law and the June 11, 2015 decision of the New York Court of Appeals in ACE Securities Corp. v. DB StructuredProducts, Inc., on the statute of limitations period governing such claims.
Reserves related to repurchase claims made against WMC were $626 million at December 31, 2016, reflecting a net decrease to reserves in the year endedDecember 31, 2016 of $249 million due to settlements partially offset by incremental provisions. The reserve estimate takes into account recent settlementactivity and is based upon WMC's evaluation of the remaining exposures as a percentage of estimated lifetime mortgage loan losses within the pool of loanssupporting each securitization for which timely claims have been asserted in litigation against WMC. Settlements in prior periods reduced WMC's exposure onclaims asserted in certain securitizations and the claim amounts reported above give effect to these settlements .
ROLLFORWARD OF THE RESERVE (In millions) 2016 2015 Balance at January 1 $ 875 $ 809Provision 91 212Claim resolutions / rescissions (340) (146)Balance at December 31 $ 626 $ 875
GE 2016 FORM 10-K 199

Given the significant litigation activity and WMC's continuing efforts to resolve the lawsuits involving claims made against WMC, it is difficult to assess whetherfuture losses will be consistent with WMC's past experience. Adverse changes to WMC's assumptions supporting the reserve may result in an increase to thesereserves. WMC estimates a range of reasonably possible loss from $0 to approximately $500 million over its recorded reserve at December 31, 2016. Thisestimate involves significant judgment and may not reflect the range of uncertainties and unpredictable outcomes inherent in litigation, including the mattersdiscussed in Legal Proceedings and potential changes in WMC's legal strategy. This estimate excludes any possible loss associated with an adverse courtdecision on the applicable statute of limitations or an adverse outcome in the Financial Institutions Reform, Recovery, and Enforcement Act of 1989 (FIRREA)investigation discussed in Legal Proceedings, as WMC is unable at this time to develop such a meaningful estimate.
At December 31, 2016, there were 10 lawsuits involving claims made against WMC arising from alleged breaches of representations and warranties onmortgage loans included in 11 securitizations. The adverse parties in these cases are securitization trustees or parties claiming to act on their behalf. OnJanuary 23, 2017, the ResCap Liquidating Trust, as successor to Residential Funding Company, LLC (RFC), filed a lawsuit against WMC in the United StatesDistrict Court for the District of Minnesota arising from alleged breaches in representations and warranties made by WMC in connection with the sale ofapproximately $840 million in loans to RFC over a period of time preceding RFC's filing for bankruptcy protection in May 2012. Although the alleged claims forrelief vary from case to case, the complaints and counterclaims in these actions generally assert claims for breach of contract, indemnification, and/ordeclaratory judgment, and seek specific performance (repurchase of defective mortgage loan) and/or money damages. Adverse court decisions, including incases not involving WMC, could result in new claims and lawsuits on additional loans. However, WMC continues to believe that it has defenses to the claimsasserted in litigation, including, for example, based on causation and materiality requirements and applicable statutes of limitations. It is not possible to predictthe outcome or impact of these defenses and other factors, any of which could materially affect the amount of any loss ultimately incurred by WMC on theseclaims.
WMC has also received indemnification demands, nearly all of which are unspecified, from depositors/underwriters/sponsors of RMBS in connection withlawsuits brought by RMBS investors concerning alleged misrepresentations in the securitization offering documents to which WMC is not a party or, in twocases, involving mortgage loan repurchase claims made against RMBS sponsors. WMC believes that it has defenses to these demands.
To the extent WMC is required to repurchase loans, WMC's loss also would be affected by several factors, including pay downs, accrued interest and fees, andthe value of the underlying collateral. The reserve and estimate of possible loss reflect judgment, based on currently available information, and a number ofassumptions, including economic conditions, claim and settlement activity, pending and threatened litigation, court decisions regarding WMC's legal defenses,indemnification demands, government activity, and other variables in the mortgage industry. Actual losses arising from claims against WMC could exceed theseamounts and additional claims and lawsuits could result if actual claim rates, governmental actions, litigation and indemnification activity, adverse courtdecisions, actual settlement rates or losses WMC incurs on repurchased loans differ from its assumptions .
FINANCIAL INFORMATION FOR WMC (In millions) 2016 2015 2014 Total revenues and other income (loss) $ (8) $ (184) $ (291) Earnings (loss) from discontinued operations, net of taxes $ (52) $ (146) $ (199)
Alstom legacy matters . On November 2, 2015, we acquired the Thermal, Renewables and Grid businesses from Alstom. Prior to the acquisition, the sellerwas the subject of two significant cases involving anti-competitive activities and improper payments: (1) in January 2007, Alstom was fined €65 million by theEuropean Commission for participating in a gas insulated switchgear cartel that operated from 1988 to 2004 (that fine was later reduced to €59 million), and (2)in December 2014, Alstom pled guilty in the United States to multiple violations of the Foreign Corrupt Practices Act and paid a criminal penalty of $772 million.As part of GE's accounting for the acquisition, we established a reserve amounting to $858 million for legal and compliance matters related to the legacybusiness practices that were the subject of these and related cases in various jurisdictions.
GE 2016 FORM 10-K 200

Regardless of jurisdiction, the allegations relate to claimed anti-competitive conduct or improper payments in the pre-acquisition period as the source of legalviolations and/or damages. Given the significant litigation and compliance activity related to these matters and our ongoing efforts to resolve them, it is difficult toassess whether the disbursements will ultimately be consistent with the reserve established. The estimation of this reserve involved significant judgment andmay not reflect the full range of uncertainties and unpredictable outcomes inherent in litigation and investigations of this nature. Damages sought may includedisgorgement of profits on the underlying business transactions, fines and/or penalties, interest, or other forms of resolution. Factors that can affect the ultimateamount of losses associated with these matters include the way cooperation is assessed and valued, prosecutorial discretion in the determination of damages,formulas for determining fines and penalties, the duration and amount of legal and investigative resources applied, and political and social influences within eachjurisdiction, among other considerations. Actual losses arising from claims in these matters could exceed the amount provided. At this time, we are unable todevelop a meaningful estimate of the range of reasonably possible additional losses for this exposure.
ENVIRONMENTAL MATTERS
Our operations, like operations of other companies engaged in similar businesses, involve the use, disposal and cleanup of substances regulated underenvironmental protection laws. We are involved in numerous remediation actions to clean up hazardous wastes as required by federal and state laws. Liabilitiesfor remediation costs exclude possible insurance recoveries and, when dates and amounts of such costs are not known, are not discounted. When thereappears to be a range of possible costs with equal likelihood, liabilities are based on the low end of such range. It is reasonably possible that our environmentalremediation exposure will exceed amounts accrued. However, due to uncertainties about the status of laws, regulations, technology and information related toindividual sites, such amounts are not reasonably estimable. Total reserves related to environmental remediation and asbestos claims, were $1,767 million atDecember 31, 2016.
GE 2016 FORM 10-K 201

NOTE 24. INTERCOMPANY TRANSACTIONSTransactions between related companies are made on an arms-length basis and are reported in the GE and GE Capital columns of our financial statements, butare eliminated in deriving our consolidated financial statements. These transactions include, but are not limited to, the following:
· GE Capital dividends to GE,· GE Capital working capital solutions to optimize GE cash management,· GE Capital enabled GE industrial orders, and· Aircraft engines, power equipment and healthcare equipment manufactured by GE that are installed on GE Capital investments, including leased
equipment.
In addition to the above transactions that primarily enable growth for the GE businesses, there are routine related party transactions, which include, but are notlimited to, the following:
· Expenses related to parent-subsidiary pension plans,· Buildings and equipment leased between GE and GE Capital, including sale-leaseback transactions,· Information technology (IT) and other services sold to GE Capital by GE, and· Various investments, loans and allocations of GE corporate overhead costs.
Presented below is a walk of intercompany eliminations from the unconsolidated GE and GE Capital totals to the consolidated cash flows .
(In millions) 2016 2015 2014 Cash from (used for) operating activities-continuing operations Combined $ 28,408 $ 17,891 $ 21,434 GE current receivables sold to GE Capital 697 (856) (1,882) GE Capital dividends to GE (20,095) (4,300) (3,000) Other reclassifications and eliminations(a) (2,911) (879) (519)Total cash from (used for) operating activities-continuing operations $ 6,099 $ 11,856 $ 16,033Cash from (used for) investing activities-continuing operations Combined $ 58,134 $ 59,516 $ 17,252 GE current receivables sold to GE Capital (230) 1,261 1,730 GE Capital short-term loan to GE 1,329 - - Other reclassifications and eliminations(a) 3,380 836 247Total cash from (used for) investing activities-continuing operations $ 62,613 $ 61,613 $ 19,229Cash from (used for) financing activities-continuing operations Combined $ (107,750) $ (73,484) $ (44,340) GE current receivables sold to GE Capital (467) (405) 152 GE Capital dividends to GE 20,095 4,300 3,000 GE Capital short-term loan to GE (1,329) - - Other reclassifications and eliminations(a) (469) 42 276Total cash from (used for) financing activities-continuing operations $ (89,920) $ (69,547) $ (40,912) (a) Includes eliminations of other cash flows activities including those related to GE Capital enabled GE industrial orders, various investments, loans and allocations of
GE corporate overhead costs.
GE 2016 FORM 10-K 202

NOTE 25. OPERATING SEGMENTS
BASIS FOR PRESENTATION
Our operating businesses are organized based on the nature of markets and customers. Segment accounting policies are the same as described andreferenced in Note 1. Segment results for our financial services businesses reflect the discrete tax effect of transactions.
A description of our operating segments as of December 31, 2016, can be found below, and details of segment profit by operating segment can be found in theSummary of Operating Segments table in "Management's Discussion and Analysis of Financial Condition and Results of Operations" section in this Form 10-KReport.
POWER
Power plant products and services, including design, installation, operation and maintenance services are sold into global markets. Gas, steam andaeroderivative turbines, nuclear reactors, generators, combined cycle systems, controls and related services, including total asset optimization solutions,equipment upgrades and long-term maintenance service agreements are sold to power generation and other industrial customers. Water treatment services andequipment include specialty chemical treatment programs, water purification equipment, mobile treatment systems and desalination processes.
RENEWABLE ENERGY
Renewable Energy makes power from renewable sources affordable, accessible, and reliable for the benefit of people everywhere. With one of the broadesttechnology portfolios in the industry, Renewable Energy creates value for customers by providing technology and services in the Onshore Wind Power industry,high-yield offshore wind turbines as well as a full range of solutions, products and services to serve the hydropower industry , from initial design to finalcommissioning .
OIL & GAS
Oil & Gas supplies mission critical equipment for the global oil and gas industry, used in applications spanning the entire value chain from drilling and completionthrough production, liquefied natural gas (LNG) and pipeline compression, pipeline inspection, and including downstream processing in refineries andpetrochemical plants. The business designs and manufactures surface and subsea drilling and production systems, equipment for floating production platforms,compressors, turbines, turboexpanders, high pressure reactors, industrial power generation and a broad portfolio of auxiliary equipment.
AVIATION
Aviation products and services include jet engines, aerospace systems and equipment, replacement parts and repair and maintenance services for allcategories of commercial aircraft; for a wide variety of military aircraft, including fighters, bombers, tankers and helicopters; for marine applications; and forexecutive and regional aircraft. Products and services are sold worldwide to airframe manufacturers, airlines and government agencies.
HEALTHCARE
Healthcare products include diagnostic imaging systems such as magnetic resonance (MR), computed tomography (CT) and positron emission tomography(PET) scanners, X-ray, surgical & interventional imaging, nuclear imaging, digital mammography and molecular imaging technologies. Healthcare-manufacturedtechnologies include patient and resident monitoring, diagnostic cardiology, ultrasound, bone densitometry, anesthesiology and oxygen therapy, and neonataland critical care devices. Related services include equipment monitoring and repair, digital technologies and customer productivity services. Products alsoinclude diagnostic imaging agents used in medical scanning procedures, drug discovery, biopharmaceutical manufacturing and purification, and tools for proteinand cellular analysis for pharmaceutical and academic research, including a pipeline of precision molecular diagnostics in development for neurology, cardiologyand oncology applications. Products and services are sold worldwide to hospitals, medical facilities, pharmaceutical and biotechnology companies, and to thelife science research market.
GE 2016 FORM 10-K 203

TRANSPORTATION
Transportation is a global technology leader and supplier to the railroad, mining, marine and drilling industries. GE provides freight and passenger locomotives,diesel engines for rail, marine and stationary power applications, railway signaling and communications systems, underground mining equipment, motorizeddrive systems for mining trucks, information technology solutions, high-quality replacement parts and value added services.
ENERGY CONNECTIONS & LIGHTING
Energy Connections is GE's electrification business. Global teams design leading technology solutions for the delivery, management, conversion andoptimization of electrical power for customers across multiple energy-intensive industries. GE has invested in our Energy Connections capabilities, with strategicacquisitions and joint ventures that enable GE to increase its offerings to the utility, industrial, renewable energy, oil and gas, marine, metals and miningindustries. Plant automation hardware, software and embedded computing systems including controllers, embedded systems, advanced software, motioncontrol, operator interfaces and industrial computers are also provided by Energy Connections.
Lighting includes the GE Lighting and Current, powered by GE (Current) businesses. GE Lighting is focused on driving innovation and growth in light emittingdiode (LED) and connected home technology in the U.S. Lighting offers LEDs in a variety of shapes, sizes, wattages and color temperatures. It's also investingin the growing smart home category, building a suite of connected lighting products with simple connection points that offer new opportunities to do more athome. Current delivers energy efficiency and productivity solutions for commercial and industrial customers. We combine infrastructure technology like LED andsolar with new sensor-enabled data networks and Predix-based digital applications to help our customers reduce energy costs, better predict spend and gainbusiness productivity insights. We partner with a wide variety of digital companies to help expand our app catalog, and we offer flexible financing solutions thathelp our customers achieve faster payback periods and better long-term value .
CAPITAL
Capital is the financial services division of GE focused on customers and markets aligned with GE's industrial businesses, whether in developed economies oremerging markets. We provide financial products and services around the globe, that are geared to utilize GE's industry specific expertise in aviation, energy,infrastructure, and healthcare to capitalize on market-specific opportunities. In addition, we continue to operate our run-off insurance activities as part of ourcontinuing operations.
REVENUES Total revenues(a) Intersegment revenues(b) External revenues(In millions) 2016 2015 2014 2016 2015 2014 2016 2015 2014 Power $ 26,827 $ 21,490 $ 20,580 $ 640 $ 762 $ 778 $ 26,187 $ 20,728 $ 19,802Renewable Energy 9,033 6,273 6,399 11 12 14 9,022 6,261 6,386Oil & Gas 12,898 16,450 19,085 383 387 402 12,515 16,063 18,683Aviation 26,261 24,660 23,990 730 418 692 25,530 24,242 23,298Healthcare 18,291 17,639 18,299 15 7 6 18,276 17,633 18,293Transportation 4,713 5,933 5,650 1 1 (2) 4,713 5,932 5,652Energy Connections & Lighting 15,133 16,351 15,724 1,059 1,021 912 14,074 15,329 14,812 Total industrial 113,156 108,796 109,727 2,839 2,608 2,801 110,316 106,188 106,926Capital 10,905 10,801 11,320 1,288 1,151 1,037 9,617 9,650 10,283Corporate items and eliminations (368) (2,211) (3,863) (4,127) (3,759) (3,838) 3,760 1,548 (25)Total $ 123,693 $ 117,386 $ 117,184 $ - $ - $ - $ 123,693 $ 117,386 $ 117,184 (a) Revenues of GE businesses include income from sales of goods and services to customers and other income.(b) Sales from one component to another generally are priced at equivalent commercial selling prices.
Revenues from customers located in the United States were $53,317 million, $53,238 million and $51,147 million in 2016, 2015 and 2014, respectively.Revenues from customers located outside the United States were $70,376 million, $64,148 million and $66,038 million in 2016, 2015 and 2014, respectively.
GE 2016 FORM 10-K 204

Property, plant and Assets(a) equipment additions(b) Depreciation and amortization At December 31 For the years ended December 31 For the years ended December 31(In millions) 2016 2015 2014 2016 2015 2014 2016 2015 2014 Power $ 55,474 $ 51,908 $ 26,698 $ 769 $ 2,122 $ 578 $ 1,130 $ 712 $ 563Renewable Energy 8,794 9,468 3,572 166 999 41 37 116 113Oil & Gas 24,615 26,126 27,329 284 422 656 529 596 585Aviation 38,899 34,524 33,716 1,328 1,260 1,197 900 855 824Healthcare 28,639 28,162 29,227 432 284 405 785 799 843Transportation 4,288 4,368 4,449 108 202 128 159 179 169Energy Connections & Lighting 17,858 21,587 15,536 354 1,348 535 441 426 548Capital(c) 187,804 316,069 502,204 3,769 7,570 3,818 2,515 2,584 2,612Corporate items and eliminations(d) (1,187) 858 11,201 94 (297) (111) 341 231 164Total $ 365,183 $ 493,071 $ 653,931 $ 7,305 $ 13,911 $ 7,247 $ 6,836 $ 6,499 $ 6,421 (a) Total assets of Power, Renewable Energy, Oil & Gas, Aviation, Healthcare, Transportation, Energy Connections & Lighting and Capital operating segments at
December 31, 2016, include investments in and advances to associated companies of $405 million, $9 million, $88 million, $1,779 million, $366 million, $6 million,$752 million and $7,673 million, respectively. Investments in and advances to associated companies contributed approximately $(17) million, $(4) million, $4 million,$75 million, $19 million, $46 million and $363 million to segment pre-tax income of Power, Renewable Energy, Oil & Gas, Aviation, Healthcare, Energy Connections& Lighting and Capital operating segments, respectively, and Transportation an insignificant amount, for the year ended December 31, 2016.
(b) Additions to property, plant and equipment include amounts relating to principal businesses purchased.
(c) Includes Capital discontinued operations
(d) Includes deferred income taxes that are presented as assets for purposes of our consolidating balance sheet presentation.
Interest and other financial charges Provision (benefit) for income taxes(In millions) 2016 2015 2014 2016 2015 2014 Capital $ 3,790 $ 2,301 $ 1,638 $ (1,431) $ 4,979 $ (861)Corporate items and eliminations(a) 1,234 1,162 1,085 967 1,506 1,634Total $ 5,025 $ 3,463 $ 2,723 $ (464) $ 6,485 $ 773 (a) Included amounts for Power, Renewable Energy, Oil & Gas, Aviation, Healthcare, Transportation and Energy Connections & Lighting, for which our measure of
segment profit excludes interest and other financial charges and income taxes.
Property, plant and equipment – net associated with operations based in the United States were $14,987 million, $14,273 million and $9,868 million atDecember 31, 2016, 2015 and 2014, respectively. Property, plant and equipment – net associated with operations based outside the United States were$35,531 million, $39,822 million and $38,201 million at December 31, 2016, 2015 and 2014, respectively.
NOTE 26. CASH FLOWS INFORMATION
Changes in operating assets and liabilities are net of acquisitions and dispositions of principal businesses.
Amounts reported in the "Proceeds from sales of discontinued operations" and "Proceeds from principal business dispositions" lines in the Statement of CashFlows are net of cash disposed and included certain deal-related costs. Amounts reported in the "Net cash from (payments for) principal businesses purchased"line is net of cash acquired and included certain deal-related costs and debt assumed and immediately repaid in acquisitions.
GE 2016 FORM 10-K 205

Amounts reported in the "All other operating activities" line in the Statement of Cash Flows consist primarily of adjustments to current and noncurrent accruals,deferrals of costs and expenses and adjustments to assets. Certain supplemental information related to our cash flows is shown below.
For the years ended December 31 (In millions) 2016 2015 2014 GE All other operating activities (Gains) losses on purchases and sales of business interests(a) $ (3,701) $ (1,020) $ (188) Contract assets (net)(b) (3,929) (1,919) (1,572) Income taxes(c) (2,752) 1,671 773 Interest charges 275 380 332 Principal pension plans(d) 3,071 4,265 3,368 Other (402) (1,294) 260 $ (7,438) $ 2,083 $ 2,973Net dispositions (purchases) of GE shares for treasury Open market purchases under share repurchase program(e) $ (22,581) $ (2,709) $ (2,211) Other purchases (399) (58) (49) Dispositions 1,550 1,668 1,042 $ (21,429) $ (1,099) $ (1,218)GE Capital All other operating activities Cash collateral on derivative contracts (428) (1,936) 738 Increase (decrease) in other liabilities (2,616) 4,860 (3,331) Other (10) 2,163 5,073 $ (3,054) $ 5,087 $ 2,480Net decrease (increase) in GE Capital financing receivables Increase in loans to customers $ (65,055) $ (65,306) $ (64,843) Principal collections from customers - loans 60,375 60,292 60,764 Investment in equipment for financing leases (690) (417) (535) Principal collections from customers - financing leases 856 734 841 Sales of financing receivables 3,235 4,923 3,612 $ (1,279) $ 226 $ (161)All other investing activities Purchases of investment securities $ (18,588) $ (7,790) $ (2,008) Dispositions and maturities of investment securities 7,343 9,587 2,723 Decrease (increase) in other assets - investments 9,202 (1,439) (287) Other(f) 3,682 (5,048) 24,146 $ 1,639 $ (4,690) $ 24,574Repayments and other reductions (maturities longer than 90 days) Short-term (91 to 365 days) $ (44,519) $ (42,110) $ (36,919) Long-term (longer than one year) (13,418) (2,455) (864) Principal payments - non-recourse, leveraged leases (348) (283) (304) $ (58,285) $ (44,848) $ (38,087)All other financing activities Proceeds from sales of investment contracts $ 19 $ 163 $ 322 Redemption of investment contracts (346) (1,235) (1,113) Other (800) (290) 112 $ (1,127) $ (1,362) $ (679) (a) Included pre-tax gains on sales of businesses reclassified to Proceeds from principal business dispositions within Cash flows from investing activities of $(3,136)
million for Appliances and $(398) million for GE Asset Management in 2016 and $(623) million for Signaling in 2015. See Note 17.(b) Contract assets are presented net of related billings in excess of revenues on our long-term product service agreements. See Note 9.(c) Reflected the effects of current tax expense (benefit) of $(140) million, $3,307 million and $2,110 million and net cash paid during the year for income taxes of
$(2,612) million, $(1,636) million and $(1,337) million for the years ended December 31, 2016, 2015 and 2014, respectively. Cash flows effects of deferred taxprovisions (benefits) are shown separately within cash flows from operating activities. See Note 14.
(d) Reflected the effects of pension costs of $3,623 million, $4,498 million and $3,604 million and employer contributions of $(552) million, $(233) million and $(236)million for the years ended December 31, 2016, 2015 and 2014, respectively. 2016 employer contributions included GE Pension Trust funding of $(330) millionrepresenting net sale proceeds associated with the sale of GE Asset Management. See Notes 2 and 12.
(e) Included $(11,370) million paid under ASR agreements in 2016.(f) Other primarily included net activity related to settlements between our continuing operations (primarily our treasury operations) and businesses in discontinued
operations.
GE 2016 FORM 10-K 206

NOTE 27. COST INFORMATION
RESEARCH & DEVELOPMENT
We conduct research and development (R&D) activities to continually enhance our existing products and services, develop new product and services to meetour customers' changing needs and requirements, and address new market opportunities.
Research and development expenses are classified in cost of goods and services sold in the Statement of Earnings. In addition, research and developmentfunding from customers, principally the U.S. government, is recorded as an offset to such costs. We also enter into research and development arrangementswith unrelated investors, which are generally formed through partnerships and consolidated within GE's financial statements. Research and development fundedthrough consolidated partnerships is classified within net earnings/loss attributable to noncontrolling interests.
(Inmillions) 2016 2015 2014 Total R&D $ 5,466 $ 5,278 $ 5,273Less customer funded R&D (principally the U.S. Government) (611) (803) (721)Less partner funded R&D (73) (226) (319)GE funded R&D $ 4,782 $ 4,249 $ 4,233 Of total Research and Development, the segments with the most significant expenditures for the years ended December 31, 2016, 2015 and 2014 were:Aviation $1,595 million, $1,893 million and $1,965 million, respectively; Healthcare $938 million, $905 million, and $817 million, respectively; and Power $695million, $721 million and $641 million, respectively. The remaining segments and Corporate, including Global Research Center, had combined expenditures of$2,238 million, $1,759 million and $1,850 million, for the years ended December 31, 2016, 2015 and 2014, respectively.
COLLABORATIVE ARRANGEMENTS
Our businesses enter into collaborative arrangements primarily with manufacturers and suppliers of components used to build and maintain certain engines,under which GE and these participants share in the risks and rewards of these product programs. GE's payments to participants are recorded as cost ofservices sold ($1,080 million, $788 million and $873 million for the years 2016, 2015 and 2014, respectively) or as cost of goods sold ($2,482 million, $2,736million and $2,660 million for the years 2016, 2015 and 2014, respectively).
RENTAL EXPENSE
Rental expense under operating leases is shown below.
(In millions) 2016 2015 2014 GE $ 1,528 $ 1,258 $ 1,356GE Capital 91 107 123 1,619 1,365 1,479Eliminations (126) (169) (223)Total $ 1,493 $ 1,196 $ 1,256
At December 31, 2016, minimum rental commitments under noncancellable operating leases aggregated $5,172 million and $302 million for GE and GE Capital,respectively. Amounts payable over the next five years follow.
(In millions) 2017 2018 2019 2020 2021 GE $ 942 $ 854 $ 742 $ 640 $ 537GE Capital 27 23 22 21 20 969 877 763 661 557Eliminations (171) (155) (143) (138) (130)Total $ 798 $ 722 $ 621 $ 524 $ 427
GE 2016 FORM 10-K 207

NOTE 28. GUARANTOR FINANCIAL INFORMATION
GUARANTOR AND NON-GUARANTOR CONDENSED CONSOLIDATING FINANCIAL INFORMATION
On October 26, 2015, GE Capital International Funding Company Unlimited Company, formerly GE Capital International Funding Company (the Issuer), then afinance subsidiary of General Electric Capital Corporation, settled its previously announced private offers to exchange (the Exchange Offers) the Issuer's newsenior unsecured notes for certain outstanding debt securities of General Electric Capital Corporation.
The new notes that were issued were composed of $15.3 billion of 0.964% six month notes due April 2016 (which have subsequently been repaid uponmaturity), £0.8 billion of 1.363% six month notes due April 2016 (which have subsequently been repaid upon maturity), $6.1 billion of 2.342% notes due 2020,$2.0 billion of 3.373% notes due 2025 and $11.5 billion of 4.418% notes due 2035. These notes were fully and unconditionally, jointly and severally guaranteedby both the Company and GE Capital International Holdings Limited (GECIHL) (each a Guarantor, and together, the Guarantors).
Under the terms of a registration rights agreement entered into in connection with the Exchange Offers, the Issuer and the Company agreed to file a registrationstatement with the U.S. Securities and Exchange Commission (SEC) for an offer to exchange new senior notes of the Issuer registered with the SEC andguaranteed by the Guarantors for certain of the Issuer's outstanding unregistered senior notes. This exchange was completed in July 2016.
PRESENTATION
In connection with the registration of the senior notes, the Company is required to provide certain financial information regarding the Issuer and the Guarantorsof the registered securities. Included are the Condensed Consolidating Statements of Earnings and Comprehensive Income for the years ended December 31,2016, 2015 and 2014, Condensed Consolidating Statements of Financial Position as of December 31, 2016 and December 31, 2015 and CondensedConsolidating Statements of Cash Flows for the years ended December 31, 2016, 2015 and 2014 for:
· General Electric Company (the Parent Company Guarantor) - prepared with investments in subsidiaries accounted for under the equity method ofaccounting and excluding any inter-segment eliminations. The equity basis earnings (losses) of subsidiaries are reflected in the captions "Equity inearnings (losses) of affiliates" and "Earnings (loss) from discontinued operations, net of taxes";
· GE Capital International Funding Company Unlimited Company (the Subsidiary Issuer) – incorporated in May 2015 as a finance subsidiary fordebt and reflects activity subsequent to the issuance of new notes on October 26, 2015;
· GE Capital International Holdings Limited (GECIHL) (the Subsidiary Guarantor) - prepared with investments in non-guarantor subsidiariesaccounted for under the equity method of accounting and reflects activity subsequent to the GE Capital Reorganization on December 3, 2015. Theequity basis earnings (losses) of subsidiaries are reflected in the captions "Equity in earnings (losses) of affiliates" and "Earnings (loss) fromdiscontinued operations, net of taxes";
· Non-Guarantor Subsidiaries - prepared on an aggregated basis excluding any elimination or consolidation adjustments and includes predominantlyall non-cash adjustments for cash flows;
· Consolidating Adjustments - adjusting entries necessary to consolidate the Parent Company Guarantor with the Subsidiary Issuer, the SubsidiaryGuarantor and Non-Guarantor Subsidiaries; and
· Consolidated - prepared on a consolidated basis .
GE 2016 FORM 10-K 208

CONDENSED CONSOLIDATING STATEMENT OF EARNINGS (LOSS) AND COMPREHENSIVE INCOME (LOSS)FOR THE YEAR ENDED DECEMBER 31, 2016 Parent Non- Company Subsidiary Subsidiary Guarantor Consolidating (in millions) Guarantor Issuer Guarantor Subsidiaries Adjustments Consolidated Revenues and other income Sales of goods and services $ 40,315$ -$ -$ 152,047$ (81,971) $ 110,391Other income 10,949 - - 63,363 (70,308) 4,005Equity in earnings (loss) of affiliates 1,397 - 1,542 116,897 (119,836) -GE Capital revenues from services - 897 1,419 12,994 (6,012) 9,297 Total revenues and other income 52,661 897 2,961 345,301 (278,127) 123,693 Costs and expenses Interest and other financial charges 3,505 831 2,567 5,429 (7,308) 5,025Investment contracts, insurance losses and insurance annuity benefits - - - 2,863 (67) 2,797Other costs and expenses 41,972 - 143 165,382 (100,656) 106,842 Total costs and expenses 45,478 831 2,711 173,674 (108,030) 114,663Earnings (loss) from continuing operations before income taxes 7,183 66 250 171,627 (170,097) 9,030Benefit (provision) for income taxes 2,539 (10) (105) (1,911) (49) 464Earnings (loss) from continuing operations 9,723 56 145 169,717 (170,146) 9,494Earnings (loss) from discontinued operations, net of taxes (891) - (1,927) 351 1,514 (954)Net earnings (loss) 8,831 56 (1,782) 170,067 (168,632) 8,540Less net earnings (loss) attributable to noncontrolling interests - - - (149) (142) (291)Net earnings (loss) attributable to the Company 8,831 56 (1,782) 170,216 (168,490) 8,831Other comprehensive income (2,069) (12) 1,126 (3,393) 2,279 (2,069)Comprehensive income (loss) attributable to the Company $ 6,762$ 44$ (657)$ 166,823$ (166,211) $ 6,762
CONDENSED CONSOLIDATING STATEMENT OF EARNINGS (LOSS) AND COMPREHENSIVE INCOME (LOSS) FOR THE YEAR ENDED DECEMBER 31, 2015 Parent Non- Company Subsidiary Subsidiary Guarantor Consolidating (in millions) Guarantor Issuer Guarantor Subsidiaries Adjustments Consolidated Revenues and other income Sales of goods and services $ 43,945$ -$ -$ 139,158$ (77,294) $ 105,809 Other income 2,725 - - 31,146 (31,644) 2,227 Equity in earnings (loss) of affiliates 1,815 - 437 389,796 (392,048) - GE Capital revenues from services - 250 (460) 36,909 (27,349) 9,350 Total revenues and other income 48,485 250 (23) 597,009 (528,335) 117,386 4
Costs and expenses Interest and other financial charges 3,127 232 284 9,037 (9,216) 3,463 Investment contracts, insurance losses and insurance annuity benefits - - - 2,748 (143) 2,605 Other costs and expenses 45,308 - 3 160,472 (102,651) 103,132 Total costs and expenses 48,435 232 287 172,257 (112,011) 109,200 Earnings (loss) from continuing operations before income taxes 50 18 (310) 424,752 (416,324) 8,186 Benefit (provision) for income taxes 1,314 (2) (9) (11,426) 3,639 (6,485) Earnings (loss) from continuing operations 1,364 15 (319) 413,326 (412,686) 1,700 Earnings (loss) from discontinued operations, net of taxes (7,490) - 483 (738) 250 (7,495) Net earnings (loss) (6,126) 15 164 412,588 (412,436) (5,795)

Less net earnings (loss) attributable to noncontrolling interests - - - 249 82 332 Net earnings (loss) attributable to the Company (6,126) 15 164 412,339 (412,518) (6,126) Other comprehensive income (loss) 1,644 12 1,377 (4,843) 3,454 1,644 Comprehensive income (loss) attributable to the Company $ (4,483)$ 27$ 1,542$ 407,496$ (409,065) $ (4,483)
GE 2016 FORM 10-K 209

CONDENSED CONSOLIDATING STATEMENT OF EARNINGS (LOSS) AND COMPREHENSIVE INCOME (LOSS) FOR THE YEAR ENDED DECEMBER 31, 2014 Parent Non- Company Subsidiary Subsidiary Guarantor Consolidating (in millions) Guarantor Issuer Guarantor Subsidiaries Adjustments Consolidated Revenues and other income Sales of goods and services $ 44,511$ -$ -$ 137,034$ (74,786) $ 106,758 Other income 1,722 - - 22,416 (23,360) 778 Equity in earnings (loss) of affiliates 10,510 - - 53,841 (64,351) - GE Capital revenues from services - - - 50,749 (41,101) 9,648 Total revenues and other income 56,743 - - 264,040 (203,598) 117,184 Costs and expenses Interest and other financial charges 3,014 - - 11,395 (11,686) 2,723 Investment contracts, insurance losses and insurance annuity benefits - - - 2,678 (148) 2,530 Other costs and expenses 46,128 - - 155,133 (99,593) 101,668 Total costs and expenses 49,142 - - 169,206 (111,427) 106,921 Earnings (loss) from continuing operations before income taxes 7,601 - - 94,833 (92,171) 10,263 Benefit (provision) for income taxes 1,777 - - (4,181) 1,631 (773) Earnings (loss) from continuing operations 9,378 - - 90,652 (90,540) 9,490 Earnings (loss) from discontinued operations, net of taxes 5,855 - - (27) 27 5,855 Net earnings (loss) 15,233 - - 90,625 (90,513) 15,345 Less net earnings (loss) attributable to noncontrolling interests - - - 2,893 (2,781) 112 Net earnings (loss) attributable to the Company 15,233 - - 87,733 (87,733) 15,233 Other comprehensive income (loss) (9,053) - - (2,787) 2,787 (9,053) Comprehensive income (loss) attributable to the Company $ 6,180$ -$ -$ 84,946$ (84,946) $ 6,180
GE 2016 FORM 10-K 210

CONDENSED CONSOLIDATING STATEMENT OF FINANCIAL POSITION DECEMBER 31, 2016 Parent Non- Company Subsidiary Subsidiary Guarantor Consolidating (In millions) Guarantor Issuer Guarantor Subsidiaries Adjustments Consolidated Assets Cash and equivalents $ 2,558$ -$ 3$ 46,994$ (1,426)$ 48,129 Investment securities 1 - - 47,394 (3,082) 44,313 Receivables - net 63,620 17,157 30,470 79,401 (148,385) 42,263 Inventories 4,654 - - 21,076 (3,377) 22,354 Property, plant and equipment - net 5,768 - - 46,366 (1,615) 50,518 Investment in subsidiaries(a) 272,685 - 80,481 492,674 (845,840) - Goodwill and intangible assets 8,128 - - 42,074 36,673 86,875 All other assets 14,692 44 39 201,276 (160,134) 55,917 Assets of discontinued operations - - - - 14,815 14,815 Total assets $ 372,107$ 17,202$ 110,992$ 977,255$ (1,112,372)$ 365,183 Liabilities and equity Short-term borrowings $ 167,089$ 1$ 46,432$ 25,919$ (208,727)$ 30,714 Accounts payable 5,412 - - 47,366 (38,343) 14,435 Other current liabilities 11,072 33 117 25,095 114 36,431 Long-term and non-recourse borrowings 68,983 16,486 34,389 68,912 (83,273) 105,496 All other liabilities 43,722 511 481 58,376 (9,656) 93,434 Liabilities of discontinued operations - - - - 4,158 4,158 Total Liabilities 296,279 17,030 81,419 225,667 (335,727) 284,668 Redeemable noncontrolling interests - - - 2,223 802 3,025 GE shareowners' equity 75,828 171 29,573 747,719 (777,463) 75,828 Noncontrolling interests - - - 1,647 16 1,663 Total equity 75,828 171 29,573 749,366 (777,447) 77,491 Total liabilities, redeemable noncontrolling interests and equity $ 372,107$ 17,202$ 110,992$ 977,255$ (1,112,372)$ 365,183 (a) Included within the subsidiaries of the Subsidiary Guarantor are cash and cash equivalent balances of $28.5 billion and net assets of discontinued operations of $6.0
billion.
GE 2016 FORM 10-K 211

CONDENSED CONSOLIDATING STATEMENT OF FINANCIAL POSITIONDECEMBER 31, 2015 Parent Non- Company Subsidiary Subsidiary Guarantor Consolidating (In millions) Guarantor Issuer Guarantor Subsidiaries Adjustments Consolidated Assets Cash and equivalents $ 4,137$ -$ -$ 86,955$ (20,609)$ 70,483Investment securities 14 - - 40,886 (8,927) 31,973Receivables - net 88,696 33,232 69,306 75,909 (221,286) 45,856Inventories 5,447 - - 19,762 (2,694) 22,515Property, plant and equipment - net 6,540 - - 56,808 (9,253) 54,095Investment in subsidiaries(a) 274,471 - 78,505 405,686 (758,662) -Goodwill and intangible assets 7,793 - - 61,412 14,118 83,323All other assets 15,732 11 915 247,611 (200,392) 63,876Assets of discontinued operations - - - - 120,951 120,951Total assets $ 402,828$ 33,242$ 148,725$ 995,029$ (1,086,754)$ 493,071 Liabilities and equity Short-term borrowings $ 145,051$ 16,204$ 71,862$ 60,601$ (243,858)$ 49,860Accounts payable 6,096 - - 37,636 (30,052) 13,680Other current liabilities 14,482 - 17 34,903 (7,861) 41,540Long-term and non-recourse borrowings 97,471 16,423 46,392 105,801 (118,345) 147,742All other liabilities 41,455 488 224 57,996 (9,513) 90,651Liabilities of discontinued operations - - - - 46,487 46,487Total Liabilities 304,555 33,115 118,495 296,937 (363,141) 389,961 Redeemable noncontrolling interests - - - 2,888 84 2,972 GE shareowners' equity 98,274 127 30,230 693,589 (723,946) 98,274Noncontrolling interests - - - 1,616 248 1,864Total equity 98,274 127 30,230 695,204 (723,697) 100,138Total liabilities, redeemable noncontrolling interests and equity $ 402,828$ 33,242$ 148,725$ 995,029$ (1,086,754)$ 493,071 (a) Included within the subsidiaries of the Subsidiary Guarantor are cash and cash equivalent balances of $40.1 billion and net assets of discontinued operations of
$58.6 billion.
GE 2016 FORM 10-K 212

CONDENSED CONSOLIDATING STATEMENT OF CASH FLOWSFOR THE YEAR ENDED DECEMBER 31, 2016 Parent Non- Company Subsidiary Subsidiary Guarantor Consolidating (In millions) Guarantor Issuer Guarantor Subsidiaries adjustments Consolidated Cash flows – operating activities Cash from (used for) operating activities - continuing operations $ (4,966)$ (10)$ (52)$ 162,918$ (151,791)$ 6,099Cash from (used for) operating activities - discontinued operations (891) - - (5,039) (413) (6,343)Cash from (used for) operating activities (5,858) (10) (52) 157,880 (152,204) (244) Cash flows – investing activities Cash from (used for) investing activities – continuing operations 14,158 16,384 35,443 72,205 (75,577) 62,613Cash from (used for) investing activities – discontinued operations - - - (13,412) - (13,412)Cash from (used for) investing activities 14,158 16,384 35,443 58,794 (75,577) 49,202 Cash flows – financing activities Cash from (used for) financing activities – continuing operations (9,879) (16,374) (35,388) (275,243) 246,964 (89,920)Cash from (used for) financing activities – discontinued operations - - - 789 - 789Cash from (used for) financing activities (9,879) (16,374) (35,388) (274,454) 246,964 (89,131)Effect of currency exchange rate changes on cash and equivalents - - - (1,146) - (1,146)Increase (decrease) in cash and equivalents (1,578) - 3 (58,927) 19,183 (41,319) Cash and equivalents at beginning of year 4,137 - - 107,351 (20,609) 90,879Cash and equivalents at end of year 2,558 - 3 48,423 (1,426) 49,558Less cash and equivalents of discontinued operations at end of year - - - 1,429 - 1,429Cash and equivalents of continuing operations at end of year $ 2,558$ -$ 3$ 46,994$ (1,426)$ 48,129
CONDENSED CONSOLIDATING STATEMENT OF CASH FLOWSFOR THE YEAR ENDED DECEMBER 31, 2015 Parent Non- Company Subsidiary Subsidiary Guarantor Consolidating (In millions) Guarantor Issuer Guarantor Subsidiaries adjustments Consolidated Cash flows – operating activities Cash from (used for) operating activities - continuing operations $ 13,587$ 68$ 631$ 433,479$ (435,909)$ 11,856Cash from (used for) operating activities - discontinued operations (7,490) - (30) 27,533 (11,979) 8,034Cash from (used for) operating activities 6,097 68 601 461,013 (447,888) 19,891 Cash flows – investing activities Cash from (used for) investing activities – continuing operations 7,106 (248) (601) (493,933) 549,289 61,613Cash from (used for) investing activities – discontinued operations - - - 5,854 (7,979) (2,125)Cash from (used for) investing activities 7,106 (248) (601) (488,079) 541,310 59,488 Cash flows – financing activities Cash from (used for) financing activities – continuing operations (13,886) 180 - 67,063 (122,904) (69,547)Cash from (used for) financing activities – discontinued operations - - - (37,582) 31,075 (6,507)

Cash from (used for) financing activities (13,886) 180 - 29,481 (91,829) (76,054)Effect of currency exchange rate changes on cash and equivalents - - - (3,464) - (3,464)Increase (decrease) in cash and equivalents (683) - - (1,049) 1,594 (138) Cash and equivalents at beginning of year 4,820 - - 108,400 (22,203) 91,017Cash and equivalents at end of year 4,137 - - 107,351 (20,609) 90,879Less cash and equivalents of discontinued operations at end of year - - - 20,395 - 20,395Cash and equivalents of continuing operations at end of year $ 4,137$ -$ -$ 86,955$ (20,609)$ 70,483
GE 2016 FORM 10-K 213

CONDENSED CONSOLIDATING STATEMENT OF CASH FLOWSFOR THE YEAR ENDED DECEMBER 31, 2014 Parent Non- Company Subsidiary Subsidiary Guarantor Consolidating (In millions) Guarantor Issuer Guarantor Subsidiaries adjustments Consolidated Cash flows – operating activities Cash from (used for) operating activities - continuing operations $ (2,483)$ -$ -$ 147,449$ (128,933)$ 16,033Cash from (used for) operating activities - discontinued operations 5,855 - - 5,794 27 11,676Cash from (used for) operating activities 3,372 - - 153,243 (128,906) 27,709 Cash flows – investing activities Cash from (used for) investing activities – continuing operations (1,410) - - (403,870) 424,509 19,229Cash from (used for) investing activities – discontinued operations - - - (24,263) - (24,263)Cash from (used for) investing activities (1,410) - - (428,133) 424,509 (5,034) Cash flows – financing activities Cash from (used for) financing activities – continuing operations (5,641) - - 272,150 (307,421) (40,912)Cash from (used for) financing activities – discontinued operations - - - 23,956 - 23,956Cash from (used for) financing activities (5,641) - - 296,106 (307,421) (16,956)Effect of currency exchange rate changes on cash and equivalents - - - (3,492) - (3,492)Increase (decrease) in cash and equivalents (3,679) - - 17,721 (11,818) 2,224 Cash and equivalents at beginning of year 8,499 - - 90,678 (10,385) 88,792Cash and equivalents at end of year 4,820 - - 108,400 (22,203) 91,017Less cash and equivalents of discontinued operations at end of year - - - 20,991 - 20,991Cash and equivalents of continuing operations at end of year $ 4,820$ -$ -$ 87,408$ (22,203)$ 70,025
GE 2016 FORM 10-K 214

NOTE 29. SUPPLEMENTAL INFORMATION
POSTRETIREMENT BENEFIT PLANS
As discussed in Note 12, we sponsor a number of pension plans which consist of the two principal pension plans for certain U.S. employees as well as otheraffiliate pension plans. In addition, we sponsor a number of postretirement health and life insurance benefit plans (retiree benefit plans).
The accounting requirements and concepts discussed in Note 12 Postretirement Benefit Plans are the same for other pension plans and principal retiree benefitplans and are consistently applied.
The following disclosures provide additional information with respect to our pension plans and principal retiree benefit plans.
Other pension plans in 2016 included 49 U.S. and non-U.S. pension plans with pension assets or obligations greater than $50 million.
Principal Retiree Benefit Plans provide health and life insurance benefits to eligible participants and these participants share in the cost of healthcare benefits.
COST OF BENEFIT PLANS Other pension plans Principal retiree benefit plans(In millions) 2016 2015 2014 2016 2015 2014 Service cost for benefits earned $ 462 $ 416 $ 403 $ 123 $ 145 $ 164Prior service cost (credit) amortization 1 - 6 (164) (8) 353Expected return on plan assets (1,034) (881) (789) (43) (48) (50)Interest cost on benefit obligations 670 555 587 249 335 424Net actuarial loss (gain) amortization 256 289 205 (50) (25) (150)Curtailment loss (gain) 19 (6) - - (225)(a) 48Benefit plans cost $ 374 $ 373 $ 412 $ 115 $ 174 $ 789 (a) Gain principally resulting from life insurance amendment.
ASSUMPTIONS USED IN BENEFIT CALCULATIONS
The accounting assumptions in the table below are those that are significant to the measurement of our benefit obligations.
ASSUMPTIONS USED TO MEASURE BENEFIT OBLIGATIONS Other pension plans (weighted average) Principal retiree benefit plansDecember 31 2016 2015 2014 2016 2015 2014 Discount rate 2.58% 3.33% 3.53% 3.75% 3.93% 3.89%Compensation increases 3.48 3.32 3.60 3.80 3.80 4.10 Initial healthcare trend rate N/A N/A N/A 6.00(a) 6.00 6.00 (a) For 2016, ultimately declining to 5% for 2030 and thereafter.
The healthcare trend assumptions for 2015 and 2016 apply to our pre-65 retiree medical plans. Our post-65 retiree plan has a fixed subsidy and therefore is notsubject to healthcare inflation.
The discount rate used to measure the benefit obligation at the end of the year is also used to measure benefit cost in the following year. The assumptions usedto measure benefit cost follow.
GE 2016 FORM 10-K 215

ASSUMPTIONS USED TO MEASURE BENEFIT COST Other pension plans (weighted average) Principal retiree benefit plansDecember 31 2016 2015 2014 2016 2015 2014 Discount rate 3.33% 3.53% 4.39% 3.93% (a) 3.89% (a) 4.61% (a)Expected return on assets 6.36 6.95 6.92 7.00 7.00 7.00 (a) Weighted average discount rates of 3.86%, 3.92% and 4.47% were used for determination of costs in 2016, 2015 and 2014, respectively.
BENEFIT OBLIGATIONS Other pension plans Principal retiree benefit plans (In millions) 2016 2015 2016 2015 Balance at January 1 $ 21,618 $ 15,589 $ 6,757 $ 10,703 Service cost for benefits earned 462 416 123 145 Interest cost on benefit obligations 670 555 249 335 Participant contributions 43 15 51 50 Plan amendments (54) (12) (7) (3,291)(a)Actuarial loss (gain) 2,993(b) (406)(b) (291)(c) (444)(b)Benefits paid (842) (576) (603) (691) Acquisitions (dispositions)/ other - net (98) 6,859(d) 10 (50) Exchange rate adjustments (2,249) (822) - - Balance at December 31(e) $ 22,543 $ 21,618 $ 6,289 $ 6,757 (a) Principally related to plan amendments affecting post-65 retiree health and retiree life insurance for certain production participants.
(b) Primarily associated with discount rate changes.
(c) Primarily associated with lower costs from new healthcare supplier contracts.
(d) Substantially all related to Alstom acquisition.
(e) The benefit obligation for retiree health plans was $4,366 million and $4,838 million at December 31, 2016 and 2015, respectively.
THE COMPOSITION OF OUR PLAN ASSETS
The fair value of other pension plans' and principal retiree benefit plans' investments is presented below. The inputs and valuation techniques used to measurethe fair value of the assets are consistently applied and described in Note 1.
Other pension plans Principal retiree benefit plansDecember 31 (in millions) 2016 2015 2016 2015 Equity securities U.S. equity securities $ 666 $ 667 $ 187 $ 203 Non-U.S. equity securities 6,337 6,323 152 162Debt securities Fixed income and cash investment funds 6,049 6,258 30 84 U.S. corporate 319 242 38 52 Other debt securities 577 551 82 93Private equities 627 703 61 75Real estate 1,449 1,358 4 6Other investments 1,067 1,266 21 20Total plan assets $ 17,091 $ 17,368 $ 575 $ 695
Other Pension Plans assets valued using NAV for practical expedient amounted to $4,669 million and $4,213 million as of December 31, 2016 and 2015,respectively. The percentages of other pension plans assets valued using NAV by investment fund type for equity securities, fixed income and cash, andalternative investments were 7%, 4% and 16% as of December 31, 2016, respectively, and 6%, 3% and 15% as of December 31, 2015, respectively.
The practical expedient was not applied for investments with a fair value of $135 million and $169 million in 2016 and 2015, respectively and those investmentswere classified within Level 3. The remaining investments were substantially all considered Level 1 and 2.
GE 2016 FORM 10-K 216

Principal retiree benefit plan assets valued using NAV for practical expedient amounted to $133 million and $160 million as of December 31, 2016 and 2015.There were no Level 3 investments held in 2016 and 2015. The remaining investments were considered Level 1 or Level 2.
FAIR VALUE OF PLAN ASSETS Other pension plans Principal retiree benefit plans(In millions) 2016 2015 2016 2015 Balance at January 1 $ 17,368 $ 12,386 $ 695 $ 813Actual gain on plan assets 1,743 381 22 22Employer contributions 795 549 410 501Participant contributions 43 15 51 50Benefits paid (842) (576) (603) (691)Acquisitions (dispositions) / other - net (81) 5,207(a) - -Exchange rate adjustments (1,935) (594) - -Balance at December 31 $ 17,091 $ 17,368 $ 575 $ 695
(a) Substantially all related to Alstom acquisition.
ASSET ALLOCATION Other pension plans Principal retiree Principal pension plans (weighted average) benefit plans 2016 2016 2016 2016 2016 2016 Target Actual Target Actual Target Actual December 31 allocation allocation allocation allocation allocation allocation Equity securities 18 - 58% 46% 39% 41% 35 - 75% 59%Debt securities (including cash equivalents) 11 - 61 33 30 41 11 - 46 26 Private equities 6 - 16 10 3 4 0 - 25 11 Real estate 3 - 13 7 9 8 0 - 12 1 Other investments 3 - 13 4 19 6 0 - 10 3 Plan fiduciaries of the GE Pension Plan set investment policies and strategies for the GE Pension Trust and oversee its investment allocation, which includesselecting investment managers and setting long-term strategic targets. The primary strategic investment objectives are balancing investment risk and return andmonitoring the plan's liquidity position in order to meet the near-term benefit payment and other cash needs. Target allocation percentages are established at anasset class level by plan fiduciaries. Target allocation ranges are guidelines, not limitations, and occasionally plan fiduciaries will approve allocations above orbelow a target range.
According to statute, the aggregate holdings of all qualifying employer securities (e.g., GE common stock) and qualifying employer real property may not exceed10% of the fair value of trust assets at the time of purchase. GE securities represented 2.1% and 3.7% of the GE Pension Trust assets at year end 2016 and2015, respectively.
The GE Pension Plan has a broadly diversified portfolio of investments in equities, fixed income, private equities, real estate and hedge funds; theseinvestments are both U.S. and non-U.S. in nature. As of December 31, 2016, no sector concentration of assets exceeded 15% of total GE Pension Plan assets.
ESTIMATED FUTURE BENEFIT PAYMENTS 2022 - (In millions) 2017 2018 2019 2020 2021 2026 Principal pension plans $ 3,450 $ 3,595 $ 3,695 $ 3,790 $ 3,865 $ 20,455 Other pension plans 785 795 805 815 830 4,400 Principal retiree benefit plans 600 580 560 535 520 2,245
GE 2016 FORM 10-K 217

2016 COST OF POSTRETIREMENT BENEFIT PLANS AND CHANGES IN OTHER COMPREHENSIVE INCOME Principal Total Principal Other retiree postretirement pension pension benefit (In millions) benefit plans plans plans plans Cost of postretirement benefit plans $ 4,112 $ 3,623 $ 374 $ 115 Changes in other comprehensive income Prior service cost (credit) – current year (61) - (54) (7) Net actuarial loss (gain) – current year 4,038 2,317 1,989 (268) Net curtailment/gain (loss) (50) (31) (19) - Prior service credit (cost) amortization (140) (303) (1) 164 Net actuarial gain (loss) amortization (2,655) (2,449) (256) 50 Total changes in other comprehensive income 1,132 (466) 1,659 (61) Cost of postretirement benefit plans and changes in other comprehensive income $ 5,244 $ 3,157 $ 2,033 $ 54
DERIVATIVES AND HEDGING
See Note 20 for the primary information related to our derivatives and hedging activity. This section provides certain supplemental information about this topic.
Changes in the fair value of derivatives are recorded in a separate component of equity (referred to below as Accumulated Other Comprehensive Income, orAOCI) and are recorded in earnings in the period in which the hedged transaction occurs. The table below summarizes this activity by hedging instrument.
GE 2016 FORM 10-K 218

FAIR VALUE OF DERIVATIVES 2016 2015December 31 (in millions) Assets Liabilities Assets Liabilities Derivatives accounted for as hedges Interest rate contracts $ 3,106 $ 210 $ 4,132 $ 158 Currency exchange contracts 402 624 1,109 1,383 Other contracts - - - - 3,508 834 5,241 1,541 Derivatives not accounted for as hedges Interest rate contracts 62 20 119 44 Currency exchange contracts 1,778 4,011 1,715 4,048 Other contracts 119 17 315 49 1,958 4,048 2,149 4,141 Gross derivatives recognized in statement of financial position Gross derivatives 5,467 4,883 7,391 5,681 Gross accrued interest 768 (24) 1,001 (13) 6,234 4,859 8,392 5,668 Amounts offset in statement of financial position Netting adjustments(a) (3,097) (3,094) (4,326) (4,326) Cash collateral(b) (2,025) (1,355) (1,784) (642) (5,121) (4,449) (6,110) (4,968) Net derivatives recognized in statement of financial position Net derivatives 1,113 410 2,282 700 Amounts not offset in statement of financial position Securities held as collateral(c) (442) - (1,277) - Net amount $ 671 $ 410 $ 1,005 $ 700 Derivatives are classified in the captions "All other assets" and "All other liabilities" and the related accrued interest is classified in "Other GE Capital receivables" and "All otherliabilities" in our Statement of Financial Position.
(a) The netting of derivative receivables and payables is permitted when a legally enforceable master netting agreement exists. Amounts include fair value adjustmentsrelated to our own and counterparty non-performance risk. At December 31, 2016 and December 31, 2015, the cumulative adjustment for non-performance risk was$(3) million and insignificant, respectively.
(b) Excluded excess cash collateral received and posted of $6 million and $177 million at December 31, 2016, respectively, and $48 million and $379 million atDecember 31, 2015, respectively.
(c) Excluded excess securities collateral received of zero and $107 million at December 31, 2016 and December 31, 2015, respectively.
CASH FLOW HEDGE ACTIVITY Gain (loss) reclassified Gain (loss) recognized in AOCI from AOCI into earnings(In millions) 2016 2015 2016 2015 Interest rate contracts $ 6 $ (1) $ (79) $ (130)Currency exchange contracts (281) (907) (282) (784)Commodity contracts - (5) (2) (4)Total(a) $ (274) $ (913) $ (364) $ (918) (a) Gain (loss) is recorded in "GE Capital revenues from services", "Interest and other financial charges", and "Other costs and expenses" in our Statement of Earnings
when reclassified.
The total pre-tax amount in AOCI related to cash flow hedges of forecasted transactions was a $40 million gain at December 31, 2016. We expect to transfer$83 million loss to earnings as an expense in the next 12 months contemporaneously with the earnings effects of the related forecasted transactions. In both thetwelve months ended 2016 and 2015, we recognized insignificant gains and losses related to hedged forecasted transactions and firm commitments that did notoccur by the end of the originally specified period. At December 31, 2016 and 2015, the maximum term of derivative instruments that hedge forecastedtransactions was 16 years and 17 years, respectively. See Note 15 for additional information about reclassifications out of AOCI.

GE 2016 FORM 10-K 219

For cash flow hedges, the amount of ineffectiveness in the hedging relationship and amount of the changes in fair value of the derivatives that are not includedin the measurement of ineffectiveness were insignificant for each reporting period.
COUNTERPARTY CREDIT RISK
Fair values of our derivatives can change significantly from period to period based on, among other factors, market movements and changes in our positions.We manage counterparty credit risk (the risk that counterparties will default and not make payments to us according to the terms of our agreements) on anindividual counterparty basis. Where we have agreed to netting of derivative exposures with a counterparty, we net our exposures with that counterparty andapply the value of collateral posted to us to determine the exposure. We actively monitor these net exposures against defined limits and take appropriate actionsin response, including requiring additional collateral.
As discussed above, we have provisions in certain of our master agreements that require counterparties to post collateral (typically, cash or U.S. Treasurysecurities) when our receivables due from the counterparties, measured at current market value, exceeds specified limits. The fair value of such collateral was$2,466 million at December 31, 2016, of which $2,025 million was cash and $442 million was in the form of securities held by a custodian for our benefit. Undercertain of these same agreements, we post collateral to our counterparties for our derivative obligations, the fair value of which was $1,355 million at December31, 2016. At December 31, 2016, our exposure to counterparties (including accrued interest), net of collateral we hold, was $496 million. This excludesexposures related to embedded derivatives.
Additionally, our master agreements typically contain mutual downgrade provisions that provide the ability of each party to require termination if the long-termcredit rating of the counterparty were to fall below A-/A3 or other ratings levels agreed upon with the counterparty. In certain of these master agreements, eachparty also has the ability to require termination if the short-term rating of the counterparty were to fall below A-1/P-1. Our master agreements also typicallycontain provisions that provide termination rights upon the occurrence of certain other events, such as a bankruptcy or events of default by one of the parties. Ifan agreement was terminated under any of these circumstances, the termination amount payable would be determined on a net basis and could also take intoaccount any collateral posted. The net amount of our derivative liability, after consideration of collateral posted by us and outstanding interest payments was$385 million at December 31, 2016. This excludes exposure related to embedded derivatives.
GE 2016 FORM 10-K 220

NOTE 30. QUARTERLY INFORMATION (UNAUDITED)
First quarter Second quarter Third quarter Fourth quarter(In millions; per-share amounts in dollars) 2016 2015 2016 2015 2016 2015 2016 2015 Consolidated operations Earnings (loss) from continuing operations $ 415 $ (4,673) $ 3,363 $ 1,813 $ 2,056 $ 1,915 $ 3,659 $ 2,645Earnings (loss) from discontinued operations (308) (8,936) (541) (2,947) (105) 629 - 3,758Net earnings (loss) 107 (13,608) 2,823 (1,134) 1,951 2,545 3,659 6,403Less net earnings (loss) attributable to noncontrolling interests (121) (35) (86) 225 (76) 39 (8) 103Net earnings (loss) attributable to the Company $ 228 $ (13,573) $ 2,908 $ (1,360) $ 2,027 $ 2,506 $ 3,667 $ 6,301Per-share amounts – earnings (loss) from continuing operations Diluted earnings (loss) per share $ 0.03 $ (0.45) $ 0.36 $ 0.17 $ 0.23 $ 0.19 $ 0.39 $ 0.26 Basic earnings (loss) per share 0.03 (0.45) 0.36 0 .17 0.24 0.19 0.40 0.26Per-share amounts – earnings (loss) from discontinued operations Diluted earnings (loss) per share (0.03) (0.90) (0.06) (0.30) (0.01) 0.05 - 0.38 Basic earnings (loss) per share (0.03) (0.90) (0.06) (0.30) (0.01) 0.05 - 0.38Per-share amounts – net earnings (loss) Diluted earnings (loss) per share (0.01) (1.35) 0.30 (0.13) 0.22 0.25 0.39 0.64 Basic earnings (loss) per share (0.01) (1.35) 0.30 (0.13) 0.22 0.25 0.40 0.64 Selected data GE Sales of goods and services $ 25,407 $ 23,839 $ 28,150 $ 26,141 $ 26,934 $ 25,612 $ 30,345 $ 30,614 Gross profit from sales 5,516 5,514 6,192 6,033 6,388 6,275 7,027 7,556GE Capital Total revenues 2,885 2,866 2,771 2,690 2,600 2,660 2,649 2,585 Earnings (loss) from continuing operations attributable to the Company (603) (5,721) (448) (332) 59 (154) 397 (1,447)
For GE, gross profit from sales is sales of goods and services less costs of goods and services sold.
Earnings-per-share amounts are computed independently each quarter for earnings (loss) from continuing operations, earnings (loss) from discontinuedoperations and net earnings. As a result, the sum of each quarter's per-share amount may not equal the total per-share amount for the respective year; and thesum of per-share amounts from continuing operations and discontinued operations may not equal the total per-share amounts for net earnings (loss) for therespective quarters.
GE 2016 FORM 10-K 221

DIRECTORS, EXECUTIVE OFFICERS AND CORPORATEGOVERNANCEExecutive Officers of the Registrant (As of February 1, 2017) Date assumed ExecutiveName Position Age Officer Position Jeffrey R. Immelt Chairman of the Board & Chief Executive Officer 60 January 1997Jeffrey S. Bornstein Senior Vice President & Chief Financial Officer 51 July 2013Elizabeth J. Comstock Vice Chairman, Business Innovations 56 April 2013Alexander Dimitrief Senior Vice President, General Counsel & Secretary 58 November 2015Jan R. Hauser Vice President, Controller & Chief Accounting Officer 57 April 2013David L. Joyce Vice Chairman of General Electric Company; 60 September 2016 President & CEO, GE Aviation Susan P. Peters Senior Vice President, Human Resources 63 August 2013John G. Rice Vice Chairman of General Electric Company; 60 September 1997 President & CEO, Global Growth Organization
All Executive Officers are elected by the Board of Directors for an initial term that continues until the Board meeting immediately preceding the next annualstatutory meeting of shareowners, and thereafter are elected for one-year terms or until their successors have been elected. All Executive Officers have beenexecutives of General Electric Company for the last five years except for Ms. Hauser. Prior to joining GE in April 2013, Ms. Hauser served as a partner,Accounting Services, National Professional Services Group at PricewaterhouseCoopers LLP.
The remaining information called for by this item is incorporated by reference to "Election of Directors," "Section 16(a) Beneficial Ownership ReportingCompliance," "Other Governance Policies and Practices" and "Board Committees" in our definitive proxy statement for our 2017 Annual Meeting of Shareownersto be held April 26, 2017, which will be filed within 120 days of the end of our fiscal year ended December 31, 2016 (the 2017 Proxy Statement).
GE 2016 FORM 10-K 222

EXHIBITS AND FINANCIAL STATEMENT SCHEDULES(a)1. Financial Statements
Included in the "Financial Statements and Supplementary Data" section of this report:
Management's Annual Report on Internal Control Over Financial ReportingReport of Independent Registered Public Accounting FirmStatement of Earnings for the years ended December 31, 2016, 2015 and 2014Consolidated Statement of Comprehensive Income for the years ended December 31, 2016, 2015 and 2014Consolidated Statement of Changes in Shareowners' Equity for the years ended December 31, 2016, 2015 and 2014Statement of Financial Position at December 31, 2016 and 2015Statement of Cash Flows for the years ended December 31, 2016, 2015 and 2014Notes to consolidated financial statementsManagement's Discussion and Analysis of Financial Condition and Results of Operations - Summary of Operating Segments
(a)2. Financial Statement Schedules
The schedules listed in Reg. 210.5-04 have been omitted because they are not applicable or the required information is shown in the consolidated financialstatements or notes thereto.
(a)3. Exhibit Index
Exhibit Number
Description
2(a) Transaction Agreement and Plan of Merger dated as of October 30, 2016 among General Electric, Baker Hughes Incorporated, Bear Mergersub,Inc. and Bear Newco, Inc. (Incorporated by reference to Exhibit 2.1 to GE's Current Report on Form 8-K, dated November 3, 2016 (Commissionfile number 001-00035)).
3(i) The Restated Certificate of Incorporation of General Electric Company (Incorporated by reference to Exhibit 3(i) to GE's Annual Report on Form
10-K for the fiscal year ended December 31, 2013), as amended by the Certificate of Amendment, dated December 2, 2015 (Incorporated byreference to Exhibit 3.1 to GE's Current Report on Form 8-K, dated December 3, 2015), as further amended by the Certificate of Amendment,dated January 19, 2016 (Incorporated by reference to Exhibit 3.1 to GE's Current Report on Form 8-K, dated January 20, 2016) and as furtheramended by the Certificate of Change of General Electric Company (Incorporated by reference to Exhibit 3(1) to GE's Current Report on Form 8-K, dated September 1, 2016 (in each case, under Commission file number 001-00035).
3(ii) The By-Laws, as amended, of General Electric Company (Incorporated by reference to Exhibit 3(ii) to GE's Current Report on Form 8-K dated
February 11, 2015 (Commission file number 001-00035)). 4(a) Amended and Restated General Electric Capital Corporation Standard Global Multiple Series Indenture Provisions dated as of February 27, 1997
(Incorporated by reference to Exhibit 4(a) to General Electric Capital Corporation's Registration Statement on Form S-3, File No. 333-59707(Commission file number 001-06461)).
4(b) Third Amended and Restated Indenture dated as of February 27, 1997, between General Electric Capital Corporation and The Bank of New York
Mellon, as successor trustee (Incorporated by reference to Exhibit 4(c) to General Electric Capital Corporation's Registration Statement on FormS-3, File No. 333-59707 (Commission file number 001-06461)).
4(c) First Supplemental Indenture dated as of May 3, 1999, supplemental to Third Amended and Restated Indenture dated as of February 27, 1997
(Incorporated by reference to Exhibit 4(dd) to General Electric Capital Corporation's Post-Effective Amendment No. 1 to Registration Statementon Form S-3, File No. 333-76479 (Commission file number 001-06461)).
4(d) Second Supplemental Indenture dated as of July 2, 2001, supplemental to Third Amended and Restated Indenture dated as of February 27, 1997
(Incorporated by reference to Exhibit 4(f) to General Electric Capital Corporation's Post-Effective Amendment No.1 to Registration Statement onForm S-3, File No. 333-40880 (Commission file number 001-06461)).
GE 2016 FORM 10-K 223

4(e) Third Supplemental Indenture dated as of November 22, 2002, supplemental to Third Amended and Restated Indenture dated as of February 27,
1997 (Incorporated by reference to Exhibit 4(cc) to General Electric Capital Corporation's Post-Effective Amendment No. 1 to the RegistrationStatement on Form S-3, File No. 333‑100527 (Commission file number 001-06461)).
4(f) Fourth Supplemental Indenture dated as of August 24, 2007, supplemental to Third Amended and Restated Indenture dated as of February 27,
1997 (Incorporated by reference to Exhibit 4(g) to General Electric Capital Corporation's Registration Statement on Form S-3, File number 333-156929 (Commission file number 001-06461)).
4(g) Letter from the Senior Vice President and Chief Financial Officer of General Electric to General Electric Capital Corporation dated September 15,
2006, with respect to returning dividends, distributions or other payments to General Electric Capital Corporation in certain circumstancesdescribed in the Indenture for Subordinated Debentures dated September 1, 2006, between General Electric Capital Corporation and the Bank ofNew York, as successor trustee (Incorporated by reference to Exhibit 4(c) to General Electric Capital Corporation's Post-Effective AmendmentNo. 2 to Registration Statement on Form S-3, File No. 333-132807 (Commission file number 001-06461)).
4(h) Indenture dated as of October 26, 2015, among GE Capital International Funding Company, as issuer, General Electric Company and General
Electric Capital Corporation, as guarantors and The Bank of New York Mellon, as trustee (Incorporated by reference to Exhibit 99 to GeneralElectric's Current Report on Form 8-K filed on October 26, 2015 (Commission file number 001-00035)).
4(i) Global Supplemental Indenture dated as of April 10, 2015, among General Electric Capital Corporation, General Electric Company and The Bank
of New York Mellon, as trustee. (Incorporated by reference to Exhibit 4(i) to GE's Annual Report on Form 10-K (Commission file number 001-00035) for the fiscal year ended December 31, 2015).
4(j) Second Global Supplemental Indenture dated as of December 2, 2015, among General Electric Capital Corporation, General Electric Company
and The Bank of New York Mellon, as successor trustee (Incorporated by reference to Exhibit 4.2 to General Electric's Current Report on Form 8-K filed on December 3, 2015 (Commission file number 001-00035)).
4(k)
Agreement to furnish to the Securities and Exchange Commission upon request a copy of instruments defining the rights of holders of certainlong-term debt of the registrant and consolidated subsidiaries.*
(10) Except for 10(t) below, all of the following exhibits consist of Executive Compensation Plans or Arrangements: (a) General Electric Incentive Compensation Plan, as amended effective July 1, 1991 (Incorporated by reference to Exhibit 10(a) to GE's
Annual Report on Form 10-K (Commission file number 001-00035) for the fiscal year ended December 31, 1991). (b) General Electric Financial Planning Program, as amended through September 1993 (Incorporated by reference to Exhibit 10(h) to GE's
Annual Report on Form 10-K (Commission file number 001-00035) for the fiscal year ended December 31, 1993). (c) General Electric Supplemental Life Insurance Program, as amended February 8, 1991 (Incorporated by reference to Exhibit 10(i) to
GE's Annual Report on Form 10-K (Commission file number 001-00035) for the fiscal year ended December 31, 1990). (d) General Electric Directors' Charitable Gift Plan, as amended through December 2002 (Incorporated by reference to Exhibit 10(i) to
GE's Annual Report on Form 10-K (Commission file number 001-00035) for the fiscal year ended December 31, 2002). (e) General Electric Leadership Life Insurance Program, effective January 1, 1994 (Incorporated by reference to Exhibit 10(r) to GE's
Annual Report on Form 10-K (Commission file number 001-00035) for the fiscal year ended December 31, 1993). (f) General Electric Supplementary Pension Plan, as amended effective July 1, 2015. (Incorporated by reference to Exhibit 10(f) to GE's
Annual Report on Form 10-K (Commission file number 001-00035) for the fiscal year ended December 31, 2015).
(g) General Electric 2003 Non-Employee Director Compensation Plan, Amended and Restated as of September 9, 2016 (Incorporated byreference to Exhibit 10(a) to GE's Quarterly Report on Form 10-Q for the quarter ended September 30, 2016 (Commission file number000-00035)).
GE 2016 FORM 10-K 224

(h) Amendment to Nonqualified Deferred Compensation Plans, dated as of December 14, 2004 (Incorporated by reference to Exhibit
10(w) to the GE's Annual Report on Form 10-K (Commission file number 001-00035) for the fiscal year ended December 31, 2004). (i) GE Retirement for the Good of the Company Program, as amended effective January 1, 2009 (Incorporated by reference to Exhibit
10(j) to GE's Annual Report on Form 10-K (Commission file number 001-00035) for the fiscal year ended December 31, 2008). (j) GE Excess Benefits Plan, effective January 1, 2009 (Incorporated by reference to Exhibit 10(k) to GE's Annual Report on Form 10-K
(Commission file number 001-00035) for the fiscal year ended December 31, 2008). (k) General Electric 2006 Executive Deferred Salary Plan, as amended January 1, 2009 (Incorporated by reference to Exhibit 10(l) to GE's
Annual Report on Form 10-K (Commission file number 001-00035) for the fiscal year ended December 31, 2008). (l) General Electric Company 2007 Long-Term Incentive Plan (as amended and restated April 25, 2012) (Incorporated by reference to
Exhibit 99.1 to GE's Registration Statement on Form S-8, dated May 4, 2012, File number 333-181177 (Commission file number 001-00035)).
(m) Form of Agreement for Stock Option Grants to Executive Officers under the General Electric Company 2007 Long-Term Incentive Plan,
as amended January 1, 2009 (Incorporated by reference to Exhibit 10(n) to GE's Annual Report on Form 10-K (Commission filenumber 001-00035) for the fiscal year ended December 31, 2008).
(n) Form of Agreement for Annual Restricted Stock Unit Grants to Executive Officers under the General Electric Company 2007 Long-
Term Incentive Plan, as amended February 7, 2014 (Incorporated by reference to Exhibit 10(a) to GE's Quarterly Report on Form 10-Qfor the quarter ended March 31, 2014 (Commission file number 001-00035)).
(o) Form of Agreement for Periodic Restricted Stock Unit Grants to Executive Officers under the General Electric Company 2007 Long-
Term Incentive Plan, as amended February 7, 2014 (Incorporated by reference to Exhibit 10(b) to GE's Quarterly Report on Form 10-Qfor the quarter ended March 31, 2014 (Commission file number 001-00035)).
(p) Form of Agreement for Long Term Performance Award Grants to Executive Officers under the General Electric Company 2007 Long-
Term Incentive Plan (as amended and restated April 25, 2012) (Incorporated by reference to Exhibit 10(a) to GE's Quarterly Report onForm 10-Q for the quarter ended June 30, 2016 (Commission file number 001-00035)).
(q) Form of Agreement for Performance Stock Unit Grants to Executive Officers under the General Electric Company 2007 Long-Term
Incentive Plan (Incorporated by reference to Exhibit 10 (a) to GE's Quarterly Report on Form 10-Q for the quarter ended June 30, 2015(Commission file number 001-00035)).
(r) First Restatement of the General Electric International Employee Stock Purchase Plan effective May 1, 2002 (Incorporated by
reference to Exhibit 4.1 to GE's Registration Statement on Form S-8, dated November 13, 2009, File No. 333-163106 (Commission filenumber 001-00035)).
(s) Time Sharing Agreement dated November 22, 2010 between General Electric Company and Jeffrey R. Immelt (Incorporated by reference to Exhibit
10(z) to GE's Annual Report on Form 10-K for the fiscal year ended December 31, 2010 (Commission file number 001-00035)).
(t) Amended and Restated Agreement, dated April 10, 2015, between General Electric Company and General Electric Capital Corporation(Incorporated by reference to Exhibit 10 to GE's Current Report on Form 8-K, dated April 10, 2015 (Commission file number 001-00035)).
(u) Early Retirement Agreement & Release between General Electric Company and Keith Sherin effective January 8, 2017.* (11) Statement re Computation of Per Share Earnings.** 12(a) Computation of Ratio of Earnings to Fixed Charges.* 12(b) Computation of Ratio of Earnings to Combined Fixed Charges and Preferred Stock Dividends.* (21) Subsidiaries of Registrant.*
GE 2016 FORM 10-K 225

(23) Consent of Independent Registered Public Accounting Firm.* (24) Power of Attorney.* 31(a) Certification Pursuant to Rules 13a-14(a) or 15d-14(a) under the Securities Exchange Act of 1934, as amended.* 31(b) Certification Pursuant to Rules 13a-14(a) or 15d-14(a) under the Securities Exchange Act of 1934, as amended.* (32) Certification Pursuant to 18 U.S.C. Section 1350.* 99(a) Undertaking for Inclusion in Registration Statements on Form S-8 of General Electric Company (Incorporated by reference to Exhibit 99(b) to
General Electric Annual Report on Form 10-K (Commission file number 001-00035) for the fiscal year ended December 31, 1992). 99(b) Computation of Ratio of Earnings to Fixed Charges (Incorporated by reference to Exhibit 12(a) to GE Capital's Annual Report on Form 10-K for
the fiscal year ended December 31, 2014 (Commission file number 001-06461)). 99(c) Supplement to Present Required Information in Searchable Format* (101) The following materials from General Electric Company's Annual Report on Form 10-K for the year ended December 31, 2016, formatted in XBRL
(eXtensible Business Reporting Language); (i) Statement of Earnings for the years ended December 31, 2016, 2015 and 2014, (ii) ConsolidatedStatement of Comprehensive Income for the years ended December 31, 2016, 2015 and 2014, (iii) Consolidated Statement of Changes inShareowners' Equity for the years ended December 31, 2016, 2015 and 2014, (iv) Statement of Financial Position at December 31, 2016 and2015, (v) Statement of Cash Flows for the years ended December 31, 2016, 2015 and 2014, and (vi) the Notes to Consolidated FinancialStatements.*
* Filed electronically herewith.** Information required to be presented in Exhibit 11 is provided in Note 18 to the consolidated financial statements in this Form 10-K Report in
accordance with the provisions of Financial Accounting Standards Board Accounting Standards Codification 260, EarningsPerShare.
GE 2016 FORM 10-K 226

FORM 10-K CROSS REFERENCE INDEXItem Number Page(s)
Part I Item 1. Business 18-19, 33-63, 74-75, 98-99 Item 1A. Risk Factors 120-125
Item 1B. Unresolved Staff Comments Not applicable Item 2. Properties 19 Item 3. Legal Proceedings 126-127 Item 4. Mine Safety Disclosures Not applicable Part II Item 5. Market for Registrant's Common Equity, Related Stockholder Matters and Issuer Purchases of Equity Securities 26, 117 Item 6. Selected Financial Data 116 Item 7. Management's Discussion and Analysis of Financial Condition and Results of Operations 20-115 Item 7A. Quantitative and Qualitative Disclosures About Market Risk 80-81, 118-119 Item 8. Financial Statements and Supplementary Data 131-221 Item 9. Changes in and Disagreements With Accountants on Accounting and Financial Disclosure Not applicable Item 9A. Controls and Procedures 129 Item 9B. Other Information Not applicablePart III Item 10. Directors, Executive Officers and Corporate Governance 222 Item 11. Executive Compensation (a) Item 12. Security Ownership of Certain Beneficial Owners and Management and Related Stockholder Matters (b), Note 16 Item 13. Certain Relationships and Related Transactions, and Director Independence (c) Item 14. Principal Accounting Fees and Services (d)Part IV Item 15. Exhibits and Financial Statement Schedules 223-226Item 16. Form 10-K Summary 3-16, (e) Signatures 228
(a) Incorporated by reference to "Compensation" in the 2017 Proxy Statement.
(b) Incorporated by reference to "Stock Ownership Information" and "Key Data About Our Grant Practices" in the 2017 Proxy Statement.
(c) Incorporated by reference to "Related Person Transactions" and "How We Assess Director Independence" in the 2017 Proxy Statement.
(d) Incorporated by reference to "Independent Auditor Information" in the 2017 Proxy Statement.
(e) The Introduction & Summary does not include Part III information because it will be incorporated by reference to the 2017 Proxy Statement.
GE 2016 FORM 10-K 227

OTHER INFORMATION
SIGNATURESPursuant to the requirements of Section 13 or 15(d) of the Securities Exchange Act of 1934, the registrant has duly caused this annual report on Form 10-K forthe fiscal year ended December 31, 2016, to be signed on its behalf by the undersigned, and in the capacities indicated, thereunto duly authorized in the City ofBoston and Commonwealth of Massachusetts on the 24 th day of February 2017.
General Electric Company (Registrant)
By /s/ Jeffrey S. Bornstein Jeffrey S. Bornstein Senior Vice President and Chief Financial Officer (Principal Financial Officer)
Pursuant to the requirements of the Securities Exchange Act of 1934, this report has been signed below by the following persons on behalf of the registrant andin the capacities and on the dates indicated.
Signer Title Date /s/ Jeffrey S. Bornstein Principal Financial Officer February 24, 2017 Jeffrey S. Bornstein
Senior Vice President andChief Financial Officer
/s/ Jan R. Hauser Principal Accounting Officer February 24, 2017 Jan R. Hauser
Vice President and Controller
/s/ Jeffrey R. Immelt
Jeffrey R. Immelt*Chairman of the Board of Directors
Principal Executive Officer
February 24, 2017
Sébastien M. Bazin* Director W. Geoffrey Beattie* Director John J. Brennan* Director Francisco D'Souza* Director Marijn E. Dekkers* Director Peter B. Henry* Director Susan Hockfield* Director Andrea Jung* Director Robert W. Lane* Director Rochelle B. Lazarus* Director Lowell C. McAdam* Director Steven M. Mollenkopf* Director James J. Mulva* Director James E. Rohr* Director Mary L. Schapiro* Director James S. Tisch* Director A majority of the Board of Directors *By /s/ Christoph A. Pereira Christoph A. Pereira
Attorney-in-fact February 24, 2017
GE 2016 FORM 10-K 228


Exhibit 4(k)
Daniel C. JankiSenior Vice President and GE Treasurer General Electric Company3135 Easton TurnpikeFairfield, CT 06828
Securities and Exchange Commission100 F Street, NEWashington, DC 20549
February 24, 2017
Subject: General Electric Company Annual Report on Form 10-K for the fiscal year ended December 31, 2016 – File No. 001-00035
Dear Sirs:
Neither General Electric Company (the "Company") nor any of its consolidated subsidiaries has outstanding any instrument with respect to its long-term debt,other than those filed as an exhibit to the Company's Annual Report on Form 10-K for the fiscal year ended December 31, 2016, under which the total amount ofsecurities authorized exceeds 10% of the total assets of the registrant and its subsidiaries on a consolidated basis. In accordance with paragraph (b)(4)(iii) ofItem 601 of Regulation S-K (17 CFR Sec. 229.601), the Company hereby agrees to furnish to the Securities and Exchange Commission, upon request, a copyof each instrument that defines the rights of holders of such long-term debt not filed or incorporated by reference as an exhibit to the Company's Annual Reporton Form 10‑K for the fiscal year ended December 31, 2016.
Very truly yours,
GENERAL ELECTRIC COMPANY
/s/ Daniel C. Janki Daniel C. Janki Senior Vice President and GE Treasurer

Exhibit 10(u)
Date of Notification : November 21, 2016
EARLY RETIREMENT AGREEMENT & RELEASE
This is an Agreement between the General Electric Company (the "Company") and Keith Sherin (the"Employee").
WHEREAS the Employee will cease to be employed by the Company,
WHEREAS the Company and the Employee intend the terms and conditions of this Agreement to govern allissues related to the Employee's employment with and separation from the Company,
NOW, THEREFORE, in consideration of the covenants and mutual promises herein contained, the Company andEmployee agree as follows:
1. Separation Date and Consideration/Other Payments .
a. Separation Date/Salary Payments . The Employee shall continue to perform his regular full-time dutiesand responsibilities as an active employee and be paid his current salary at the Company's regular payintervals through December 31, 2016. (referred to as the "Separation Date").
b. Annual Executive Incentive Plan (AEIP) . Employee will be eligible to participate in a full year AEIP for2016, which will be reviewed and determined by the Company during the regular AEIP process and shallbe made in accordance with usual Company procedures.
c. Stock Options . Any unvested stock options held by the Employee which were granted prior to November2015 shall become fully vested upon the Separation Date and, along with any vested but unexercisedoptions from such grants, shall expire 5 years after the Separation Date or on the original expiration date ofthe grant, whichever date occurs first. All stock options granted in November 2015 shall become fullyvested upon the Separation Date and be exercisable until December 31, 2019.
d. Restricted Stock Units . The restrictions on Employees outstanding RSUs will lapse on the SeparationDate and be paid in accordance with applicable plan rules and any requirements pursuant to Paragraph 17and Section 409A of the Internal Revenue Code.
e. Performance Stock Units . The restrictions on Employees outstanding PSUs will lapse contingent upon
satisfying the performance conditions
Classification: GE Internal
Page 1

and other provisions set forth in such PSUs, and to the extent earned, will be payable in accordance withnormal Company procedures.
f.
Deferred Incentive Compensation and Executive Deferred Salary Plans (EDSP) . Employee's deferredincentive compensation and/or EDSP will be paid out in accordance with the rules of the applicable Plan(s)and any requirements pursuant to Paragraph 17 and Section 409A of the Internal Revenue Code.
g. Officer Benefits . Officer benefits and perquisites shall be treated as follows:
i. Company Automobile . The Employee may continue using the Company-provided car in hispossession at the Effective Date of this Agreement until December 31, 2016. As of December 31,2016, the Employee may purchase the car at its market value (as determined by the Company'sFleet Services provider) or relinquish the car to the Company.
ii. Financial Planner . The Employee may continue to avail himself of the services of a financialplanner until the end of December 31, 2016.
iii. Executive Life Insurance . The Company agrees to maintain the Employee's Executive and SeniorExecutive Life Insurance Policies and continue to make premium payments in accordance with theterms of the Plans.
h. Retirement Allowance . Employee will be granted a retirement allowance commencing on the first of the
month following the Separation Date. The retirement allowance will be based on the Employee'spensionable service through the Separation Date and compensation history as of the Separation Date andwill be on the terms and conditions as set forth by the Company. The Employee understands and agreesthat he is responsible for his share of Social Security and Medicare taxes and for any federal and/or stateincome taxes and any other taxes that may apply. Following the Separation Date, the Employee shall beeligible for those health and other welfare benefits under the Company's employee benefit plans on thesame basis as a similarly situated individual who elected optional retirement from the Company.Contributions are subject to change, and no GE-sponsored medical coverage is available after attainmentof age 65. Notwithstanding the above, the Company reserves the right to terminate, amend, eliminateand/or replace those health and other welfare benefits at its sole discretion and at any time. TheEmployee's eligibility for, and benefits under, such plans shall be subject to any changes to those plans.
Classification: GE Internal
Page 2

i. 2016-18 Long-Term Performance Award . The Employee will be eligible to receive a pro rata (12/36)payment under the 2016-18 Long-Term Performance Award Program based on factors set forth in theoriginal performance award granted to the Employee. The award, if any, will be paid after the end of theLTPA program period in accordance with the terms of the Program.
j. Employee agrees that the payments and benefits he receives under this Agreement are sufficientconsideration in exchange for his obligations under this Agreement.
2. Effective Date of the Agreement . Employee shall have seven (7) days from the date he signs this Agreement torevoke his consent to the waiver of his rights under the Age Discrimination in Employment Act of 1967, asamended ("ADEA"). To do so, he must submit a written revocation to his Company HRM. If Employee revokes hisconsent to the waiver, all of the provisions of this Agreement shall be void and unenforceable. If Employee doesnot revoke his consent, the Agreement will take effect on the day after the end of this revocation period (the"Effective Date").
3. Employee Representations . Employee hereby represents and acknowledges to the Company that:
a. Attorney Consultation . The Company has advised Employee to consult with an attorney of his choosingprior to signing this Agreement;
b. Time for Review . The Employee has had the opportunity to take at least twenty-one (21) days to considerthe waiver of his rights under the Age Discrimination in Employment Act of 1967, as amended ("ADEA")prior to signing this Agreement.
c. Disclosure of Past and Present Claims . The Employee is not aware of (or has already disclosed to theCompany) any information in his possession or to which he has or had access relating to conduct by theCompany or any of the Releasees that he has any reason to believe violates or may violate any domesticor foreign law or regulation, involves or may involve false claims to the United States, or violates or mayviolate Company policy in any respect.
4. Confidential Information . The Employee acknowledges that he has obtained knowledge about confidentialCompany information. Such information may include proprietary information, trade secrets of the Company,customer information, technical information about Company products, strategic plans of Company businesses,price information, or employee information 1 (hereinafter
1 Confidential Information does not include information regarding the Employee's pay or other compensation earnedor benefits received during his/her employment by the Company.
Classification: GE Internal
Page 3

the "Confidential Information"). Employee agrees to never use, publish or otherwise disclose any ConfidentialInformation to anyone, except upon prior written approval from the Company's Senior Vice President, HumanResources. Employee understands that this includes, but is not limited to, any subsequent employer orcompetitor of the Company. The Employee understands that nothing herein prevents the Employee fromdisclosing a trade secret or other Confidential Information when reporting, in confidence, potential violations oflaw or regulation to U.S. government authorities, including but not limited to the Department of Justice and theSecurities and Exchange Commission, or to a U.S. court. However, any and all Covered Claims (as defined inGE's ADR procedure) are subject to, and must be brought consistent with, the terms of GE's ADR procedure (seeParagraph 7.f.). If the Employee has any question regarding what data or information would be considered by theCompany to be Confidential Information subject to this provision, the Employee agrees to contact the Company'sSenior Vice President, Human Resources for written clarification.
5. Employee Innovation and Proprietary Information Agreement (EIPIA), Non-Solicit Agreement, Non-CompeteAgreement and Company Alternative Dispute Resolution (ADR) Program . The EIPIA, any Non-Solicitation(whether applicable to clients, customers or employees) and Non-Compete Agreements, and the Company ADRProgram will each remain in effect in accordance with their respective terms.
6. Non-Competition . The Employee agrees that for a period of one year following the Effective Date, that he willnot enter into an employment or contractual relationship, either directly or indirectly, to provide services to anycompetitor of the Company, except upon prior written approval from the Company's Senior Vice President,Human Resources. Notwithstanding the foregoing, the Employee may serve as a director or trustee of any entityduring the one-year period, unless and until the Company's Board of Directors in good faith determines andcommunicates to Employee in writing that Employee's directorship or trusteeship places the Company at asignificant competitive disadvantage .
7. Release of Claims . The Employee and his heirs, assigns, and agents agree to release, waive, and discharge theCompany and Releasees (as defined below) from each and every waivable claim, action or right of any sort,known or unknown, suspected or unsuspected, arising on or before the Effective Date (as described below)relating to or arising from Employee's employment with or separation from the Company.
a. Releasees . "Releasees" include the following: (1) the Company; (2) all current and former Company
parents, subsidiaries, related companies, affiliates, partnerships or joint ventures, and, with respect toeach of them,.
Classification: GE Internal
Page 4

their predecessors and successors; (3) with respect to each such entity identified in (1) and (2) above, allof its past, present, and future employees, officers, directors, stockholders, owners, representatives,assigns, attorneys, agents, insurers, employee benefit programs (and the trustees, administrators,fiduciaries and insurers of such programs), and (4) any other person acting by, through, under or in concertwith any of the persons or entities listed in this paragraph, and their predecessors or successors.
b. Claims Released . The foregoing release includes, but is not limited to: (1) any claim of discrimination,harassment, or retaliation related to race, sex, pregnancy, religion, marital status, sexual orientation,national origin, handicap or disability, age, veteran status, or citizenship status or any other categoryprotected by law; (2) any other claim based on a statutory prohibition or requirement; (3) any and all claimsunder any law of any nation, including any and all claims under any United States of America federal,state, or local law, regulation, or ordinance 1 ; (4) any claim under contract, tort, or common law, such asclaims of wrongful discharge, negligent or intentional affliction of emotional distress and defamation; (5)any claim arising out of or related to an express or implied employment contract, any other contractaffecting terms and conditions of employment, or a covenant of good faith fair dealing; (6) any claims forattorneys' fees that exist or may exist as of the date of the signing of this Agreement. .
c. ADEA Claims . The Employee acknowledges that he is releasing rights and claims under the AgeDiscrimination in Employment Act of 1967, as amended ("ADEA").
d. Violating the Release . If the Employee violates this release by suing a Releasee or causing a Releasee tobe sued for any matter in the scope of the release, the Employee agrees to pay all costs and expenses ofdefending against the suit incurred by the Releasee, including reasonable attorneys' fees, except to theextent that paying such fees, costs and expenses is prohibited by law or would result in the invalidation ofthe foregoing release.
e. Participating with Government Agencies . Nothing in this Agreement is intended to discourage or interfere
with the Employee taking advantage of
1 * Including but not limited to claims under the New Jersey Conscientious Employee Protection Act, and all rights and claims under theMassachusetts Wage Act such as claims for unpaid or late payment of wages, unpaid overtime, vacation payments, commission payments, mealperiod violations and unpaid tips. California employees also specifically waive all rights and benefits under Section 1542 of the California Civil Code,which states: "A general release does not extend to claims which the creditor does not know or suspect to exist in his favor at the time of executingthe release, which if known by him must have materially affected his settlement with the debtor." The term "creditor" in the above quote refers to theemployee and the term "debtor" refers to the employer. Pursuant to the West Virginia Human Rights Act, West Virginia employees who need anattorney may call the West Virginia State Bar Association at (866) 989-8227.
Classification: GE Internal
Page 5

his/her right to file or participate in administrative claims or charges and/or communicating withgovernment agencies or authorities, including any state or federal fair employment practices agency andlaw enforcement authorities. However, the Employee agrees he cannot receive any monetary or personalgain for such participation, to the maximum extent permitted by law. Accordingly, Employee shall bebarred from seeking and expressly waives any and all waivable rights to any monetary, injunctive, or otherpersonal relief for released claims, including but not limited to damages, remedies, or other such relief, anyand all rights to which Employee hereby waives; provided, however, that this waiver shall not apply toparticipation in any investigation or proceeding conducted by, or to any communication with, the UnitedStates Securities and Exchange Commission. Employee understands that such waiver does not extend torelief that cannot lawfully be waived.
f. Alternative Dispute Resolution . The Employee agrees to submit to the Company's internal alternativedispute resolution process, "Solutions" (for purposes of this Agreement called "Company ADR"), includingfinal and binding arbitration, any claims not released by this Agreement, and covered by such CompanyADR process, or any claims that arise after the date the Employee signs this Agreement, including but notlimited to, disputes about the Agreement itself, to the maximum extent permitted by law. Employeeunderstands that this means he is giving up the right to a jury trial for any claims not released by thisAgreement or that arise after the Effective Date, to the maximum extent permitted by law, and that allsuch claims submitted to arbitration pursuant to the Company ADR will be decided solely by an arbitrator.If Employee needs another copy of the Company ADR guidelines, he can access it online, if available, orask his Company HRM (or that person's successor, if that person is no longer in the role) for a copy.
g. Claims That Are Not Being Waived : Employee understands that he is not releasing any claims: (1) arisingafter the Effective Date, (2) relating to any accrued and vested benefits under any employee benefit plan,(3) for indemnification or advancement of expenses under the Company's certificate of incorporation orbylaws, (4) for coverage under the Company's directors' and officers' insurance, or (5) that cannot lawfullybe released.
8. Employee Availability . The Employee agrees to make himself reasonably available to the Company to respond
to requests by the Company for information in any way pertaining to the Company that may be within theknowledge of the Employee. Employee will cooperate fully with the Company in connection with any and allexisting or future litigation or investigations brought by or against the Company or any Releasees, whetheradministrative, civil or criminal in nature.
Classification: GE Internal
Page 6

Employee agrees to cooperate to the extent the Company reasonably deems necessary. The Company willreimburse the Employee for reasonable out-of-pocket expenses incurred as a result of such cooperation.
9. Non-Disparagement . The Employee agrees, subject to any obligations he may have under applicable law, thathe will not make or cause to be made any statements or take any actions that disparage or in any way damagethe reputation of the Company or any of its affiliates, subsidiaries, agents, officers, directors or employees. In theevent such a communication is made to anyone, including but not limited to the media, public interest groups orpublishing companies, it will be considered a material breach of the terms of this Agreement. Employeeunderstands that nothing in this paragraph prevents the Employee from disclosing statements, of any nature,regarding possible violations of law or regulation to government agencies or authorities
10. Severability of Provisions . In the event that any provision in this Agreement is determined to be legally invalid orunenforceable by an arbitrator or any court of competent jurisdiction, in accordance with the Alternative DisputeResolution paragraphs above, and cannot be modified to be enforceable, the affected provision shall be strickenfrom the Agreement. The remaining terms of the Agreement and its enforceability shall remain unaffected.
11. Non-Transfer of GE Information . Employee represents that consistent with his obligations under the EIPIA andother Company policies he has not copied or transferred any GE Confidential Information to any external storagedevice, external personal email or other non GE-authorized storage location in anticipation of or connection withhis separation, without the authorization of his Manager or his Company HRM. Such GE Confidential Informationincludes but is not limited to documents and data containing work product that was prepared for the Company byEmployee or others during his employment. Employee represents that any material so transferred or copied byhim, or on his behalf, is of a solely personal or social nature to Employee or relates to Company-providedcompensation or benefits received by him or his dependents and that if he has any questions regarding theprohibitions in this paragraph he will discuss those with his Manager or Company HRM prior to signing thisAgreement. If Employee possesses GE Confidential Information stored on personal computer media, Employeeshall so advise the Company upon execution of this Agreement, and work with the Company to ensure thelocation of all such data is fully disclosed by Employee to the Company, retrieved by the Company in aforensically sound manner, and permanently deleted by the Company or its designee from his personal computermedia prior to the Separation Date.
12.
Confidentiality . The Employee shall keep strictly confidential all the terms and conditions, including amounts, inthis Agreement and shall not disclose them to any person other than the Employee's spouse or immediate familymember, the Employee's legal or financial advisor, or U.S. governmental officials who seek such
Classification: GE Internal
Page 7

information in the course of their official duties, unless compelled by law to do so. If a person not a party to thisAgreement requests or demands, by subpoena or otherwise, that the Employee disclose or produce thisAgreement or any terms or conditions thereof, the Employee shall immediately notify the Company and shall givethe Company an opportunity to respond to such notice. The Employee shall not take any action or make anydecision in connection with such request or subpoena without first notifying the Company.
13. Breach by Employee . The Company's obligations to the Employee after the Effective Date are contingent on
Employee fulfilling his obligations under this Agreement. If the Employee commits any material breach of thisAgreement, the Company shall have the right to immediately cancel its obligations under this Agreement, and theEmployee will be required to reimburse the Company for any and all compensation and benefits (other than thosealready vested) paid as consideration under the terms of this Agreement, except to the extent that suchreimbursement is prohibited by law or would result in the invalidation of the release in Section 7 above. In theevent such breach is established after arbitration in accordance with Company ADR, the Employee shallindemnify and hold Company harmless from any loss, claim or damages, including without limitation allreasonable attorneys' fees, costs and expenses incurred in enforcing its rights under this Agreement.
14. Descriptive Headings . The section headings contained herein are for reference purposes only and shall not inany way affect the meaning or interpretation of this Agreement.
15. Entire Agreement . This Agreement sets forth the entire agreement and understanding between the parties. Theparties agree they have not relied on any oral statements that are not included in this Agreement. This Agreementsupersedes all prior agreements and understandings concerning the subject matter of this Agreement. Anymodifications to this Agreement must be in writing, must reference this Agreement, and must be signed byEmployee and an authorized employee or agent of the Company.
16. Applicable Law . This Agreement shall be construed, interpreted and applied in accordance with the law of theState of New York.
17. Compliance with Section 409A of the Internal Revenue Code . This Agreement is intended to satisfy therequirements of Section 409A of the Internal Revenue Code (and any related guidance issued by the IRS or theTreasury Department), so as to avoid the imposition of any additional taxes, penalties or interest under thoserules. Accordingly, this Agreement shall be modified, as determined by the Company, to the extent necessary toavoid the imposition of any such additional taxes, penalties or interest. The Company may take any such actionwithout the consent of, or notice to, the Employee. Consistent with the foregoing all payments under thisAgreement shall be delayed to the extent necessary to
Classification: GE Internal
Page 8

comply with the rules in Section 409A(a)(2)(B)(i) (generally requiring a delay of six months after separation fromservice for certain payments made to top-50 officers determined in accordance with Company rules).
18. Format . The Employee and the Company agree that a facsimile ("fax"), photographic, or electronic copy of this
Agreement shall be as valid as the original.
I acknowledge that I understand the above agreement includes a release of all waivable claims. I understandthat I am waiving unknown claims and I am doing so voluntarily and intentionally.
KEITH SHERIN
General Electric Company
By: /s/ Keith Sherin /s/ Susan Peters
Date: December 31, 2016 Date: January 5, 2017
Classification: GE Internal
Page 9

Exhibit 12(a)
General Electric CompanyComputation of Ratio of Earnings to Fixed Charges
Years ended December 31(Dollars in millions) 2016 2015 2014 2013 2012 General Electric Company and consolidated affiliates Earnings(a) $ 8,689 $ 7,991 $ 9,769 $ 9,040 $ 8,529Plus: Interest and other financial charges included in expense(b) 5,765 8,366 9,482 10,116 12,407 One-third of rental expense(c) 432 499 473 504 510 Adjusted "earnings" $ 14,886 $ 16,856 $ 19,724 $ 19,660 $ 21,446 Fixed charges: Interest and other financial charges included in expense(b) $ 5,765 $ 8,366 $ 9,482 $ 10,116 $ 12,407 Interest capitalized 35 26 25 29 28 One-third of rental expense(c) 432 499 473 504 510 Total fixed charges $ 6,232 $ 8,891 $ 9,980 $ 10,649 $ 12,945 Ratio of earnings to fixed charges 2.39 1.90 1.98 1.85 1.66 (a) Earnings before income taxes, noncontrolling interests, discontinued operations and undistributed earnings of equity investees.(b) Included interest on tax deficiencies and interest on discontinued operations.(c) Considered to be representative of interest factor in rental expense.

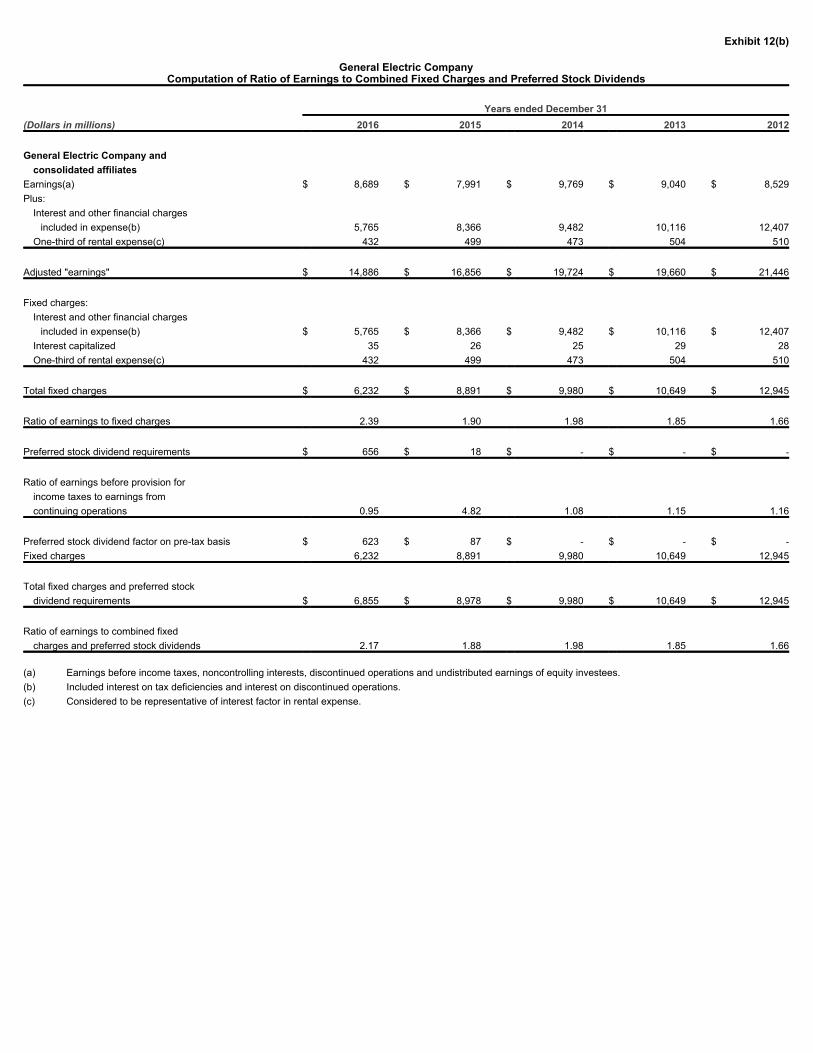
Exhibit 12(b)
General Electric CompanyComputation of Ratio of Earnings to Combined Fixed Charges and Preferred Stock Dividends
Years ended December 31(Dollars in millions) 2016 2015 2014 2013 2012 General Electric Company and consolidated affiliates Earnings(a) $ 8,689 $ 7,991 $ 9,769 $ 9,040 $ 8,529Plus: Interest and other financial charges included in expense(b) 5,765 8,366 9,482 10,116 12,407 One-third of rental expense(c) 432 499 473 504 510 Adjusted "earnings" $ 14,886 $ 16,856 $ 19,724 $ 19,660 $ 21,446 Fixed charges: Interest and other financial charges included in expense(b) $ 5,765 $ 8,366 $ 9,482 $ 10,116 $ 12,407 Interest capitalized 35 26 25 29 28 One-third of rental expense(c) 432 499 473 504 510 Total fixed charges $ 6,232 $ 8,891 $ 9,980 $ 10,649 $ 12,945 Ratio of earnings to fixed charges 2.39 1.90 1.98 1.85 1.66 Preferred stock dividend requirements $ 656 $ 18 $ - $ - $ - Ratio of earnings before provision for income taxes to earnings from continuing operations 0.95 4.82 1.08 1.15 1.16 Preferred stock dividend factor on pre-tax basis $ 623 $ 87 $ - $ - $ -Fixed charges 6,232 8,891 9,980 10,649 12,945 Total fixed charges and preferred stock dividend requirements $ 6,855 $ 8,978 $ 9,980 $ 10,649 $ 12,945 Ratio of earnings to combined fixed charges and preferred stock dividends 2.17 1.88 1.98 1.85 1.66 (a) Earnings before income taxes, noncontrolling interests, discontinued operations and undistributed earnings of equity investees.(b) Included interest on tax deficiencies and interest on discontinued operations.(c) Considered to be representative of interest factor in rental expense.


Exhibit 21
SUBSIDIARIES OF REGISTRANT
General Electric's principal affiliates as of December 31, 2016, are listed below. All other affiliates, if considered in the aggregate as a single affiliate, would notconstitute a significant subsidiary.
AFFILIATES OF REGISTRANT INCLUDED IN REGISTRANT'S FINANCIAL STATEMENTS
Percentage of voting securities directly or State or Country indirectly owned by of incorporation registrant (1) or organization ALSTOM Energias Renovaveis Ltda 75 BrazilALSTOM WIND France SAS 50 FranceAmersham Health Norge AS 100 NorwayBently Nevada, Inc. 100 DelawareCardinal Cogen, Inc. 100 DelawareCaribe GE International of Puerto Rico, Inc. 100 Puerto RicoDatex-Ohmeda, Inc. 100 DelawareDresser, Inc. 100 DelawareDruck, Inc. 100 ConnecticutEA Distribution, Inc. 100 DelawareGE Aero Energy Power, LLC 100 DelawareGE Albany CH GmbH 100 SwitzerlandGE Albany C.V. 100 NetherlandsGE Albany Global Holdings BV 100 NetherlandsGE Albany US Holdings LLC 100 DelawareGE Aviation Systems Group Limited 100 United Kingdom & Northern
IrelandGE Aviation Systems North America LLC 100 DelawareGE Aviation UK 100 United Kingdom & Northern
IrelandGE Betz International, Inc. 100 PennsylvaniaGE Business Services GmbH 100 GermanyGE Caledonian Limited 100 United Kingdom & Northern
IrelandGE Canada Holdings, Inc. 100 DelawareGE Capital Fleet Services International Holdings, Inc. 100 DelawareGE Capital Global Financial Holdings, LLC 100 ConnecticutGE Capital Global Holding, LLC 100 DelawareGE Capital UK Finance 100 United Kingdom & Northern
IrelandGE Celma LTDA 100 BrazilGE Drives & Controls, Inc. 100 DelawareGE Druck Holdings Limited 100 United Kingdom & Northern
IrelandGE Energy Europe B.V. 100 NetherlandsGE Energy Netherlands, B.V. 100 NetherlandsGE Energy Parts, Inc. 100 DelawareGE Energy Power Conversion Group SAS 100 FranceGE Energy Products France SNC 100 FranceGE Energy Services, Inc. 100 DelawareGE Energy Switzerland GmbH 100 SwitzerlandGE Energy (USA), LLC 100 Delaware

GE Engine Services, LLC 100 DelawareGE Engine Services - Dallas, LP 100 DelawareGE Engine Services Distribution, LLC 100 DelawareGE Engine Services UNC Holding I, Inc. 100 DelawareGE Europe Holdings LLC 100 DelawareGE Financial Assurance Holdings, Inc. 100 DelawareGE Financial Funding Unlimited Company 100 IrelandGE Financial Ireland Unlimited Company 100 IrelandGE France Financial Holdings, LLC 100 DelawareGE Gas Turbines (Greenville) LLC 100 DelawareGE Global Products LLC 100 DelawareGE Global Sourcing LLC 100 DelawareGE Healthcare AS 100 NorwayGE Healthcare Bio-Sciences AB 100 SwedenGE Healthcare BVBA 100 BelgiumGE Healthcare European Holdings SARL 100 LuxembourgGE Healthcare Finland Oy 100 FinlandGE Healthcare Holding Norge AS 100 NorwayGE Healthcare Japan Corporation 100 JapanGE Healthcare Life Sciences Holding AB 100 SwedenGE Healthcare Limited 100 United Kingdom & Northern
IrelandGE Healthcare Norge AS 100 NorwayGE Healthcare Sweden Holding AB 100 SwedenGE Healthcare USA Holding LLC 100 DelawareGE HOLDINGS LUXEMBOURG & CO S.a.r.l. 100 LuxembourgGE Hungary Kft. 100 HungaryGE Industrial Consolidation Limited 100 United Kingdom & Northern
IrelandGE Infrastructure Aviation 100 United Kingdom & Northern
IrelandGE Infrastructure, Inc. 100 DelawareGE Infrastructure Technology International LLC 100 DelawareGE Inspection and Repair Services Limited 100 United Kingdom & Northern
IrelandGE Intelligent Platforms, Inc. 100 DelawareGE Investments, Inc. 100 DelawareGE Ionics Inc. 100 MassachusettsGE Italia Holding S.p.a. 100 ItalyGE Jenbacher GmbH & Co OG 100 AustriaGE Keppel Energy Services Pte. Ltd. 50 SingaporeGE Maintenance Services, Inc. 100 DelawareGE Media Holdings, Inc. 100 DelawareGE Medical Systems Global Technology Company, LLC 100 DelawareGE Medical Systems Information Technologies, Inc. 100 WisconsinGE Medical Systems Societe en Commandite Simple 100 FranceGE Medical Systems, Inc. 100 DelawareGE Medical Systems, LLC 100 DelawareGE Medical Systems, Ultrasound & Primary Care Diagnostics LLC 100 DelawareGE Mexico, S.A. de C.V. 100 MexicoGE Military Systems 100 DelawareGE Oil & Gas Angola, Limitada 100 Angola

GE Oil & Gas Pressure Control, LP 100 United StatesGE Osmonics, Inc. 100 MinnesotaGE Pacific Holdings Pte. Ltd. 100 SingaporeGE Pacific Private Limited 100 SingaporeGE Packaged Power, Inc. 100 DelawareGE Packaged Power, L.P. 100 DelawareGE Renewable Holding B.V. 50 NetherlandsGE Renewables North America, LLC 100 DelawareGE Transportation Parts, LLC 100 DelawareGE UK Group 100 United Kingdom & Northern
IrelandGE UK Holdings 100 United Kingdom & Northern
IrelandGE Water & Process Technologies Canada 100 CanadaGE Wind Energy, LLC 100 DelawareGEA Distribution, Inc. 100 DelawareGEAE Technology, Inc. 100 DelawareGEAST SAS 80 FranceGEH HOLDINGS 100 United Kingdom & Northern
IrelandGENE Holding LLC 100 DelawareGeneral Electric (Bermuda) Ltd. 100 BermudaGeneral Electric Canada Company 100 CanadaGeneral Electric Canada Holdings Company 100 CanadaGeneral Electric Deutschland Holding GmbH 100 GermanyGeneral Electric Europe Holdings C.V. 100 NetherlandsGeneral Electric Financing C.V. 100 NetherlandsGeneral Electric Foreign Sales Corporation 100 The Bahamas & Eleuthera
IslandGeneral Electric International (Benelux) B.V. 100 NetherlandsGeneral Electric International, Inc. 100 DelawareGeneral Electric International Operations Company, Inc. 100 DelawareGeneral Electric Services (Bermuda) Ltd. 100 BermudaGeneral Electric Services Luxembourg SARL 100 LuxembourgGMC Consolidation LLC 100 DelawareGranite Services, Inc. 100 DelawareGrid Solutions SAS 50 FranceGrid Solutions (U.S.) LLC 50 DelawareIDX Systems Corporation 100 VermontInternational General Electric (U.S.A.) 100 United Kingdom &
North IrelandMRA Systems, LLC 100 DelawareNuclear Fuel Holding Co., Inc. 100 DelawareNuovo Pignone S.p.A. 100 ItalyOEC Medical Systems, Inc. 100 DelawareOne GE Healthcare UK 100 United Kingdom & Northern
IrelandPanametrics Ltd 100 BermudaPatent Licensing International, Inc. 100 DelawarePII Limited 50 United Kingdom & Northern
Ireland

Power Holding LLC 100 DelawareReuter-Stokes, Inc. 100 DelawareRopcor, Inc. 100 DelawareSA Aviation Systems Holdings Inc. 100 DelawareUnison Industries, LLC 100 DelawareViceroy, Inc. 100 DelawareWhatman Limited 100 United Kingdom & Northern
Ireland
(1) With respect to certain companies, shares in names of nominees and qualifying shares in names of directors are included in above percentages.


Exhibit 23Consent of Independent Registered Public Accounting Firm
The Board of Directors General Electric Company:
We consent to the incorporation by reference in the registration statement on Form S-3 (Registration Nos. 33-50639, 333-59671, 333-177803, 333-186882, 333-200003 and 333-209821) on Form S-4 (Registration Nos. 333-72566, 333-107556, 333-208604 and 333-211798), and on Form S-8 (Registration Nos. 333-01953, 333-42695, 333-74415, 333-83164, 333-98877, 333-94101, 333-65781, 333-88233, 333-99671, 333-102111, 333-142452, 333-155587, 333-158069,333-158071, 333-163106, 333-177805, 333-179688, 333-181177, 333-184792, 333-194243 and 333-202435) of General Electric Company of our report datedFebruary 24, 2017 , with respect to the statement of financial position of General Electric Company and consolidated affiliates as of December 31, 2016 and2015, and the related statements of earnings, comprehensive income, changes in shareowners' equity and cash flows for each of the years in the three-yearperiod ended December 31, 2016, and the effectiveness of internal control over financial reporting as of December 31, 2016, which report appears in theDecember 31, 2016 annual report on Form 10-K of General Electric Company.
/s/ KPMG LLP KPMG LLP
Boston, MassachussettsFebruary 24, 2017


Exhibit 24
POWER OF ATTORNEY
KNOW ALL MEN BY THESE PRESENTS, that each of the undersigned, being a director or officer of General Electric Company, a New Yorkcorporation (the "Company"), hereby constitutes and appoints Jeffrey R. Immelt, Alexander Dimitrief, Jeffrey S. Bornstein, Jan R. Hauser, and Christoph A.Pereira, and each of them, his or her true and lawful attorney-in-fact and agent, with full power of substitution and resubstitution, for him or her and in his or hername, place and stead in any and all capacities, to sign one or more Annual Reports for the Company's fiscal year ended December 31, 2016 on Form 10-Kunder the Securities Exchange Act of 1934, as amended, or such other form as any such attorney-in-fact may deem necessary or desirable, any amendmentsthereto, and all additional amendments thereto, each in such form as they or any one of them may approve, and to file the same with all exhibits thereto andother documents in connection therewith with the Securities and Exchange Commission, granting unto said attorneys-in-fact and agents, and each of them, fullpower and authority to do and perform each and every act and thing requisite and necessary to be done so that such Annual Report shall comply with theSecurities Exchange Act of 1934, as amended, and the applicable Rules and Regulations adopted or issued pursuant thereto, as fully and to all intents andpurposes as he or she might or could do in person, hereby ratifying and confirming all that said attorneys-in-fact and agents, or any of them or their substitute orresubstitute, may lawfully do or cause to be done by virtue hereof.
IN WITNESS WHEREOF, each of the undersigned has hereunto set his or her hand this10 th day of February, 2017.
/s/ Jeffrey R. Immelt Jeffrey R. Immelt Chairman of the Board (Principal Executive Officer and Director) /s/ Jeffrey S. Bornstein /s/ Jan R. HauserJeffrey S. Bornstein Jan R. HauserSenior Vice President and Vice President and ControllerChief Financial Officer (Principal Accounting Officer)(Principal Financial Officer)
(Page 1 of 2)

/s/ Sébastien M. Bazin /s/ Robert W. Lane Sébastien M. Bazin Robert W. Lane Director Director /s/ W. Geoffrey Beattie /s/ Rochelle B. Lazarus W. Geoffrey Beattie Rochelle B. Lazarus Director Director /s/ John J. Brennan /s/ Lowell C. McAdam John J. Brennan Lowell C. McAdam Director Director /s/ Francisco D'Souza /s/ Steven M. Mollenkopf Francisco D'Souza Steven M. Mollenkopf Director Director /s/ Marijn E. Dekkers /s/ James J. Mulva Marijn E. Dekkers James J. Mulva Director Director /s/ Peter B. Henry /s/ James E. Rohr Peter B. Henry James E. Rohr Director Director /s/ Susan Hockfield /s/ Mary L. Schapiro Susan Hockfield Mary L. Schapiro Director Director /s/ Andrea Jung /s/ James S. Tisch Andrea Jung James S. Tisch Director Director
A MAJORITY OF THE BOARD OF DIRECTORS
(Page 2 of 2)


Exhibit 31(a)
Certification Pursuant to Rules 13a-14(a) or 15d-14(a) under the Securities Exchange Act of 1934, as Amended
I, Jeffrey R. Immelt, certify that: 1. I have reviewed this annual report on Form 10-K of General Electric Company; 2. Based on my knowledge, this report does not contain any untrue statement of a material fact or omit to state a material fact necessary to make the
statements made, in light of the circumstances under which such statements were made, not misleading with respect to the period covered by this report; 3. Based on my knowledge, the financial statements, and other financial information included in this report, fairly present in all material respects the financial
condition, results of operations and cash flows of the registrant as of, and for, the periods presented in this report; 4. The registrant's other certifying officer and I are responsible for establishing and maintaining disclosure controls and procedures (as defined in Exchange Act
Rules 13a-15(e) and 15d-15(e)) and internal control over financial reporting (as defined in Exchange Act Rules 13a-15(f) and 15d-15(f)) for the registrant andhave:
a) Designed such disclosure controls and procedures, or caused such disclosure controls and procedures to be designed under our supervision, to ensure
that material information relating to the registrant, including its consolidated subsidiaries, is made known to us by others within those entities, particularlyduring the period in which this report is being prepared;
b) Designed such internal control over financial reporting, or caused such internal control over financial reporting to be designed under our supervision, to
provide reasonable assurance regarding the reliability of financial reporting and the preparation of financial statements for external purposes inaccordance with generally accepted accounting principles;
c) Evaluated the effectiveness of the registrant's disclosure controls and procedures and presented in this report our conclusions about the effectiveness of
the disclosure controls and procedures, as of the end of the period covered by this report based on such evaluation; and d) Disclosed in this report any change in the registrant's internal control over financial reporting that occurred during the registrant's most recent fiscal quarter
(the registrant's fourth fiscal quarter in the case of an annual report) that has materially affected, or is reasonably likely to materially affect, the registrant'sinternal control over financial reporting; and
5. The registrant's other certifying officer and I have disclosed, based on our most recent evaluation of internal control over financial reporting, to the registrant's
auditors and the audit committee of the registrant's board of directors (or persons performing the equivalent functions): a) All significant deficiencies and material weaknesses in the design or operation of internal control over financial reporting which are reasonably likely to
adversely affect the registrant's ability to record, process, summarize and report financial information; and b) Any fraud, whether or not material, that involves management or other employees who have a significant role in the registrant's internal control over
financial reporting.
Date: February 24, 2017
/s/ Jeffrey R. Immelt Jeffrey R. Immelt Chief Executive Officer


Exhibit 31(b)Certification Pursuant to
Rules 13a-14(a) or 15d-14(a) under the Securities Exchange Act of 1934, as Amended
I, Jeffrey S. Bornstein, certify that: 1. I have reviewed this annual report on Form 10-K of General Electric Company; 2. Based on my knowledge, this report does not contain any untrue statement of a material fact or omit to state a material fact necessary to make the
statements made, in light of the circumstances under which such statements were made, not misleading with respect to the period covered by this report; 3. Based on my knowledge, the financial statements, and other financial information included in this report, fairly present in all material respects the financial
condition, results of operations and cash flows of the registrant as of, and for, the periods presented in this report; 4. The registrant's other certifying officer and I are responsible for establishing and maintaining disclosure controls and procedures (as defined in Exchange Act
Rules 13a-15(e) and 15d-15(e)) and internal control over financial reporting (as defined in Exchange Act Rules 13a-15(f) and 15d-15(f)) for the registrant andhave:
a) Designed such disclosure controls and procedures, or caused such disclosure controls and procedures to be designed under our supervision, to ensure
that material information relating to the registrant, including its consolidated subsidiaries, is made known to us by others within those entities, particularlyduring the period in which this report is being prepared;
b) Designed such internal control over financial reporting, or caused such internal control over financial reporting to be designed under our supervision, to
provide reasonable assurance regarding the reliability of financial reporting and the preparation of financial statements for external purposes inaccordance with generally accepted accounting principles;
c) Evaluated the effectiveness of the registrant's disclosure controls and procedures and presented in this report our conclusions about the effectiveness of
the disclosure controls and procedures, as of the end of the period covered by this report based on such evaluation; and d) Disclosed in this report any change in the registrant's internal control over financial reporting that occurred during the registrant's most recent fiscal
quarter (the registrant's fourth fiscal quarter in the case of an annual report) that has materially affected, or is reasonably likely to materially affect, theregistrant's internal control over financial reporting; and
5. The registrant's other certifying officer and I have disclosed, based on our most recent evaluation of internal control over financial reporting, to the
registrant's auditors and the audit committee of the registrant's board of directors (or persons performing the equivalent functions): a) All significant deficiencies and material weaknesses in the design or operation of internal control over financial reporting which are reasonably likely to
adversely affect the registrant's ability to record, process, summarize and report financial information; and b) Any fraud, whether or not material, that involves management or other employees who have a significant role in the registrant's internal control over
financial reporting.
Date: February 24, 2017
/s/ Jeffrey S. Bornstein Jeffrey S. Bornstein Chief Financial Officer


Exhibit 32Certification Pursuant to
18 U.S.C. Section 1350
In connection with the Annual Report of General Electric Company (the "registrant") on Form 10-K for the period ended December 31, 2016, as filed with theSecurities and Exchange Commission on the date hereof (the "report"), we, Jeffrey R. Immelt and Jeffrey S. Bornstein, Chief Executive Officer and ChiefFinancial Officer, respectively, of the registrant, certify, pursuant to 18 U.S.C. § 1350, that to our knowledge:
(1)
The report fully complies with the requirements of section 13(a) or 15(d) of the Securities Exchange Act of 1934, as amended; and
(2)
The information contained in the report fairly presents, in all material respects, the financial condition and results of operations of the registrant.
February 24, 2017
/s/ Jeffrey R. Immelt Jeffrey R. Immelt Chief Executive Officer
/s/ Jeffrey S. Bornstein Jeffrey S. Bornstein Chief Financial Officer


Exhibit 99(c)Supplement to Present Required Information in Searchable Format
FIVE-YEAR PERFORMANCE GRAPH 2011 2012 2013 2014 2015 2016 GE $ 100 $ 121 $ 167 $ 156 $ 199 $ 208 S&P 500 100 116 154 175 177 198 DJIA 100 110 143 157 158 184 STOCK PRICE RANGE AND DIVIDENDS Common stock market price Dividends High Low declared 2016 Fourth quarter $ 32.38 $ 28.19 $ 0.24 Third quarter 33.00 29.40 0.23 Second quarter 32.02 29.06 0.23 First quarter 32.05 27.10 0.23 2015 Fourth quarter $ 31.49 $ 24.79 $ 0.23 Third quarter 27.33 19.37 0.23 Second quarter 28.68 24.57 0.23 First quarter 26.27 23.41 0.23 INDUSTRIAL ORDERS 2016 2015(In billions) Equipment Services Equipment Services Power $ 13.5 $ 18.4 $ 9.4 $ 13.9Renewable Energy 8.5 1.7 6.9 0.5Oil & Gas 3.7 7.4 6.6 8.5Aviation 10.0 16.3 13.6 14.8Healthcare 11.4 7.8 10.8 7.8Transportation 0.4 3.0 4.0 3.0Energy Connections & Lighting 9.2 2.6 6.5 2.3 Consolidated $ 55.2 $ 55.7 $ 56.5 $ 49.5 INDUSTRIAL BACKLOG 2016 2015(In billions) Equipment Services Equipment Services Power $ 17.6 $ 67.0 $ 13.8 $ 63.2Renewable Energy 7.8 5.2 8.7 3.7Oil & Gas 6.5 14.3 9.5 13.4Aviation 33.3 121.3 34.9 116.3Healthcare 5.6 11.2 5.6 11.6Transportation 4.4 15.7 6.5 15.9Energy Connections & Lighting 9.3 1.8 9.9 1.9 Consolidated $ 84.1 $ 236.8 $ 88.6 $ 225.9 SEGMENT REVENUES 2016 2015 2014(In billions) Equipment Services Equipment Services Equipment Services Power $ 9.6 $ 17.2 $ 8.0 $ 13.5 $ 8.4 $ 12.2Renewable Energy 8.2 0.9 5.8 0.5 6.0 0.4Oil & Gas 6.0 6.9 8.3 8.1 10.2 8.9Aviation 11.6 14.7 11.8 12.9 12.4 11.6Healthcare 10.4 7.9 9.9 7.8 10.3 8.0Transportation 2.3 2.4 3.2 2.7 2.9 2.8Energy Connections & Lighting 12.7 2.4 13.9 2.4 13.2 2.5 Consolidated $ 60.8 $ 52.4 $ 60.9 $ 47.9 $ 63.3 $ 46.4