gdp and the standard of living - university of...
TRANSCRIPT
GDP AND THE STANDARD OF LIVING

When you have completed your study of this chapter, you will be able to
C H A P T E R C H E C K L I S T
Define GDP and explain why the value of production, income, and expenditure are the same for an economy.
1
Describe how economic statisticians measure GDP in the United States.Distinguish between nominal GDP and real GDP and define the GDP deflator.
2
3
Explain and describe the limitations of real GDP as a measure of the standard of living.
4

13.1 GDP, INCOME, AND EXPENDITURE
<GDP Defined
Gross domestic product or GDP
The market value of all the final goods and services produced within a country in a given time period.
Value Produced• Use market prices to value production.
13.1 GDP, INCOME, AND EXPENDITURE
What Produced
Final good or service
A good or service that is produced for its final user and not as a component of another good or service.
Intermediate good or service
A good or service that is produced by one firm, bought by another firm, and used as a component of a final good or service.
GDP includes only those items that are traded in markets.
13.1 GDP, INCOME, AND EXPENDITURE
Where Produced• Within a country
When Produced• During a given time period.
13.1 GDP, INCOME, AND EXPENDITURE
<Circular Flows in the U.S. Economy
Consumption expenditure
The expenditure by households on consumption goods and services.
Investment
The purchase of new capital goods (tools, instruments, machines, buildings, and other constructions) and additions to inventories.

13.1 GDP, INCOME, AND EXPENDITURE
Government purchases of goods and services
The expenditure by all levels of government on goods and services.
Net exports of goods and services
The value of exports of goods and services minus the value of imports of goods and services.

13.1 GDP, INCOME, AND EXPENDITURE
Exports of goods and services
Items that firms in in the United States sell to the rest of the world.
Imports of goods and services
Items that households, firms, and governments in the United States buy from the rest of the world.
13.1 GDP, INCOME, AND EXPENDITURE
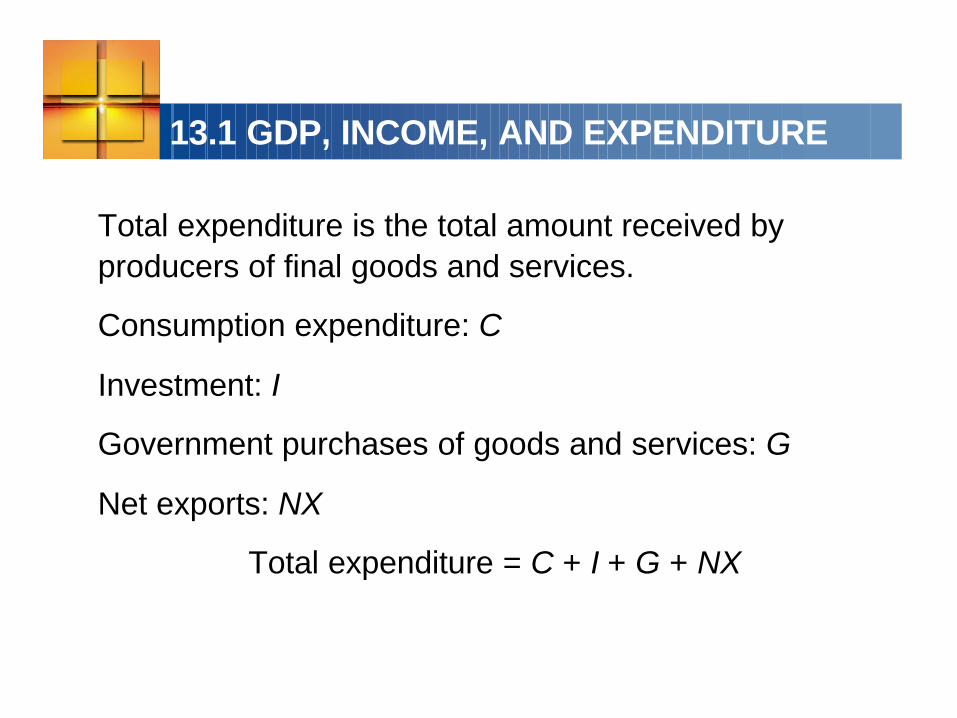
Total expenditure is the total amount received by producers of final goods and services.
Consumption expenditure: C
Investment: I
Government purchases of goods and services: G
Net exports: NX
Total expenditure = C + I + G + NX
13.1 GDP, INCOME, AND EXPENDITURE
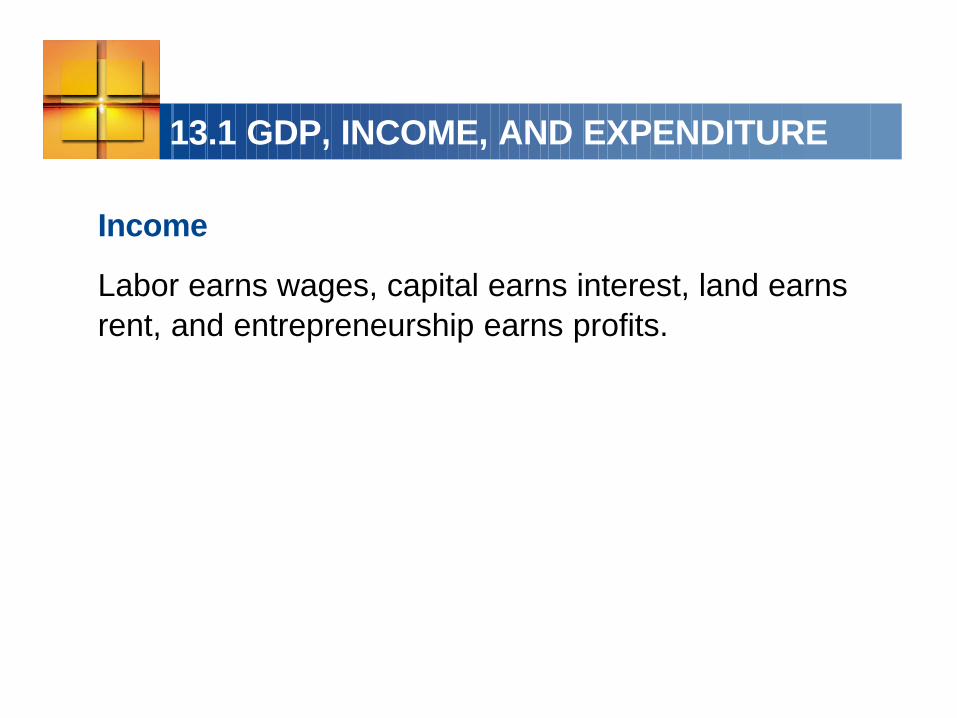
Income
Labor earns wages, capital earns interest, land earns rent, and entrepreneurship earns profits.

13.1 GDP, INCOME, AND EXPENDITURE
<Expenditure Equals Income
Because firms pay out everything they receive as incomes to the factors of production, total expenditure equals total income.
That is:
Y = C + I + G + NX
The value of production equals income equals expenditure.
13.1 GDP, INCOME, AND EXPENDITURE
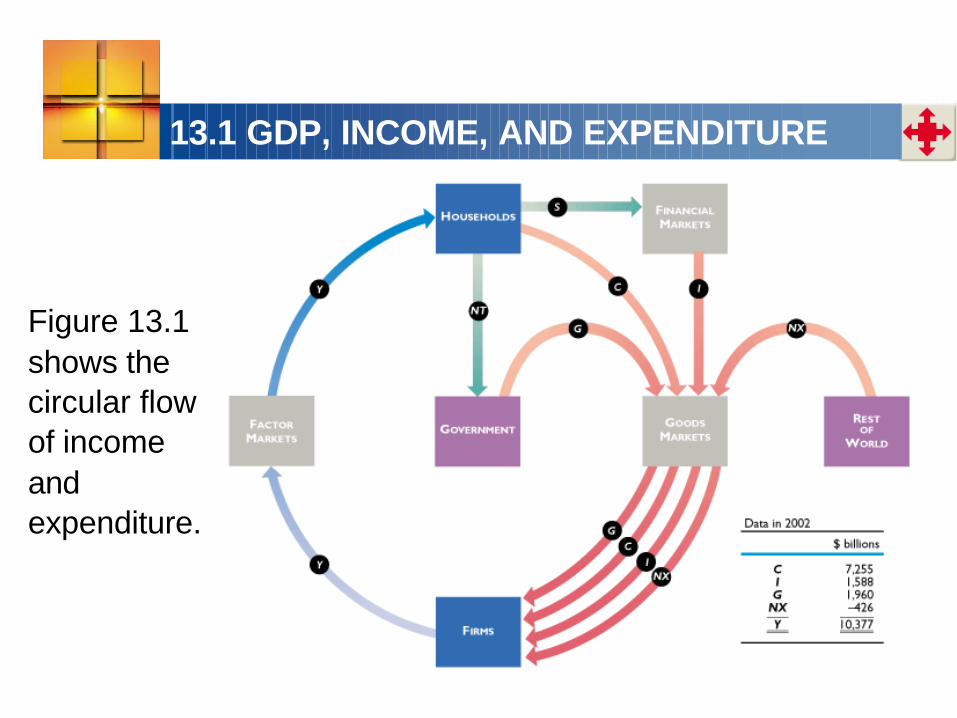
Figure 13.1 shows the circular flow of income and expenditure.

13.2 MEASURING U.S. GDP
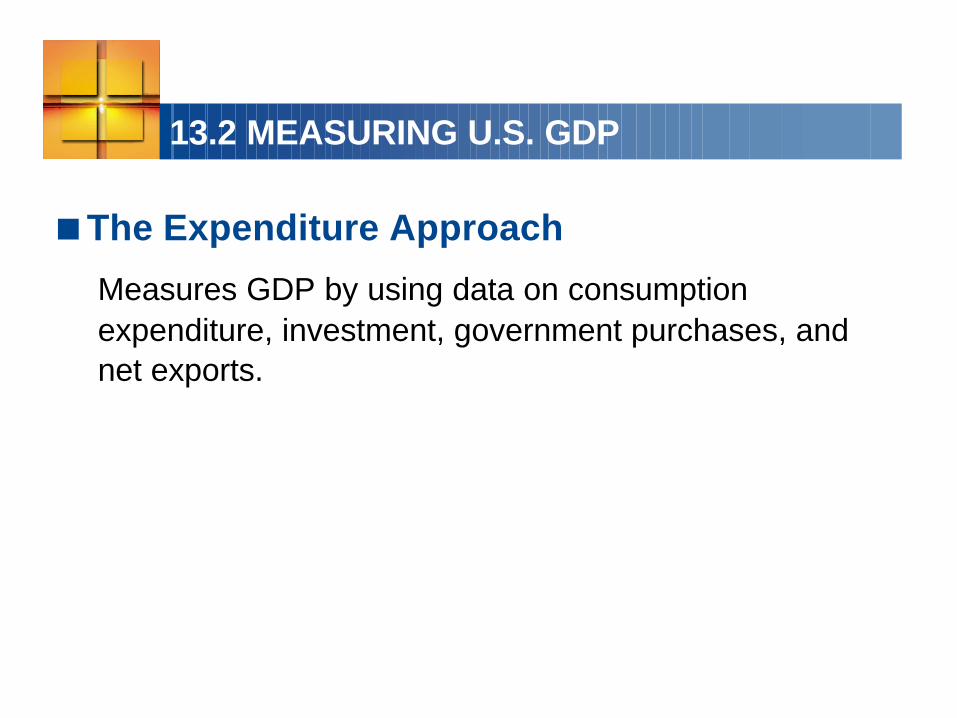
<The Expenditure Approach
Measures GDP by using data on consumption expenditure, investment, government purchases, and net exports.

13.2 MEASURING U.S. GDP
13.2 MEASURING U.S. GDP
<Expenditures Not in GDP
Used Goods
Expenditure on used goods is not part of GDP because these goods were part of GDP in the period in which they were produced and during which time they were new goods.
Financial Assets
When households buy financial assets such as bonds and stocks, they are making loans, not buying goods and services.

13.2 MEASURING U.S. GDP
<The Income approach
Measures GDP by summing the incomes that firms pay households for the factors of production they hire.
The National Income and Product Account divide incomes into five categories:
• Compensation of employees• Net interest• Rental income of persons• Corporate profits• Proprietors’ income
13.2 MEASURING U.S. GDP
Compensation of EmployeesPayment for labor services.Net wages and salaries plus fringe benefits paid by employers such health care insurance, social security contributions, and pension fund contributions.
Net InterestThe interest households receive on loans they make minus the interest households pay on their own borrowing.
13.2 MEASURING U.S. GDP
Rental Income of PersonsRental income of persons is the payment for the use of land and other rented inputs.
Corporate ProfitsA combination of interest on capital and profit for entrepreneurship. Paid out as dividends and undistributed profits are all counted as income.
Proprietors’ IncomeProprietors are people who run their own businesses. A mixture of the previous four items.

13.2 MEASURING U.S. GDP
Net domestic product at factor cost
The sum of the five components of incomes—compensation of employees, net interest, rental income of persons, corporate profits, and proprietors’ income
13.2 MEASURING U.S. GDP
From Factor Cost to Market Price
The expenditure approach values goods and services at market prices and the income approach values them at factor cost.
Sales taxes make market prices exceed factor cost.
Subsidies make factor cost exceed market prices.
To convert the value at factor cost to the value at market prices, we must:
• Add indirect taxes • Subtract subsidies

13.2 MEASURING U.S. GDP
From Gross to Net
The expenditure approach measures gross product, and the income approach measures net product.
Gross profit is a firm’s profit before subtracting the depreciation of capital.
Net profit is a firm’s profit after subtracting the depreciation of capital.
Depreciation
The decrease in the value of capital that results from its use and from obsolescence—also called capital consumption.
13.2 MEASURING U.S. GDP
Income includes net profit, so the income approach gives a net measure.
Expenditure includes investment. Because some new capital is purchased to replace depreciated capital, the expenditure approach gives a gross measure.
To get gross domestic product from the income approach, we must add depreciation to total income.

13.2 MEASURING U.S. GDP
13.2 MEASURING U.S. GDP
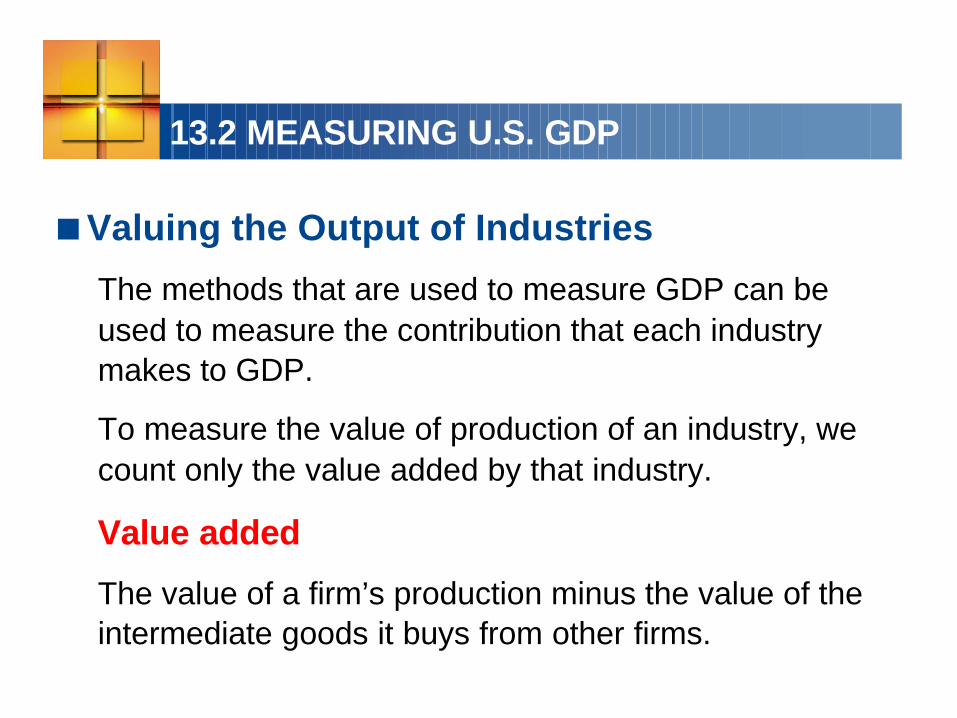
<Valuing the Output of Industries
The methods that are used to measure GDP can be used to measure the contribution that each industry makes to GDP.
To measure the value of production of an industry, we count only the value added by that industry.
Value added
The value of a firm’s production minus the value of the intermediate goods it buys from other firms.
13.2 MEASURING U.S. GDP
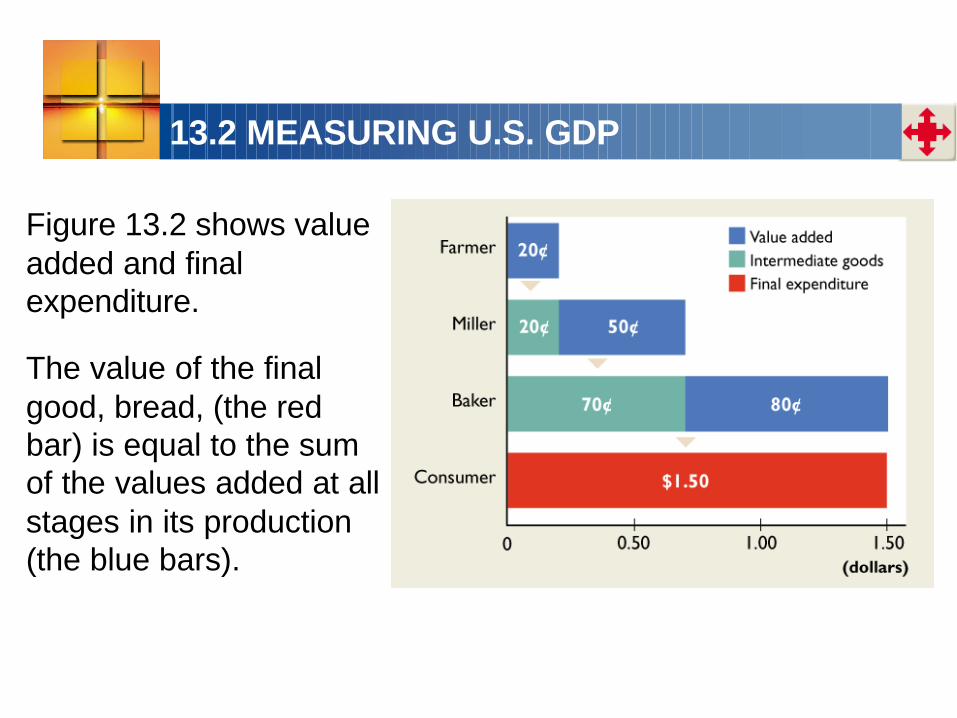
Figure 13.2 shows value added and final expenditure.
The value of the final good, bread, (the red bar) is equal to the sum of the values added at all stages in its production (the blue bars).

13.3 NOMINAL GDP VERSUS REAL GDP
<Calculating Real GDP
Real GDP
The value of the final goods and services produced in a given year when valued at constant prices.
Nominal GDP
The value of the final goods and services produced in a given year valued at the prices that prevailed in that same year.
The first step toward calculating real GDP is to calculate nominal GDP.

13.3 NOMINAL GDP VERSUS REAL GDP
To calculate nominal GDP in 2002, sum the expenditures on apples and oranges in 2002.Expenditure on apples = 100 apples x $1 = $100Expenditure on oranges =200 oranges x $0.50 = $100Nominal GDP in 2002 = $100 + $100 = $200

13.3 NOMINAL GDP VERSUS REAL GDP
To calculate nominal GDP in 2003, sum the expenditures on apples and oranges in 2003.Expenditure on apples = 160 apples x $0.50 = $80Expenditure on oranges = 220 oranges x $2.25 = $495Nominal GDP in 2002 = $80 + $495 = $575
13.3 NOMINAL GDP VERSUS REAL GDP
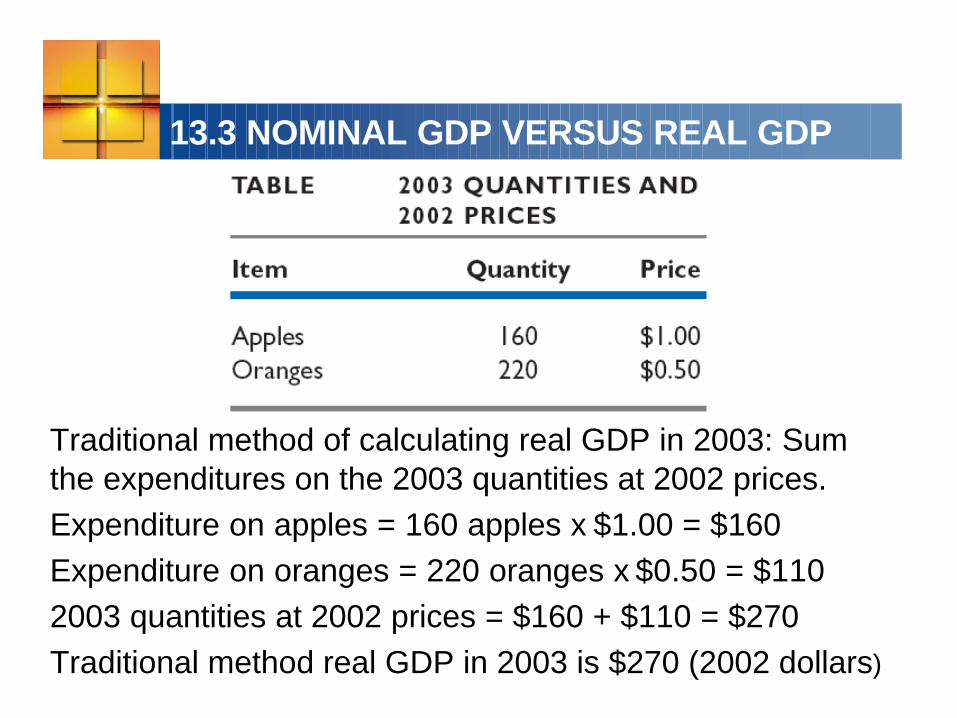
Traditional method of calculating real GDP in 2003: Sum the expenditures on the 2003 quantities at 2002 prices.Expenditure on apples = 160 apples x $1.00 = $160Expenditure on oranges = 220 oranges x $0.50 = $1102003 quantities at 2002 prices = $160 + $110 = $270Traditional method real GDP in 2003 is $270 (2002 dollars)

13.3 NOMINAL GDP VERSUS REAL GDP
When we value 2003 production in 2002 prices, production increased from $200 to $270 (2002 dollars), an increase of 35 percent.
The new method of calculating real GDP uses this percentage increase but combines it with another one—the percentage increase in production when we use the prices of 2003 to compare 2002 and 2003.

13.3 NOMINAL GDP VERSUS REAL GDP
We need to calculate the sum of the expenditures on the 2002 quantities valued at 2003 prices.Expenditure on apples = 100 apples x $0.50 = $50Expenditure on oranges = 200 oranges x $2.25 = $4502002 quantities at 2003 prices = $50 + $450 = $500.GDP in 2002 is $500 when valued in 2002 dollars.

13.3 NOMINAL GDP VERSUS REAL GDP
When we value 2003 production in 2002 prices, production increased from $200 to $270 (2002 dollars), an increase of 35 percent.
When we value 2002 production in 2003 prices, production increased from $500 to $575 (2003 dollars), an increase of 15 percent.
The new method of calculating real GDP takes the average of 35 percent and 15 percent, which is 25 percent.
Real GDP in 2003 is $250 (2002 dollars).

13.3 NOMINAL GDP VERSUS REAL GDP
Chain Linking
The calculations are repeated each year.
For example, to calculate real GDP in 2004, we repeat the above calculations but we use the prices and quantities of 2003 and 2004.
Real GDP in 2004 equals real GDP in 2003 increased by the calculated percentage change in real GDP for 20034.
Real GDP in each year is in 2002 prices.

13.3 NOMINAL GDP VERSUS REAL GDP
Chain Linking
Each pair of years is like a link in a chain.
The entire chain links the current year back to the reference base year

13.3 NOMINAL GDP VERSUS REAL GDP
<Calculating the GDP Deflator
GDP deflator
An average of current prices expressed as a percentage of base-year prices

13.3 NOMINAL GDP VERSUS REAL GDP
GDP deflator = (Nominal GDP ÷ Real GDP) x 100
If nominal GDP rises but real GDP remains unchanged, prices have risen. The larger the nominal GDP for a given real GDP, the higher is the price level and the larger is the GDP deflator.

13.4 THE STANDARD OF LIVING
<Goods and Services Omitted from GDP
Household production
Underground production
Leisure time
Environment quality
13.4 THE STANDARD OF LIVING
Household Production• Real GDP omits household production, it
underestimates the value of the production of many people, most of them women.
Underground Production• Hidden from government to avoid taxes and
regulations or illegal. • Because underground economic activity is
unreported, it is omitted from GDP.
13.4 THE STANDARD OF LIVING
Leisure Time• Our working time is valued as part of GDP, but our
leisure time is not.
Environment Quality• Pollution is not subtracted from GDP. • We do not count the deteriorating atmosphere as a
negative part of GDP. • If our standard of living is adversely affected by
pollution, our GDP measure does not show this fact.

13.4 THE STANDARD OF LIVING
<Other Influences on the Standard of Living
Health and Life Expectancy• Good health and a long life do not show up directly
in real GDP.
Political Freedom and Social Justice• A country might have a very large real GDP per
person but have limited political freedom and social justice.
• A lower standard of living than one that had the same amount of real GDP but in which everyone enjoyed political freedom.