gcse unit 2 revision-edited for 2014
TRANSCRIPT

Year 11 Revision Booklet
GCSE Geography-Unit 2
Edexcel B
People and the Planet

Exam structure
• The exam will last for 1 hour
• You need to answer ALL questions in Section A
• The Changing Economy of the UK question in Section B
• The Challenges of an urban worldquestion in Section C
DO NOT ANSWER QUESTIONS ON Changing settlements in the UK OR
the Challenges of a Rural World.

Topic 1: Population Dynamics
What you need to know:
• What has happened to the global population –past, present, future?
• Which factors affect birth and death rates
• Factors driving recent changes in fertility and mortality rates
• How and why population change varies
• How and why population structures change
• Issues relating to youthful and ageing populations
• Why some countries wish to control their population
• The impact and effectiveness or polices to control population
• Differing policies that exist to mange migration
• Why countries adopt different migration policies
• Tensions that arise as a result of migrations

What’s happening?
The global population over time
• The world population is growing fast, in 2008 at least another 65 million people were added to the global total of 6.6 billion.
• Since 2000 the rate of growth has begun to slow down.
Exponential Growth has been occurring in the population growth. That is the amount of time taken for the population to double . For example, in 1804 it had taken the population 300 years to double from ½ billion to 1 billion. In 1999 the doubling time had fallen to 39 years.
Describe the trends in the graph (3 marks)

Why has population been increasing?Development of modern medicines. This has meant that more and more people are kept alive due to modern practices.
Introduction of vaccination and immunisation programmes e.g. smallpox vaccination that helps people to live longer.
Cleaner drinking water and better sewage disposal, a lot more people have access to clean drinking water than before. Better healthcare – more doctors, nurses and hospitals, means that people can be treated and not die. More hygienic housing. Better diets, e.g. promoting eating ‘5 a day’
Key termsBirth rate – the amount of babies born per 1000 of the population per yearDeath rate - the amount of deaths per 1000 of the population per yearImmigrants – people moving into a countryEmigrants – people moving out of a countryMigration – movement of people into and out of an area or country
Migration balance:Positive more immigrants than emigrants – increase population,Negative decrease population – less immigrants than emigrants – decrease populationNatural increase – birth rate is higher than death rate = population increaseReplacement Level – the amount of babies needed to be born for the population to remain the same

How and why population change varies
Demographic Transition Model – Fill the gaps
• Stage 1: High fluctuating
• - High birth rate due to no birth control and high infant mortality
• - High death rate due to disease and famine
• Stage 2: Early expanding
• - High _______rate
• - Falling ________ rates due to improved _______care and nutrition
• Stage 3: late expanding
• - Falling birth rates due to birth control and wanting smaller _______
• - Falling ________ rates
• Stage 4: low fluctuating
• - Low _______ and _____ rates due to working women delaying time to start their ________
• Stage 5: Decline
– Death rate higher than birth rate due to a ______ population

Population Pyramids

Issues relating to youthful and ageing populations
Youthful population
- This is when there are a very high percentage of people under the age of 15. Problems:Pressure on housing – not enough housing, people living in slums. This is very common around the big cities (New Delhi), where millions of people live in shanty towns.Pressure on schooling – illiterate population. India’s literacy rate is 60%Pressure on food supplies - famine, food distribution difficulties. Pressure on health services – a growth in diseases being spread
Ageing population
- This is when a country has a large number of people over the age of 65 in their country. Problems:Health careProvide more health care e.g. retirement homes, hospital beds, more undertakers, etc.. Skilled health care workers, e.g. nurses, doctors, etc.. Pensions3 solutionsIncrease tax – not popularRaise retirement age – not popular Abolish state pensions – not popular

Contrasting countries Japan vs. Mexico
Ageing Population – Japan Youthful Population - Mexico
Facts Causes Effects- 20.8% of population aged +65- 26.8 million pensioners- Birth rate below replacement level
- People living longer (79 for men & 85 for women). Due to healthy diet and high GDP- Birth rate declining due to increase age of first child (2006 29.2 years) and number of marriages has decreased
- Increase cost of pensions as fewer workers - Government raised retirement age from 60 to 65- Increase in numbers in nursing homes- Increase cost of medical care
Facts Causes Effects- 31% of population under 15- Population grew 50 million in 40 years- Average age in 26
- Low death rate at 4.78 deaths per 1000. due to vaccinations and doctors- falling birth rate but large % of young people- Will take 50 years for Mexico to loose it’s youthful population
- Increase need for school places- Young people unable to find work so emigrate to USA- Growing manufacturing industry- Strongly catholic but abortion has been legalised to reduce number of children
Exam question:Describe the causes and effects of ageing or youthful populations

Case Study: Anti-Natalist –China’s one child Policy
Anti –natalist – encouraging people to have fewer
children.
What? Why? Effects• Introduced in 1970s –
couples not allowed to have more than one child.
• Couples with one child were given benefits e.g. cash bonuses, better childcare and improved housing.
• Unauthorised pregnancies pressured to have abortions
-High growth rate of population- Pressure on land and food supplies due to large population
-Birth rate fell from 34 per 1000 in 1970 to 13 per 1000 in 2008- Annual population growth rate fell from 2.4% to 0.6%-Total population grown from 996 million in 1980 to 1,320 million today-Chinese tradition to prefer sons so sex selective abortions occurred (120 males to 100 females- Shortage of women at marrying age
What? Why? Effects Introduce ‘mother’s salary’
where women were paid to have children
- 15 months fully paid maternity leave
-Estonia became independent from Russia in 1992- Falling population due to fertility rate declining from 2.2 in 1988 to 1.4 in 1998- People planning fewer children due to increase poverty, single lifestyles and young people migrating overseas
-By 2006 fertility rate rose to 1.5 (still below replacement level)
Pro-Natalist: Estonia
Pro-Natalist – Incentives to encourage people to have more children.
Which policy was most successful?Why?

Differing policies that exist to mange migration
UK Case StudyOpen Door- Post War immigrants came to UK from colonies in the Caribbean due to an Act of Parliament giving all Commonwealth (ex-colonial) citizens free entry into the UK. (1950-1960s ¼ million people came from the Caribbean).Positive = Met shortage of unskilled and semi-skilled labour= Helped with the reconstruction of the country post warNegative = public money spent on meeting needs of the immigrants e.g. housing etc.= 1970s recession, the immigrants lead to increased unemploymentPoint Based systemIf you wish to come and work to settle down you need to gain a certain amount of points. Points are based on skills and jobs where the UK needs people.
Source advantages Host Advantages
Immigrants send money/remittances home to their families
Less than 5% claim any sort of state benefit
during the 1970s recession the immigrants added to the number of unemployed
meets need of shortage of unskilled and semi-skilled labour
helped to reconstruct UK after the war Immigrants contribute to the UK
economy by the taxes they pay Immigrants bring skills back to their
country
Source disadvantages Host disadvantages
Loss of working population from Poland for example
Less pressure on resources and jobs in places like Poland etc.
Immigrants often take mainly low paid jobs
public money spent on immigrants e.g. housing and healthcare
Increased hostility towards the immigrants
Increases culture in the UK Decline in birth rate as most migrants
are young men
Complete the table by putting the statements in the correct box.


Topic 2: Consuming Resources
What you need to know:
• How resources can be defined and classified• The impacts of obtaining and consuming one renewable,
sustainable and non-renewable resources• Inequalities in supply and consumption of one global resource• Future pressures on both supply and consumption of this
resource in view of recent global economic growth• Theories about the population-resource equation• How well these theories stand up to current global resource
supply and demand• How resource demand might be reduced• The potential for alternative and renewable resources• Whether technology can ‘fix’ the problem

How resources can be defined and classified
There are three main types:• Natural resources e.g. wood • Human resources e.g. skills of a population e.g. Doctors• Material or capital resources e.g. good and equipment already in
society).
You can also define resources via their availability- Non-renewable resources – cannot be remade because they take millions of years to form again e.g. coal or oil- Sustainable resources – Can be deliberately be renewed so that it can last into the future e.g. planting trees- Renewable resources – renew themselves so do not need to be managed e.g. solar and wind power
Resource Benefits Costs
Non-renewable e.g. Tar Sand oil (Canada) or Natural gas (Europe)
- Extraction would bring further money to oil companies- could avoid the costs of switching to other fuels such as hydrogen
- Extraction uses huge amounts of water- only 5 year supply - need removal of forest to get to the oil
Sustainable and renewable e.g. Bio fuels India
- C02 absorbed when they are grown- engines need little change to cope with bio fuels
- need huge area of land to grow the crop- reduces habitat variety due to monoculture
Sustainable but limited e.g. Solar energy or Wind power (USA)
- Unlimited- Environmentally friendly so limited carbon emissions
- Intermittent as new ways of storing electricity are needed- Current production is tiny- Relatively expensive

Inequalities in supply and consumption of one global resource -Oil
• World reserve of oil (%)
• Saudi Arabia (22.3%)
• Iran (11.2%)
• Kuwait (9.7%)
• UAE (8.3%)
• Venezuela (6.5%)
• Russia (6.3%)
• Kazakhstan (3.4%)
• Libya (3.3%)
• Nigeria (3.0%)
• USA (1.8%)
• China (1.4%)
• Canada (1.4%)
• Qatar (1.3%)
‘peak oil’
production of relatively cheaply obtained oil has reached its maximum so there is now a fall in production.
Compare and Contrast the maps and graph data. Read the titles carefully.

Theories about the population and resources
Malthus Theory (1766-1834)
• Population increases faster than food supply so there would come a time when the world could not cope.
• - Population increases geometrically (1, 2, 4, 8, and 16)
• - Food supply increases arithmetically(1, 2, 3, 4, and 5)
• - Population would outgrow the amount of food available leading to famine, war and disease
• Malthus argued that there were ways to prevent population from extending beyond the food supplies necessary to support it (optimum population). This includes a combination of
• 1. ‘Negative’: Methods people choose to reduce human fertility e.g. China’s one child policy, sterilisation
• 2.’ Positives’: Anything which increases mortality: e.g. low living standards, disease
• Malthus argued that this would kept the carrying capacity in check the
• Number of plants, animals or human which can be adequately supported (carried) by the land
Boserup Theory 1965• Population growth has a
positive impact on people as it forces them to invent a way out of a problem when resources start to run out e.g. GM crops
• Overpopulation leads to innovation and higher productivity in use of land (irrigation, weeding, crop intensification, better seeds) and labour (tools, better techniques) e.g. GM Crops and the Green Revolution
Who was right?• Malthus was – see famines in
Ethiopia etc.• Malthus was wrong as food
production has kept up or surpassed demand
• Boserup was correct also e.g. GM crops
Outline the main differences between Malthus Theory and Boserup’s Theory

How resource demand might be reduced
Reducing the dependence on oil
• Plastic water bottles are made from oil and then oil is used to transport them across great distances.
• Now carrying refillable bottles of water and recycling the bottle
• Switch to hydrogen run cars as they release no harmful emissions. E.g. The Ford Edge car is first alternative fuel car to be able to travel similar distances to traditional petrol cars.
Individual action
• changing habits e.g. using public transport and switching to energy efficient light bulbs et
• Recycling and conservation –
• Buying food from local farm shops to reduce ‘food miles’
Corporate (business) Action:
• Google Headquarters uses hydrogen cars which are renewable and also provides a bus shuttle to pick up its employers to reduce their car usage
Can you explain how the pictures could reduce the demand for oil?

How resource demand might be reduced-Cont’
The aim is to achieve ‘SUSTAINABLE DEVELOPMENT’:
‘This is development that meets the needs of the present without compromising the ability of future generations to meet their own needs’
The potential for alternative and renewable resources
• In 1995 the UK generated 2% of its electricity from renewable sources compared with the EU average of 14%.
• The government set its target of reaching 10% by 2010. • This they believe is achievable as the average costs for wind, hydro,
landfill gas and waste-burning fell dramatically during the 1990s. • However, UK government achieved only 6% by 2010. • There is still however a huge market for the UK to switch towards
more renewable resources of energy.
Whether technology can ‘fix’ the problem
• Technological fix is the idea that we can resolve problems we might have by inventing solutions to them.
• The problem of finding alternative fuels to replace ‘cheap’ oil would need high amounts of effort from governments, corporations and researchers to cope with the issue of ‘peak oil’.


Topic 3: Globalisationhttp://www.youtube.com/watch?v=3oTLyPPrZE4&safe=active
Globalisation and the growth of the global economy have led to huge changes in the pattern of employment around the world. As countries develop, so the type of
work available and the working conditions change. Trade and financial direct investment fuel the growth of the global economy, along with the activities of the key
players, the Trans National corporations.

You need to know:
• 3.1 How does the economy of the
globalised world function in
different places?
• 3.2 What changes have taken
place in the flow of goods and
capital?

Key term Definition
Automation The use of machinery rather than people, in manufacturing and data processing
Deindustrialisation
Factories closing down in the 1980’s
Employment Structure
The proportion of people working in each of the primary, secondary and tertiary sector
Flows A system of linkages between objects, places orindividuals
Foreign direct Investment
a direct investment into production or business in a country by an individual or company of another country.
Global Economy The international spread of goods and services, especially in recent decades, across national boundaries and with minimal restrictions by governments.
Global Shift Cross border i0nteractions between nations, businesses and people
Globalisation The movement of objects, people and ideas between places.
Industrialisation Where a mainly agricultural society changes and begins to depend on manufacturing industries instead.

Key term DefinitionInformal Sector Forms of employment that are not officially
recognised e.g. People working for themselves on the streets of developing cities.
International Monetary Fund
A US based organisation that raises funds from the worlds wealthier countries, to help countries which become economically unstable like Greece.
Merger When one country takes over another one
Networks Expanding travel networks communication technologies easily connect manufactures and overseas buyers
Newly Industrialised Countries
Like China, India and Brazil
Outsourcing A process in which a company subcontracts part of its business to another company
Players Individuals and groups who are interested in and affected by a decision making process
Primary sector People extract raw material from the land or sea e.g. farming

Key term DefinitionQuaternary Sector
Provide information and expert help e.g. IT
Secondary Sector
People are involved in manufacturing e.g. house building
sweatshops A factory where workers are expected to work very long hours, with low pay and poor working conditions.
Teleworking Also called: telecommuting the use of home computers, telephones, etc, to enable a person to work from home while maintaining contact with colleagues, customers, or a central office.
Tertiary Sector provide a services e.g. selling goods or nursing
TNC’s Trans National Corporations - a giant company operating in many countries
WTO World Trade Organisation

Globally LEDC’s such as Nigeria and Kenya have high amounts of primary industries due to the fact that there is a lack of education and they are mainly subsidence farmers. MEDC's such as UK and USA tend to focus on Tertiary activities due to higher education rates and tertiary jobs are higher paid. Primary is low due to the fact that most MEDC’s have taken to importing food stuffs etc as it is cheaper.
Economies start to
develop and incomes
rise = demand for
manufactured goods
increase =
secondary industry
grows
Incomes continue
to rise, people start
to consume more
services = tertiary
sector grows
Tertiary services support
and promote quaternary
servicesIn the pre-industrial stage low-income countries are mainly employed in primary production, middle income countries are focused on secondary industries and finally high-income countries are dominated by the tertiary sector.
This model tell us how employment changes over time and how the balance of employment changes as a country develops. However it does assume that there is a simple straight development path from LEDC’s to MEDC’s.
Key Idea 1: Why are there changing employment structure in countries at
different stages of development. The Clarke Fisher Employment Structure Model

Named example 1 - Contrast working conditions in different countries - Ghana
https://www.youtube.com/watch?v=5EHS_hFpR8E - Watch this to help you understand this.

Named example 1 - Ghana
Ghana is a pre industrial economy
The percentages of each employment sector are:
Primary 50%Secondary 16%Tertiary 33%
What jobs do people do?Many people are still employed on small scale farms in agriculture ( subsistence farming).
There is little commercial farming -mainly growing Cocoa a major export crop.The secondary sector is small and jobs are mainly filled by men.
Many people are also still employed in Informal jobs - which means that they are not formally recognised and therefore employees do not pay any taxes
What are Ghana’s biggest exports and why do they not earn much from these exports?
Cocoa, Diamonds, timber and flowers are Ghana's main exports –but these are often raw materials and not the more expensive finished manufactured products.
What are working conditions like?
Working conditions are tough particularly on the farms where the work is often hard manual labour because there has been a lack of mechanisation and there are often harsh physical conditions.
People who work in the informal sector – Mostly women and children are likely to suffer abuse and exploitation.
Which sector will be important to Ghana in the future and in particular which industry will provide many of the jobs?
In the future there will be an increase in tertiary jobs specifically in the tourist sector.

Named example 2 – China Working conditions
Watch the clip below:
http://www.youtube.com/watch?v=sgbxUDvncko&safe=active

Named example 2 - China
China is an Industrial country
The percentages of each employment sector are:
Primary 48%Secondary 25%Tertiary 18%
What jobs do people do?Many people are still employed in China’s growing manufacturing Industries in large factories.
China’s Primary sector is also still important and it is not just agriculture but also Mining particularly for coal.
The rapid growth of town and cities is being accompanied by a rapidly growing service sector
China’s biggest exports are:CoalNatural GasIron ore and tin Manufactured Goods like mobile phones.
China can earn a lot of money from these products.
What are working conditions like?
Working conditions in factories are tough. Workers often work long hours in unsafe, unpleasant conditions.
These workers are both men and women but they can earn a lot more than in the rural areas.
Workers (often men) that work in the mines have a very hazardorous occupation.
China has been able to develop so quickly because it has an abundance of energy resources and a large working population. China’s labour force is an important factor because it is very hard working and many are quick to learn new skills as well as being ambitious to become part of a consumer society.

Named example 3 - UK
The UK is a post industrial country
The percentages of each employment sector are:
Primary 1%Secondary 18%Tertiary 81%
There are also new ways of working emerging – Like Teleworking, telecottaging and telecommuting. Today more than 2 million people are self employed and work from home – this is particularly thanks to the broadband network
Working Conditions in all employment sectors are good thanks to strict Health and Safety Regulations and the existence of Trade Unions.There is also a national Minimum wage (currently £6.31)
Why have employment patterns changed?
Over the last 50 years, the UK has deindustrialised. It has lost much of its traditional manufacturing like iron and steel, Ship building, car making and textiles.
As a result of a global shift these industries have located elsewhere.
The UK continues some manufacturing but it is mostly high tech, work in state of the art factories.
There has also much automation – workers are replaced by machines. Online banking and ATM’s for example mean there are fewer banks.
The UK’s biggest exports are:
Aircraft technologyFinance and bankingElectronics like Dyson.
.

IMF
http://www.yout
ube.com/watch?
v=BhWKUbnlLeo
The International Monetary Fund (IMF) is an organisation of 188
countries, working to raise global monetary (money) cooperation,
secure financial stability, facilitate international trade, promote high
employment and sustainable economic growth, and reduce poverty
around the world. It does this through watching the global
economy and the member countries, lending to countries with
payment difficulties and giving practical help to members.
United Nations
http://www.yout
ube.com/watch?
v=QoIafzc0k74
Through UN efforts, governments have concluded many agreements
that make the world a safer, healthier place with greater
opportunity and justice for all of us. This comprehensive body of
international law, including human rights law, is one of the UN's
great achievements. It has close links with UNESCO, WHO, UNICEF,
FAO.
World Trade
Organisation
WTO deals with the rules of trade between countries. Its main
function is to ensure that trade flows as freely as possible. They are
often called in to deal with disputes between countries that have
previously made trade agreements. The goal is to help producers of
goods and services, exporters, and importers conduct their business
without exploitation.
World Bank The World Bank is a financial institution which provides loans to
developing countries for capital programs (money making). Its
official goal is the reduction of poverty, with all its decisions being
guided through a commitment to the promotion of foreign
investment and international trade, as well as the facilitation of
capital investment.
Trans national
Company
http://www.yout
ube.com/watch?
v=jDASb6DfRqE
A company with its headquarters in one country owns factories in
one or more other countries and sells its products globally. The
main priorities of a TNC are profit driven. They are always looking
for the highest profit margins. This often means their factories are in
LEDC’s to make the most of low wages and often have headquarters
in MEDC’s.
Key Idea 2: The role of global institutions

Key idea 3 – What is the affect of Globalisation on different groups of people
Impact on men in the developed world
Impact on women in the developed world
In the UK, fewer full time jobs in secondary industries, and more part time tertiary jobs than 50 years ago Men in the East end of London have reduced access to secondary jobs in car manufacturing that their fathers did
Women in developed countries have increased access to flexible work compared to 50 years ago when more jobs were labour intensive- so now women are more equal
Impact on men in the developing world Impact on women in the developing world
Many men in developing countries have to leave their rural homes and children with elderly relatives in countries like China, to work in factories in urban centresMany men in developing nations feel work is better paid and more consistent in factories compared to farming which can be affected by the weatherWomen and men in the developing world have access to urban secondary and tertiary jobs
Many women in countries like Bangladesh work in ‘sweatshops’ for TNCs, stitching clothes for minimal pay, in tough conditions with limited or no breaks Women and men in the developing world have access to urban secondary and tertiary jobsWomen in the developing world have increased access to education Has meant thousands of women in Kenya have access to land which previously they did not under Kenyan law

Key Idea 4: Globalisation is a wonderful thing or is it?
Arguments for Arguments against
• Helps LEDC’s develop and have efficient
economies.
• More MEDC’s; more countries can
become more powerful and shares the
worlds wealth more equally
• LEDC’s become more industrialized –
have control of their own economies
• When TNC’s set up a factory in a country
local people are getting more money, not
a lot but still more.
• More countries can benefit from a more
diverse culture e.g. Bollywood
• Learning new skills
• TNC’s pay taxes in countries which help
LEDC’s infrastructure
• Improving working conditions in LEDC’s –
many big companies have ethical trading
codes (e.g. Accessorise and Body Shop)
• Sharing good practises
• Quite often they are taking jobs that
people don’t want to do in MEDC’s
• Breaking down barriers between countries
and promoting multicultural societies• TNC’s have provided clean water supply
and electricity in the local area.• LEDC workers can now afford to send their
children to school
• Stops/squashes originalities and different
cultures within countries.
• Why does poverty still exist if LEDC’s are
developing more efficient economies?
• Causing damage to the environment e.g.
plastic bags
• Most profits return back to the TNC
countries and branches in LEDC’s are not
benefiting.
• LEDC’s don’t have much chance to
develop their own industries.
• TNC’s Invests in countries and then move
away and create short term benefits but
more poverty in the long run
• In LEDC’s workers are learning new skills
that aren’t really helping and are dumbing
down clever people, semi-skilled,
unskilled jobs.
• In MEDC’s people are losing their jobs
because companies are moving to places
where wages are cheaper
• Wages are so low their not really
benefiting.
• TNC’s are not always investing in host
country their just in it for themselves.
• Poor working conditions in LEDC’s • - Long hours and a long working week - No health and safety- Low wages- No unions - limited rights- Many people are available to work so the
TNC can fire and rehire anyone they want- Dorms are shared by 20+ workers and
disease/illness can spread very quickly

Key Idea 5: How & why have patterns of international trade and Foreign Investment changed over time?
International trade is the movement of goods and services (e.g. workers / banking) across borders and therefore between countries.
Foreign direct investment (FDI) is when a company invests capital (spends its money / uses its resources e.g. workers & expertise) in a different country by either building facilities (e.g. factories) or buying other companies. (e.g. Walmart in the USA now owns ASDA in the UK.)
Goods & services are the products that are traded between between different countries e.g. cars, electronics, food or financial services like insurance e.g. Toyota cars manufactured in Japan are sold in the UK.
Capital flows are the movement of capital between countries e.g. American companies (Nike) spend money building factories in China so they can get their products manufactured cheaply.

Why has international trade grown so rapidly?
Lower and Faster Transport Costs.
Containerisation - Most goods now
arrive from Asia in containers which are
easier to transport to ports, to load onto
ships and then unload at the other end.
Each container is bar-coded so
machines rather than people can identify
its contents and where it needs to go
Shipping – ships transport over 90% of
our goods and have become much larger
yet only need small crews. They are also
extremely fuel efficient reducing fuel
consumption
Aircraft – Transport by aircraft is more
expensive than by ship so only 0.2% are
transported by Air. However more high
value goods like electronics, medical
supplies and fruit and veg is transported
by Air as it is much faster.

Global trade has also increased because of the growth of these (TNCs)!

Named Example 4: Nike a Secondary TNC and an example of a TNC who has merged with
other companies.
Nike started in 1964 when Phillip Knight began importing running
shoes from Japan, where labour was cheap. Today is valued at over
$10billion.
Nike has its head Office in the USA and all design is carried out at the
Oregon head Office but though decision making are kept in the USA
most Asian outsourcing countries get the less profitable production
activities.
South Korea, Taiwan 1970’s : Nike was attracted by cheap labour so
instead of owning its own factories it outsourced production to these
countries.
China 1980’s: Nike began production in China to take advantage of
cheap labour
Thailand and Indonesia late 1980’s: South Korean companies, with whom
Nike had developed a long term relationships moved operations south to
Thailand and Indonesia in search of cheap labour.
Vietnam 2000: Now that China’s currency is worth more , it is cheaper to
make many items in Vietnam. Nike bought Converse in 2001 due to Converse
going bankrupt and Umbro in 2007 – This is know as a Merger.

Since 2000, many
campaigners have
encouraged Nike to
improve working
conditions for workers
in ‘sweatshops’. Nike
now publishes data
about supplier
inspections on its
websites.
It is important to bear in mind that one of the reasons Nike and other TNC’s are attracted to these South East Asian countries is because these countries already had reasonably good infrastructure. Also the labour force is often very hard working and many are quick to learn new skills. There are also no trade unions or few workers rights so it is easy for workers to become exploited.

Named example 5: A state-led company and its investment
Sinopec is a Chinese oil & gas company founded in 2000
In 2009 it was ranked the 7th largest company in the world
In 2013 they bought (invested) $3.1 billion in exploring oil & gas in Egypt
In 2004 Sinopec invested heavily in offshore oil & gas exploration in Gabon (Africa)
In 2005 Sinopec bought oil fields in Sudan and began exporting oil back to China
In 2012 Sinopec invested $2.45 billion in 20 oil fields in Nigeria

Named Examples 6: TNCs in Tertiary Sector
Case study on BT (a TNC in the tertiary sector)
BT is a British based company it is one of the worlds largest telecommunications companies in the world.
It operates in over 170 countries
BT is an example of Footloose company because it can locate anywhere as long as it has access to high quality communication links.
Outsourcing is when services are moved to a location where wages are lower
It outsources :Call centres in IndiaSoftware development in Bangalore and DelhiCompany Accounting – Silicone Valley in Bangalore
However has lead to unemployment in the UK as call centres are located abroad.
Creates jobs for English Speaking graduates and in turn attracts other companies to locate there so the whole area benefits form the multiplier effect.
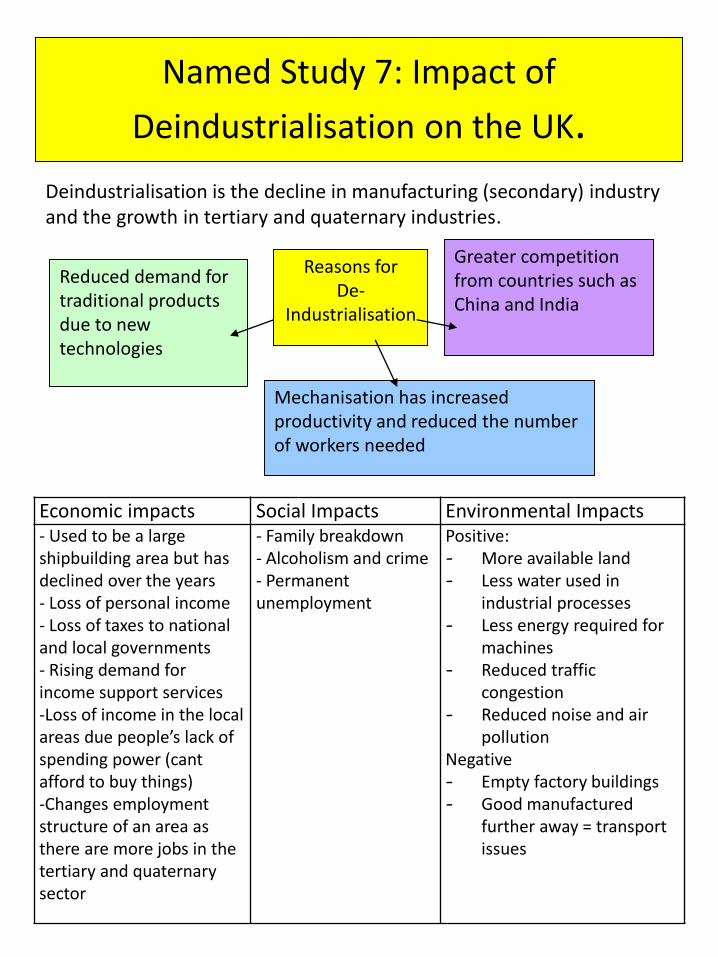
Named Study 7: Impact of
Deindustrialisation on the UK.
Reasons forDe-
Industrialisation
Greater competition from countries such as China and India
Reduced demand for traditional products due to new technologies
Mechanisation has increased productivity and reduced the number of workers needed
Deindustrialisation is the decline in manufacturing (secondary) industry and the growth in tertiary and quaternary industries.
Economic impacts Social Impacts Environmental Impacts- Used to be a large shipbuilding area but has declined over the years- Loss of personal income- Loss of taxes to national and local governments- Rising demand for income support services-Loss of income in the local areas due people’s lack of spending power (cant afford to buy things)-Changes employment structure of an area as there are more jobs in the tertiary and quaternary sector
- Family breakdown - Alcoholism and crime- Permanent unemployment
Positive:- More available land- Less water used in
industrial processes- Less energy required for
machines- Reduced traffic
congestion- Reduced noise and air
pollutionNegative- Empty factory buildings- Good manufactured
further away = transport issues

Globalisation – past questions
1. Suggest one reason why countries with a high percentage of people working in secondary sectors also have a high GDP per capita (2)
2. Describe the relationship between GDP per capita and the percentage of people working in secondary sectors (2)
3. Explain why international trade has grown so rapidly over the last 50 years (6)
4. Explain how the growth of secondary sector employment in developing countries can bring both benefits and problems (4)
5. Describe the negative impacts of globalisation on people in the developing world (4)
6. Examine the positive and negative impacts of globalisation on different groups of people (6)
7. Toyota opened a car factory in Derby in the UK in 1992. Suggest two benefits this may have brought to the local people (2)
8. Toyota’s research and development sites are mostly in developed countries and why Toyota locates some factories in developing countries (4)

Topic 4:Development Dilemmas
What you need to know:
• Economic development can lead to regional economic differences in developing countries
• Disparities can develop between urban and rural areas in the same country
• Development models in developing countries are usually ‘top-down’ or ‘bottom-up’
• The impact of top-down development in a developing country
• Characteristics of bottom up development
• Impacts of bottom up development in a developing country
• The characteristics of sustainable development in rural areas
• Are top-down or bottom-up schemes more appropriate for rural areas in developing countries in future?
DevelopmentMeans growth or change –for people and the economy. It benefits some and not others.

Need houses, water and services
Growth continues and settlement and economy expand
Demand for more workersWorkers need to build
and provide theseNeed Food
Shops open, more services needed
Needs workforce
People move there
Growth of industry
Investment
Economic development can lead to regional economic differences in developing
countries
Development means improvement for people and the economy. Within a country there
tends to be disparity between the core areas (urban areas with the majority of people
and services) and the periphery (rural remote countryside).
Upward spiral caused by Multiplier effect
How We Measure Development:
1) Economic WealthMeasured as Gross Domestic Product (GDP) per capita = the total value of goods and services in a nation measured over a year 2) Human Development Index (HDI) gives a country a score between 0 and 1 and is based on life expectancy, education and income.3) Birth rates – The number of babies born per thousand per year4) Death rate - The number of deaths per thousand per year5) Infant mortality rate – The numbers of babies who die before the age of 5 per thousand per year6) Access to clean water7) % rural population – The amount of people who live in peripheral/countryside areas8) Types of employment – amount/percentage of people employed in primary, secondary, tertiary etc.9) Level of literacy – the numbers/amount of people who can read and write
Consider this diagram in terms of what has happened in Ashford in the last 10-15 years
Choose any two of these and explain how they help us measure development

The Development Gap
The Brandt Line 1980
What’s Changed?MICs (Middle Income Countries) developed in South America through the sale of resources such as iron ore. This attracted money from MEDC’s and made the MICs wealthier.
In the 1990s South East Asia began to develop, these countries were known as the Asian Tigers, their growth doubled in 8 years. These are now known as NICs (Newly Industrialised Countries)Then in the 2000s Russia, Brazil , India and China became known as the BRICs (Rapidly Industrialised Countries)

Barriers to Progress in Sub Saharan Africa
Why is Malawi Poor?1. It’s landlocked, it has no port
to import and export goods. There is only one very slow single track railway
1. HIV and AIDS• Over 10% of Malawi’s
population has HIV or AIDS. • This means that a large
number of people cannot work.
• It also means many people are carers for the sick.
• This leads to less work being completed on farms and further poverty.
• There are half a million orphans in Malawi, living with grandparents who are therefore less able to work.
≫
3. Trade-Malawi uses the WTO to trade its coffee beans. It could make more money if it roasts them first, but the EU and the USA add taxesto roasted beans, so the price increases.

How do Countries Develop?
Rostow’s Theory:See model diagram.Rostow believed that poverty was the reason why some countries overthrew their governments e.g. China and became communists. His theory therefore was based on the experiences of Europe, N America and Oceania.
Frank’s Dependency TheoryFrank believed development was tied to two types of global region –core and periphery.Low value materials are traded between the periphery and the core. The core process these into higher value products and becomes wealthier by selling to other core areas. With these rules poor countries will never develop or become wealthy.

Disparities between urban and rural areas in the same country: IndiaCore area: MaharashtraIs India’s richest core region with the highest GDP and contains India’s largest city, Mumbai. It has grown due to various reasons:•Services e.g. banking, IT and call centres. Mumbai’s universities produce English speakers who are employed by large Western companies e.g. BT.•Manufacturing: cotton, food processing, steel, engineering and cement are commonly exported.•Entertainment: Mumbai has the world’s largest film industry- Bollywood•Leisure and business services – hotels and restaurants
Periphery area: BiharBihar is India’s poorest state with 86% of population live in rural areas with most working in farming.•Average incomes are only 6000 rupees (£75) per person per year. This is 33% of India’s average income•55% of households live below the poverty line and 80% of people work in low-level jobs•It gets very little investment from companies because its people cant afford basic services•In 2003, only 58.5% had electricity and 12% water-flushed toilets•School attendance is low with only 35% of children attending primary school and 8% reached upper primary.
Draw up a table to compare and contrast “Rich” Maharashtra and “poor” BiharConsider:• Location in India• Access to ports• Economic
indicators• Industry

• Irrigation for 1.8 million hectares of landProblems Caused by the Scheme• 234 villages drowned so far. 320 000 people forced to move• Few villages can afford the electricity, only cities benefit• Silt no longer deposited (because it is trapped behind the dam) on flood plains to fertilise farmland• The area has a history of earthquakes, the weight of large dams can trigger earthquakes• Good quality farmland has been submerged

Impacts of bottom up development in a developing country: Biogas India
Problems in rural India are:
Lack of time – collecting fuel, cleaning, preparing and cooking food, fetching water, tending animals – all before any paid work is done.
Fuelwood problemsFamilies need 25-30kg of wood a week. Takes a long time to collect. As the population increases wood becoming more and more scarce. Cow dung used more and more. This can have health concerns and the dung could be better used on the fields as fertilisers.Lack of educationWomen responsible for food and the home and one third of all paid work. Young girls have to help with chores, so they have little education. Therefore they marry early and are trapped in the poverty cycle.
Solution to these issues? COW DUNG!! BIOGASUsed for cooking and for powering electricity generators.It works by putting cow dung into a brick and clay lined pit. The pit is sealed by a metal dome under which the dung ferments to create methane. As more gas builds up it is piper to homesBenefitsSmoke and ash free kitchen. Better for healthWomen and children can use extra time for educationExtra time also allows them to earn more money.Cattle kept in a compound instead of roaming the forests where they eat saplings stopping regeneration of the forest.Slurry left behind from biogas can be used as fertiliserCo2 emissions cut by 277 tonnesCan be used to power an electricity generator which can be used to pump water for drinking and irrigation.
Which of the schemes “bottom up Biogas” or “Top Down the Narmada Dam” do you think are best?
Justify your answer
Fixed dome type Biogas

The characteristics of sustainable development in rural areas
Nature-small overall impact
on the natural environment
Social – long term benefits
for the local population e.g.
education, energy etc.
Appropriate technology –
method and equipment used
are at a level people can
understand and use
Local Decision making –
local people involved in all
stages of planning and
choice
Affordable – initial cost and
maintenance is low enough
for local people to afford
them
FEATURES OF
SUSTAINABLE
SCHEMES
Are top-down or bottom-up schemes more appropriate for rural areas in
developing countries in future?
Subsistence farming
Little or no surplus
farm produce
No investment in
land improvement,
machinery or
materials
Little or no income
Achieving sustainable development can become a problem for developing countries as they are stuck in a cycle of poverty. Large top-down schemes that focus on national problems (e.g. Narmada Dam) may overlook the rural poor and do very little to improve the lives of local people living in the periphery. Small-scale, bottom-up schemes are often more appropriate and more sustainable in the long term. DEFINE SUSTAINABLE DEVELOPMENT
.
Cycle of Poverty

Sustainability of India’s DevelopmentSustainable development – meets the needs of the present without affecting future generation’s ability to meet their own needs.
Tree Planting in Gujarat – Trees planted on poor farmlandBenefits:People work together to cut and sell the treesCreates jobsFood for people and animalsWood for village industries e.g. craft and building
Kerala State India – Focus on a bottom up approachLand given to people which created a motivated rural workforce.Focus on health and education – Money invested here for all.Lots of money from tourism and migrant workers (who work in the Middle East), they send money home (remittance payment).Kerala v Rest of IndiaBest services such as roads, schools, hospitals and banksWomen and children treated well and have best health and education levelsMost babies are hospital deliveredLow birth rateBut high rates of water borne diseases.
Quality of life indicator
Kerala India Low incomecountries
USA
Adult Literacy % 91 61 39 96
Life Expectancy Males
69 67 59 74
Life expectancy females
75 72 80
Infant mortality per 1000
10 33 80 7
Birth rate per 100
17 22 40 16
Pick out three differences between Kerala and India and explain why they are important to Kerala’s development


Topic 5:The Changing Economy of the UK
What you need to know:
• Describe what has happened to primary and secondary employment in the UK in the last 50 years.
• Explain why there has been rapid growth in tertiary and quaternary sectors in the UK in the last 50 years.
• Describe the major changes in the nature of employment in the UK over the last 50 years.
• Investigate the differences in industrial structure and workforce between two contrasting regions in the UK (the North East and the South East)
• Describe the environmental impacts of de-industrialisation and economic diversification in a UK urban area.
• Use examples to compare the costs and benefits of development on greenfield and brownfield sites.
• Explain what new economic opportunities exist for the UK economy (the digital economy, education and research and green employment).
• Describe how people in the UK may work in the future (IT and tele-working, flexible working, and self-employment)

Key terms
Automated Using machinery rather than people in manufacturing and data processing
Knowledge economy Based on knowledge and mental skills
Biotechnology Application of science to global problems [examples on p 221]
Household income Total income earned by everyone in a household, after paying tax.
Public sector Local and national government organisations, e.g. NHS
Domino effect A chain reaction that occurs when a small change causes a similar change
nearby, which then causes another similar change, and so on in linear
sequence.
Economic Diversification Creating varied industries and economic activities ; then if one fails, it won’t
affect the others
Brownfield site An area of land that has been built on before and can be built on again
Greenfield site An area of land which has not previously been built upon
Digital economy Based on digital technology
Green employment Jobs that are created to improve the environment - e.g. building wind
turbines
Deprived area An area in which there is a damaging lack of the material benefits that are
considered to be basic necessities e.g. employment, housing etc.
Derelict land Land on which factories or houses have been demolished
Employment structure The proportions of people who work in primary, secondary, tertiary or
quaternary jobs
Formal sector Work where people are formally employed, with permanent jobs and
regular pay
Informal sector Forms of employment that are not officially recognised e.g. people working
for themselves on the streets of developing cities
Regeneration Growth in areas that have experienced decline in the past
Telecommuter Person who works away from the office through the use of the internet

How and why is the economy changing?Industrial change in the UKEmployment in some UK industries has changed as the country has de-industrialised. There are many reasons for these changes, but two key ones are globalisation and changes in government policy.
Reasons for the decrease in manufacturing in the UK?Rising wages and rising land prices have made it expensive to produce in the UK and we can’t compete with the lower wages and cheaper land from industrial producers in developing countries.There hasn’t been enough investment into the industry in order to innovate and develop new high quality products.Automation has meant fewer jobs needed in some industries.
Industrial
Sector
Employment change
1960-2010
Explanation
Coal
mining
Fell from 600,000 miners
to only 6000
As UK mines became deeper, they became too costly to
safely maintain. Cheaper imported coal from Russia,
Colombia and the USA . The coal industry was
government owned from 1946, but loss-making mines
were closed in the 1980s and the industry was privatised
in 1994.
Iron and
Steel
Fell from 250,000 iron
and steel workers to
20,000
Suffered from strikes in the 1960s and 1970s and
privatised in 1988 to prevent further losses to the
government. Steel made in South Korea and Europe was
cheaper than steel produced in the UK.
Footwear,
textiles and
clothing
Fell from 1 million in 1960
to 100,000 today
From the 1950s onwards, cheaper textiles were made in
Taiwan, India and Bangladesh, often by using old mill
machines exported from the UK. Globalisation and
cheaper transport costs made global exports and
imports of textiles cheaper.

Changes in tertiary and quaternary industry in the UK
There has been big growth in the importance of tertiary and quaternary industry in the last 50 years.
Tertiary industries (also called service industries), including education, health, retailing, transport and financial services have grown with the decline of secondary industries.
Quaternary industries, including high-tech services such as ICT and research, have grown particularly in the last 10 years because firms are investing more in research departments to develop new products, e.g. mobile phones, computer technologies and robot machinery.
This is an important sector because:The jobs are highly skilled, highly paid and employ university graduatesResearch and development can invent new products that the UK can exportMany hi-tech companies are global TNCs that can quickly invest in new productsMany innovative companies are ‘start-ups’ set up by young entrepreneurs with a new idea or product that can be exported globally
Employment Structure ChangeAs well as changes in the economic sectors people work in, there have been major changes in the nature of employment in the last 50 years.
Change 1960-2010 Explanation
Total workforce In 1960 about 24 million people were employed,
growing to 27 million by 2010
The UK’s population increased by 10 million, but more young
people stay on in education until 18 or 21, and there are
more elderly people who do not work
Average wages Average weekly full-time wages in 2010 were
£450, up from £14 (worth about £220 today) in
1960
Unskilled and skilled manual jobs are now rare. Most
workers have some qualifications and skills; higher average
earning s reflects this.
Women in the workforce Women make up 49% of the workforce now, up
from 35% in 1960.
Women receive over 50% of university degrees, up from 20%
in 1960. Women are more independent, marry later in life,
have fewer children and focus more on careers.
Part-time jobs In 1960 only about 5% of people worked part-
time, now 25% of people work part-time
The UK workforce is more flexible than in 1960, and people
move jobs more often. Part-time work suits many people
with families.
Working hours For all workers the average working week has
fallen from 42 hours to 32 hours (37 for full-time
workers)
The change partly reflects the fact that more people work
part-time, and do some work at home; rigid ‘9 to 5’ jobs are
less common today.

UK regions and employment
You need to investigate the differences in industrial structure and workforce between two contrasting regions of the UK.The North was once heavily industrial, but these manufacturing industries have declined due to de-industrialisationThe South has an economy based on services (especially finance) and increasingly quaternary industries.
North East England• Industry once dominated by coal mining,
iron and steel production, shipbuilding and chemicals but declined rapidly in 20th and 21st centuries due to foreign competition and high land and labour costs
• The chemicals industry is still important, but employs fewer people due to automation and improved technology. It is a centre for biofuel research.
• The Nissan car factory in Sunderland is an important part of the recovery of the area. Other newer industries include the manufacture of North Sea oil and gas platforms.
• Some government departments were relocated to the area.
• Sunderland is becoming a centre for quaternary industry, science and high technology.
• Unemployment is fairly high (10.3% )
South East England• Centre for service industries, e.g. health,
education and transport.• Important oil refineries at Southampton.• New, light industries in the M4 corridor,
e.g. electronics and light-engineering• Car production, e.g. at Oxford• Many financial and business service
industries.• Unemployment is low (6.0% in 2013)
Reasons for these differencesThe South East:• Has good communication links to Europe and
the rest of the UK• Has a large pool of skilled and educated people
– people migrate to the area from other parts of the UK/world as it provides better job opportunities.
• Is less affected by decline in industrialisation because there were fewer heavy industries.

What is the impact of changing work on people and places?
Environmental impact of de-industrialisation and economic diversification Named Example: UKAs regions and urban areas move through the Clark-Fisher model the type of industry in these areas changes. The factories used for secondary industry close and are replaced by the offices, retail units and science parks of tertiary and quaternary industries (economic diversification). These changes have environmental impacts:
Economic impacts Social Impacts e.g. Glasgow Environmental Impacts
- UK use to be a large
shipbuilding area but has
declined over the years
- Loss of personal income
- Loss of taxes to national and
local governments
- Rising demand for income
support services
- Loss of income in the local
areas due people’s lack of
spending power (cant afford to
buy things)
- Family breakdown
- Alcoholism and crime
- Permanent unemployment
Positive:
- More available land
- Less water used in industrial
processes
- Less energy required for
machines
- Reduced traffic congestion
- Reduced noise and air pollution
Negative
- Derelict Land
- Empty factory buildings
- Good manufactured further away
= transport issues
De-industrialisation brings many environmental benefits, as heavy industry is usually very polluting. On the other hand, many jobs are lost. New jobs – often service or quaternary sector jobs – want to locate out of old, congested city centres and on greenfieldsites at the edge of the city, although this creates urban sprawl and the gradual loss of the countryside.

Identify the potential for regeneration and environmental change on Brownfield sites
Brownfield site = an area of land which has been built on before and is suitable for redevelopmentGreenfield site = an area of land that has not previously been built on before
Developing Brownfield sites does have some negatives:Often more expensive to develop because of clean-up costsRegulations for reclaiming the sites can often be a barrier to new developmentSome of these sites can be important wildlife habitats
Named Example: Birmingham – Fort DunlopThe West Midlands Regional Development Agency has helped to support the regeneration of the city areas affected by industrial decline.
Fort Dunlop in its prime employed 12,000 people and in 1816 a village known as ‘tyretown’ was developed around the site to meet the worker’s needs. The factory closed in 1980s when Dunlop moved its manufacturing abroad. It was empty for 20 years and then in 2002 it received planning permission to redevelop into a mixed-use sustainable 24-hr community. Opened in 2006, it now includes a 100-bed hotel, a business park with office and retail space, as well as places to eat and drink. It’s a good example of how a brownfield site can be regenerated to provide both employment and leisure, and improve the local environment.
Greenfield sites – positives and negatives
Size and Shape Often large and regularly shaped; easy to build large buildings
Construction All infrastructure (electricity, sewers, access roads) has to be built from scratch
Construction costs are lower than brownfield
Access On the edge of cities so there is good road/motorway access
Environment May destroy habitats it hedgerows, trees and local ponds have to be removed
Local people and environmentalists often object
May encourage car travel as people commute to and from work
Valuable farmland is lost
Greenfield sites? Named Example: SolihullSolihull (also in the West Midlands) is desperately short of housing and in 2010 wanted to build 10,500 new homes on greenfield sites. Clearly, there are costs and benefits of doing this:
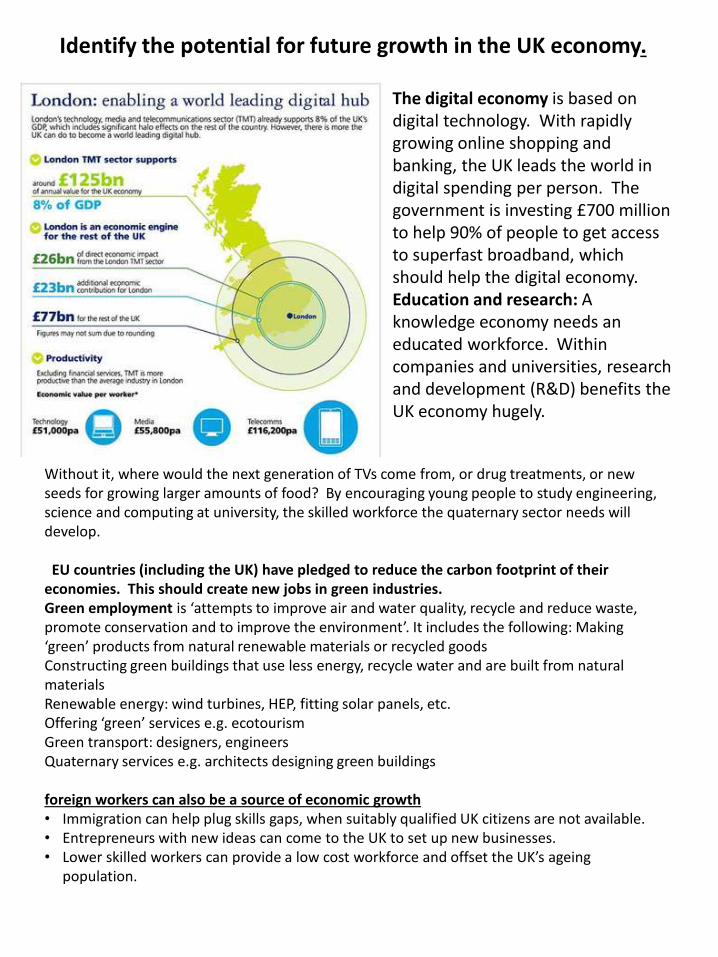
Identify the potential for future growth in the UK economy.
The digital economy is based on digital technology. With rapidly growing online shopping and banking, the UK leads the world in digital spending per person. The government is investing £700 million to help 90% of people to get access to superfast broadband, which should help the digital economy.Education and research: A knowledge economy needs an educated workforce. Within companies and universities, research and development (R&D) benefits the UK economy hugely.
Without it, where would the next generation of TVs come from, or drug treatments, or new seeds for growing larger amounts of food? By encouraging young people to study engineering, science and computing at university, the skilled workforce the quaternary sector needs will develop.
EU countries (including the UK) have pledged to reduce the carbon footprint of their economies. This should create new jobs in green industries.Green employment is ‘attempts to improve air and water quality, recycle and reduce waste, promote conservation and to improve the environment’. It includes the following: Making ‘green’ products from natural renewable materials or recycled goodsConstructing green buildings that use less energy, recycle water and are built from natural materialsRenewable energy: wind turbines, HEP, fitting solar panels, etc.Offering ‘green’ services e.g. ecotourismGreen transport: designers, engineersQuaternary services e.g. architects designing green buildings
foreign workers can also be a source of economic growth• Immigration can help plug skills gaps, when suitably qualified UK citizens are not available.• Entrepreneurs with new ideas can come to the UK to set up new businesses.• Lower skilled workers can provide a low cost workforce and offset the UK’s ageing
population.

Changing Work Practices
As well as changes in the type of job people do in the UK, there have been changes in the way people work, who they work for and where they work.
Type of work Change
Teleworking (or telecommuting)
means people work from home, or
work ‘on the road’
About 3.7 million UK workers sometimes work from
home, with about 1 million mostly working from home
(but who are not self-employed). In the 1980s this
number was about 100,000.
Home working means people are
based at home all of the time
Home working has risen from 3.1 million people in 2001
to 3.8 million in 2011, with 66% of home workers being
men.
Self-employment means working for
yourself (setting up your own
business)
Self-employed people numbered 4.5 million in 2011, up
from 3.3 million in 2002.
Flexible working includes working
part-time, job sharing, starting and
finishing at different times
The number of part-time UK workers increased from 6.5
to 7.9 million during 1997-2011; about 40% work flexibly
at some point in their career.
Positives and Negatives of Flexible WorkingTelecommuting reduces commuting and therefore saves fuel and creates less pollution Part-time and/or flexible work does suit come people like young parents and older people.People can choose when and where to work, fitting their work in with other commitments.Being self-employed or ‘freelance’ brings with it the extra stress of looking for work all the time.There could be family tensions if homes are also workplaces for parents.There are fewer benefits like statutory sick pay or paid holidays.Part-time work pays less, so some people can struggle to get enough income to pay for living costs and their children.

What you need to know:
• Describe global and regional trends in urbanisation and explain reasons for growth (migration and internal growth).
• Contrast the economic activities, spatial growth and population of ‘megacities’ in the developed and developing world.
• Examine urban challenges in the developed world, including food, energy, transport and waste disposal demands that may lead to concentrated resource consumption.
• Examine urban challenges in the developing world, including slum housing, the informal economy and urban pollution, which lead to low quality of life.
• Investigate why eco-footprints vary from city to city and assess how one named city in the developed world is lessening its eco-footprint by reducing energy consumption and waste generation (LONDON).
• Analyse the potential for more sustainable transport in a named city in the developed world (LONDON).
• Consider the success of strategies to improve quality of life in cities in the developing world: self-help schemes, the work of NGOs, urban planning (CURITIBA)
• Evaluate the advantages and disadvantages of attempts to develop less-polluted cities (MASDAR CITY or MEXICO CITY)
Topic 7: The Challenges of an Urban World

Key terms
Urbanisation The rise in the percentage of people living in urban areas, in
comparison with rural areas.
Rural-urban migration The movement of people from the countryside to cities.
Natural increase (internal
growth)
The birth rate minus the death rate for a place. In cities this helps to
drive up the population.
Megacities Cities with a population of over 10 million people.
Spatial growth City growth in space (where they grow)
Conurbations When cities merge with other growing cities nearby.
Informal economy Refers to jobs that have little, or no, job security (e.g. street trading). No
tax is paid.
Formal economy Refers to jobs with contracts of employment and more job security.
Hyperurbanisation Where the urban population is growing so fast that the city can’t cope
with people’s needs.
Concentrated Resource
Consumption
Cities represent 2% of the Earth’s surface, but consume 75% of its
resources.
Counter-urbanisation Where people migrate out of cities to live in rural areas
Eco-footprint Measures the area of land needed to provide all the resources and
services consumed and absorb all the waste produced (measured in
global hectares per person [gha])
Retro-fitting Adding new energy-saving and energy-efficiency features to existing
homes and public buildings
Congestion charge A fee for motorists travelling within a city. The main aims are to reduce
traffic congestion and to raise funds for investment in the city’s transport
system. London’s congestion charge was one of the first to be
introduced.
Quality of life About more than how much money people have. It can include things
like housing, employment, the environment, access to services and so
on.
Favela The words used in Brazil for shanty town (area of slum housing)
NGOs Non-governmental Organisations – develop small scale sustainable
solutions to local problems in developing countries e.g. Oxfam, the Red
Cross, and WaterAid are examples of NGOs
Maternal death The death of a woman during pregnancy or shortly after childbirth.
Urban planning Determining and drawing up plans for the future physical arrangement
and condition of a community.

How have cities grown?Urbanisation means an increase in the proportion of people living in urban areas (towns and cities). In 2007, the number of people worldwide living in urban areas exceeded the number of people living in rural areas for the first time.
The world’s population is becoming increasingly urbanised and cities in developing countries are growing at a particularly fast rate. Globally the trend is upward, and 67% of people are expected to live in urban areas by 2050. However there are differences regionally:In Europe and North America the number of urban people has more or less stabilised.In South America and Sub-Saharan Africa urban populations are still growing.In Asia, there has been enormous population growth in cities and this is expected to continue.

Draw a table like this:
Type Urban Rural
MEDC
LEDC
High densities of people
High number of services Very high densities of people High proportion of urban poor Higher car ownership
Fewer shops and services Very poor public transport Many employed in agriculture Lower density of transport
services Good public transport Significant proportion of urban
poor Quieter Poverty common Illegal settlements High speed Broadband Lower speed internet access Disease and poor educational
facilities Some range of services in
central areas Less transport infrastructure Limited or no access to
services Range of informal and formal
jobs Some public transport
Decide whether each factor is aPU – Push or a PL - Pull
Put the statements in the correct box e.g. High densities of people is a characteristic of MEDC urban areas.

PUSH and PULL factors (together with high natural increase due to young age of migrants so more births and fewer deaths due to improved medical care) lead to the development of Squatter settlements
What is a squatter settlement?- An area of makeshift housing with poor living conditions- Often no running water and people have to buy from water sellers- Lack of sanitation (getting rid of sewage and dirty water) so diseases like diarrhoea develop.- May lack other services like schools; health centres and public transport- Houses are often built illegally so people do not feel secure.However there is a major advantage: housing is cheap and affordable for the urban poor
Developed e.g. London; Tokyo Developing e.g. Mumbai (India); Johor
Bahru (Malaysia)Regeneration projects e.g. London
Docklands have attracted young ,often
single people back into London. New,
modern housing / flats have been built. The
jobs that have replaced the old industrial
jobs (e.g. in the docks ; food processing ) are
in business and financial services e.g. in
Canary Wharf. This has resulted in
REURBANISATION of city centres.
Cities like Mumbai and Bangalore in India have
attracted new industry e.g. outsourcing of service
functions e.g. call centres. This has acted as a
catalyst for attracting new migrants to the city in
search of jobs. Mumbai is the financial capital of
India and new jobs have been created in the
financial sector.
In Johor Bahru the Malaysian government has
created a free trade zone. This has attracted
foreign manufacturing TNC’s e.g. Dyson which in
turn has created jobs and attracted new migrants.
Urban areas have a concentration of
services and amenities e.g. Universities;
theatres; high order retail facilities;
hospitals
Indian cities have poor public transport systems so
workers need to live in the city.
(Although Mumbai has developed a metro and
Bangalore is planning one)
Household sizes have declined and there are
more actual households in the UK and this
pushes up demand for new housing.
Attraction of health; education ‘bright lights’
In Europe and North America counter-urbanisation is taking place. This is where people migrate out of cities to live in rural areas – often commuting to work in the city. This is one reason why rates of urbanisation here have slowed.

Megacities
Developing world megacities Developed world megacities
Spatial growth
As cities grow in population – they also grow in
space – spatial growth. Developing world cities
are growing rapidly (e.g. Karachi in Pakistan is
growing by 4.9% a year) due to
industrialisation. Industries are often attracted
by low tax rates. But with little tax income,
governments don’t have money to provide
essential services. Many people end up living
in overcrowded, unplanned slums and
shantytowns (like Dharavi) often found on land
that no-one else wants.
Spatial growth
Megacities in developed countries are growing much
more slowly (e.g. Tokyo in Japan is growing by just
.6% a year).
They have grown recently as a result of:
Merging with other growing cities nearby to
form conurbations (e.g. Tokyo’s population now
includes Yokohama and Kawasaki)
Sprawling, this results in low population
densities (e.g. Los Angeles). Most of the sprawl
is caused by people moving out to the suburbs,
where housing is cheaper and there’s more
space.
Economic activity
All megacities act as service centres, by those in
the developing world are often also important
manufacturing centres. In developing world
megacities, thousands of people work in the
informal economy.
Economic activity
Most people in developed countries work in the
formal economy, with relatively few people working
in the informal economy.

Urban Challenges in the Developed World
A high rate of resource consumption leads to many issues in MEDC cities
An eco-footprint measures the area of land needed to:Provide all the resources and services consumed,Absorb all the waste produced.It is measured in global hectares per person (gha). London’s eco-footprint is 5.5 gha, almost twice the global average. London needs an area over 200 times the size of the city itself to support it.

Urban challenges in the Developing World
Developing world cities often grow so quickly that the government simply cannot keep up with the demand for housing, water supply, power, transport and jobs. This leads to serious challenges:Increasing levels of pollution. Pollution of air, land and water is a major problem in most
developing world cities. There are few laws to protect the environment Furthermore, the hidden economy can add to the levels of pollution as small, unlicensed industries are set up in people’s homes or on rooftops. These industries release their pollutants into the air, land and water.Collapsing Infrastructure. Increased volume of traffic on poorly maintained roads. The water supply can also become polluted as inadequate sewerage facilities allow the spread of harmful bacteria. Indeed, death from water-borne disease is one of the biggest causes of high infant mortality rates.
Inadequate housing and services. On arrival at the city, it is most likely that the migrant will find him having to create his own shelter, live on the streets or rent a single room. In Calcutta, "Hotbed Hotels" rent rooms on an eight hour basis, whilst in Mexico City, over ten million live in shanty towns.
The shanty town is likely to be found on inappropriate land. Maybe it is prone to flooding or is very steeply sloping, increasing the chances of a landslip. It could be on a piece of land that has been badly polluted by a neighbouring industry. The shelters made of wood and high population densities increase the risk of fire.
The services will be non-existent or incapable of maintaining a basic standard of living.The lack of basic services like a clean water supply, rubbish collection and sewerage disposal mean that the risks of disease are very high.A lack of employment means that people have to look for other ways of earning money. In Manila, children scavenge on refuse sites collecting cans for recycling. As well as being unpleasant, the risk of injury is high and any cuts will become infected. Drugs have also taken a grip in many shanty towns. In Rio's favelas, there are often gun battles between rival gangs.

How far can these challenges be managed?
Named Example: London – reducing energy and waste Key Facts: - Only 1% of London’s energy comes from renewable sources - Up to 60% of energy is lost in homes due to poor insulation - Londoners produce 3.4 million tonnes of rubbish each year - Up to 80% of our waste could be recycled, re-used or composted
What is London doing? Eco-communities – these new eco-towns are to be built on brownfield sites out of town. E.g. BedZEDnear Croydon, Greater London, is the largest carbon-neutral eco-community in the UK. It is built on reclaimed land and promotes energy conservation. BedZED – key characteristics - Buildings have been built from natural, recycled or reclaimed materials - Houses have been built facing south to allow for the use of solar power - Producing as much renewable energy as that consumed - Using heat from cooking for space heating - Providing homes with roof gardens, rain water harvesting and waste water recycling - Community layout promotes walking, cycling and public transport use
How could London reduce its waste? Direct Variable charging – where recyclables are collected free of charge and ‘pay-as-you-throw’ policies are applied to everything else. However, this could encourage ‘fly-tipping’. Polluter pays principle – where the company that produced the waste items are charged. However the cost for this is likely to the transferred to the customer.

Sustainable urban transport
There are various solutions to reduce the amount of cars, Lorries etc. on UK roads. 1) Converting cars to LPG (Liquid propane Gas) instead of petrol or diesel. It is much cleaner and cheaper than petrol and grants are available for the cost of the conversion. 2) Using hybrid cars which are powered by electric batteries as well as petrol. London has introduced hybrid buses which emit 50% of the pollution of a diesel bus; London aims to have 1000 of these by 2016. London aims to have 1300 charging points for electric vehicles by 2013.3) Super-trams e.g. Manchester – aim to reduce congestion and improve air quality 4) Bus lanes help speed up the journeys to and from the city centres and would there reduce air pollution as more people are encouraged to use them 5) Congestion charging e.g. In London a congestion charge of £8 pre-paid or £10 on the day applies to Central London, with an additional low emission zone charge of £100-200 per day for large lorries. (Since 2003 there has been a 21% fall in traffic in central London, a 43% increase in the amount of bus passengers and 43% increase in cyclists). 6) Park and ride schemes – help reduce the amount of people entering the city centres and reduce congestion 7) Encouraging bicycles – In 2010 the ‘Boris Bike’ bicycle hire scheme was introduced. In 2012 there were 8000 bikes to hire from 570 ‘docking stations’. Four ‘Cycle Superhighways’, dedicated cycle lanes, have been built, with two more planned. The scheme however was expensive to set up and does not make a profit. It costs a minimum of £2 to hire a bike and £90 for annual access – but it could become cheaper and profitable if it expands.
Sustainable developing city living -What does it look like?
• All waste recycled for reuse • Organic waste from urban sewage systems to be used as fertilisers • More parks and green space • Solar panels to be used to heat water and provide some electricity • Public transport to be powered by electricity gained • from renewable sources • Industries would be required to clean its waste to
prevent pollution.

Named Case study: Curitiba, Southern Brazil -Key ideas:
• Population = 2.2 million • Using Urban Planning - Main idea was to create an ‘Integrated
Transportation Network’ in which there were 3 high speed, one-way designated bus lanes which were connected through terminals which allow them to run every 90 seconds.
• Five rapid transit bus lanes radiate out from the centre, providing cheap single-fare bus transport. There are over 400 km² of parks and forest.
• The system transports 2.6 million people every day and is used by 70% of the city’s population
• Buses use alternative fuel e.g. natural gas to cut down on pollution levels • The ‘Green Exchange’ programme gives free food and bus tickets to poor families
in exchange for their garbage and recycling waste.

Other ideas- Favelas and Bustees
Self-help schemes CORP (an NGO) Urban planning
Strategy Rocinha is a favela (slum)
in Rio de Janeiro, Brazil
with a population of
+100,000. By self-help,
the wooden shacks of the
1950s have been slowly
upgraded to brick and
concrete homes with
water and electricity;
people have rebuilt their
homes a few bricks at a
time when they could
afford to. In some cases
the city government and
NGOs gave residents
bricks and cement, and
residents made their own
improvements
The Indian NGO
Community
Outreach
Programme (CORP)
was set up in 1977.
It runs 20
community centres
in Mumbai,
including in the
Dharavi slum.
CORP’s work focuses
on education,
helping street
children, skills
training for adults
(jewellery making,
tailoring), health
and nutrition
As far back as 1997
there have been plans
to redevelop Dharavi,
to demolish the slums
and rebuild in a
planned way. The
most recent plan, the
Dharavi
Redevelopment
Project, could cost $3
billion.
Success? Because Rocinha was
never planned, it has no
roads, only paths. This
means access is poor and
it is very cramped. The
maze of paths is hard to
police, and crime is a
serious problem.
Nevertheless, homes are
much better than 30 or 40
years ago because of self-
help, despite this being a
very slow process.
NGOs can only help
a small number of
people and rely on
donations for
funding. In 2012
CORP spent £1.3
million and helped
29,000 people out of
about 9 million slum
dwellers in Mumbai.
Dharavi’s residents are
against the
redevelopment. They
fear new apartments
will be too expensive,
and established
businesses and
factories will be forced
to move. Residents
who arrived in Dharavi
after 2000 will not be
rehoused.
:

Greener Developing Cities?
Mexico City and its surrounding areas have a strict “Hoy no circula” (“Today you can’t drive” or “Day without a Car”) program. The program is intended to reduce air pollution from vehicle emissions.
The graphic shows the major rules for most vehicles. With few exceptions, these rules apply to all tourist vehicles as well as Mexican-plated vehicles. The scheme was extended to Saturdays in 2008. As a result, air pollution has fallen and is now similar to pollution in Los Angeles (whereas in 1992, the UN named Mexico City ‘the most polluted city on the planet’). However:
Advantages Disadvantages
Greenfield Development: planned from scratch so
it is possible to design very efficient transport,
water and waste systems. These are costly and
difficult to install in existing cities
Test-bed: new cities can be used to try out and
adapt new low-pollution technology, which can
then be used more widely.
Quality of life: air quality, housing quality, rapid
transport and public services can all be designed
into a new city to ensure everyone has a good
quality of life.
Cost: Masdar is expected to cost up to $20 billion,
but can only house 50,000 people.
Complexity: many new cities use untested
technology which is expensive and does not
always deliver what is promised.
Land: an undeveloped area of land is needed and
people nearby object to the huge new
development – this is one of the reasons the UK’s
eco-towns failed.
•Wealthy people have been accused of second car ownership, to get around the restrictions.•Because the city is still growing rapidly, the number of vehicles is still rising•Mexico City has recently invested in better public transport, especially its Metro system, which •has had a bigger impact on reducing pollution and congestion.
Alternatively, in order to develop less polluted cities, you could build new cities from scratch. Building new cities is not cheap and the plans are inevitably affected by economic and political change. Examples include Dongtan (the eco-city planned by the Chinese outside of Shanghai) and Masdar(the eco-city planned in Abu Dhabi):

Practice Exam Questions
Topic 5: The Changing Economy of the UK• Suggest reasons for the decline in the number of coal miners in the
UK (3 marks)• Outline the importance of changes in the way in which people work
in the UK, such as home-working and self-employment (6 marks + 3 marks SPAG)
• For two contrasting areas of the UK, explain the differences in their industries and workforce (8 marks + 3 SPAG)
• Outline the positive environmental impacts of deindustrialisation for a named urban area in the UK (3 marks)
• Describe one feature of a greenfield site (2 marks)• Explain the increasing importance of the ‘green’ employment sector
to the UK economy (8 marks + 3 marks SPAG)
Topic 7: The Challenges of an Urban World• What is meant by ‘urbanisation’? (2 marks)• Explain the processes that have led to the rapid growth of megacities
in some parts of the world (6 marks + 3 SPAG)• Explain how cities in the developed world are trying to solve one of
the problems they face (3 marks)• What is meant by the term ‘informal economy’? (2 marks)• For a named city in the developed world, explain how it is trying to
reduce its energy and waste (6 marks + 3 SPAG)• Using examples from the developing world, explain how some cities
are trying to improve the quality of life for their residents (8 marks +3 SPAG)

Case Study ChallengeList as many case studies as you can remember
Topic 1 Population Dynamics
Topic 2 Consuming Resources
Topic 3 Globalisation
Topic 4 Development Dilemmas
Topic 6 Changing Economy of the UK
Topic 7 The Challenges of an Urban World

Case Study ChallengeList as many case studies as you can remember
Fast Facts – 3 facts about each case study……..Go!

Case Study ChallengeWhich case study for which question???
Question Case Study
By referring to examples explain the factors that can lead to a population increase or decrease.
Describe the methods governments can use to control population size.
Using examples describe how different countries try to control its number of immigrants
Explain why some people believe that the worlds resources will rune out soon, while others think that it will not happen
Using examples, explain how renewable energies could replace the world’s dependency on fossil fuels
Using examples, explain how rural areas are trying to improve rural services.
Using examples, explain how bottom-up schemes have benefited developingcountries.
Using examples, explain the potential for growth of the ‘green’ employment sector.
Using examples, explain why some rural areas are under pressure from urbanpopulations.
Using examples, compare the success of bottom-up and top-down developmentprojects.
For a named rural area, explain how it could develop more sustainably in thefuture.
For a named developing country, explain the differences between the urban coresand the rural periphery.

1. Using one of the handy facts or key facts sheets complete a sheet for your weakest case study.
2. Do the same for your strongest
3. How do they compare?
Case Study ChallengeStrengths and Weaknesses

Knowledge Top up……
1. Go to the Edexcel website www.edexcel.org.uk
Click : Qualifications> GCSE from 2009> Geography B> Question papers
Select People and the planet higher or foundation
Revision:
• Case study work on handy facts or key fact sheets
• Use revision guide to revise
• Exam questions from the case study challenge sheet
• Exam papers

Case Studies
Population Dynamics:
Aging / Youthful populations – Japan & Mexico
Anti-Natalist – China, one child policy
Pro Natalist – Estonia, Singapore
Migration – UK, Open Door – Point based system
Consuming Resources:
Supply and Consumption of a resource – Oil
Malthus
Boserup

Case Studies
Globalisation
Clark Fisher Model
FDI
TNC’s – Coca Cola, Nike, BT
Global institutions that help the economy
IMF
WTO
Development Dilemmas
Dispariites in countries:
LEDC, India Maharashtra (core area) v Bihar (periphery).
Top down development Narmada River Scheme, India.
Bottom up development Biogas, India.
Sustainable Development
Tree Planting, Gujarat, India.
Kerala State, India –Health and education.

Case Studies
Changing Economy of the UK
• North East v South East England
• Glasgow
• Fort Dunlop
• Solihull
The Challenges of an Urban World– Mexico City
London
• BedZED
• Eco-communities
Greener Growth in Cities
LEDC – Curitiba, Brazil