gcep energy tutorial wind 101 - stanford university 100m rotor diameter capacity factor 48% annual...
TRANSCRIPT

Imagination at work.
Patrick Riley October 14, 2014
GCEP Energy Tutorial Wind 101

© 2014 General Electric Company – All rights reserved
Agenda
GCEP Wind 101| 14 October 2014
• Introduction & fundamentals
• Wind resource
• Aerodynamics & performance
• Design loads & controls
• Scaling
• Farm Considerations
• Technology Differentiators
• Economics
• Technology Development Areas
2
© 2014 General Electric Company – All rights reserved

© 2014 General Electric Company – All rights reserved
Power from Wind Turbines
Power in Wind
Extractable Power from Wind turbine
GCEP Wind 101| 14 October 2014
Area v P wind
3
2 1 r =
Area v P wind
3
2 1 r = p c
Cp = power coefficient a measure of aerodynamic efficiency of extracting energy from the wind
v = wind speed Importance of site identification (local
wind resource) & understanding of wind shear
Area = rotor swept area Power increases with rotor2
3
© 2014 General Electric Company – All rights reserved

© 2014 General Electric Company – All rights reserved
Configurations
GCEP Wind 101| 14 October 2014
Horizontal-Axis (HAW T)
Upwind vs. Downwind
Number of Blades
Vertical-Axis (VAW T)
Lift Based (Darrieus) vs. Drag-Based (Savonius)
Airborne Wind Turbine
Source: http://en.wikipedia.org/wiki/File:Airborne_wind_generator-en.svg Copyright 2008 James Provost, used with permission.
4
Source: http://en.wikipedia.org/wiki/File:Darrieus-windmill.jpg Copyright 2007 aarchiba, used with permission.
Source: http://en.wikipedia.org/wiki/File:Savonius-rotor_en.svg Copyright 2008 Ugo14, used with permission.
Source: http://en.wikipedia.org/wiki/File:Wind.turbine.yaw.system.configurations.svg Copyright 2009 Hanuman Wind, used with permission.
Source: http://en.wikipedia.org/wiki/File:Water_Pumping_Windmill.jpg Copyright 2008 Ben Franske, used with permission.

© 2014 General Electric Company – All rights reserved
Utility-Scale Turbine Types
Convergence of industry Horizontal axis Upwind 3 blades Variable rotor speed Active (independent) pitch
Main differentiators Direct drive vs. gearbox
Generator design Full vs. Partial Power Conversion Controls
GCEP Wind 101| 14 October 2014 5
© 2014 General Electric Company – All rights reserved

© 2014 General Electric Company – All rights reserved
*values can vary significantly with turbine & site
Term Typical Value* Definition
Rated Power 1.6MW Max nominal power output
Diameter 100m Rotor diameter
Capacity Factor 48% Annual Energy Production (kWh) Rated Power (kW) x 24 x 365
Avg wind speed 7.5m/s Annual average wind speed at hub height
Turbulence Intensity 16% sU/Uavg @ Uavg = 15 m/s
IEC class II Uavg = 8.5 m/s @ hub height 50-yr, 10-min extreme wind = 42.5 m/s 50-yr, 3-sec extreme gust = 59.5 m/s Turbulence = 18% (IEC = International Electrotechnical Commission)
Design life 20 years Calculated Life according IEC 61400 and DP’s
Basic Wind Turbine Terminology
GCEP Wind 101| 14 October 2014 6

© 2014 General Electric Company – All rights reserved
Massive Structural Size
Utility Scale Wind Uniqueness
GE 1.6-100
Tower
132 to 1200 tons
60m to 139m hub height
Rotor
40 to 70 tons
77 to 120m diameter
Nacelle
57 to 82 tons
Hoover Tower (87m)
Statue of Liberty (91m)
2.5-120, 110m HH
(170m)
… but Values Low Cost Design … Simplicity
Substantial Heights
GCEP Wind 101| 14 October 2014 7
Source: http://en.wikipedia.org/wiki/File:Statue_of_Liberty_7.jpg Placed in the Public Domain
Source: http://en.wikipedia.org/wiki/File:Hoover_Tower_Stanford_January_2013.jpg Copyright 2013 King of Hearts, used with permission.

© 2014 General Electric Company – All rights reserved
Conventional Layout
GCEP Wind 101| 14 October 2014
Rotor main shaft
Pitch drive
Hub
Main bearing
Electrical ‘top box’
Generator
Bed Frame
Yaw drives
High-speed coupling
Gearbox Pitch bearing Mechanical brake
Yaw bearing
8

© 2014 General Electric Company – All rights reserved
Wind Resource
The most productive wind sites:
• have high average wind speeds
• are generally somewhat remote from population centers
• integration with utility grid is generally challenging
The Wind Resource is the #1 Driver of Wind Economics
GCEP Wind 101| 14 October 2014
GW installed
0
0.5
1
1.5
2
2.5
3
3.5
4
4.5
>5
Average Wind Speed Map
Installed Wind Power Map
GCEP Wind 101| 14 October 2014 9
Source: http://www.nrel.gov/gis/images/80m_wind/USwind300dpe4-11.jpg
Copyright 2011 AWS Truepower & NREL, used with permission.

© 2014 General Electric Company – All rights reserved
Wind Characteristics
Extreme winds 1-yr & 50-yr extreme gusts
Wind shear
Ground
Vwind
Wind-Shear Profile
Ground
Vwind
Wind-Shear Profile
Turbulence intensity
TI=s/ s : std. dev. : average
Wind Speed Distribution Wind direction distribution
GCEP Wind 101| 14 October 2014 10
0%
2%
4%
6%
8%
10%
12%
0 10 20 30
Win
d S
pe
ed
Dis
trib
uti
on
, %
Wind Speed, m/s Source: http://commons.wikimedia.org/wiki/File:Wind_rose_plot.jpg Copyright 2010 BREEZE Software, used with permission.
IEC Class A: 18% at 15 m/s IEC Class B: 16% at 15 m/s
Copyright TOM, used with permission.

© 2014 General Electric Company – All rights reserved
Actuator disc
Actuator disc
Stream tube
Wind speed (static) Pressure
1 2
d
Model
• Rotor is a permeable disc
• Velocity reduction is equally distributed before/after the rotor and a: Axial Induction factor for slow down
• Power: Change in momentum caused by pressure difference across disk
for V2=0: only load, no power
Main Results
Power coefficient:
Thrust coefficient:
Maximum extractable Power is 59.3%
12 )21( VaV =
23
121 14 aaAVpmP dd == r
aaAV
T
aaAV
P
d
hrust
t
d
ower
p
c
c
==
==
14
14
2
121
2
3
121
r
r
Voice of Physics – Actuator Disk Theory
0
0.2
0.4
0.6
0.8
1
0 0.1 0.2 0.3 0.4 0.5
Po
we
r &
Th
rust
C
oe
ffic
ien
ts
Axial Induction Factor, a
Cp
Ct Betz Limit
GCEP Wind 101| 14 October 2014 11
Source: http://commons.wikimedia.org/wiki/File:Betz_tube.jpg Placed in the Public Domain by Anthony vh

© 2014 General Electric Company – All rights reserved
Optimizing Cp’s through Configuration
Horizontal-axis wind turbines • More blades increase Cp … but increase
cost
Vertical-axis lift (Darrieus) • Limited applicability due to lower Cp Horizontal-axis windmills • Designed for torque not electricity …
results in low tip speed operation Vertical-axis drag (Savonius) • Used as primary technology for
anemometers
GCEP Wind 101| 14 October 2014 12
Source: http://www.intechopen.com/books/fundamental-and-advanced-topics-in-wind-power/wind-turbines-theory-the-betz-equation-and-optimal-rotor-tip-speed-ratio Copyright 2011 Magdi Ragheb and Adam M. Ragheb , used with permission.

© 2014 General Electric Company – All rights reserved
Power Curve
0%
2%
4%
6%
8%
10%
12%
0
0.5
1
1.5
2
2.5
3
3.5
4
4.5
5
0 5 10 15 20 25 30
Win
d D
istr
ibu
tio
nb
Po
we
ra,
MW
Wind Speed, m/s
Wind Distribution
2.5-120
Power in Wind (Betz Limit)
Turbine loads & costs correlate closely to power in wind Significant added cost to continue extracting power in wind
Not enough wind to make effort to capture energy worthwhile
a) Power is for a 120m rotor diameter turbine b) Wind distribution calculated from Weibull distribution, 7.5 m/s average wind speed, k=2
Dominated by aero, mechanical, & electrical losses
GCEP Wind 101| 14 October 2014 13
© 2014 General Electric Company – All rights reserved
0.00
0.05
0.10
0.15
0.20
0.25
0.30
0.35
0.40
0.45
0.50
0 2 4 6 8 10 12 14 16 18 20 22 24
0
500
1000
1500
2000
2500
electricaerodynamic"power curve"
0
100,000
200,000
300,000
400,000
500,000
600,000
700,000
0 2 4 6 8 10 12 14 16 18 20 22 24
0
50
100
150
200
250
300
350
400
450
500
0 2 4 6 8 10 12 14 16 18 20 22 24
][)( smv bin
][)( ht bin ][)( binpc
][)( smv bin
=
][)( kWhYieldEnergy bin
][)( smv bin
actual
Weibull
binelecpbinbin AEPRcvt = 2
).(
3
)()(2
1r
][kWPower
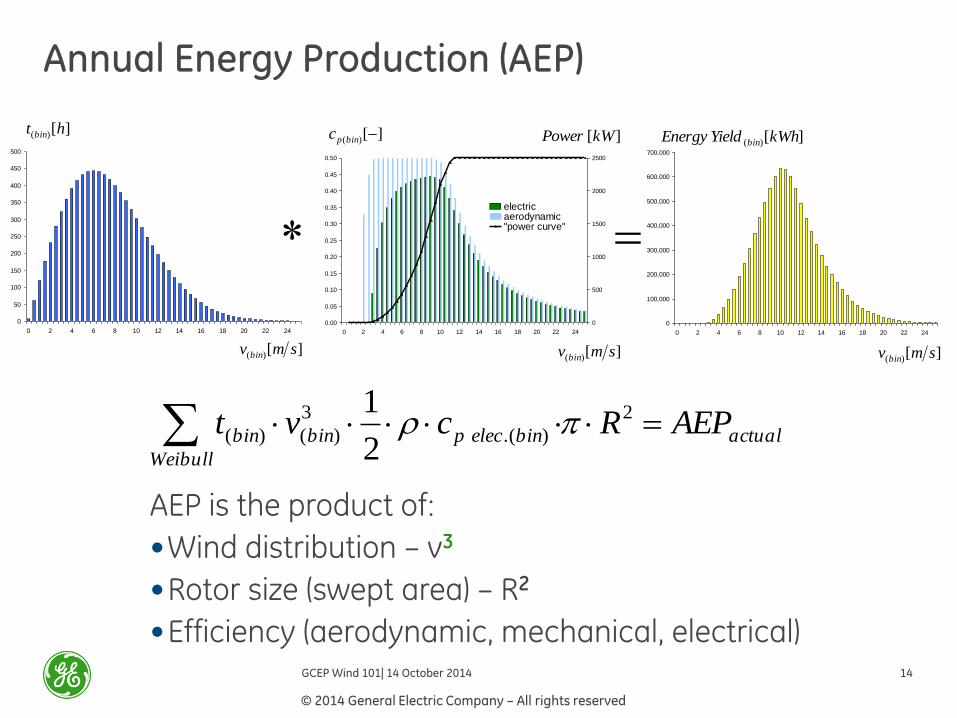
AEP is the product of:
•Wind distribution – v3
•Rotor size (swept area) – R2
•Efficiency (aerodynamic, mechanical, electrical)
Annual Energy Production (AEP)
GCEP Wind 101| 14 October 2014 14

© 2014 General Electric Company – All rights reserved
• Power curve region: below cut-in cut-in to rated (partial power) rated to cut-out
0.0
500.0
1,000.0
1,500.0
2,000.0
2,500.0
0 5 10 15 20 25
Wind Speed [m/s]
Po
wer
[kW
]
0
5
10
15
20
25
30
pitc
h, t
hru
st,
RP
M
Power
Cut-in Wind speed
Rated Wind speed
1 2 3
Cut-out Wind speed
1
2
3
• Variable speed:
RPM ~ wind speed
• Constant speed:
RPM constant
0.0
500.0
1,000.0
1,500.0
2,000.0
2,500.0
0 5 10 15 20 25
Wind Speed [m/s]
Po
wer
[kW
]
0
5
10
15
20
25
30
RP
M
Power RPM [-]
variable speed
constant speed
• Pitch actuation: > Fine pitch > Peak shaver > Power control
(Thrust) Load reduction 0.0
500.0
1,000.0
1,500.0
2,000.0
2,500.0
0 5 10 15 20 25
Wind Speed [m/s]
Po
wer
[kW
]
0
5
10
15
20
25
30
pitc
h, t
hru
st,
RP
M
Power Thrust [20*kN] RPM [-] pitch [deg]
Power control: pitch to feather
Fine pitch
Peak Shaver
Power Curve – Regions
GCEP Wind 101| 14 October 2014 15

© 2014 General Electric Company – All rights reserved
Loads Analysis
Simulation Driven ... incorporate wind
turbulence, control strategy, aero & structural
properties
Structural Design ... used to design
components
Certification ... meet specific design load
cases (DLC‘s)
• IEC 61400 ed. 2 / ed.3 (-1 onshore; -2 small; -3
offshore)
• DIBt (partly identical with IEC, but HH-dep.- windspeeds, add. DLCs)
• NVN 11400 (similar to IEC)
Bankability … required by customer &
financing institutions
IEC 61400-1 Ed2 WIND TURBINE CLASS
I II III
Vave [m/s] 10 8.5 7.5
Vref [m/s] 50 42.5 37.5
TI15 [%] a / b 18/16 18/16 18/16
Air density [kg/m³] 1.225
Vertical shear [-] 0.2/ 0.11
Flow angles [°] < 8 GCEP Wind 101| 14 October 2014 16

© 2014 General Electric Company – All rights reserved
Site Specific Mechanical Loads Analysis
Determine turbine loads suitability at site specific locations
GCEP Wind 101| 14 October 2014 17

© 2014 General Electric Company – All rights reserved
Square-Cube Law
Energy capture is proportional to RD2
Loads Mass Cost are proportional to RD3
… but this is a generalization & some economies of scale exist
… and some step changes like blade logistics
GCEP Wind 101| 14 October 2014
En
erg
y &
Co
st
Rotor Diameter
Energy
Loads … Mass … Cost
Installation Tower
Power Electronics
BOP
18
© 2014 General Electric Company – All rights reserved

© 2014 General Electric Company – All rights reserved
Turbine scale … costs and benefits
BOP cost
Technology advancements required to beat the cost curve
Nameplate
BO
P $
/MW
Turbine cost
Nameplate
Turb
ine
$/M
W
Total CapEx
Nameplate
Ca
pE
x $
/MW
Technology
Technology
+ =
GCEP Wind 101| 14 October 2014 19
© 2014 General Electric Company – All rights reserved

© 2014 General Electric Company – All rights reserved
Goal: Assess the system-level value of new technologies & next-generation product designs
• Many system-level trades rating & rotor diameter hub height control strategies (loads vs. AEP) component technologies (cost vs. perf) rotational speed (noise, DT size, loads)
• Need system-level approach to optimize performance capital cost operation & maintenance
• Non-obvious interactions abound
Optimizing technology
development & product moves
around lifetime value to wind farm
LC
OE
Ch
an
ge
Current Technology
New Technology
Turbine Rating
driving down LCOE, changing the optimum rating
Wind System Engineering Objectives
GCEP Wind 101| 14 October 2014 20
© 2014 General Electric Company – All rights reserved

© 2014 General Electric Company – All rights reserved
Benefits of Tall Tower
• Higher mean wind speed • Reduced wind shear • Reduced turbulence
Modeling Typical applied Power law in flat terrain:
Vh = Vref (h/href) α
– h is the height above ground – α is the wind shear coefficient
– Typically 0.14 α 0.20 (Depends on terrain)
Negative shear
• Local increase in wind speed near ground
• Occurs on top of ridges and hills
Tower Height Optimization
60
80
100
120
140
5.5 6.0 6.5 7.0
a0.14 a0.2
Shear drives economics
Hub-Height dAEP 0.14 dAEP 0.2
80 -9% -13%
100 0% 0%
120 8% 12%
140 15% 22%
Average Wind Speed
Hu
b-H
eig
ht
α = 0.14 α = 0.2
GCEP Wind 101| 14 October 2014 21

© 2014 General Electric Company – All rights reserved
System Value Optimization
GCEP Wind 101| 14 October 2014
Localized loads
Materials
BOP Costs
Logistics
Component Level Turbine Level Farm Level
Capital Cost
Annual Energy Production
Operation & Maintenance
Full loads
Operational limits
Component efficiency
Turbine power curve
Wind Resource
Wake & cable losses (siting)
Planned maintenance
Failure rates
Overall turbine O&M cost
Technologists typical focus
areas
Fleet Level
Key Metrics
Servicing strategy
Grid Integration
Forecasting
LCOE, NPV, IRR Fleet Operations
Balancing Costs Lifecycle Costs
Lifecycle Costs
Rotor Diameter & Rating
Complex multi-physics, multi-dimensional
optimization at farm and fleet levels.
Customers focus areas
22

© 2014 General Electric Company – All rights reserved
Technology Differentiators among Utility-Scale OEM’s
Blade Materials … Carbon vs. Glass
Power Conversion … Full Power vs. Partial
Power
Drivetrain Architecture … DD vs. Geared
Controls
GCEP Wind 101| 14 October 2014 23

© 2014 General Electric Company – All rights reserved
How are Wind Farms Laid Out ?
GCEP Wind 101| 14 October 2014 24
Examples:
Spacing
Wind
5-9 D
3-5 D
D: rotor diameter
along a ridge Array

© 2014 General Electric Company – All rights reserved
Find the best wind
Select the best turbine model
Place turbines in energetic most locations on site
Minimize wake effects
Optimize BOP
Maximize AEP given constraints
Waked turbines
Micro Siting Basics
GCEP Wind 101| 14 October 2014 25
Source: http://www.noaanews.noaa.gov/stories2011/images/vattenfall-image_300.jpg Copyright 2010 Vattenfall, used with permission.

© 2014 General Electric Company – All rights reserved
Economics – LCOE & Incentives
GCEP Wind 101| 14 October 2014
LCOE
Incentives
Production Based
Production Tax Credit (PTC)
not taxed, 10 years, in addition to PPA
US 2.3 cents/kWh
Feed-In Tariffs
common in Europe, replaces PPA
Germany has ~11.3 cents/kWh
Installed Cost Based
Investment Tax Credit (ITC)
like solar in US (30% of installed capex), no longer valid for utility-scale wind)
Accelerated Capital Depreciation
0%
10%
20%
30%
40%
0 5 10 15 20
De
pre
cia
tio
n
Sc
he
du
le,
% o
f C
ap
ex
Years
20 Yr. Straight Line
US-MACRS
Germany
0
50
100
150
200
250
OnshoreWind
OnshoreWind +MACRS
OnshoreWind +
MACRS &PTC
OffshoreWind
OffshoreWind +MACRS
OffshoreWind +
MACRS &PTC
LC
OE
, $
/MW
h
O&M
Capital
Based on DOE Program Estimates from OpenEI Transparent Cost Database, accessed 10/02/2014.
Onshore wind competitive in many places
26

© 2014 General Electric Company – All rights reserved
North American Optimized Product
Constrained either by land available or electrical interconnect … Large Project Sizes (often >50 turbines)
Competes with variable cost of gas … low PPA values
Moderate wind resource … IEC Class II & III
Economics – Markets Drive Product Platforms
GCEP Wind 101| 14 October 2014
European Optimized Product
Constrained by land available … Small farm sizes (often <10 turbines) .
Strong feed-in tariff rates … AEP valued .
Poorer wind resource … IEC Class III & IV
Manage cost & performance for low PPA’s Increasing size can pay off with high feed-in tariffs
2.3-107 1.7-100 3.2-103 2.75-120
1.85-82.5 1.85-87 2.85-100 2.85-103
27

© 2014 General Electric Company – All rights reserved
Current Research Trends
GCEP Wind 101| 14 October 2014
Cost Effective Scaling … Large Rotor & Tower Technologies
Minimize Loads … Advanced Controls & Sensors
Farm Level Optimization … Farm Control & Big Data Analytics
Grid Friendly … Storage Integration
28

© 2014 General Electric Company – All rights reserved
Join the conversation
www.youtube.com/grcblog
twitter.com/edisonsdesk
www.edisonsdesk.com
www.ge.com/research GE Global Research website
Edison’s Desk on Twitter
Youtube account
Edison’s Desk – GE’s longest running blog
We’re on Facebook too!
Engage with GE scientists and engineers about innovation and science
www.ge.com/genius GE’s Genius of the Day
GCEP Wind 101| 14 October 2014 29
