gce biology by2 oxygen dissociation curves gce biology by2 adaptations for transport next
TRANSCRIPT

GC
E B
IOLO
GY
BY
2O
xyge
n D
isso
ciat
ion
Cur
ves GCE BIOLOGY BY2
Adaptations for Transport
NextNext

GC
E B
IOLO
GY
BY
2O
xyge
n D
isso
ciat
ion
Cur
ves
+
Click on the magnifying glass to enlarge this
image of the haemoglobin molecule
Click on the magnifying glass to enlarge this
image of the haemoglobin molecule
The haem part of the molecule contains iron.
Each molecule has four haem groups and each one of these can bind with an oxygen molecule.
Hb + 4O2 HbO8 NextNext
GC
E B
IOLO
GY
BY
2O
xyge
n D
isso
ciat
ion
Cur
ves
0 2 4 6 8 10 120
20
40
60
80
100
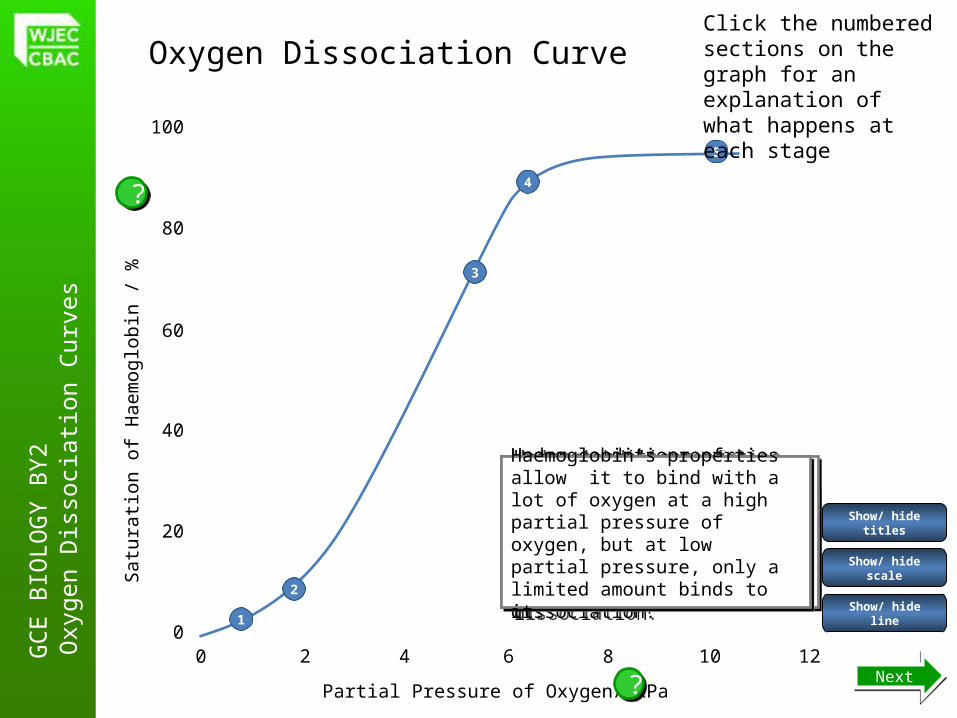
Oxygen Dissociation Curve
Satu
ratio
n of
Hae
mog
lobi
n / %
Partial Pressure of Oxygen/ kPa
Show/ hide line1
2
3
4
5
Show/ hide scale
Show/ hide titles
??
??
NextNext
The red blood cells collect oxygen in the capillaries surrounding the lungs. The red blood cells collect oxygen in the capillaries surrounding the lungs.
The partial pressure of oxygen is high and the haemoglobin reaches saturation.
The partial pressure of oxygen is high and the haemoglobin reaches saturation.
The red blood cells transport the oxygen to respiring tissues. The partial pressure of oxygen in these tissues is low, as the oxygen is being used for respiration.
The red blood cells transport the oxygen to respiring tissues. The partial pressure of oxygen in these tissues is low, as the oxygen is being used for respiration.
Under conditions of a lack of oxygen (low partial pressure of oxygen), the haemoglobin yields its oxygen to the respiring cells – we refer to this as dissociation.
Under conditions of a lack of oxygen (low partial pressure of oxygen), the haemoglobin yields its oxygen to the respiring cells – we refer to this as dissociation.
Haemoglobin’s properties allow it to bind with a lot of oxygen at a high partial pressure of oxygen, but at low partial pressure, only a limited amount binds to it.
Haemoglobin’s properties allow it to bind with a lot of oxygen at a high partial pressure of oxygen, but at low partial pressure, only a limited amount binds to it.
Click the numbered sections on the graph for an explanation of what happens at each stage
GC
E B
IOLO
GY
BY
2O
xyge
n D
isso
ciat
ion
Cur
ves
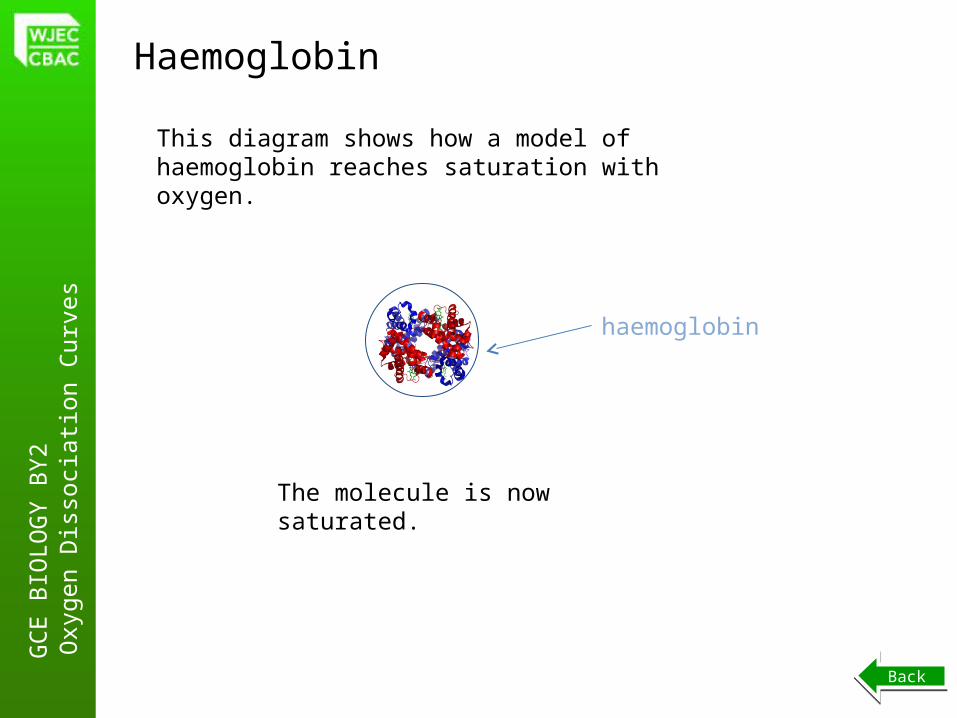
haemoglobin
The molecule is now saturated.
Haemoglobin
BackBack
This diagram shows how a model of haemoglobin reaches saturation with oxygen.

GC
E B
IOLO
GY
BY
2O
xyge
n D
isso
ciat
ion
Cur
ves
HIGHER PRESSURE
(kPa)
BackBack
The oxygen partial pressure (pO2) is a measure of oxygen concentration.
The higher the concentration of dissolved oxygen, the higher the pressure.
Click on the above boxes to see movement of the molecules. Click on the above boxes to see movement of the molecules.
GC
E B
IOLO
GY
BY
2O
xyge
n D
isso
ciat
ion
Cur
ves
0 2 4 6 8 10 120
20
40
60
80
100
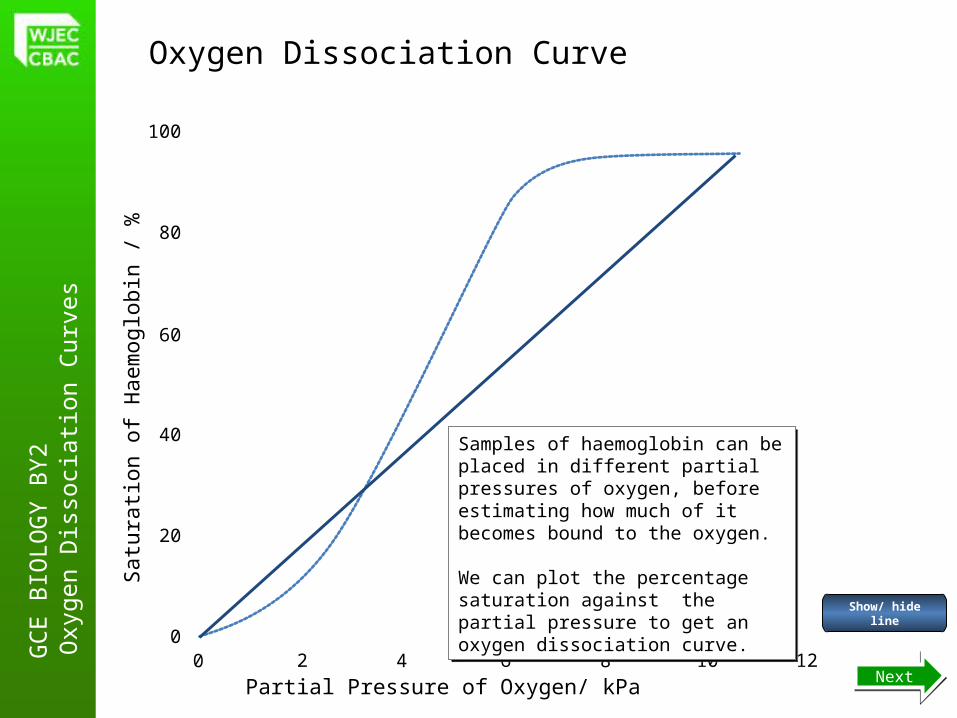
Oxygen Dissociation Curve
Show/ hide line
Samples of haemoglobin can be placed in different partial pressures of oxygen, before estimating how much of it becomes bound to the oxygen.
We can plot the percentage saturation against the partial pressure to get an oxygen dissociation curve.
Samples of haemoglobin can be placed in different partial pressures of oxygen, before estimating how much of it becomes bound to the oxygen.
We can plot the percentage saturation against the partial pressure to get an oxygen dissociation curve.
Satu
ratio
n of
Hae
mog
lobi
n / %
Partial Pressure of Oxygen/ kPa NextNext
GC
E B
IOLO
GY
BY
2O
xyge
n D
isso
ciat
ion
Cur
ves
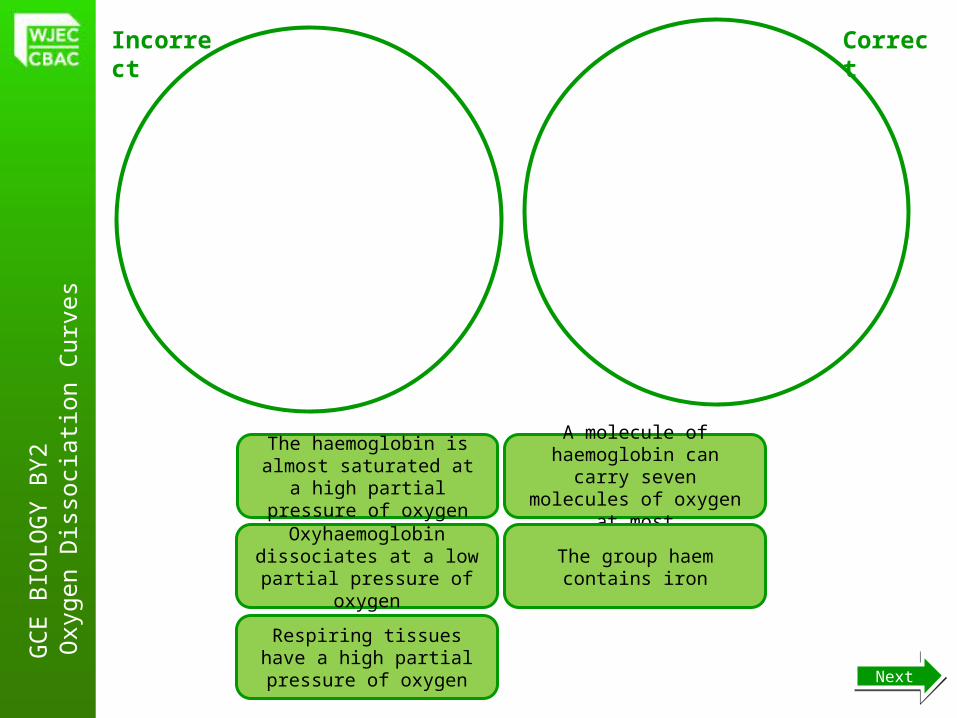
CorrectIncorrect
The haemoglobin is almost saturated at a high partial
pressure of oxygen
Oxyhaemoglobin dissociates at a low partial pressure of
oxygen
Respiring tissues have a high partial pressure of oxygen
A molecule of haemoglobin can carry seven molecules of
oxygen at most
The group haem contains iron
NextNext

GC
E B
IOLO
GY
BY
2O
xyge
n D
isso
ciat
ion
Cur
ves
0 2 4 6 8 10 120
20
40
60
80
100
Why is an Oxygen Dissociation Curve S-shaped?
Note that each haemoglobin
molecule contains four haem groups
Note that each haemoglobin
molecule contains four haem groups
Hint
Answer
When the first oxygen molecules binds to the first haem group, the haemoglobin molecule loses its shape. This makes it easier for the three other molecules to combine with the remaining haem groups.
Sat
urat
ion
of H
aem
oglo
bin
/ %
Partial Pressure of Oxygen/ kPa NextNext
GC
E B
IOLO
GY
BY
2O
xyge
n D
isso
ciat
ion
Cur
ves
0 2 4 6 8 10 120
20
40
60
80
100
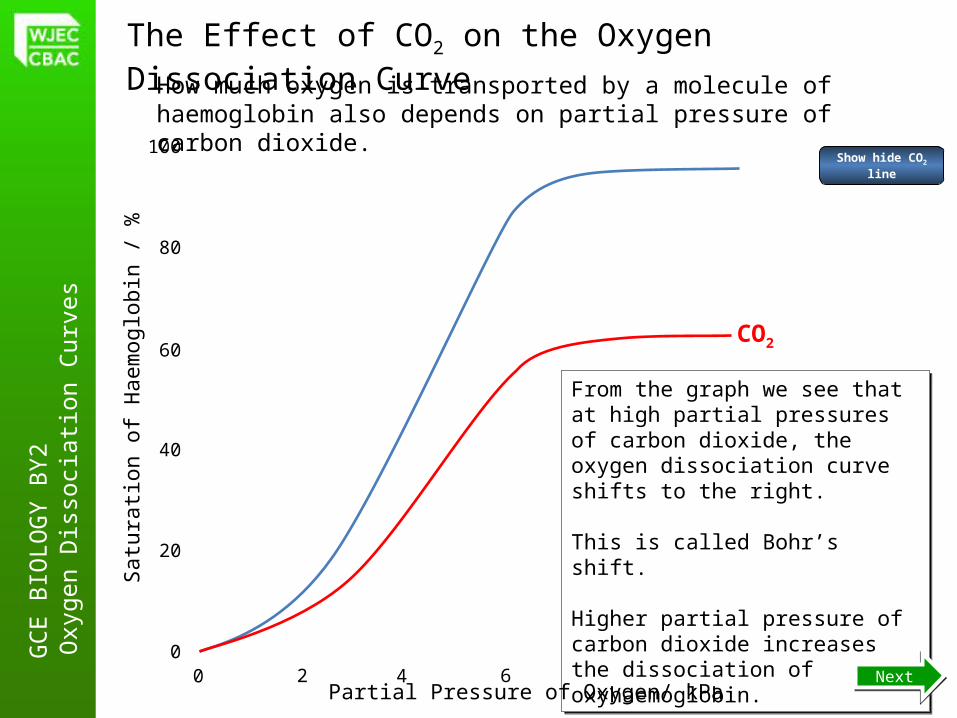
The Effect of CO2 on the Oxygen Dissociation Curve
CO2
Show hide CO2 line
How much oxygen is transported by a molecule of haemoglobin also depends on partial pressure of carbon dioxide.
From the graph we see that at high partial pressures of carbon dioxide, the oxygen dissociation curve shifts to the right.
This is called Bohr’s shift.
Higher partial pressure of carbon dioxide increases the dissociation of oxyhaemoglobin.
From the graph we see that at high partial pressures of carbon dioxide, the oxygen dissociation curve shifts to the right.
This is called Bohr’s shift.
Higher partial pressure of carbon dioxide increases the dissociation of oxyhaemoglobin.
Satu
ratio
n of
Hae
mog
lobi
n / %
Partial Pressure of Oxygen/ kPaNextNext

GC
E B
IOLO
GY
BY
2O
xyge
n D
isso
ciat
ion
Cur
ves
0 2 4 6 8 10 120
20
40
60
80
100
CO2
What is the significance of this in the body?
When oxyhaemoglobin reaches the tissues, the high partial pressure of carbon dioxide from respiration causes oxyhaemoglobin to release its oxygen more easily. So oxygen is released where it’s needed.
AnswerSa
tura
tion
of H
aem
oglo
bin
/ %
Partial Pressure of Oxygen/ kPa
The Effect of CO2 on the Oxygen Dissociation Curve
NextNext

GC
E B
IOLO
GY
BY
2O
xyge
n D
isso
ciat
ion
Cur
ves
0 2 4 6 8 10 120
20
40
60
80
100
Show/ hide the CO2 curve
pHCO2
Show/ hide the pH curve
The Effect of pH on the Oxygen Dissociation Curve
Satu
ratio
n of
Hae
mog
lobi
n / %
Partial Pressure of Oxygen/ kPaNextNext

GC
E B
IOLO
GY
BY
2O
xyge
n D
isso
ciat
ion
Cur
ves
Explain what you see here(Keep in mind what you’ve already seen)
HINTS
What has happened to the level of oxygen in the water?
What happens to the level of CO2 in the water?
What has happened to reduce the pH of the water?
What does the pH meter show?
pH
NextNext
GC
E B
IOLO
GY
BY
2O
xyge
n D
isso
ciat
ion
Cur
ves
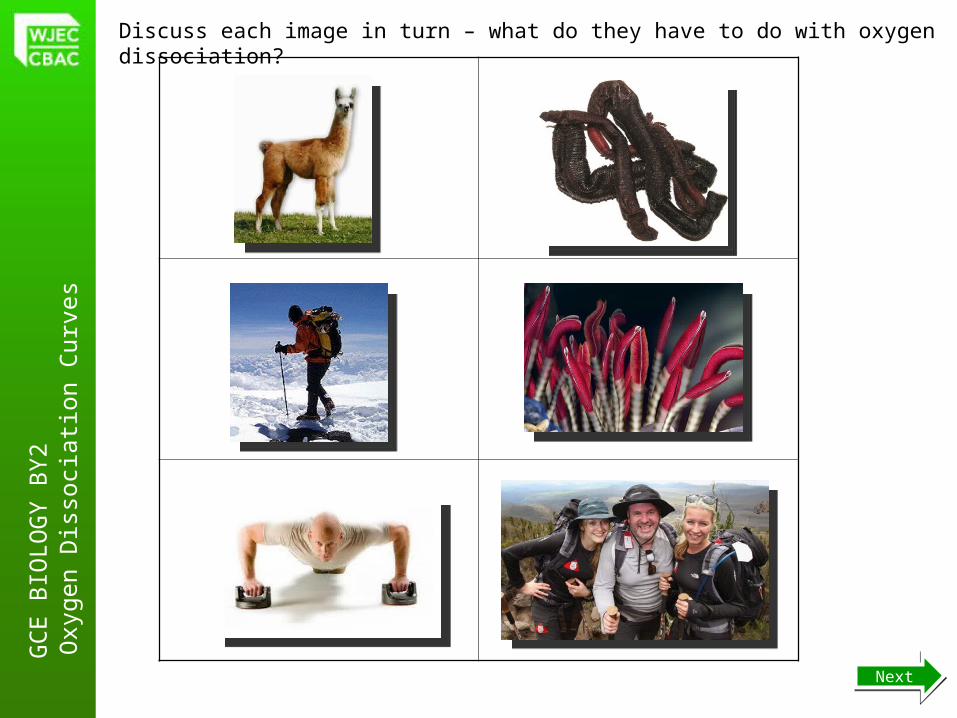
Discuss each image in turn – what do they have to do with oxygen dissociation?
NextNext

GC
E B
IOLO
GY
BY
2O
xyge
n D
isso
ciat
ion
Cur
ves
0 2 4 6 8 10 120
20
40
60
80
100
The Oxygen Dissociation Curve of an Athlete in Training
Satu
ratio
n of
Hae
mog
lobi
n / %
Partial Pressure of Oxygen/ kPa
The further the oxygen dissociation curve shifts to the right, the easier it is for the haemoglobin to give up its oxygen.
The further the oxygen dissociation curve shifts to the right, the easier it is for the haemoglobin to give up its oxygen.
The further left the curve shifts, the easier it is for haemoglobin to pick up oxygen.
The further left the curve shifts, the easier it is for haemoglobin to pick up oxygen.
NextNext
GC
E B
IOLO
GY
BY
2O
xyge
n D
isso
ciat
ion
Cur
ves
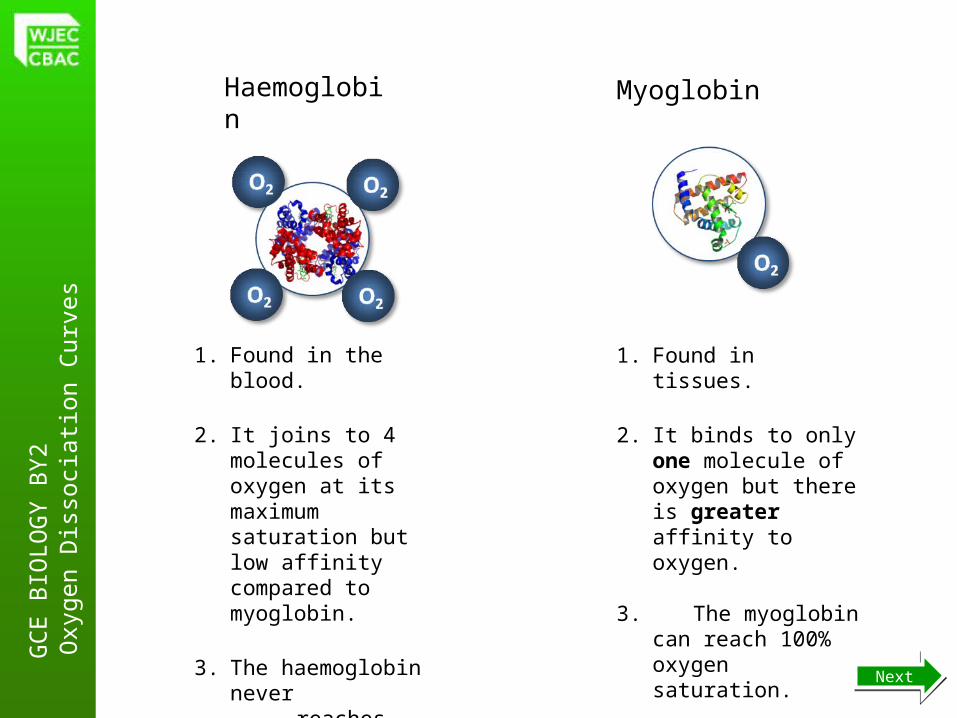
Haemoglobin Myoglobin
NextNext
1. Found in the blood.
2. It joins to 4 molecules of oxygen at its maximum saturation but low affinity compared to myoglobin.
3. The haemoglobin never
reaches 100% oxygen saturation
1. Found in tissues.
2. It binds to only one molecule of oxygen but there is greater affinity to oxygen.
3. The myoglobin can reach 100% oxygen saturation.
GC
E B
IOLO
GY
BY
2O
xyge
n D
isso
ciat
ion
Cur
ves
0 2 4 6 8 10 120
20
40
60
80
100
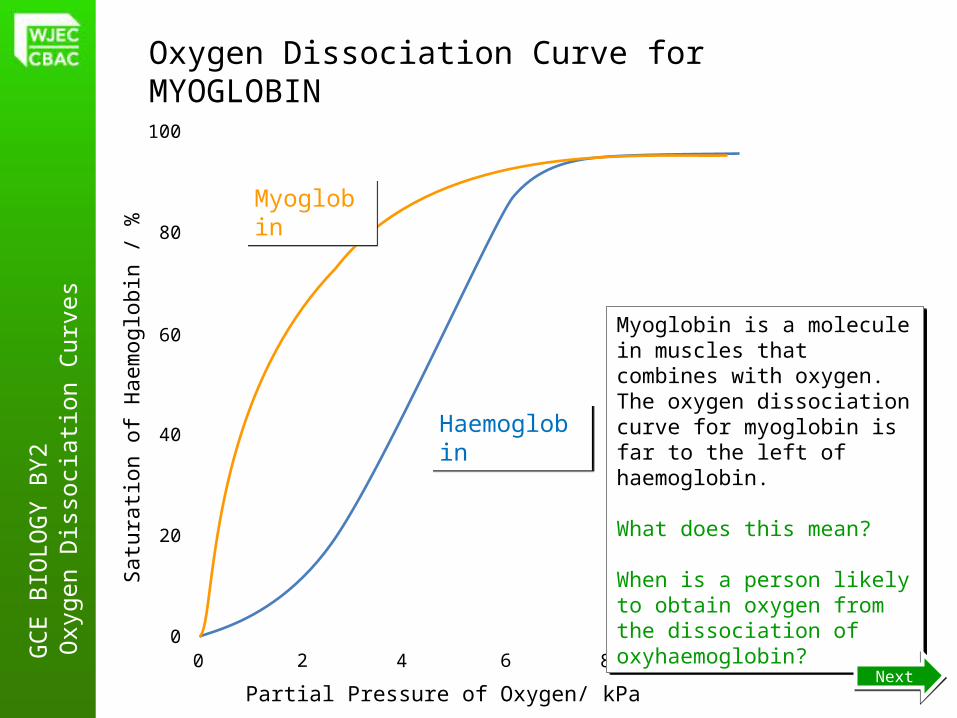
Oxygen Dissociation Curve for MYOGLOBIN
Myoglobin is a molecule in muscles that combines with oxygen. The oxygen dissociation curve for myoglobin is far to the left of haemoglobin.
What does this mean?
When is a person likely to obtain oxygen from the dissociation of oxyhaemoglobin?
Myoglobin is a molecule in muscles that combines with oxygen. The oxygen dissociation curve for myoglobin is far to the left of haemoglobin.
What does this mean?
When is a person likely to obtain oxygen from the dissociation of oxyhaemoglobin?
MyoglobinMyoglobin
HaemoglobinHaemoglobin
Sat
urat
ion
of H
aem
oglo
bin
/ %
Partial Pressure of Oxygen/ kPaNextNext

GC
E B
IOLO
GY
BY
2O
xyge
n D
isso
ciat
ion
Cur
ves
Foetus
placenta
What is the function of the placenta?
Answer
The blood of the foetus and the mother flows closely together, but never mixes. This allows substances like oxygen to diffuse into the blood of the developing foetus. NextNext
GC
E B
IOLO
GY
BY
2O
xyge
n D
isso
ciat
ion
Cur
ves
0 2 4 6 8 10 120
20
40
60
80
100
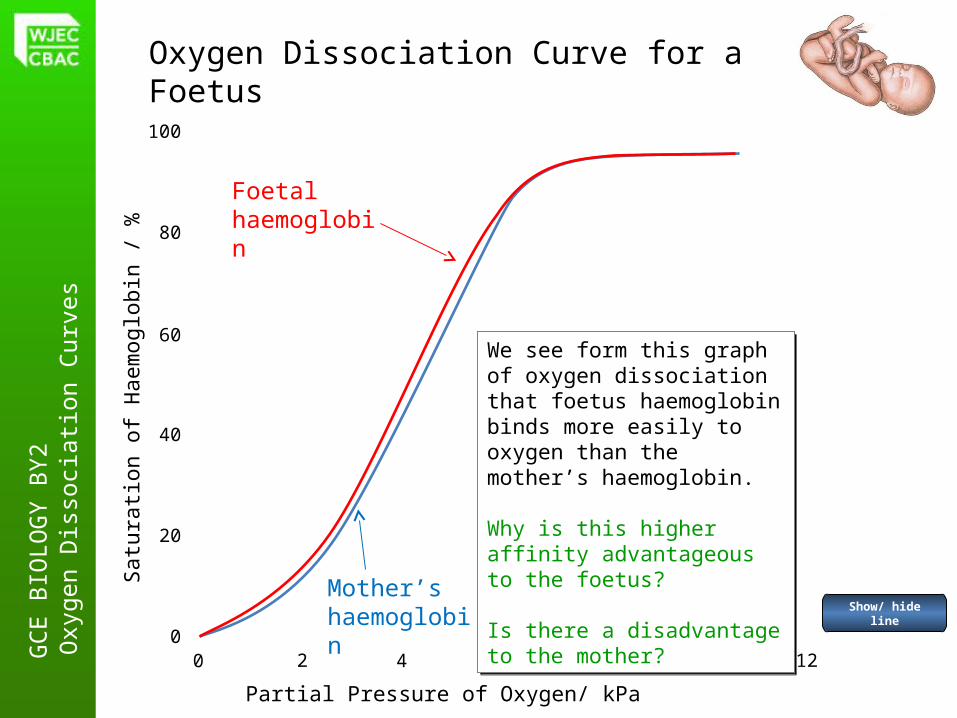
Oxygen Dissociation Curve for a Foetus
Show/ hide line
We see form this graph of oxygen dissociation that foetus haemoglobin binds more easily to oxygen than the mother’s haemoglobin.
Why is this higher affinity advantageous to the foetus?
Is there a disadvantage to the mother?
We see form this graph of oxygen dissociation that foetus haemoglobin binds more easily to oxygen than the mother’s haemoglobin.
Why is this higher affinity advantageous to the foetus?
Is there a disadvantage to the mother?
Satu
ratio
n of
Hae
mog
lobi
n / %
Partial Pressure of Oxygen/ kPa
Foetal haemoglobin
Mother’s haemoglobin