gbx the greenbrier companies - cloud object storage is a substantially different company than just a...
TRANSCRIPT

The Greenbrier Companies 2016 Annual ReportGBX

LETTER FROM THE CHAIRMAN AND CHIEF EXECUTIVE OFFICER
To Our Shareholders:
In 2016, Greenbrier successfully navigated through demanding North American
market conditions and continued to pursue growth opportunities with strategic
international investments. We ended the year with a secure balance sheet, low net
debt and a strong backlog of nearly $3.2 billion. This positions Greenbrier to meet
industry challenges as we compete in the current railcar market in North America,
while at the same time we diversify in stronger international markets. Our
employees successfully executed on our plan for the year. We appreciate their
hard work along with the confidence and trust of our customers.
Greenbrier is a substantially different company than just a few short years ago.
Today, we have customers on four continents and build products on three
continents. Our nearly $2.7 billion in annual revenue for fiscal 2016 represents an
almost $1 billion increase in revenue over the past three years. After generating record performance in fiscal
2015 we continued to perform well, delivering over 20,300 railcars in fiscal 2016 and ending the year with a
diversified railcar backlog of over 27,500 railcars. Favorable pricing continues in our backlog with an average
unit sale price of $116,000. This backlog spans almost all railcar types, and provides a good tailwind as we enter
fiscal 2017.
We have a simple, two-part strategy as we address our traditional North American rail markets, which are
leveling off from record highs:
Greenbrier first maintains an unrelenting focus on our core North American market. We will continue to
effectively market and sell our products, while investing in product enhancements and new product development.
We will focus on profitability, cash flow and developing human capital for the future. We will preserve and
protect our areas of unique competency in engineering and design, manufacturing and services.
Additionally, Greenbrier will continue to diversify internationally by going to global markets where demand for
railcars is growing. We will judiciously seek to team with strong local business partners in these international
markets. We will enter markets outside North America where we have encouragement both from the host nation
and the United States. We have identified markets in the nations of the Gulf Cooperation Council (GCC); Brazil;
Eurasia; and Eastern Europe as initial targets.
Despite market pressures driven by lighter demand and oversupply in certain car types, our Manufacturing
segment succeeded in executing its plan, and achieved gross margin of 22% in fiscal 2016, an increase over fiscal
2015. Our Marine group built an ocean-going articulated tug barge with an 185,000 barrel carrying capacity in
fiscal 2016 and currently enjoys a backlog that extends into fiscal 2018. Internationally, we initiated production
from our European facility, under U.S.-based technical and project supervisors, for the 1,200 tank car order
placed by Saudi Railway Company (SAR). Our global manufacturing and engineering system for new railcar
manufacturing is the best in the industry. Currently, Manufacturing accounts for approximately 75% of
Greenbrier’s annual worldwide revenue.
Our Leasing & Services businesses realigned in fiscal 2016 to emphasize three primary areas of business activity:
Lease Underwriting, Lease Syndication and Asset Management Services (GMS). The realignment further
integrates Greenbrier’s Leasing & Services businesses with our Commercial group as together they deploy a ‘go
to market’ strategy that serves our integrated business model and reflects our expanded worldwide activities.
These changes were also made in anticipation of the December 2016 retirement of long-time Greenbrier Leasing
Company President, Jim Sharp. During his 20-year tenure at Greenbrier, Jim grew a small railcar leasing
company into a very successful, asset-light leasing and asset management business that today manages over
268,000 railcars and completed over $1.2 billion in lease syndications during the last two years. Most of
Greenbrier’s syndication activity results in institutional partners owning underlying assets that are then managed
by Greenbrier. Railcar management creates a fee-based revenue structure over the life of the equipment. We
greatly appreciate Jim’s 20 years of creative and dedicated service to Greenbrier. His ingenuity and talent will be
missed.

At the start of fiscal 2017, a new Regulatory Services Group was launched as part of GMS’ asset management
business. Now part of GMS, the most respected rail regulatory compliance team in North America offers a range
of regulatory and related support to the tank car and petrochemical rail shipper community, among other services.
Petrochemical shippers and other tank car users are a customer base that Greenbrier has successfully served and
are a rail user group that offers substantial growth in demand for discrete, unique and value-added asset
management services.
Greenbrier continues to transform. We actively seek opportunities to diversify and access new markets to expand
the reach of our integrated business model. Aftermarket services are an important component to our long-term
strategy. Our Wheels & Parts business experienced headwinds impacting its margin performance in fiscal 2016.
Yet, Wheels & Parts remains an important and profitable component of our overall enterprise that also brings
strategic benefits to Greenbrier. GBW Railcar Services, our railcar repair joint venture, grew its revenue in fiscal
2016. Despite tough markets for railcar repair and refurbishment early in fiscal 2017, we believe GBW is well-
positioned for the future.
Consistent with my commitments made in last year’s shareholder letter, Greenbrier made new investments in
2016 that substantially broaden our international presence, particularly in Europe and Latin America. In October
2016, we announced plans with Astra Rail to form Greenbrier-Astra Rail, which will grow our railcar
manufacturing and repair operations from three to six facilities in Europe and provide Greenbrier with majority
control of what we believe will be the premier railcar builder in Europe. After closing of the transaction, which
we expect to occur in early 2017, our new enterprise will have Europe’s broadest product line of freight railcars.
In August we acquired a 19.5% ownership position in the Brazil railcar castings maker Amsted-Maxion Cruziero.
Including our previous investments, this transaction takes our direct and indirect holdings in Brazilian railcar
maker Greenbrier-Maxion to 35%, with an option through 2017 to increase our total direct ownership in
Greenbrier-Maxion up to 60%. Our Brazil investments provide us unrivaled access to a Latin American region
that is increasingly looking to rail as the optimal mode to move freight, and reduce congestion at ports and on
highways.
Greenbrier’s substantial growth and extended reach has transformed the company, but some things never change.
Our success continues to be driven by anticipating and solving our customers’ challenges and problems,
anywhere in the world. We deeply value our customers’ commitment to us as we diversify and grow
internationally.
Greenbrier’s success is, of course, due mainly to the incredible capabilities and expertise of our dedicated team
members. At Greenbrier, we respect our people and value the contributions each makes to our shared
accomplishments. Today, with expanding manufacturing operations on three continents, stable cash flows, a
strong leasing and asset management business and a robust balance sheet, Greenbrier is well positioned to
continue to serve our customers, shareholders and employees in 2017 and beyond.
You can expect good things from Greenbrier during the upcoming year. Thank you for your continued support.
Sincerely,
William A. Furman
Chairman and Chief Executive Officer

UNITED STATES SECURITIES AND EXCHANGE COMMISSION
Washington, D.C. 20549-1004
FORM 10-K
È ANNUAL REPORT PURSUANT TO SECTION 13 OR 15(d)
OF THE SECURITIES EXCHANGE ACT OF 1934
For the fiscal year ended August 31, 2016
or
‘ Transition Report Pursuant to Section 13 or 15(d)
of the Securities Exchange Act of 1934
for the transition period from to
Commission File No. 1-13146
THE GREENBRIER COMPANIES, INC.(Exact name of Registrant as specified in its charter)
Oregon 93-0816972(State of Incorporation) (I.R.S. Employer Identification No.)
One Centerpointe Drive, Suite 200, Lake Oswego, OR 97035(Address of principal executive offices)
(503) 684-7000(Registrant’s telephone number, including area code)
Securities registered pursuant to Section 12(b) of the Act:
(Title of Each Class) (Name of Each Exchange on Which Registered)
Common Stock without par value New York Stock Exchange
Securities registered pursuant to Section 12(g) of the Act:
None
Indicate by check mark if the registrant is a well-known seasoned issuer, as defined in Rule 405 of the Securities Act. Yes X No
Indicate by check mark if the registrant is not required to file reports pursuant to Section 13 or 15 (d) of the Act. Yes No X
Indicate by check mark whether the Registrant (1) has filed all reports required to be filed by Section 13 or 15(d) of the Securities Exchange
Act of 1934 during the preceding 12 months (or for such shorter period that the Registrant was required to file such reports), and (2) has been
subject to such filing requirements for the past 90 days. Yes X No
Indicate by check mark whether the registrant has submitted electronically and posted on its corporate Website, if any, every Interactive Data
File required to be submitted and posted pursuant to Rule 405 of Regulation S-T during the preceding 12 months (or for such shorter period
that the registrant was required to submit and post such files). Yes X No
Indicate by check mark if disclosure of delinquent filers pursuant to Item 405 of Regulation S-K is not contained herein, and will not be
contained, to the best of Registrant’s knowledge, in definitive proxy or information statements incorporated by reference in Part III of this
Form 10-K or any amendment to this Form 10-K. [ ]
Indicate by check mark whether the registrant is a large accelerated filer, an accelerated filer, a non-accelerated filer, or a smaller reporting
company. See definition of “large accelerated filer”, “accelerated filer” and “smaller reporting company” in Rule 12b-2 of the Exchange
Act. (Check one)
Large accelerated filer X Accelerated filer Non-accelerated filer Smaller reporting company
Indicate by check mark whether the registrant is a shell company (as defined in Rule 12b-2 of the Exchange Act). Yes No X
Aggregate market value of the Registrant’s Common Stock held by non-affiliates as of February 29, 2016 (based on the closing price of such
shares on such date) was $684,081,392.
The number of shares outstanding of the Registrant’s Common Stock on October 19, 2016 was 28,363,846 without par value.
DOCUMENTS INCORPORATED BY REFERENCE
Certain portions of the Registrant’s definitive Proxy Statement prepared in connection with the Annual Meeting of Stockholders to be held on
January 6, 2017 are incorporated by reference into Parts II and III of this Report.

THE GREENBRIER COMPANIES, INC.
FORM 10-K
TABLE OF CONTENTS
PAGE
FORWARD-LOOKING STATEMENTS . . . . . . . . . . . . . . . . . . . . . . . . . . . . . . . . . 1
PART I
Item 1. BUSINESS . . . . . . . . . . . . . . . . . . . . . . . . . . . . . . . . . . . . . . . . . . . . . . . . . . . . . . . . 4
Item 1A. RISK FACTORS . . . . . . . . . . . . . . . . . . . . . . . . . . . . . . . . . . . . . . . . . . . . . . . . . . . . 12
Item 1B. UNRESOLVED STAFF COMMENTS . . . . . . . . . . . . . . . . . . . . . . . . . . . . . . . . . . . 29
Item 2. PROPERTIES . . . . . . . . . . . . . . . . . . . . . . . . . . . . . . . . . . . . . . . . . . . . . . . . . . . . . . 29
Item 3. LEGAL PROCEEDINGS . . . . . . . . . . . . . . . . . . . . . . . . . . . . . . . . . . . . . . . . . . . . . 29
Item 4. MINE SAFETY DISCLOSURES . . . . . . . . . . . . . . . . . . . . . . . . . . . . . . . . . . . . . . . 29
PART II
Item 5. MARKET FOR REGISTRANT’S COMMON EQUITY, RELATED
STOCKHOLDER MATTERS AND ISSUER PURCHASES OF EQUITY
SECURITIES . . . . . . . . . . . . . . . . . . . . . . . . . . . . . . . . . . . . . . . . . . . . . . . . . . . . . . . 30
Item 6. SELECTED FINANCIAL DATA . . . . . . . . . . . . . . . . . . . . . . . . . . . . . . . . . . . . . . . 32
Item 7. MANAGEMENT’S DISCUSSION AND ANALYSIS OF FINANCIAL
CONDITION AND RESULTS OF OPERATIONS . . . . . . . . . . . . . . . . . . . . . . . . . 33
Item 7A. QUANTITATIVE AND QUALITATIVE DISCLOSURES ABOUT MARKET
RISK . . . . . . . . . . . . . . . . . . . . . . . . . . . . . . . . . . . . . . . . . . . . . . . . . . . . . . . . . . . . . . 48
Item 8. FINANCIAL STATEMENTS AND SUPPLEMENTARY DATA . . . . . . . . . . . . . . 50
Item 9. CHANGES IN AND DISAGREEMENTS WITH ACCOUNTANTS ON
ACCOUNTING AND FINANCIAL DISCLOSURE . . . . . . . . . . . . . . . . . . . . . . . . . 82
Item 9A. CONTROLS AND PROCEDURES . . . . . . . . . . . . . . . . . . . . . . . . . . . . . . . . . . . . . 82
Item 9B. OTHER INFORMATION . . . . . . . . . . . . . . . . . . . . . . . . . . . . . . . . . . . . . . . . . . . . . 85
PART III
Item 10. DIRECTORS, EXECUTIVE OFFICERS AND CORPORATE GOVERNANCE . . . . 85
Item 11. EXECUTIVE COMPENSATION . . . . . . . . . . . . . . . . . . . . . . . . . . . . . . . . . . . . . . . 85
Item 12. SECURITY OWNERSHIP OF CERTAIN BENEFICIAL OWNERS AND
MANAGEMENT AND RELATED STOCKHOLDER MATTERS . . . . . . . . . . . . . 85
Item 13. CERTAIN RELATIONSHIPS AND RELATED TRANSACTIONS AND
DIRECTOR INDEPENDENCE . . . . . . . . . . . . . . . . . . . . . . . . . . . . . . . . . . . . . . . . 85
Item 14. PRINCIPAL ACCOUNTING FEES AND SERVICES . . . . . . . . . . . . . . . . . . . . . . 85
PART IV
Item 15. EXHIBITS AND FINANCIAL STATEMENT SCHEDULES . . . . . . . . . . . . . . . . . . 86
SIGNATURES . . . . . . . . . . . . . . . . . . . . . . . . . . . . . . . . . . . . . . . . . . . . . . . . . . . . . . 90
CERTIFICATIONS . . . . . . . . . . . . . . . . . . . . . . . . . . . . . . . . . . . . . . . . . . . . . . . . . . 91
T h e G r e e n b r i e r C o m p a n i e s 2 0 1 6 A n n u a l R e p o r t

Forward-Looking Statements
From time to time, The Greenbrier Companies, Inc. and its subsidiaries (Greenbrier or the Company) or their
representatives have made or may make forward-looking statements within the meaning of Section 27A of the
Securities Act of 1933, as amended, and Section 21E of the Securities Exchange Act of 1934, as amended,
including, without limitation, statements as to expectations, beliefs and strategies regarding the future. Such
forward-looking statements may be included in, but not limited to, press releases, oral statements made with the
approval of an authorized executive officer or in various filings made by us with the Securities and Exchange
Commission, including this filing on Form 10-K and in the Company’s President’s letter to stockholders that is
typically distributed to the stockholders in conjunction with this Form 10-K and the Company’s Proxy Statement.
These statements involve known and unknown risks, uncertainties and other important factors that may cause our
actual results, performance or achievements to be materially different from any future results, performance or
achievements expressed or implied by the forward-looking statements. These forward-looking statements rely on
a number of assumptions concerning future events and include statements relating to:
• availability of financing sources and borrowing base for working capital, other business development
activities, capital spending and leased railcars for syndication (sale of railcars with lease attached);
• ability to renew, maintain or obtain sufficient credit facilities and financial guarantees on acceptable terms;
• ability to utilize beneficial tax strategies;
• ability to grow our businesses;
• ability to obtain lease and sales contracts which provide adequate protection against attempted modifications
or cancellations, changes in interest rates and increased costs of materials and components;
• ability to obtain adequate insurance coverage at acceptable rates;
• ability to convert backlog of railcar orders and obtain and execute lease syndication commitments;
• ability to obtain adequate certification and licensing of products; and
• short-term and long-term revenue and earnings effects of the above items.
The following factors, among others, could cause actual results or outcomes to differ materially from the
forward-looking statements:
• fluctuations in demand for newly manufactured railcars or marine barges;
• fluctuations in demand for wheels, repair services and parts;
• delays in receipt of orders, risks that contracts may be canceled or modified during their term, not renewed,
unenforceable or breached by the customer and that customers may not purchase the amount of products or
services under the contracts as anticipated;
• ability to maintain sufficient availability of credit facilities and to maintain compliance with or to obtain
appropriate amendments to covenants under various credit agreements;
• domestic and global economic conditions including such matters as embargoes or quotas;
• global political or security conditions in the U.S., Europe, Latin America, the Gulf Cooperation Council
(GCC) and other areas including such matters as terrorism, war, civil disruption and crime;
• sovereign risk related to international governments that includes, but is not limited to, governments stopping
payments, repudiating their contracts, nationalizing private businesses and assets or altering foreign exchange
regulations;
• growth or reduction in the surface transportation industry;
• ability to maintain good relationships with our labor force, third party labor providers and collective
bargaining units representing our direct and indirect labor force;
• ability to maintain good relationships with our customers and suppliers;
• ability to renew or replace expiring customer contracts on satisfactory terms;
• ability to obtain and execute suitable lease contracts for leased railcars for syndication;
• steel and specialty component price fluctuations and availability, scrap surcharges, steel scrap prices and
other commodity price fluctuations and availability and their impact on product demand and margin;
• delay or failure of acquired businesses or joint ventures, assets, start-up operations, or new products or
services to compete successfully;
• changes in product mix and the mix of revenue levels among reporting segments;
• labor disputes, energy shortages or operating difficulties that might disrupt operations or the flow of cargo;
• production difficulties and product delivery delays as a result of, among other matters, costs or inefficiencies
associated with expansion, start-up, or changing of production lines or changes in production rates,
T h e G r e e n b r i e r C o m p a n i e s 2 0 1 6 A n n u a l R e p o r t 1

equipment failures, changing technologies, transfer of production between facilities or non-performance of
alliance partners, subcontractors or suppliers;
• lower than anticipated lease renewal rates, earnings on utilization based leases or residual values for leased
equipment;
• discovery of defects in railcars or services resulting in increased warranty costs or litigation;
• physical damage, business interruption or product or service liability claims that exceed our insurance
coverage;
• commencement of and ultimate resolution or outcome of pending or future litigation and investigations;
• natural disasters or severe or unusual weather patterns that may affect either us, our suppliers or our
customers;
• loss of business from, or a decline in the financial condition of, any of the principal customers that represent a
significant portion of our total revenues;
• competitive factors, including introduction of competitive products, new entrants into certain of our markets,
price pressures, limited customer base, and competitiveness of our manufacturing facilities and products;
• industry overcapacity and our manufacturing capacity utilization;
• decreases or write-downs in carrying value of inventory, goodwill, intangibles or other assets due to
impairment;
• severance or other costs or charges associated with lay-offs, shutdowns, or reducing the size and scope of
operations;
• changes in future maintenance or warranty requirements;
• ability to adjust to the cyclical nature of the industries in which we operate;
• changes in interest rates and financial impacts from interest rates;
• ability and cost to maintain and renew operating permits;
• actions or failures to act by various regulatory agencies including changing tank car or other rail car regulations;
• potential environmental remediation obligations;
• changes in commodity prices, including oil and gas;
• risks associated with our intellectual property rights or those of third parties, including infringement,
maintenance, protection, validity, enforcement and continued use of such rights;
• expansion of warranty and product support terms beyond those which have traditionally prevailed in the rail
supply industry;
• availability of a trained work force at a reasonable cost and with reasonable terms of employment;
• availability and/or price of essential raw materials, specialties or components, including steel castings, to
permit manufacture of units on order;
• failure to successfully integrate joint ventures or acquired businesses;
• discovery of previously unknown liabilities associated with acquired businesses;
• failure of or delay in implementing and using new software or other technologies;
• the impact of cybersecurity risks and the costs of mitigating and responding to a data security breach;
• ability to replace maturing lease and management services revenue and earnings with revenue and earnings
from new commercial transactions, including new railcar leases, additions to the lease fleet and new
management services contracts;
• credit limitations upon our ability to maintain effective hedging programs;
• financial impacts from currency fluctuations and currency hedging activities in our worldwide operations;
• increased costs or other impacts due to changes in legislation, regulations or accounting pronouncements; and
• fraud, misconduct by employees and potential exposure to liabilities under the Foreign Corrupt Practices Act
and other anti-corruption laws and regulations.
Any forward-looking statements should be considered in light of these factors. Words such as “anticipates,”
“believes,” “forecast,” “potential,” “goal,” “contemplates,” “expects,” “intends,” “plans,” “projects,”
“hopes,” “seeks,” “estimates,” “could,” “would,” “will,” “may,” “can,” “designed to,” “foreseeable future” and
similar expressions identify forward-looking statements. These forward-looking statements are not guarantees of
future performance and are subject to risks and uncertainties that could cause actual results to differ materially
from the results contemplated by the forward-looking statements. Many of the important factors that will
determine these results and values are beyond our ability to control or predict. You are cautioned not to put
undue reliance on any forward-looking statements. Except as otherwise required by law, we do not assume any
obligation to update any forward-looking statements.
2 T h e G r e e n b r i e r C o m p a n i e s 2 0 1 6 A n n u a l R e p o r t
In assessing forward-looking statements contained herein, readers are urged to read carefully all cautionary
statements contained in this Form 10-K, including, without limitation, those contained under the heading, “Risk
Factors,” contained in Part I, Item 1A of this Form 10-K.
All references to years refer to the fiscal years ended August 31st unless otherwise noted.
The Greenbrier Companies is a registered trademark of The Greenbrier Companies, Inc. Gunderson, Maxi-Stack,
Auto-Max and YSD are registered trademarks of Gunderson LLC.
T h e G r e e n b r i e r C o m p a n i e s 2 0 1 6 A n n u a l R e p o r t 3

PART I
Item 1. BUSINESS
Introduction
We are one of the leading designers, manufacturers and marketers of railroad freight car equipment in North
America and Europe. We manufacture railcars in Brazil through a strategic investment and are a manufacturer
and marketer of marine barges in North America. Recently through our European manufacturing operations, we
also began delivery of railcars for the Saudi Arabian market. We are a leading provider of wheel services, parts,
leasing and other services to the railroad and related transportation industries in North America and a provider of
railcar repair, refurbishment and retrofitting services in North America through a joint venture partnership.
Through unconsolidated joint ventures we also produce rail castings, tank heads and other components.
We operate an integrated business model in North America that combines freight car manufacturing, wheel
services, repair, refurbishment, retrofitting, component parts, leasing and fleet management services. Our model
is designed to provide customers with a comprehensive set of freight car solutions utilizing our substantial
engineering, mechanical and technical capabilities as well as our experienced commercial personnel. This model
allows us to develop cross-selling opportunities and synergies among our various business segments and to
enhance our margins. We believe our integrated model is difficult to duplicate and provides greater value for our
customers.
We operate in four reportable segments: Manufacturing; Wheels & Parts; Leasing & Services; and GBW Joint
Venture. Financial information about our business segments as well as geographic information is located in Note
19 Segment Information to our Consolidated Financial Statements.
The Greenbrier Companies, Inc., which was incorporated in Delaware in 1981, consummated a merger on
February 28, 2006 with its affiliate, Greenbrier Oregon, Inc., an Oregon corporation, for the sole purpose of
changing its state of incorporation from Delaware to Oregon. Greenbrier Oregon survived the merger and
assumed the name, The Greenbrier Companies, Inc. Our principal executive offices are located at One
Centerpointe Drive, Suite 200, Lake Oswego, Oregon 97035, our telephone number is (503) 684-7000 and our
Internet website is located at http://www.gbrx.com.
Products and Services
Manufacturing
North American Railcar Manufacturing - We manufacture a broad array of railcar types in North America,
which includes most railcar types other than coal cars. We have demonstrated an ability to capture high market
shares in many of the car types we produce. The primary products we produce for the North American market
are:
Intermodal Railcars – We manufacture a comprehensive range of intermodal railcars. Our most important
intermodal product is our articulated double-stack railcar. The double-stack railcar is designed to transport
containers stacked two-high on a single platform and provides significant operating and capital savings over
other types of intermodal railcars.
Tank Cars – We produce a variety of tank cars, including both general and certain pressurized tank cars, which
are designed for the transportation of products such as crude oil, ethanol, liquefied petroleum gas, caustic soda,
urea ammonium nitrate, vegetable oils, bio-diesel and various other products and we continue to expand our
product lines.
Automotive – We manufacture a full line of railcar equipment specifically designed for the transportation of
automotive products. Our automotive offerings include our proprietary Auto-Max railcar, Multi-Max auto rack
and flat cars for automotive transportation.
4 T h e G r e e n b r i e r C o m p a n i e s 2 0 1 6 A n n u a l R e p o r t

Conventional Railcars - We produce a wide range of boxcars, which are used in the transport of forest products,
perishables, general merchandise and commodities. We also produce a variety of covered hopper cars for the
grain, fertilizer, sand, cement and petrochemical industries as well as gondolas for the steel, metals and aggregate
markets and various other conventional railcar types. Our flat car products include center partition cars for the
forest products industry, bulkhead flat cars and solid waste service flat cars.
European Railcar Manufacturing - Our European manufacturing operation produces a variety of tank,
automotive and conventional freight railcar (wagon) types, including a comprehensive line of pressurized tank
cars for liquid petroleum gas and ammonia and non-pressurized tank cars for light oil, chemicals and other
products. In addition, we produce flat cars, coil cars for the steel and metals market, coal cars, gondolas, sliding
wall cars and automobile transporter cars for both the continental European and United Kingdom markets. In
2016, we began production of tank cars to support industrial mining operations for the Saudi Arabian market for
delivery beginning in 2017.
Marine Vessel Fabrication - Our Portland, Oregon manufacturing facility, located on a deep-water port on the
Willamette River, includes marine vessel fabrication capabilities. The marine facilities also increase utilization of
steel plate burning and fabrication capacity providing flexibility for railcar production. United States (U.S.)
coastwise law, commonly referred to as the Jones Act, requires all commercial vessels transporting merchandise
between ports in the U.S. to be built, owned, operated and manned by U.S. citizens and to be registered under the
U.S. flag. We manufacture a broad range of Jones Act ocean-going and river barges for transporting merchandise
between ports within the U.S. including conventional deck barges, double-hull tank barges, railcar/deck barges,
barges for aggregates and other heavy industrial products and dump barges. Our primary focus is on the larger
ocean-going vessels although the facility has the capability to compete in other marine-related products.
Wheels & Parts
Wheel Services and Component Parts Manufacturing - We operate a large wheel services and component parts
network in North America. Our wheel shops, operating in ten locations, provide complete wheel services
including reconditioning of wheels and axles in addition to new axle machining and finishing and axle
downsizing. Our component parts facilities, operating in four locations, recondition and manufacture railcar
cushioning units, couplers, yokes, side frames, bolsters and various other parts. We also produce roofs, doors and
associated parts for boxcars.
GBW Joint Venture
Railcar Repair, Refurbishment, Maintenance and Retrofitting - GBW Railcar Services LLC (GBW), an
unconsolidated 50/50 joint venture, became our fourth reportable segment (GBW Joint Venture) upon formation
in July 2014. The results of GBW are included as part of Earnings (loss) from unconsolidated affiliates as we
account for our interest in GBW under the equity method of accounting. GBW operates the largest independent
railcar repair shop network in North America consisting of over 30 Repair shops including more than 10 tank car
repair shops certified by the Association of American Railroads (AAR). This network of Repair shops performs
heavy railcar repair and refurbishment, as well as routine railcar maintenance for third parties, as well as for our
leased and managed fleet.
Leasing & Services
Leasing - Our relationships with financial institutions, combined with our ownership of a lease fleet of
approximately 8,900 railcars (6,600 railcars held as equipment on operating leases, 2,200 held as leased railcars
for syndication and 100 held as finished goods inventory), enables us to offer flexible financing programs
including operating leases and “by the mile” leases to our customers. In addition, we frequently originate leases
of railcars, which are either newly built or refurbished by us, or buy railcars from the secondary market, and sell
the railcars and attached leases to financial institutions and subsequently provide such institutions with
management services under multi-year agreements. As an equipment owner and an originator of leases, we
participate principally in the operating lease segment of the market. The majority of our leases are “full service”
leases whereby we are responsible for maintenance and administration. Maintenance of the fleet is provided, in
T h e G r e e n b r i e r C o m p a n i e s 2 0 1 6 A n n u a l R e p o r t 5

part, through GBW. Assets from our owned lease fleet are periodically sold to take advantage of market
conditions, manage risk and maintain liquidity.
Management Services - Our management services business offers a broad array of software and services that
include railcar maintenance management, railcar accounting services (such as billing and revenue collection, car
hire receivable and payable administration), total fleet management (including railcar tracking using proprietary
software), administration and railcar remarketing. We currently own or provide management services for a fleet
of approximately 273,000 railcars for railroads, shippers, carriers, institutional investors and other leasing and
transportation companies in North America. In 2017, we formed our Regulatory Services Group which offers
regulatory, engineering, process consulting and advocacy support to the tank car and petrochemical rail shipper
community, among other services.
Fleet Profile (1)
As of August 31, 2016
OwnedUnits (2)
ManagedUnits
TotalUnits
Customer Profile:
Leasing Companies 68 113,736 113,804
Class I Railroads 1,922 97,311 99,233
Shipping Companies 4,645 39,136 43,781
Non-Class I Railroads 915 13,981 14,896
En route to Customer Location 426 2 428
Off-lease 973 – 973
Total Units 8,949 264,166 273,115
(1) Each platform of a railcar is treated as a separate unit.(2) The percentage of owned units on lease excluding newly manufactured railcars not yet on lease and a recent railcar portfolio acquisition
was 91.0% at August 31, 2016 with an average remaining lease term of 2.5 years. The average age of owned units is 13 years.
Backlog
Subsequent to August 31, 2016, we reached agreements to restructure certain railcar contracts for favorable
financial and other considerations resulting in a reduction of approximately 1,200 units. The adjustment is
reflected as of August 31, 2016. The following table depicts our reported third party railcar backlog in number of
railcars and estimated future revenue value attributable to such backlog, at the dates shown:
August 31,
2016 2015 2014
New railcar backlog units (1) 27,500 41,300 31,500
Estimated future revenue value (in millions) (2) $ 3,190 $ 4,710 $ 3,330(1) Each platform of a railcar is treated as a separate unit.(2) Subject to change based on finalization of product mix.
Our total manufacturing backlog of railcar units as of August 31, 2016 included 23,500 units for direct sales,
3,700 units intended for syndications to third parties with a lease attached and 300 units intended to be placed
into our owned lease fleet.
Based on current production schedules, approximately 12,000 units in the August 31, 2016 backlog are scheduled
for delivery in 2017. The balance of the production is scheduled for delivery in 2018 and beyond. Multi-year
supply agreements are a part of rail industry practice. A portion of the orders included in backlog reflects an
assumed product mix. Under terms of the orders, the exact mix will be determined in the future, which may
impact the dollar amount of backlog. Marine backlog as of August 31, 2016 was $114 million compared to $52
million as of August 31, 2015.
Our backlog of railcar units and marine vessels is not necessarily indicative of future results of operations.
Certain orders in backlog are subject to customary documentation and completion of terms. Customer orders
6 T h e G r e e n b r i e r C o m p a n i e s 2 0 1 6 A n n u a l R e p o r t

contain terms and conditions customary in the industry. Customers may attempt to cancel or modify orders in
backlog. Historically, little variation has been experienced between the quantity ordered and the quantity actually
delivered, though the timing of deliveries has been modified from time to time. Backlog as of August 31, 2016
includes an aggregate of 3,800 covered hopper railcars for use in energy related sand transportation; customers
may seek to cancel, settle or modify a portion of these railcars. We cannot guarantee that our reported railcar
backlog will convert to revenue in any particular period, if at all.
Customers
Our customers include railroads, leasing companies, financial institutions, shippers, carriers and transportation
companies. We have strong, long-term relationships with many of our customers. We believe that our customers’
preference for high quality products, our technological leadership in developing innovative products and
competitive pricing of our railcars have helped us maintain our long-standing relationships with our customers.
In 2016, revenue from two customers, TTX Company (TTX) and CIT Group Inc. (CIT), accounted for
approximately 31% of total revenue, 38% of Manufacturing revenue and 14% of Wheels & Parts revenue. No
other customers accounted for greater than 10% of total revenue.
Raw Materials and Components
Our products require a supply of materials including steel and specialty components such as brakes, wheels and
axles. Specialty components purchased from third parties represent a significant amount of the cost of most
freight cars. Our customers often specify particular components and suppliers of such components. Although the
number of alternative suppliers of certain specialty components has declined in recent years, there are at least two
suppliers for these components.
Certain materials and components are periodically in short supply which could potentially impact production at
our new railcar and refurbishment facilities. In an effort to mitigate shortages and reduce supply chain costs, we
have entered into strategic alliances and multi-year arrangements for the global sourcing of certain materials and
components, we operate a replacement parts business and we continue to pursue strategic opportunities to protect
and enhance our supply chain. We periodically make advance purchases to avoid possible shortages of material
due to capacity limitations of component suppliers, shipping and transportation delays and possible price
increases.
In 2016, the top ten suppliers for all inventory purchases accounted for approximately 46% of total purchases.
Amsted Rail Company, Inc. accounted for 21% of total inventory purchases in 2016. No other suppliers
accounted for more than 10% of total inventory purchases. The Company believes it maintains good relationships
with its suppliers.
Competition
There are currently six major railcar manufacturers competing in North America. In addition, a number of small
manufacturers have recently entered the market. We believe that in Europe we are in the top tier of railcar
manufacturers. European freight car manufacturers are largely located in central and eastern Europe where labor
rates are lower and work rules are more flexible. In all railcar markets, we compete on the basis of quality, price,
reliability of delivery, product design and innovation, reputation and customer service and support.
Competition in the marine industry is dependent on the type of product produced. There are two principal
competitors that build product types similar to ours. We compete on the basis of experienced labor, launch ways
capacity, quality, price and reliability of delivery.
Competition in the wheels & parts and repair businesses is dependent on the type of product or service provided.
There are many competitors in the railcar repair and refurbishment business and an increasing number of
competitors in the wheel services and other parts businesses. We compete primarily on the basis of quality,
timeliness of delivery, customer service, location of shops, price and engineering expertise.
T h e G r e e n b r i e r C o m p a n i e s 2 0 1 6 A n n u a l R e p o r t 7

There are at least twenty institutions that provide railcar leasing and services similar to ours. Many of them are
also customers that buy new railcars from our manufacturing facilities and used railcars from our lease fleet, as
well as utilize our management services. Many of these institutions have greater resources than we do on our own
balance sheet. We compete primarily on the basis of quality, price, delivery, reputation, service offerings and
deal structuring and syndication ability. We believe our strong servicing capability and our ability to sell railcars
with a lease attached (syndicate railcars), integrated with our manufacturing, repair shops, railcar specialization
and expertise in particular lease structures provide a strong competitive position.
Marketing and Product Development
In North America, we use an integrated marketing and sales effort to coordinate relationships in our various
segments. We provide our customers with a diverse range of equipment and financing alternatives designed to
satisfy each customer’s unique needs, whether the customer is buying new equipment, refurbishing existing
equipment or seeking to outsource the maintenance or management of equipment. These custom programs may
involve a combination of railcar products, leasing, refurbishing and remarketing services. In addition, we provide
customized maintenance management, equipment management, accounting and compliance services and
proprietary software solutions.
Outside of North America, we maintain relationships with customers through country-specific sales personnel.
Our engineering and technical staff works closely with their customer counterparts on the design and certification
of railcars. Many European railroads are state-owned and are subject to European Union (EU) regulations
covering the tender of government contracts.
Through our customer relationships, insights are derived into the potential need for new products and services.
Marketing and engineering personnel collaborate to evaluate opportunities and develop new products and
features. For example, we continue to expand our tank car and covered hopper product offerings in North
America. Research and development costs incurred during the years ended August 31, 2016, 2015 and 2014 were
$2.7 million, $2.5 million and $3.6 million.
Patents and Trademarks
We have a number of U.S. and non-U.S. patents of varying duration, and pending patent applications, registered
trademarks, copyrights and trade names that are important to our products and product development efforts. The
protection of our intellectual property is important to our business and we have a proactive program aimed at
protecting our intellectual property and the results from our research and development.
Environmental Matters
We are subject to national, state and local environmental laws and regulations concerning, among other matters,
air emissions, wastewater discharge, solid and hazardous waste disposal and employee health and safety. Prior to
acquiring facilities, we usually conduct investigations to evaluate the environmental condition of subject
properties and may negotiate contractual terms for allocation of environmental exposure arising from prior uses.
We operate our facilities in a manner designed to maintain compliance with applicable environmental laws and
regulations. Environmental studies have been conducted on certain of our owned and leased properties that
indicate additional investigation and some remediation on certain properties may be necessary.
Our Portland, Oregon manufacturing facility is located adjacent to the Willamette River. We have entered into a
Voluntary Clean-up Agreement with the Oregon Department of Environmental Quality (DEQ) in which we
agreed to conduct an investigation of whether, and to what extent, past or present operations at the Portland
property may have released hazardous substances to the environment. We are also conducting groundwater
remediation relating to a historical spill on the property that preceded our ownership.
Portland Harbor Site
In December 2000, the U.S. Environmental Protection Agency (EPA) classified portions of the Willamette River
bed known as the Portland Harbor, including the portion fronting our manufacturing facility, as a federal
8 T h e G r e e n b r i e r C o m p a n i e s 2 0 1 6 A n n u a l R e p o r t

“National Priority List” or “Superfund” site due to sediment contamination (the Portland Harbor Site). We and
more than 140 other parties have received a “General Notice” of potential liability from the EPA relating to the
Portland Harbor Site. The letter advised us that we may be liable for the costs of investigation and remediation
(which liability may be joint and several with other potentially responsible parties) as well as for natural resource
damages resulting from releases of hazardous substances to the site. At this time, ten private and public entities,
including us (the Lower Willamette Group or LWG), have signed an Administrative Order on Consent (AOC) to
perform a remedial investigation/feasibility study (RI/FS) of the Portland Harbor Site under EPA oversight, and
several additional entities have not signed such consent, but are nevertheless contributing money to the effort.
The EPA-mandated RI/FS is being produced by the LWG and has cost over $110 million during a 15-year
period. We have agreed to initially bear a percentage of the total costs incurred by the LWG in connection with
the investigation. Our aggregate expenditure has not been material during the 15-year period. Some or all of any
such outlay may be recoverable from other responsible parties.
Eighty-three parties, including the State of Oregon and the federal government, have entered into a non-judicial
mediation process to try to allocate costs associated with the Portland Harbor site. Approximately 110 additional
parties have signed tolling agreements related to such allocations. On April 23, 2009, we and the other AOC
signatories filed suit against 69 other parties due to a possible limitations period for some such claims; Arkema
Inc. et al v. A & C Foundry Products, Inc. et al, U.S. District Court, District of Oregon, Case #3:09-cv-453-PK.
All but 12 of these parties elected to sign tolling agreements and be dismissed without prejudice, and the case has
now been stayed by the court, pending the EPA’s Record of Decision, currently scheduled by the EPA for
December 31, 2016.
On June 8, 2016, the EPA issued its Feasibility Study (FS) and Proposed Plan for the Portland Harbor Site. The
EPA accepted comments from the public on its Proposed Plan through September 6, 2016. The EPA’s FS
includes remediation alternatives that would take from 4 to 62 years of active remediation, with an estimated
undiscounted cost ranging from $642 million to $10.2 billion and a net present value assuming a 7% discount
rate ranging between $451 million and $9.4 billion. The Proposed Plan identifies the alternative currently favored
by the EPA, which it assigns an estimated undiscounted cost of between $1.1 and $1.2 billion and a net present
value of between $746 and $811 million. The EPA expects its cost estimates to be accurate within a range of +50
to -30 percent. EPA estimates that the remedy in the Proposed Plan would take 7 years of active remediation
followed by 30 years of monitoring. The EPA’s FS and its Proposed Plan identify 13 Sediment Decision Units.
One of the units, RM9W, includes the nearshore area of the river sediments offshore of our Portland, Oregon
manufacturing facility as well as upstream and downstream of the facility. It also includes a portion of our
riverbank. Neither the FS nor the Proposed Plan breaks down total remediation costs by unit.
Neither the EPA’s FS nor its Proposed Plan addresses responsibility for the costs of clean-up, allocates such costs
among the potentially responsible parties, or defines precise boundaries for the cleanup. Responsibility for
funding and implementing the EPA’s selected cleanup option will be determined after the issuance of the Record
of Decision, currently scheduled by the EPA for December 31, 2016. Based on the investigation to date, we
believe that we did not contribute in any material way to contamination in the river sediments or the damage of
natural resources in the Portland Harbor Site and that the damage in the area of the Portland Harbor Site adjacent
to our property precedes its ownership of the Portland, Oregon manufacturing facility. Because these
environmental investigations are still underway, sufficient information is currently not available to determine our
liability, if any, for the cost of any required remediation or restoration of the Portland Harbor Site or to estimate a
range of potential loss. Based on the results of the pending investigations and future assessments of natural
resource damages, we may be required to incur costs associated with additional phases of investigation or
remedial action, and may be liable for damages to natural resources. In addition, we may be required to perform
periodic maintenance dredging in order to continue to launch vessels from its launch ways in Portland, Oregon,
on the Willamette River, and the river’s classification as a Superfund site could result in some limitations on
future dredging and launch activities. Any of these matters could adversely affect our business and Consolidated
Financial Statements, or the value of our Portland property.
We have also signed an Order on Consent with the DEQ to finalize the investigation of potential onsite sources
of contamination that may have a release pathway to the Willamette River. Interim precautionary measures are
also required in the order and we are currently discussing with the DEQ potential remedial actions which may be
T h e G r e e n b r i e r C o m p a n i e s 2 0 1 6 A n n u a l R e p o r t 9

required. Our aggregate expenditure has not been material, however we could incur significant expenses for
remediation. Some or all of any such outlay may be recoverable from other responsible parties.
Regulation
The Federal Railroad Administration in the U.S. and Transport Canada in Canada administer and enforce laws
and regulations relating to railroad safety. These regulations govern equipment and safety appliance standards for
freight cars and other rail equipment used in interstate commerce. The AAR promulgates a wide variety of rules
and regulations governing the safety and design of equipment, relationships among railroads and other railcar
owners with respect to railcars in interchange, and other matters. The AAR also certifies railcar builders and
component manufacturers that provide equipment for use on North American railroads. These regulations require
us to maintain our certifications with the AAR as a railcar builder, repair and service provider and component
manufacturer, and products sold and leased by us in North America must meet AAR, Transport Canada, and
Federal Railroad Administration standards.
The primary regulatory and industry authorities involved in the regulation of the ocean-going barge industry are
the U.S. Coast Guard, the Maritime Administration of the U.S. Department of Transportation, and private
industry organizations such as the American Bureau of Shipping.
The regulatory environment in Europe consists of a combination of EU regulations and country specific
regulations, including a harmonized set of Technical Standards for Interoperability of freight wagons throughout
the EU.
Tank Car Regulation
On May 1, 2015 the U.S. Department of Transportation’s Pipeline and Hazardous Materials Safety
Administration (PHMSA) released new regulations related to new railcar manufacturing and retrofitting
modification standards for tank cars in flammable liquids service (the PHMSA Rules). In December 2015, the
U.S. Congress passed the Fixing America’s Surface Transportation Act (FAST Act), which changed certain
requirements of the PHMSA Rules. Under the PHMSA Rules as amended by the FAST Act, the deadlines for
modifying or removing existing tank cars from flammables service currently range from January 2018 to May
2029, depending on the type of car and the type of commodity carried. Transport Canada, separately and
concurrent with PHMSA, issued final rules on May 1, 2015, establishing new design standards for tank cars
carrying flammable liquids in Canada. On July 25, 2016, Transport Canada announced that certain older tank
cars, commonly referred to as “DOT 111” tank cars, must be removed from crude oil service effective
October 31, 2016.
These regulatory changes, along with prevailing market conditions, could materially affect new tank railcar
manufacturing and retrofitting activities industry-wide, and activities related to ownership and management of
tank cars, including negative impacts to customer demand for products and services offered by Greenbrier and its
related entities.
Employees
As of August 31, 2016, we had 9,418 full-time employees, consisting of 8,635 employees in Manufacturing, 545
in Wheels & Parts and 238 employees in Leasing & Services and corporate. In Manufacturing, 5,092 employees,
all of whom are located in Mexico and Poland, are represented by unions. At our Wheels & Parts locations, 19
employees are represented by a union. We believe that our relations with our employees are generally good.
10 T h e G r e e n b r i e r C o m p a n i e s 2 0 1 6 A n n u a l R e p o r t

Additional Information
We are a reporting company and file annual, quarterly, current and special reports, proxy statements and other
information with the Securities and Exchange Commission (SEC). Through a link on the Investor Relations
section of our website, http://www.gbrx.com, we make available the following filings as soon as reasonably
practicable after they are electronically filed with or furnished to the SEC: our Annual Report on Form 10-K;
Quarterly Reports on Form 10-Q; Current Reports on Form 8-K; and any amendments to those reports filed or
furnished pursuant to Section 13(a) or 15(d) of the Securities Exchange Act of 1934, as amended. All such filings
are available free of charge. Copies of our Audit Committee Charter, Compensation Committee Charter,
Nominating and Corporate Governance Committee Charter and the Company’s Corporate Governance
Guidelines are also available on our web site at http://www.gbrx.com. In addition, each of the reports and
documents listed above are available free of charge by contacting our Investor Relations Department at The
Greenbrier Companies, Inc., One Centerpointe Drive, Suite 200, Lake Oswego, Oregon 97035.
T h e G r e e n b r i e r C o m p a n i e s 2 0 1 6 A n n u a l R e p o r t 11

Item 1A. RISK FACTORS
In addition to the risks outlined in this annual report under the heading “Forward-Looking Statements,” as well as
other comments included herein regarding risks and uncertainties, the following risk factors should be carefully
considered when evaluating our company. Our business, financial condition or financial results could be
materially and adversely affected by any of these risks.
During economic downturns or a rising interest rate environment, the cyclical nature of our business results
in lower demand for our products and services and reduced revenue.
Our business is cyclical. Overall economic conditions and the purchasing practices of buyers have a significant
effect upon our business due to the impact on demand for our products and services. As a result, during
downturns, we could operate with a lower level of backlog and may slow down or halt production at some or all
of our facilities. Economic conditions that result in higher interest rates increase the cost of new leasing
arrangements, which could cause some of our leasing customers to lease fewer of our railcars or demand shorter
lease terms. An economic downturn or increase in interest rates may reduce demand for our products and
services, resulting in lower sales volumes, lower prices, lower lease utilization rates and decreased profits.
Currently, interest rates remain at historically low levels. Higher interest rates could increase the cost of, or
potentially deter, new leasing arrangements with our customers, reduce our ability to syndicate railcars under
lease to financial institutions, or impact the sales price we may receive on such syndications, any of which could
materially adversely affect our business, financial condition and results of operations.
A change in our product mix due to shifts in demand could have an adverse effect on our profitability.
We manufacture and, through GBW, repair a variety of railcars. The demand for specific types of these railcars
and mix of refurbishment work varies from time to time. These shifts in demand could affect our revenue and
margins and could have an adverse effect on our profitability.
A prolonged decline in performance of the rail freight industry would have an adverse effect on our financial
condition and results of operations.
Our future success depends in part upon the performance of the rail freight industry, which in turn depends on the
health of the economy. If railcar loadings, railcar and railcar components replacement rates or refurbishment
rates or industry demand for our railcar products weaken or otherwise do not materialize, if railcar transportation
becomes more efficient from an increase in velocity or a decrease in dwell times, or if the rail freight industry
becomes oversupplied, our financial condition and results of operations would be adversely affected.
Our backlog is not necessarily indicative of the level of our future revenues.
Our manufacturing backlog represents future production for which we have written orders from our customers in
various periods, and estimated potential revenue attributable to those orders. Some of this backlog is subject to
certain conditions, including potential adjustment to prices due to changes in prevailing market prices, or due to
lower prices for new orders accepted by us from other customers for similar cars on similar terms and conditions
during relevant time periods. Our reported backlog may not be converted to revenue in any particular period and
some of our contracts permit cancellations with limited compensation that would not replace lost revenue or
margins. In addition, some customers may attempt to cancel or modify a contract even if the contract does not
allow for such cancellation or modification, and we may not be able to recover all revenue or earnings lost due to
a breach of contract. The likelihood of attempted cancellations or modifications of contracts generally increases
during periods of market weakness. Actual revenue from such contracts may not equal our anticipated revenues
based on our backlog, and therefore, our backlog is not necessarily indicative of the level of our future revenues.
A portion of our backlog and Leased railcars for syndication relates to the energy sector. A decline in energy
prices could negatively impact the creditworthiness of our customers, lead to attempted modifications or
12 T h e G r e e n b r i e r C o m p a n i e s 2 0 1 6 A n n u a l R e p o r t

cancellations of contracts or negatively impact our ability to syndicate our railcars, all of which could materially
adversely affect our business, financial condition and results of operations. Backlog as of August 31, 2016
includes an aggregate of 3,800 covered hopper railcars for use in energy related sand transportation; customers
may seek to cancel, settle or modify a portion of these railcars. We cannot guarantee that our reported railcar
backlog will convert to revenue in any particular period, if at all.
We derive a significant amount of our revenue from a limited number of customers, the loss of or reduction of
business from one or more of which could have an adverse effect on our business.
A significant portion of our revenue is generated from a few major customers. Although we have some long-term
contractual relationships with our major customers, we cannot be assured that our customers will continue to use
our products or services or that they will continue to do so at historical levels. A reduction in the purchase or
leasing of our products or a termination of our services by one or more of our major customers could have an
adverse effect on our business and operating results.
We could be unable to lease railcars at satisfactory rates, remarket leased railcars on favorable terms upon
lease termination or realize the expected residual values upon lease termination, which could reduce our
revenue and decrease our overall return or effect our ability to sell leased assets in the future.
The profitability of our railcar leasing business depends on our ability to lease railcars to our customers at
satisfactory rates, and to re-market or sell railcars we own or manage upon the expiration of existing lease terms.
The total rental payments we receive under our operating leases do not fully amortize the acquisition costs of the
leased equipment, which exposes us to risks associated with remarketing the railcars. Our ability to lease or
remarket leased railcars profitably is dependent upon several factors, including, but not limited to, market and
industry conditions, cost of and demand for competing used or newer models, costs associated with the
refurbishment of the railcars, market demand or governmental mandate for refurbishment, and interest rates. A
downturn in the industries in which our lessees operate and decreased demand for railcars could also increase our
exposure to re-marketing risk because lessees may demand shorter lease terms, requiring us to re-market leased
railcars more frequently. Furthermore, the resale market for previously leased railcars has a limited number of
potential buyers. From 2014 to 2016, the percentage of railcars in the fleet on lease has declined from
approximately 98% to 91%. Our inability to lease, re-market or sell leased railcars on favorable terms could
result in reduced revenues and margins or net gain on disposition of equipment and decrease our overall returns
and affect our ability to syndicate railcars to investors.
Risks related to our operations outside of the U.S. could adversely affect our operating results.
Our current operations outside of the U.S. and any future expansion of our international operations are subject to
the risks associated with cross-border business transactions and activities. Political, legal, trade, financial market
or economic changes or instability could limit or curtail our foreign business activities and operations. Some
foreign countries in which we operate or may operate have regulatory authorities that regulate railroad safety,
railcar design and railcar component part design, performance and manufacturing. If we fail to obtain and
maintain certifications of our railcars and railcar parts within the various foreign countries where we operate or
may operate, we may be unable to market and sell our railcars in those countries. In addition, unexpected changes
in regulatory requirements, tariffs and other trade barriers, more stringent rules relating to labor or the
environment, adverse tax consequences and currency and price exchange controls could limit operations and
make the manufacture and distribution of our products difficult. The uncertainty of the legal environment or geo-
political risks in these and other areas could limit our ability to enforce our rights effectively. Because we have
operations outside the U.S., we could be adversely affected by violations of the U.S. Foreign Corrupt Practices
Act and similar worldwide anti-corruption laws. We operate in parts of the world that have experienced
governmental corruption to some degree, and in certain circumstances, strict compliance with anti-corruption
laws may conflict with local customs and practices. The failure to comply with laws governing international
business practices may result in substantial penalties and fines. Any international expansion or acquisition that
we undertake could amplify these risks related to operating outside of the U.S.
T h e G r e e n b r i e r C o m p a n i e s 2 0 1 6 A n n u a l R e p o r t 13

In addition, in 2015, we began to establish a presence in the GCC region and Latin America and are exploring
market opportunities in Eastern Europe and other emerging markets. Our development of customer relationships
in these areas may expose us to certain additional risks, including, but not limited to, the following:
• Ongoing instability or changes in a country’s or region’s economic or political conditions, including inflation,
recession, currency fluctuations and actual or anticipated civil and political unrest, terrorist actions, armed
hostilities, kidnapping and extortion;
• Longer payment cycles and difficulty in collecting accounts receivable;
• Sovereign risk related to international governments that include, but may not be limited to, governments
stopping payments or repudiating their contracts, nationalizing private businesses and assets or altering
foreign exchange regulations;
• Renegotiation or nullification of existing contracts;
• An inability to effectively protect intellectual property;
• Uncertainties arising from local business practices, cultural considerations and international political and
trade tensions; and
• Our limited knowledge of this market or our inability to protect our interests.
If we are unable to successfully manage the risks associated with our global business, our results of operations,
financial condition, liquidity and cash flows may be negatively impacted.
We may pursue strategic opportunities, including new joint ventures, acquisitions and new business endeavors
that involve inherent risks, any of which may cause us not to realize anticipated benefits and we could have
difficulty integrating the operations of any companies that we acquire or joint ventures we enter into, which
could adversely affect our results of operations.
We may not be able to successfully identify suitable joint venture, acquisition and new business endeavors or
complete these transactions on acceptable terms. Our identification of suitable joint venture opportunities,
acquisition candidates and new business endeavors involve risks inherent in assessing the values, strengths,
weaknesses, risks and profitability of these opportunities. Our failure to identify suitable joint ventures,
acquisition opportunities and new business endeavors may restrict our ability to grow our business. If we are
successful in pursuing such opportunities, we may be required to expend significant funds or incur additional
debt, which could materially adversely affect our results of operations and limit our ability to obtain financing for
working capital or other purposes and we may be more vulnerable to economic downturns and competitive
pressures.
The success of our acquisition and joint venture strategy depends upon our ability to successfully complete
acquisitions, to enter into joint ventures and integrate any businesses that we acquire into our existing business.
The integration of acquired business operations could disrupt our business by causing unforeseen operating
difficulties, diverting management’s attention from day-to-day operations and requiring significant financial
resources that would otherwise be used for the ongoing development of our business. The difficulties of
integration could be increased by the necessity of coordinating geographically dispersed organizations,
integrating personnel with disparate business backgrounds and combining different corporate cultures. Each of
these circumstances could be more likely to occur or more severe in consequence in the case of an acquisition or
joint venture involving a business that is outside of our core areas of expertise. In addition, we could be unable to
retain key employees or customers of the combined businesses. We could face integration issues pertaining to the
internal controls, information systems and operational functions of the acquired companies and we also could fail
to realize cost efficiencies or synergies that we anticipated when selecting our acquisition candidates and joint
ventures. Any of these items could adversely affect our results of operations.
Our relationships with our joint venture and alliance partners could be unsuccessful, which could adversely
affect our business.
We have entered into several joint venture agreements and other alliances with other companies to increase our
sourcing alternatives, reduce costs, to produce new railcars and repair and retrofit railcars. We may seek to
14 T h e G r e e n b r i e r C o m p a n i e s 2 0 1 6 A n n u a l R e p o r t

expand our relationships or enter into new agreements with other companies. If our joint venture or alliance
partners are unable to fulfill their contractual obligations or if these relationships are otherwise not successful in
the future, our manufacturing and other costs could increase, we could encounter production disruptions, growth
opportunities could fail to materialize, or we could be required to fund such joint venture or alliances in amounts
significantly greater than initially anticipated, any of which could adversely affect our business.
If any of our joint ventures generate significant losses, including future potential intangible asset or goodwill
impairment charges, it could adversely affect our results of operations or cause our investment to be impaired.
We have potential exposure to environmental liabilities, which could increase costs or have an adverse effect
on results of operations.
We are subject to extensive national, state, provincial and local environmental laws and regulations concerning,
among other things, air emissions, water discharge, solid waste and hazardous substances handling and disposal
and employee health and safety. These laws and regulations are complex and frequently change. We could incur
unexpected costs, penalties and other civil and criminal liability if we fail to comply with environmental laws or
permits issued to us pursuant to those laws. We also could incur costs or liabilities related to off-site waste
disposal or remediating soil or groundwater contamination at our properties, including these set forth below and
in the “Environmental Matters” section of this Report. In addition, future environmental laws and regulations
may require significant capital expenditures or changes to our operations.
In addition to environmental, health and safety laws, the transportation of commodities by railcar raises potential
risks in the event of a derailment or other accident. Generally, liability under existing law in the U.S. and Canada
for accidents such as derailments depends on the negligence of the party. However, for certain hazardous
commodities being shipped, strict liability concepts may apply.
Our Portland, Oregon manufacturing facility is located adjacent to the Willamette River. We have entered into a
Voluntary Cleanup Agreement with the Oregon Department of Environmental Quality (DEQ) in which we
agreed to conduct an investigation of whether, and to what extent, past or present operations at the Portland
property may have released hazardous substances to the environment. We are also conducting groundwater
remediation relating to a historical spill on the property which preceded our ownership.
The U.S. Environmental Protection Agency (EPA) has classified portions of the river bed of the Portland Harbor,
including the portion fronting the Company’s manufacturing facility, as a federal “National Priority List” or
“Superfund” site due to sediment contamination (the Portland Harbor Site). We, along with more than 140 other
parties, have received a “General Notice” of potential liability from the EPA relating to the Portland Harbor Site.
The letter advised us that we may be liable for the costs of investigation and remediation (which liability may be
joint and several with other potentially responsible parties) as well as for natural resource damages resulting from
releases of hazardous substances to the site. We are part of a group that signed an Administrative Order on
Consent (AOC) to perform a remedial investigation/feasibility study (RI/FS) of the Portland Harbor Site under
EPA oversight, and several additional entities have not signed such consent, but are nevertheless contributing
money to the effort. We have agreed to initially bear a percentage of the total costs incurred in connection with
the investigation. We cannot provide assurance that any such costs will be recoverable from third parties.
On June 8, 2016, the EPA issued its Feasibility Study (FS) and Proposed Plan for the Portland Harbor Site. The
EPA accepted comments from the public on its Proposed Plan through September 6, 2016. The EPA’s FS
includes remediation alternatives that would take from 4 to 62 years of active remediation, with an estimated
undiscounted cost ranging from $642 million to $10.2 billion and a net present value assuming a 7% discount
rate ranging between $451 million and $9.4 billion. The Proposed Plan identifies the alternative currently favored
by the EPA, which it assigns an estimated undiscounted cost of between $1.1 and $1.2 billion and a net present
value of between $746 and $811 million. The EPA expects its cost estimates to be accurate within a range of +50
to -30 percent. The EPA estimates that the remedy in the Proposed Plan would take 7 years of active remediation
followed by 30 years of monitoring. The EPA’s FS and its Proposed Plan identify 13 Sediment Decision
Units. One of the units, RM9W, includes the nearshore area of the river sediments offshore of our Portland,
T h e G r e e n b r i e r C o m p a n i e s 2 0 1 6 A n n u a l R e p o r t 15
Oregon manufacturing facility as well as upstream and downstream of the facility. It also includes a portion of
our riverbank. Neither the FS nor the Proposed Plan breaks down total remediation costs by unit. Neither the
feasibility study nor the Proposed Plan addresses responsibility for the costs of clean-up or allocates such costs
among potentially responsible parties. Responsibility for funding and implementing the EPA’s selected cleanup
option will be determined after the issuance of the Record of Decision, which is scheduled for December 31,
2016.
We have also signed an Order on Consent with the DEQ to finalize the investigation of potential onsite sources
of contamination that may have a release pathway to the Willamette River. Interim precautionary measures are
also required in the order and we are currently discussing with the DEQ potential remedial actions which may be
required. Our aggregate expenditure has not been material during the 14-year period, however, we could incur
significant expenses for remediation. Some or all of any such outlay may be recoverable from other responsible
parties. However, we cannot assure that any such costs will be recoverable from third parties.
Because these environmental investigations are still underway, sufficient information is currently not available to
determine our liability, if any, for the cost of any required remediation of the Portland Harbor Site on our
adjacent land or to estimate a range of potential loss. Based on the results of the pending investigations and future
assessments of natural resource damages, we may be required to incur costs associated with additional phases of
investigation or remedial action, and may be liable for damages to natural resources. In addition, we may be
required to perform periodic maintenance dredging in order to continue to launch vessels from our launch ways
in Portland, Oregon, on the Willamette River, and the river’s classification as a Superfund site could result in
some limitations on future dredging and launch activities. Any of these matters could adversely affect our
business and Consolidated Financial Statements, or the value of our Portland property.
The timing of our asset sales and related revenue recognition could cause significant differences in our
quarterly results and liquidity.
We may build railcars or marine barges in anticipation of a customer order, or that are leased to a customer and
ultimately planned to be sold to a third party. The difference in timing of production and the ultimate sale is
subject to risk. In addition, we periodically sell railcars from our own lease fleet and the timing and volume of
such sales is difficult to predict. As a result, comparisons of our manufacturing revenue, deliveries, quarterly net
gain on disposition of equipment, income and liquidity between quarterly periods within one year and between
comparable periods in different years may not be meaningful and should not be relied upon as indicators of our
future performance.
We depend on our senior management team and other key employees, and significant attrition within our
management team or unsuccessful succession planning for members of our senior management team and
other key employees who are at or nearing retirement age, could adversely affect our business.
Our success depends in part on our ability to attract, retain and motivate senior management and other key
employees. Achieving this objective may be difficult due to many factors, including fluctuations in global
economic and industry conditions, competitors’ hiring practices, cost reduction activities, and the effectiveness of
our compensation programs. Competition for qualified personnel can be very intense. We must continue to
recruit, retain and motivate senior management and other key employees sufficient to maintain our current
business and support our future projects. We are vulnerable to attrition among our current senior management
team and other key employees. A loss of any such personnel, or the inability to recruit and retain qualified
personnel in the future, could have an adverse effect on our business, financial condition and results of
operations.
Many members of our senior management team and other key employees are at or nearing retirement age. If we
are unsuccessful in our succession planning efforts, the continuity of our business and results of operations could
be adversely affected.
16 T h e G r e e n b r i e r C o m p a n i e s 2 0 1 6 A n n u a l R e p o r t

The rail freight industry could become oversupplied and the use of railcars as a significant mode of
transporting freight could decline, become more efficient over time, experience a shift in types of modal
transportation, and/or certain railcar types could become obsolete.
The rail freight industry could become oversupplied due to overbuilding which could have a significant impact
on the demand for new railcars. In addition, if railcar transportation becomes more efficient from an increase in
velocity or a decrease in idle times coupled with lower freight volumes, some of which may be permanent due to
a reduction in coal volumes, this could significantly reduce the demand for our products and could adversely
affect our results of operations. As the freight transportation markets we serve continue to evolve and become
more efficient, the use of railcars may decline in favor of other more economic modes of transportation. Features
and functionality specific to certain railcar types could result in those railcars becoming obsolete as customer
requirements for freight delivery change. Our operations may be adversely impacted by changes in the preferred
method used by customers to ship their products or changes in demand for particular products. The industries in
which our customers operate are driven by dynamic market forces and trends, which are in turn influenced by
economic and political factors. Demand for our railcars may be significantly affected by changes in the markets
in which our customers operate. A significant reduction in customer demand for transportation or manufacture of
a particular product or change in the preferred method of transportation used by customers to ship their products
could result in the economic obsolescence of our railcars, including those leased by our customers.
We face aggressive competition by a concentrated group of competitors and a number of factors may
influence our performance. If we are unable to compete successfully, our market share, margin and results of
operations may be adversely affected.
We face aggressive competition by a concentrated group of competitors in all geographic markets and in each
area of our business. In addition, several companies have recently attempted to enter the market. The railcar
manufacturing and repair industry is intensely competitive and we expect it to remain so in the foreseeable
future. Competitive factors, including introduction of competitive products, new entrants into certain of our
markets, price pressures, limited customer base and the relative competitiveness of our manufacturing facilities
and products affect our ability to compete effectively. In addition, new technologies or the introduction of new
railcars or other product offerings by our competitors could render our products obsolete or less competitive. If
we do not compete successfully, our market share, margin and results of operation may be adversely affected.
A number of factors may influence our performance, including without limitation: fluctuations in the demand for
newly manufactured railcars or marine barges; fluctuations in demand for wheels, repair and parts; our ability to
adjust to the cyclical nature of the industries in which we operate; delays in receipt of orders, risks that contracts
may be canceled during their term or not renewed and that customers may not purchase the amount of products
or services under the contracts as anticipated; our customers may be financially unable to pay for products and
services already provided; domestic and global economic conditions including such matters as embargoes or
quotas; growth or reduction in the surface transportation industry; steel and specialty component price
fluctuations and availability, scrap surcharges, steel scrap prices and other commodity price fluctuations and their
impact on product demand and margin; loss of business from, or a decline in the financial condition of, any of the
principal customers that represent a significant portion of our total revenues; industry overcapacity and our
manufacturing capacity utilization; and other risks, uncertainties and factors. If we are unfavorably affected by
any of these factors, our market share, margin and results of operation may be adversely affected.
Changes in the credit markets and the financial services industry could negatively impact our business, results
of operations, financial condition or liquidity.
The credit markets and the financial services industry may experience volatility which can result in tighter
availability of credit on more restrictive terms and limit our ability to sell railcar assets. Our liquidity, financial
condition and results of operations could be negatively impacted if our ability to borrow money to finance
operations, obtain credit from trade creditors, offer leasing products to our customers or sell railcar assets were to
be impaired. In addition, scarcity of capital could also adversely affect our customers’ ability to purchase or pay
for products from us or our suppliers’ ability to provide us with product, either of which could negatively affect
our business and results of operations.
T h e G r e e n b r i e r C o m p a n i e s 2 0 1 6 A n n u a l R e p o r t 17

Exposure to fluctuations in commodity and energy prices may impact our results of operations.
Fluctuations in commodity and energy prices, including crude oil and gas prices, could negatively impact the
activities of our customers resulting in a corresponding adverse effect on the demand for our products and
services. These shifts in demand could affect our results of operations and could have an adverse effect on our
profitability. Demand for railcars that are used to transport crude oil and other energy related products is
dependent on the demand for these commodities. Prices for oil and gas are subject to large fluctuations in
response to relatively minor changes in the supply of, and demand for, oil and gas, market uncertainty and a
variety of other economic factors that are beyond our control.
In recent years, oil and gas prices and, therefore, the level of exploration, development and production activity,
have experienced significant fluctuations. Worldwide economic, political and military events, including war,
terrorist activity, events in the Middle East and initiatives by the Organization of the Petroleum Exporting
Countries (OPEC), have contributed, and are likely to continue to contribute, to price and volume volatility.
Increasing global supply of oil in conjunction with weakening demand from slowing economic growth in Europe
and Asia and increased fuel-efficiency has created downward pressure on crude oil prices.
Volatility in the global financial markets may adversely affect our business, financial condition and results of
operation.
During periods of volatility in the global financial markets, certain of our customers could delay or otherwise
reduce their purchases of railcars and other products and services. If volatile conditions in the global credit
markets impact our customers’ access to credit, product order volumes may decrease or customers may default
on payments owed to us.
Likewise, if our suppliers face challenges obtaining credit, or otherwise operating their businesses, the supply of
materials we purchase from them to manufacture our products may be interrupted. Any of these conditions or
events could result in reductions in our revenues, increased price competition, or increased operating costs, which
could adversely affect our business, financial condition and results of operations.
On June 23, 2016, the United Kingdom (UK) held a non-binding advisory referendum in which voters voted for
the UK to exit the EU (Brexit). Brexit has caused volatility in global stock markets and currency exchange rate
fluctuations, including the strengthening of the U.S. dollar against foreign currencies. Brexit may create further
uncertainty in European and worldwide markets, which may cause our customers or potential customers to delay
or reduce spending on our products or services, and may limit our suppliers’ access to credit. Any of these effects
of Brexit, among others, could negatively impact our business, results of operations and financial condition.
Our actual results may differ significantly from our announced strategic initiatives.
From time to time, we have released, and may continue to release information in our quarterly earnings releases,
quarterly earnings conference calls, or otherwise, regarding our anticipated future performance and goals. Our
actual results may differ significantly and we may not be successful in achieving the objectives outlined in our
announced strategic initiatives. Failure to meet these goals could have a material adverse effect on the trading
price or volume of our stock.
We rely on limited suppliers for certain components and services needed in our production. If we are not able
to procure specialty components or services on commercially reasonable terms or on a timely basis, our
business, financial condition and results of operations would be adversely affected.
Our manufacturing operations depend in part on our ability to obtain timely deliveries of materials, components
and services in acceptable quantities and quality from our suppliers. In 2016, the top ten suppliers for all
18 T h e G r e e n b r i e r C o m p a n i e s 2 0 1 6 A n n u a l R e p o r t

inventory purchases accounted for approximately 46% of total purchases. Amsted Rail Company, Inc. accounted
for 21% of total inventory purchases in 2016. No other suppliers accounted for more than 10% of total inventory
purchases. Certain components of our products, particularly specialized components like castings, bolsters,
trucks, wheels and axels, and certain services, such as lining capabilities, are currently available from only a
limited number of suppliers. Increases in the number of railcars manufactured have increased the demand for
such components and services and strong demand may cause industry-wide shortages if suppliers are in the
process of ramping up production or reach capacity production. Our dependence on a limited number of suppliers
involves risks, including limited control over pricing, availability and delivery schedules. If any one or more of
our suppliers cease to provide us with sufficient quantities of our components or services in a timely manner or
on terms acceptable to us, or cease to provide services or manufacture components of acceptable quality, we
could incur disruptions or be limited in our production of our products and we could have to seek alternative
sources for these components or services. We could also incur delays while we attempt to locate and engage
alternative qualified suppliers and we might be unable to engage acceptable alternative suppliers on favorable
terms, if at all. In addition, we are increasing the number of components and services we manufacture or provide
ourselves, directly or through joint ventures. If we are not successful at manufacturing such components or
providing such services or have production problems after transitioning to self-produced supplies, we may not be
able to replace such components or services from third party suppliers in a timely manner. Any such disruption in
our supply of specialized components and services or increased costs of those components or services could harm
our business and adversely affect our results of operations.
U.S. and Canadian railroad industry regulatory authorities released new regulations related to tank railcar
manufacturing and retrofitting standards on May 1, 2015. These regulatory changes could materially affect the
tank railcar manufacturing and retrofitting process industry-wide, which could negatively affect the potential
availability of certain critical components and raw materials including, in particular, steel. If we are unable to
source critical components and raw materials like steel in a timely manner and at reasonable cost, we may be
unable to manufacture or retrofit railcars that comply with the new regulations or take advantage of any increase
in demand for our products and services as a result of any such new regulations, and our business, financial
condition and results of operations could be materially adversely affected.
Train derailments or other accidents or claims could subject us to legal claims that adversely impact our
business, financial condition and our results of operations.
We provide a number of services which include the manufacture and supply of wheels, components and parts and
lease of railcars for our customers that transport a variety of commodities, including tank railcars that transport
hazardous materials such as crude oil, ethanol and other products. We could be subject to various legal claims,
including claims for negligence, personal injury, physical damage and product or service liability, or in some
cases strict liability, as well as potential penalties and liability under environmental laws and regulations, in the
event of a derailment or other accident involving railcars, including tank railcars. Additionally, the severity of
injury or property damage arising from an incident may influence the causation responsibility analysis exposing
us to potentially greater liability. If we become subject to any such claims and are unable successfully to resolve
them or have inadequate insurance for such claims, our business, financial condition and results of operations
could be materially adversely affected.
Changes in legal and regulatory requirements applicable to the industries in which we operate may adversely
impact our business, financial condition and results of operations.
Regulatory changes, along with prevailing market conditions, could materially affect new tank railcar
manufacturing and retrofitting activities industry-wide, including negative impacts to customer demand for our
products and services. Additional laws and regulations have been proposed or adopted that will potentially have a
significant impact on railroad operations, including the implementation of “positive train control” (PTC)
requirements. PTC is a collision avoidance technology intended to override engineer controlled locomotives and
stop certain types of train accidents.
T h e G r e e n b r i e r C o m p a n i e s 2 0 1 6 A n n u a l R e p o r t 19

While certain of these legal and regulatory changes could result in increased levels of repair or refurbishment
work for GBW and/or new tank car manufacturing activity, if we are unable to manage to adapt our business
successfully to changing regulations, our business and results of operations could be adversely affected. We have
made investments in GBW and our new railcar facilities in anticipation of increased demand for retrofits and new
tank cars as a result of new regulations. If this demand does not begin to materialize, we may not realize the
revenue we anticipated. Or if the demand does materialize, we may not be able to adapt to meet this demand.
We have 312 DOT 111 tank railcars in our lease fleet with a net book value of approximately $19.1 million as of
August 31, 2016. As a result of the final rule adopted by PHMSA in May 2015, certain of our tank cars could be
deemed unfit for further commercial use or require retrofits or modifications, and the costs associated with any
required retrofits or modifications could be substantial.
We cannot provide assurance that costs incurred to comply with any new standards and regulations, including
those finalized by PHMSA in May 2015, will not be material to our business, financial condition or results of
operations.
In addition, the speed restrictions imposed by the new regulations on trains transporting certain types of
potentially hazardous cargo may have an adverse impact on demand for tank cars, or potentially other types of
freight cars. While rail velocity is affected by many factors including general economic conditions, and has
increased since the adoption of the regulations, in some circumstances the specific velocity restrictions imposed
by the regulations may significantly reduce overall velocity on congested rail networks. This in turn could lead to
an increase in the cost of rail freight transportation and impact availability, making rail less competitive
compared to alternative modes of freight transportation. It could also lead to reduced demand for our products as
railroads limit additional equipment on their lines.
Any failure by us to comply with regulations imposed by federal and foreign agencies could negatively affect
our financial results.
Our operations and the industry we serve, including our customers, are subject to extensive regulation by
governmental, regulatory and industry authorities and by federal and foreign agencies. These organizations
establish rules and regulations for the railcar industry, including construction specifications and standards for the
design and manufacture of railcars; mechanical, maintenance and related standards; and railroad safety. New
regulatory rulings and regulations from these entities could impact our financial results, demand for our products
and the economic value of our assets. In addition, if we fail to comply with the requirements and regulations of
these entities, we could face sanctions and penalties that could negatively affect our financial results.
Compliance with health care legislation and increases in the cost of providing health care plans to our
employees may adversely affect our business.
In March 2010, Congress passed the Patient Protection and Affordable Care Act and the Health Care and
Education Affordability Reconciliation Act (collectively, the Acts). Among other things, the Acts contain
provisions that affect employer-sponsored health care plans, impose excise taxes on certain plans, and reduce the
tax benefits available to employers that receive the Medicare Part D subsidy. Nationally, the cost of providing
health care plans to a company’s employees has increased at annual rates in excess of inflation. Continued
significant annual increases in the cost of providing employee health coverage may adversely affect our business
and results of operations.
An adverse outcome in any pending or future litigation could negatively impact our business and results of
operations.
We are a defendant in several pending cases in various jurisdictions. If we are unsuccessful in resolving these
claims, our business and results of operations could be adversely affected. In addition, future claims that may
20 T h e G r e e n b r i e r C o m p a n i e s 2 0 1 6 A n n u a l R e p o r t

arise relating to any pending or new matters, whether brought against us or initiated by us against third parties,
could distract management’s attention from business operations and increase our legal and related costs, which
could also negatively impact our business and results of operations.
Risks related to potential misconduct by employees may adversely impact us.
Our employees may engage in misconduct or other improper activities, including noncompliance with our
policies or regulatory standards and requirements, which could subject us to regulatory sanctions and materially
harm our business. It is not always possible to deter employee misconduct, and the precautions we take to
prevent and detect this activity may not be effective in controlling unknown or unmanaged risks or losses,
including risks associated with whistleblower complaints and litigation. There can be no assurance that we will
succeed in preventing misconduct by employees in the future. In addition, the investigation of alleged
misconduct disrupts our operations and may be costly. Any such events in the future may have a material adverse
impact on our financial condition or results of operations.
Shortages of skilled labor could adversely affect our operations.
We depend on skilled labor in the manufacture of railcars and marine barges, repair, refurbishment, retrofitting
and maintenance of railcars and provision of wheel services and supply of parts. Some of our facilities are
located in areas where demand for skilled laborers often exceeds supply. Shortages of some types of skilled
laborers such as welders and machine operators could restrict our ability to maintain or increase production rates,
lead to production inefficiencies and increase our labor costs.
Some of our employees belong to labor unions and strikes or work stoppages could adversely affect our
operations.
We are a party to collective bargaining agreements with various labor unions at some of our operations. Disputes
with regard to the terms of these agreements or our potential inability to negotiate acceptable contracts with these
unions in the future could result in, among other things, strikes, work stoppages or other slowdowns by the
affected workers. We cannot be assured that our relations with our workforce will remain positive. Union
organizers are actively working to organize at some of our other facilities. If our workers were to engage in a
strike, work stoppage or other slowdown, or other employees were to become unionized or the terms and
conditions in future labor agreements were renegotiated, or if union representation is implemented at such sites
and we are unable to agree with the union on reasonable employment terms, including wages, benefits, and work
rules, we could experience a significant disruption of our operations and higher ongoing labor costs. In addition,
we could face higher labor costs in the future as a result of severance or other charges associated with lay-offs,
shutdowns or reductions in the size and scope of our operations or due to the difficulties of restarting our
operations that have been temporarily shuttered.
The price of our common stock is subject to volatility.
The market price for our common stock has varied between a high closing sales price of $77.54 per share and a
low closing sales price of $20.96 per share in the twenty-four months ended August 31, 2016. This volatility
affects the price at which our common stock can be sold. The broader stock market has also experienced price
and volume fluctuations. This volatility has affected the market prices of securities issued by many companies
for reasons unrelated to their operating performance and may adversely affect the price of our common
stock. The price for our common stock is likely to continue to be volatile and subject to price and volume
fluctuations in response to market and other factors, including the factors discussed elsewhere in these risk
factors and the following:
• financial market and general economic changes;
• changes in governmental regulation;
T h e G r e e n b r i e r C o m p a n i e s 2 0 1 6 A n n u a l R e p o r t 21

• significant railcar industry announcements or developments;
• the introduction of new products or technologies by us or our competitors;
• actual or anticipated variations in our or our competitors’ quarterly or annual financial results;
• financial results failing to meet expectations of analysts or investors, including the level of our backlog and
number of orders received during the period;
• changes in securities analysts’ estimates of our future performance; and
• the general health and outlook of our industry.
In addition, in the past, following periods of volatility in the market price of their stock, many companies have
been the subject of securities class action litigation. If we became involved in securities class action litigation in
the future, it could result in substantial costs and diversion of our management’s attention and resources and
could harm our stock price, business, prospects, financial condition and results of operations.
A failure to design or manufacture products or technologies or to achieve timely certification or market
acceptance of new products or technologies could have an adverse effect on our profitability.
We continue to introduce new railcar products and technologies, and we periodically accept orders prior to
receipt of railcar certification or proof of ability to manufacture a quality product that meets customer standards.
We could be unable to successfully design or manufacture these new railcar products and technologies. Our
inability to develop and manufacture such new products and technologies in a timely fashion and profitable
manner, obtain timely certification, or achieve market acceptance, or the existence of quality problems in our
new products, could have a material adverse effect on our revenue and results of operations and subject us to
penalties, cancellation of orders and/or other damages.
Our product and service warranties could expose us to potentially significant claims.
We offer our customers limited warranties for many of our products and services. Accordingly, we may be
subject to significant warranty claims in the future, such as multiple claims based on one defect repeated
throughout our production or servicing process or claims for which the cost of repairing the defective part is
highly disproportionate to the original cost of the part. These types of warranty claims could result in costly
product recalls, customers seeking monetary damages, significant repair costs and damage to our reputation.
If warranty claims attributable to actions of third party component manufacturers are not recoverable from such
parties due to their poor financial condition or other reasons, we could be liable for warranty claims and other
risks for using these materials on our products.
Many of our products are sold to third parties who may misuse, improperly install or improperly or
inadequately maintain or repair such products thereby potentially exposing us to claims that could increase
our costs and weaken our financial condition.
The products we manufacture are designed to work optimally when properly operated, installed, repaired, and
maintained. When this does not occur, we may be subjected to claims or litigation associated with injuries or
property damage that could increase our costs and weaken our financial condition.
Our financial performance and market value could cause future write-downs of goodwill or intangibles in
future periods.
We are required to perform an annual impairment review of goodwill and indefinite lived assets which could
result in an impairment charge if it is determined that the carrying value of the asset is in excess of the fair value.
We perform a goodwill impairment test annually during our third fiscal quarter. Goodwill is also tested more
frequently if changes in circumstances or the occurrence of events indicates that a potential impairment exists.
22 T h e G r e e n b r i e r C o m p a n i e s 2 0 1 6 A n n u a l R e p o r t

When changes in circumstances, such as a decline in the market price of our common stock, changes in demand
or in the numerous variables associated with the judgments, assumptions and estimates made in assessing the
appropriate valuation of goodwill indicate the carrying amount of certain indefinite lived assets may not be
recoverable, the assets are evaluated for impairment. Among other things, our assumptions used in the valuation
of goodwill, which relate to our wheels & parts and Repair operations, include growth of revenue and margins
and increased cash flows over time. If actual operating results were to differ from these assumptions, it may
result in an impairment of our goodwill. As of August 31, 2016, we had $43.3 million of goodwill in our Wheels
& Parts segment, relating to our wheels & parts business. Future write-downs of goodwill and intangibles could
affect certain of the financial covenants under debt instruments and could restrict our financial flexibility. In the
event of goodwill impairment, we may have to test other intangible assets for impairment. Impairment charges to
our or our joint venture’s goodwill or our indefinite lived assets would impact our results of operations.
If we or our joint ventures fail to complete capital expenditure projects on time and within budget, or if these
projects, once completed, fail to operate as anticipated, such failure could adversely affect our business,
financial condition and results of operations.
From time-to-time, we, or our joint ventures, undertake strategic capital projects in order to enhance, expand and/
or upgrade facilities and operational capabilities. Our ability, and our joint ventures’ ability, to complete these
projects on time and within budget, and for us to realize the anticipated increased revenues or otherwise realize
acceptable returns on these investments or other strategic capital projects that may be undertaken is subject to a
number of risks. Many of these risks are beyond our control, including a variety of market, operational,
permitting, and labor related factors. In addition, the cost to implement any given strategic capital project
ultimately may prove to be greater than originally anticipated. If we, or our joint ventures, are not able to achieve
the anticipated results from the implementation of any of these strategic capital projects, or if unanticipated
implementation costs are incurred, our business, financial condition and results of operations may be adversely
affected.
We have indebtedness, which could have negative consequences to our business or results of operations.
As of August 31, 2016, our total debt was approximately $304.0 million, consisting of convertible notes and term
loans. Our indebtedness could have negative consequences to us, and could place us at a competitive
disadvantage compared to our competitors. It may be difficult for us to satisfy our repayment and other
obligations with respect to such indebtedness, and we may not be able to refinance our existing indebtedness as it
matures. Indebtedness may also increase our vulnerability to adverse general economic, industry or competitive
developments or conditions and limit our flexibility in planning for, or reacting to, changes in our business and
the industry in which we operate. We may be limited in our ability to raise additional capital or obtain additional
financing to fund our operations, capital expenditures or other growth initiatives, and other general corporate
requirements and may be required to dedicate a significant portion of our cash flow from operations to interest
and principal payments on our indebtedness. We are more exposed to the risk of increased interest rates as
certain of our borrowings are at variable rates of interest. As a consequence of our indebtedness, a portion of our
cash flow from operations is dedicated to debt service requirements. In addition, the terms of our revolving credit
facility limit our ability to incur additional indebtedness. If we fail to comply with these covenants, a default may
occur, in which case the lender could accelerate the debt. We cannot be assured that we would be able to
renegotiate, refinance, restructure or otherwise obtain the necessary funds to satisfy the indebtedness or these
obligations.
Fluctuations in foreign currency exchange rates could lead to increased costs and lower profitability.
Outside of the U.S., we conduct business in Mexico, Poland, other European countries, Brazil and Saudi Arabia,
and our non-U.S. businesses conduct their operations in local currencies and other regional currencies. We also
source materials worldwide. Fluctuations in exchange rates may affect demand for our products in foreign
markets or our cost competitiveness and may adversely affect our profitability. Although we attempt to mitigate a
T h e G r e e n b r i e r C o m p a n i e s 2 0 1 6 A n n u a l R e p o r t 23

portion of our exposure to changes in currency rates through currency rate hedge contracts and other activities,
these efforts cannot fully eliminate the risks associated with the foreign currencies. In addition, some of our
borrowings are in foreign currency, giving rise to risk from fluctuations in exchange rates. A material or adverse
change in exchange rates could result in significant deterioration of profits or in losses for us.
Fluctuations in the availability and price of energy, freight transportation, steel and other raw materials, and
our fixed price contracts could have an adverse effect on our ability to manufacture and sell our products on a
cost-effective basis and could adversely affect our margins and revenue of our Manufacturing and wheels &
parts and Repair businesses.
A significant portion of our business depends upon the adequate supply of steel, components and other raw
materials at competitive prices and a small number of suppliers provide a substantial amount of our requirements.
The cost of steel and all other materials used in the production of our railcars represents more than half of our
direct manufacturing costs per railcar and in the production of our marine barges represents more than 30% of
our direct manufacturing costs per marine barge.
Our businesses also depend upon the adequate supply of energy at competitive prices. When the price of energy
increases, it adversely impacts our operating costs and could have an adverse effect upon our ability to conduct
our businesses on a cost-effective basis. We cannot be assured that we will continue to have access to supplies of
energy or necessary components for manufacturing railcars and marine barges. Our ability to meet demand for
our products could be adversely affected by the loss of access to any of these supplies, the inability to arrange
alternative access to any materials, or suppliers limiting allocation of materials to us.
In some instances, we have fixed price contracts which anticipate material price increases and surcharges, or
contracts that contain actual or formulaic pass-through of material price increases and surcharges. However, if
the price of steel or other raw materials were to fluctuate in excess of anticipated increases on which we have
based our fixed price contracts, or if we were unable to adjust our selling prices or have adequate protection in
our contracts against changes in material prices, or if we are unable to reduce operating costs to offset any price
increases, our margins would be adversely affected. The loss of suppliers or their inability to meet our price,
quality, quantity and delivery requirements could have an adverse effect on our ability to manufacture and sell
our products on a cost-effective basis.
Decreases in the price of scrap adversely impact our Wheels & Parts and GBW Joint Venture margins and
revenue and the residual value and future depreciation of our leased assets. A portion of our wheels & parts and
Repair businesses involves scrapping steel parts and the resulting revenue from such scrap steel increases our
margins and revenues. When the price of scrap steel declines, our revenues and margins in such business
therefore decrease.
We are subject to cybersecurity risks and may incur increasing costs in an effort to minimize those risks.
Our business employs systems and websites that allow for the storage and transmission of proprietary or
confidential information regarding our customers, employees, job applicants and other parties, including
financial information, intellectual property and personal identification information. Security breaches and other
disruptions could compromise our information, expose us to liability and harm our reputation and business. The
steps we take to deter and mitigate these risks may not be successful. We may not have the resources or technical
sophistication to anticipate or prevent current or rapidly evolving types of cyber-attacks. Attacks may be targeted
at us, our customers, or others who have entrusted us with information. Actual or anticipated attacks may cause
us to incur increasing costs, including costs to deploy additional personnel and protection technologies, train
employees, and engage third-party experts or consultants. Advances in computer capabilities, or other
technological developments may result in the technology and security measures used by us to protect transaction
or other data being breached or compromised. In addition, data and security breaches can also occur as a result of
non-technical issues, including intentional or inadvertent breach by our employees or by persons with whom we
have commercial relationships. Any compromise or breach of our security could result in a violation of
24 T h e G r e e n b r i e r C o m p a n i e s 2 0 1 6 A n n u a l R e p o r t

applicable privacy and other laws, legal and financial exposure, negative impacts on our customers’ willingness
to transact business with us and a loss of confidence in our security measures, which could have an adverse effect
on our results of operations and our reputation.
Updates or changes to our information technology systems may result in problems that could negatively
impact our business.
We have information technology systems, comprising hardware, network, software, people, processes and other
infrastructure that are important to the operation of our businesses. We continue to evaluate and implement
upgrades and changes to information technology systems that support substantially all of our operating and
financial functions. We could experience problems in connection with such implementations, including
compatibility issues, training requirements, higher than expected implementation costs and other integration
challenges and delays. A significant problem with an implementation, integration with other systems or ongoing
management and operation of our systems could negatively impact our business by disrupting operations. Such a
problem could also have an adverse effect on our ability to generate and interpret accurate management and
financial reports and other information on a timely basis, which could have a material adverse effect on our
financial reporting system and internal controls and adversely affect our ability to manage our business.
If we are unable to protect our intellectual property and prevent its improper use by third parties or if third
parties assert that our products or services infringe their intellectual property rights, our ability to compete in
the market may be harmed, and our business and financial condition may be adversely affected.
The protection of our intellectual property is important to our business. We rely on a combination of trademarks,
copyrights, patents and trade secrets to protect our intellectual property. However, these protections might be
inadequate. Our pending or future trademark, copyright and patent applications might not be approved or, if
allowed, might not be sufficiently broad. If our intellectual property rights are not adequately protected we may
not be able to commercialize our technologies, products or services and our competitors could commercialize our
technologies, which could result in a decrease in our sales and market share and could materially adversely affect
our business, financial condition and results of operations. Conversely, third parties might assert that our
products, services, or other business activities infringe their patents or other intellectual property rights.
Infringement and other intellectual property claims and proceedings brought against us, whether successful or
not, could result in substantial costs and harm our reputation. Such claims and proceedings can also distract and
divert our management and key personnel from other tasks important to the success of our business. In addition,
intellectual property litigation or claims could force us to cease selling or using products that incorporate the
asserted intellectual property, which would adversely affect our revenues, pay substantial damages for past use of
the asserted intellectual property or pay substantial fees to obtain a license from the holder of the asserted
intellectual property, which license may not be available on reasonable terms, if at all. In the event of an adverse
determination in an intellectual property suit or proceeding, or our failure to license essential technology or
redesign our products so as not to infringe third party intellectual property rights, our sales could be harmed and
our costs could increase, which could materially adversely affect our business, financial condition and results of
operations.
We could be liable for physical damage, business interruption or product liability claims that exceed our
insurance coverage.
The nature of our business subjects us to physical damage, business interruption and product liability claims,
especially in connection with the repair and manufacture of products that carry hazardous or volatile materials.
Although we maintain liability insurance coverage at commercially reasonable levels compared to similarly-sized
heavy equipment manufacturers, an unusually large physical damage, business interruption or product liability
claim or a series of claims based on a failure repeated throughout our production process could exceed our
insurance coverage or result in damage to our reputation.
T h e G r e e n b r i e r C o m p a n i e s 2 0 1 6 A n n u a l R e p o r t 25

We could be unable to procure adequate insurance on a cost-effective basis in the future.
The ability to insure our businesses, facilities and rail assets is an important aspect of our ability to manage risk.
As there are only limited providers of this insurance to the railcar industry, there is no guarantee that such
insurance will be available on a cost-effective basis in the future. In addition, we cannot assure that our insurance
carriers will be able to pay current or future claims.
Changes in accounting standards or inaccurate estimates or assumptions in the application of accounting
policies could adversely affect our financial results.
Our accounting policies and methods are fundamental to how we record and report our financial condition and
results of operations. Some of these policies require use of estimates and assumptions that may affect the
reported value of our assets or liabilities and financial results and are critical because they require management to
make difficult, subjective, and complex judgments about matters that are inherently uncertain. Accounting
standard setters and those who interpret the accounting standards (such as the Financial Accounting Standards
Board, the SEC, and our independent registered public accounting firm) may amend or even reverse their
previous interpretations or positions on how these standards should be applied. In some cases, we could be
required to apply a new or revised standard retrospectively, resulting in the revision of prior period financial
statements. Changes in accounting standards can be hard to predict and can materially impact how we record and
report our financial condition and results of operations.
Fires, natural disasters, severe weather conditions or public health crisis could disrupt our business and result
in loss of revenue or higher expenses.
Any serious disruption at any of our facilities due to fire, hurricane, earthquake, flood, or any other natural
disaster, or an epidemic or other public health crisis, or a panic reaction to a perceived health risk, could impair
our ability to use our facilities and have a material adverse impact on our revenues and increase our costs and
expenses. If there is a natural disaster or other serious disruption at any of our facilities, particularly any of our
Mexican facilities, it could impair our ability to adequately supply our customers, cause a significant disruption
to our operations, cause us to incur significant costs to relocate or reestablish these functions and negatively
impact our operating results. While we insure against certain business interruption risks, such insurance may not
adequately compensate us for any losses incurred as a result of natural or other disasters.
Unusual weather conditions may reduce demand for our wheel-related parts and repair services.
Performing railcar wheel repair and replacing railcar wheels represents a portion of our business. Seasonal
fluctuations in weather conditions may lead to greater variation in our quarterly operating results as unusually
mild weather conditions will generally lead to lower demand for our wheel-related products and services. In
addition, unusually mild weather conditions throughout the year may reduce overall demand for our wheel-
related products and repair services. If occurring for prolonged periods, such weather could have an adverse
effect on our business, results of operations and financial condition.
Business, regulatory, and legal developments regarding climate change may affect the demand for our
products or the ability of our critical suppliers to meet our needs.
We have followed the current debate over climate change in general, and the related science, policy discussion,
and prospective legislation. Some scientific studies have suggested that emissions of certain gases, commonly
referred to as greenhouse gases (GHGs) and including carbon dioxide and methane, may be contributing to
warming of the Earth’s atmosphere and other climate changes. Additionally, the potential challenges and
opportunities for our company that climate change policy and legislation may pose are reviewed. However, any
such challenges or opportunities are heavily dependent on the nature and degree of climate change legislation and
the extent to which it applies to our industries.
26 T h e G r e e n b r i e r C o m p a n i e s 2 0 1 6 A n n u a l R e p o r t

In response to an emerging scientific and political consensus, legislation and new rules to regulate emission of
GHGs has been introduced in numerous state legislatures, the U.S. Congress, and by the EPA. Some of these
proposals would require industries to meet stringent new standards that may require substantial reductions in
carbon emissions. While we cannot assess the direct impact of these or other potential regulations, we recognize
that new climate change protocols could affect the demand for our products and/or affect the price of materials,
input factors and manufactured components which could impact our margins. Potential opportunities could
include greater demand for certain types of railcars, while potential challenges could include decreased demand
for certain types of railcars or other products and higher energy costs. Other adverse consequences of climate
change could include an increased frequency of severe weather events and rising sea levels that could affect
operations at our manufacturing facilities, the price of insuring company assets, or other unforeseen disruptions
of our operations, systems, property or equipment. Ultimately, when or if these impacts may occur cannot be
assessed until scientific analysis and legislative policy are more developed and specific legislative proposals
begin to take shape.
Repercussions from terrorist activities or armed conflict could harm our business.
Terrorist activities, anti-terrorist efforts, and other armed conflict involving the U.S. or its interests abroad may
adversely affect the U.S. and global economies, potentially preventing us from meeting our financial and other
obligations. In particular, the negative impacts of these events may affect the industries in which we operate. This
could result in delays in or cancellations of the purchase of our products or shortages in raw materials, parts, or
components. Any of these occurrences could have a material adverse impact on our financial results.
Unanticipated changes in our tax provisions or exposure to additional income tax liabilities could affect our
financial condition and profitability.
We are subject to income taxes in both the United States and foreign jurisdictions. Significant judgment is
required in determining our worldwide provision for income taxes. Changes in estimates of projected future
operating results, loss of deductibility of items, recapture of prior deductions (including related to interest on
convertible notes), or changes in assumptions regarding our ability to generate future taxable income could result
in significant increases to our tax expense and liabilities that could adversely affect our financial condition and
profitability.
Some of our customers place orders for our products in reliance on their ability to utilize tax benefits or tax
credits such as accelerated depreciation.
There is no assurance that tax authorities will reauthorize, modify, or otherwise not allow the expiration of such
tax benefits, tax credits, or reimbursement policies, and in cases where such subsidies and policies are materially
modified to reduce the available benefit, credit, or reimbursement or are otherwise allowed to expire, the demand
for our products could decrease, thereby creating the potential for a material adverse effect on our financial
condition or results of operations.
From time to time we may take tax positions that the Internal Revenue Service or other tax authorities may
contest.
We have in the past and may in the future take tax positions that the Internal Revenue Service (IRS) or other tax
authorities may contest. We are required by an IRS regulation to disclose particular tax positions to the IRS as
part of our tax returns for that year and future years. If the IRS or other tax authorities successfully contests a tax
position that we take, we may be required to pay additional taxes, interest or fines that may adversely affect our
results of operation and financial position.
T h e G r e e n b r i e r C o m p a n i e s 2 0 1 6 A n n u a l R e p o r t 27

Our share repurchase program is intended to enhance long-term shareholder value although we cannot
assure this will occur and this program may be suspended or terminated at any time.
The Board of Directors has authorized our company to repurchase our common stock through a share repurchase
program. Our share repurchase program may be modified, suspended or discontinued at any time without prior
notice. Although the share repurchase program is intended to enhance long-term shareholder value, we cannot
provide assurance that this will occur.
Payments of cash dividends on our common stock may be made only at the discretion of our board of directors
and may be restricted by Oregon law.
Any decision to pay dividends will be at the discretion of our Board of Directors and will depend upon our
operating results, strategic plans, capital requirements, financial condition, provisions of our borrowing
arrangements and other factors our Board of Directors considers relevant. Furthermore, Oregon law imposes
restrictions on our ability to pay dividends. Accordingly, we may not be able to continue to pay dividends in any
given amount in the future, or at all.
28 T h e G r e e n b r i e r C o m p a n i e s 2 0 1 6 A n n u a l R e p o r t

Item 1B. UNRESOLVED STAFF COMMENTS
None.
Item 2. PROPERTIES
We operate at the following primary facilities as of August 31, 2016:
Description Location Status
Manufacturing Segment
Manufacturing facilities: Portland, Oregon Owned
Sahagun, Mexico Owned
Tlaxcala, Mexico Owned
Frontera, Mexico Leased
3 locations in Poland Owned
Administrative offices: Colleyville, Texas Leased
Wheels & Parts Segment
Wheels & Parts facilities: 14 locations in the U.S. Leased — 8 locations
Owned — 6 locations
Repair facilities leased to GBW: 14 locations in the U.S.
1 location in Canada
Leased — 8 locations
Owned — 3 locations
Customer premises —3 locations
Customer premises
Administrative offices: Birmingham, Alabama Leased
Leasing & Services Segment
Corporate offices, railcar marketing
and leasing activities:
Lake Oswego, Oregon Leased
We believe that our facilities are in good condition and that the facilities, together with anticipated capital
improvements and additions, are adequate to meet our operating needs for the foreseeable future. We continually
evaluate our facilities in order to remain competitive and to take advantage of market opportunities.
Item 3. LEGAL PROCEEDINGS
There is hereby incorporated by reference the information disclosed in Note 22 to Consolidated Financial
Statements, Part II, Item 8 of this Form 10-K.
Item 4. MINE SAFETY DISCLOSURES
Not applicable.
T h e G r e e n b r i e r C o m p a n i e s 2 0 1 6 A n n u a l R e p o r t 29

PART II
Item 5. MARKET FOR REGISTRANT’S COMMON EQUITY, RELATEDSTOCKHOLDER MATTERS AND ISSUER PURCHASES OF EQUITYSECURITIES
Our common stock has been traded on the New York Stock Exchange under the symbol GBX since July 14,
1994. There were approximately 373 holders of record of common stock as of October 19, 2016. The following
table shows the reported high and low sales prices of our common stock on the New York Stock Exchange for
the fiscal periods indicated.
High LowDividendsDeclared
2016
Fourth quarter $34.94 $25.90 $0.21
Third quarter $32.78 $24.27 $0.20
Second quarter $36.23 $19.89 $0.20
First quarter $42.04 $30.35 $0.20
2015
Fourth quarter $62.95 $33.10 $0.15
Third quarter $66.50 $49.61 $0.15
Second quarter $60.77 $42.62 $0.15
First quarter $78.32 $45.09 $0.15
Dividends
There is no assurance as to the payment of future dividends as they are dependent upon future earnings, capital
requirements, customary debt covenant restrictions and our financial condition.
Issuer Purchases of Equity Securities
Since October 2013, the Board of Directors has authorized the Company to repurchase in aggregate up to $225
million of the Company’s common stock. The program may be modified, suspended or discontinued at any time
without prior notice and currently has an expiration date of January 1, 2018. Under the share repurchase program,
shares of common stock may be purchased on the open market or through privately negotiated transactions from
time-to-time. The timing and amount of purchases will be based upon market conditions, securities law
limitations and other factors. The share repurchase program does not obligate the Company to acquire any
specific number of shares in any period.
There were no shares repurchased under the share repurchase program during the three months ended August 31,
2016.
PeriodTotal Number of
Shares Purchased
Average PricePaid Per Share
(IncludingCommissions)
Total Number ofShares Purchased
as Part ofPublically
Announced Plansor Programs
ApproximateDollar Value of
Shares that MayYet Be PurchasedUnder the Plans or
Programs
June 1, 2016 – June 30, 2016 – – – $87,989,491
July 1, 2016 – July 31, 2016 – – – $87,989,491
August 1, 2016 – August 31, 2016 – – – $87,989,491
– –
30 T h e G r e e n b r i e r C o m p a n i e s 2 0 1 6 A n n u a l R e p o r t

Performance Graph
The following graph demonstrates a comparison of cumulative total returns for the Company’s Common Stock,
the Dow Jones U.S. Industrial Transportation Index and the Standard & Poor’s (S&P) 500 Index. The graph
assumes an investment of $100 on August 31, 2011 in each of the Company’s Common Stock and the stocks
comprising the indices. Each of the indices assumes that all dividends were reinvested and that the investment
was maintained to and including August 31, 2016, the end of the Company’s 2016 fiscal year.
The comparisons in this table are required by the SEC, and therefore, are not intended to forecast or be indicative
of possible future performance of our Common Stock.
COMPARISON OF 5 YEAR CUMULATIVE TOTAL RETURN*Among The Greenbrier Companies, Inc., the S&P 500 Index
and the Dow Jones U.S. Industrial Transportation Index
$0
$50
$100
$150
$200
$250
$300
$350
$450
$400
8/11 8/12 8/13 8/14 8/15 8/16
The Greenbrier Companies, Inc.
S&P 500
Dow Jones US Industrial Transportation
*$100 invested on 8/31/11 in stock or index, including reinvestment of dividends.
Fiscal year ending August 31.
Copyright© 2016 S&P, a division of McGraw Hill Financial. All rights reserved.
Copyright© 2016 Dow Jones & Co. All rights reserved.
Equity Compensation Plan Information
Equity Compensation Plan Information is hereby incorporated by reference to the “Equity Compensation Plan
Information” table in Registrant’s definitive Proxy Statement to be filed pursuant to Regulation 14A, which
Proxy Statement is anticipated to be filed with the Securities and Exchange Commission within 120 days after
the end of the Registrant’s year ended August 31, 2016.
T h e G r e e n b r i e r C o m p a n i e s 2 0 1 6 A n n u a l R e p o r t 31

Item 6. SELECTED FINANCIAL DATA
YEARS ENDED AUGUST 31,
(In thousands, except unit and per share data) 2016 2015 2014 2013 2012
Statement of Operations DataRevenue:
Manufacturing $2,096,331 $2,136,051 $1,624,916 $1,215,734 $1,253,964Wheels & Parts 322,395 371,237 495,627 469,222 481,865Leasing & Services 260,798 97,990 83,419 71,462 71,887
$2,679,524 $2,605,278 $2,203,962 $1,756,418 $1,807,716
Earnings from operations $ 408,552 $ 386,892 $ 239,520 $ 41,651 $ 118,788
Net earnings (loss) attributable to Greenbrier $ 183,213 $ 192,832 $ 111,919(1) $ (11,048)(2) $ 58,708
Basic earnings (loss) per common shareattributable to Greenbrier: $ 6.28 $ 6.85 $ 3.97 $ (0.41) $ 2.21
Diluted earnings (loss) per common shareattributable to Greenbrier: $ 5.73 $ 5.93 $ 3.44 $ (0.41) $ 1.91
Weighted average common sharesoutstanding:
Basic 29,156 28,151 28,164 26,678 26,572Diluted 32,468 33,328 34,209 26,678 33,718
Cash dividends paid per share $ .81 $ .60 $ .15 $ .00 $ .00
Balance Sheet DataTotal assets $1,837,890 $1,790,512 $1,517,168 $1,289,741 $1,384,544Revolving notes and notes payable $ 303,969 $ 377,317 $ 458,172 $ 422,098 $ 488,834Total equity $1,016,827 $ 863,489 $ 573,721 $ 456,827 $ 453,645
Other Operating DataNew railcar units delivered 20,300 21,100 16,200 11,600 15,000New railcar backlog (units) 27,500 41,300 31,500 14,400 10,700New railcar backlog (value in millions) $ 3,190 $ 4,710 $ 3,330 $ 1,520 $ 1,200Lease fleet:
Units managed 264,166 259,966 237,849 223,911 219,020Units owned 8,949 9,324 8,550 8,581 10,841
Cash Flow DataCapital expenditures:
Manufacturing $ 51,294 $ 84,354 $ 55,979 $ 37,017 $ 33,313Wheels & Parts 10,190 9,381 8,774 7,492 11,248Leasing & Services 77,529 12,254 5,474 16,318 73,324
$ 139,013 $ 105,989 $ 70,227 $ 60,827 $ 117,885
Proceeds from sale of assets $ 103,715 $ 5,295 $ 54,235 $ 75,338 $ 33,560
Depreciation and amortization:Manufacturing $ 27,137 $ 20,668 $ 15,341 $ 13,469 $ 11,754Wheels & Parts 11,971 11,748 12,582 12,843 13,265Leasing & Services 24,237 12,740 12,499 15,135 17,352
$ 63,345 $ 45,156 $ 40,422 $ 41,447 $ 42,371
(1) 2014 includes a non-cash gain on contribution to joint venture of $13.6 million net of tax and a restructuring charge of$1.0 million net of tax. The gain related to the Company contributing its Repair operations to GBW.
(2) 2013 includes a non-cash goodwill impairment charge of $71.8 million net of tax and a restructuring charge of $1.8million net of tax.
32 T h e G r e e n b r i e r C o m p a n i e s 2 0 1 6 A n n u a l R e p o r t
Item 7. MANAGEMENT’S DISCUSSION AND ANALYSIS OF FINANCIALCONDITION AND RESULTS OF OPERATIONS
Executive Summary
We operate in four reportable segments: Manufacturing; Wheels & Parts; Leasing & Services; and GBW Joint
Venture. Our segments are operationally integrated. The Manufacturing segment, operating from facilities in the
United States, Mexico and Poland, produces double-stack intermodal railcars, tank cars, conventional railcars,
automotive railcar products and marine vessels. The Wheels & Parts segment performs wheel and axle servicing,
as well as production of a variety of parts for the railroad industry in North America. The Leasing & Services
segment owns approximately 8,900 railcars (6,600 railcars held as equipment on operating leases, 2,200 held as
leased railcars for syndication and 100 held as finished goods inventory) and provides management services for
approximately 264,000 railcars for railroads, shippers, carriers, institutional investors and other leasing and
transportation companies in North America. The GBW Joint Venture segment provides repair services at over 30
locations across North America, including more than 10 tank car repair and maintenance facilities certified by the
Association of American Railroads (AAR). The results of these operations were included as part of Earnings
from unconsolidated affiliates as we account for our interest in GBW under the equity method of accounting.
Through unconsolidated joint ventures we also produce rail castings, tank heads and other components and have
a direct and indirect 35% ownership stake in a railcar manufacturer in Brazil.
Subsequent to August 31, 2016, we reached agreements to restructure certain railcar contracts for favorable
financial and other considerations resulting in a reduction of approximately 1,200 units. The adjustment is
reflected as of August 31, 2016. Our total manufacturing backlog of railcar units as of August 31, 2016 was
approximately 27,500 units with an estimated value of $3.19 billion, of which 23,500 units are for direct sales,
3,700 units are intended for syndications to third parties with a lease attached and 300 units intended to be placed
into our owned lease fleet. Backlog as of August 31, 2015 was approximately 41,300 units with an estimated
value of $4.71 billion. Multi-year supply agreements are a part of rail industry practice. A portion of the orders
included in backlog reflects an assumed product mix. Under terms of the orders, the exact mix will be determined
in the future, which may impact the dollar amount of backlog. Marine backlog as of August 31, 2016 was $114
million compared to $52 million as of August 31, 2015.
Our backlog of railcar units and marine vessels is not necessarily indicative of future results of operations.
Certain orders in backlog are subject to customary documentation and completion of terms. Customer orders
contain terms and conditions customary in the industry. Customers may attempt to cancel or modify orders in
backlog. Historically, little variation has been experienced between the quantity ordered and the quantity actually
delivered, though the timing of deliveries has been modified from time to time. Backlog as of August 31, 2016
includes an aggregate of 3,800 covered hopper railcars for use in energy related sand transportation; customers
may seek to cancel, settle or modify a portion of these railcars. We cannot guarantee that our reported railcar
backlog will convert to revenue in any particular period, if at all.
In September 2015, we purchased a portfolio of 3,885 railcars from a related third party for approximately
$148.0 million plus a $1.0 million fee with the intent to resell the railcars and underlying attached leases to third
parties in the short-term. During the year ended August 31, 2016, we sold to third parties 3,406 of these railcars
with the underlying leases attached for $167.2 million. We recognized revenue on 3,017 of these railcars for
$159.4 million and deferred revenue recognition on 389 of these railcars for $7.8 million due to our continuing
involvement. The gross proceeds from the sale of these railcars with leases attached were recorded as revenue
and the cost of purchasing these railcars was recorded in cost of revenue within our Leasing & Services segment.
The remaining 479 railcars are anticipated to be sold or disposed of in the next year.
In August 2016 we announced that we closed on the acquisition of a 19.5% ownership interest for $10 million in
Amsted-Maxion Fundição e Equipamentos Ferroviários S.A. (Amsted-Maxion Cruzeiro), a manufacturer of
castings and components for railcars and other heavy equipment. Amsted-Maxion Cruzeiro is also the co-owner
with us of Amsted-Maxion Equipamentos E Serviços Ferroviários S.A. (Greenbrier-Maxion), a railcar
manufacturer in Brazil. We own 19.5% of Greenbrier-Maxion while Amsted-Maxion Cruzeiro owns 80.5%.
T h e G r e e n b r i e r C o m p a n i e s 2 0 1 6 A n n u a l R e p o r t 33

After our investment in Amsted-Maxion Cruzeiro we now, directly and indirectly, own approximately 35% of
Greenbrier-Maxion. As part of this investment, we have an option, subject to certain conditions, to acquire an
additional 10% interest in Amsted-Maxion Cruzeiro. Our option expires on October 20, 2017. In 2015, as part of
our initial investment in Greenbrier-Maxion, we secured an option to acquire an additional 40.5% direct
ownership interest in Greenbrier-Maxion. The option is exercisable until December 30, 2017 and has been
modified as part of the August 2016 transaction to allow us to purchase a direct ownership interest in Greenbrier-
Maxion in an amount between 30.6% and 40.5%, with the option exercise price adjusted in proportion to the
ownership interest obtained.
In October 2016, we entered into an agreement with Astra Rail Management GmbH (Astra) to form a new
company, Greenbrier-Astra Rail, which will create an end-to-end, Europe-based freight railcar manufacturing,
engineering and repair business. The combined enterprise will be formed between our European operations
headquartered in Swidnica, Poland and Astra Rail based in Germany and Arad, Romania. It will be led by an
experienced Europe-based management team from both companies. Greenbrier-Astra Rail will offer
manufacturing and service capability in Europe with greater scale and efficiency for current customers. It also
provides the opportunity to pursue growth in railcar markets in the GCC nations and Eurasia. Greenbrier-Astra
Rail will be controlled by us with an approximate 75% interest. As partial consideration for our majority interest,
we will pay Astra Rail €30 million at closing and €30 million 12 months after closing. We will provide a
guarantee in connection with the €30 million to be paid to Astra twelve months after the closing. Closing of the
transaction is contingent on, among other conditions, achieving antitrust approval in certain EU countries.
34 T h e G r e e n b r i e r C o m p a n i e s 2 0 1 6 A n n u a l R e p o r t
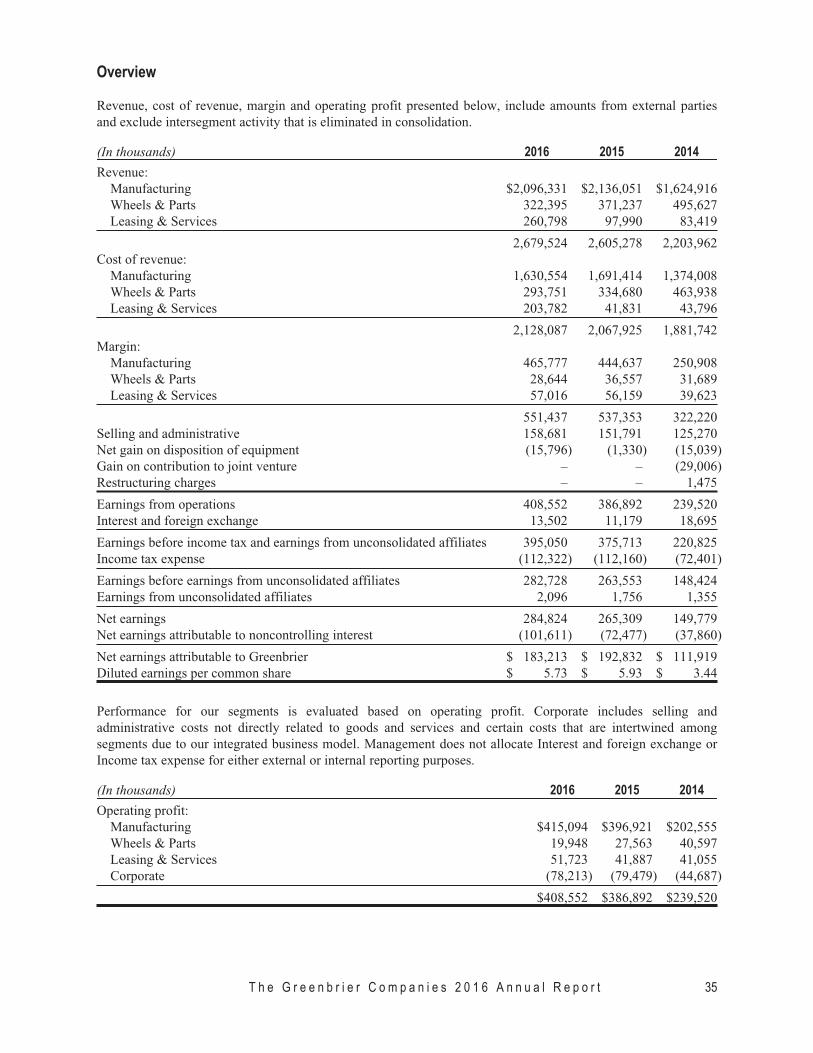
Overview
Revenue, cost of revenue, margin and operating profit presented below, include amounts from external parties
and exclude intersegment activity that is eliminated in consolidation.
(In thousands) 2016 2015 2014
Revenue:
Manufacturing $2,096,331 $2,136,051 $1,624,916
Wheels & Parts 322,395 371,237 495,627
Leasing & Services 260,798 97,990 83,419
2,679,524 2,605,278 2,203,962
Cost of revenue:
Manufacturing 1,630,554 1,691,414 1,374,008
Wheels & Parts 293,751 334,680 463,938
Leasing & Services 203,782 41,831 43,796
2,128,087 2,067,925 1,881,742
Margin:
Manufacturing 465,777 444,637 250,908
Wheels & Parts 28,644 36,557 31,689
Leasing & Services 57,016 56,159 39,623
551,437 537,353 322,220
Selling and administrative 158,681 151,791 125,270
Net gain on disposition of equipment (15,796) (1,330) (15,039)
Gain on contribution to joint venture – – (29,006)
Restructuring charges – – 1,475
Earnings from operations 408,552 386,892 239,520
Interest and foreign exchange 13,502 11,179 18,695
Earnings before income tax and earnings from unconsolidated affiliates 395,050 375,713 220,825
Income tax expense (112,322) (112,160) (72,401)
Earnings before earnings from unconsolidated affiliates 282,728 263,553 148,424
Earnings from unconsolidated affiliates 2,096 1,756 1,355
Net earnings 284,824 265,309 149,779
Net earnings attributable to noncontrolling interest (101,611) (72,477) (37,860)
Net earnings attributable to Greenbrier $ 183,213 $ 192,832 $ 111,919
Diluted earnings per common share $ 5.73 $ 5.93 $ 3.44
Performance for our segments is evaluated based on operating profit. Corporate includes selling and
administrative costs not directly related to goods and services and certain costs that are intertwined among
segments due to our integrated business model. Management does not allocate Interest and foreign exchange or
Income tax expense for either external or internal reporting purposes.
(In thousands) 2016 2015 2014
Operating profit:
Manufacturing $415,094 $396,921 $202,555
Wheels & Parts 19,948 27,563 40,597
Leasing & Services 51,723 41,887 41,055
Corporate (78,213) (79,479) (44,687)
$408,552 $386,892 $239,520
T h e G r e e n b r i e r C o m p a n i e s 2 0 1 6 A n n u a l R e p o r t 35

Consolidated Results
(In thousands)
Years ended August 31,Increase
(Decrease)%
Change2016 2015
Revenue $2,679,524 $2,605,278 $74,246 2.8%
Cost of revenue $2,128,087 $2,067,925 $60,162 2.9%
Margin (%) 20.6% 20.6% 0.0% *
Net earnings attributable to Greenbrier $ 183,213 $ 192,832 $ (9,619) (5.0%)* Not meaningful
Through our integrated business model, we provide a broad range of custom products and services in each of our
segments which have various average selling prices and margins. The demand for and mix of products and
services delivered changes from year to year which causes fluctuations in our results of operations.
The 2.8% increase in revenue for the year ended August 31, 2016 as compared to the year ended August 31, 2015
was primarily due to a 166.1% increase in Leasing & Services revenue which was primarily the result of the sale
of railcars that we purchased from a related third party. This was partially offset by a 1.9% decrease in
Manufacturing revenue due to a 3.8% decrease in the volume of railcar deliveries. However, the manufacturing
product mix in the current period had a higher average selling price as compared to the prior comparable period.
In addition, the increase in Leasing & Services revenue was partially offset by a 13.2% decrease in Wheels &
Parts revenue as a result of lower wheel set, component and parts volumes due to a decrease in demand and a
decrease in scrap metal volume and pricing.
The 2.9% increase in cost of revenue for the year ended August 31, 2016 as compared to the year ended
August 31, 2015 was due to a 387.2% increase in Leasing & Services cost of revenue which was primarily the
result of costs associated with the sale of railcars that we purchased from a related third party. This was partially
offset by a 3.6% decrease in Manufacturing cost of revenue. The decrease in Manufacturing cost of revenue was
due to a decrease of 3.8% in the volume of railcar deliveries partially offset by a mix which had a higher average
labor and material content and improved production efficiencies. In addition, the increase in Leasing & Services
cost of revenue was partially offset by a 12.2% decrease in Wheels & Parts cost of revenue as a result of lower
wheel set, component and parts costs associated with decreased volumes.
Margin as a percentage of revenue was 20.6% for both the years ended August 31, 2016 and 2015. The overall
margin as a percentage of revenue was positively impacted by an increase in Manufacturing margin to 22.2%
from 20.8% primarily due to a change in product mix and improved production efficiencies. This was offset by a
decrease in Leasing & Services margin to 21.9% from 57.3% primarily as a result of a lower margin percentage
on the syndication, or sale, of railcars purchased from a related third party. In addition, the increase in
Manufacturing margin was offset by a decrease in Wheels & Parts margin to 8.9% from 9.8% due to lower wheel
set and component volumes and a decrease in scrap metal pricing.
Net earnings attributable to Greenbrier is impacted by our operating activities and noncontrolling interest due to a
50/50 joint venture at one of our Mexican railcar manufacturing facilities that we consolidate for financial
reporting purposes. This joint venture operated at higher volumes and margins in 2016 which resulted in higher
Net earnings attributable to noncontrolling interest which was the primary reason for the $9.6 million decrease in
Net earnings attributable to Greenbrier for the year ended August 31, 2016 as compared to the year ended
August 31, 2015. This was partially offset by an increase in Net gain on disposition of equipment as compared to
the prior year.
36 T h e G r e e n b r i e r C o m p a n i e s 2 0 1 6 A n n u a l R e p o r t

(In thousands)
Years ended August 31,Increase
(Decrease)%
Change2015 2014
Revenue $2,605,278 $2,203,962 $401,316 18.2%
Cost of revenue $2,067,925 $1,881,742 $186,183 9.9%
Margin (%) 20.6% 14.6% 6.0% *
Net earnings attributable to Greenbrier $ 192,832 $ 111,919 $ 80,913 72.3%* Not meaningful
The 18.2% increase in revenue for the year ended August 31, 2015 as compared to the year ended August 31,
2014 was primarily due to a 31.5% increase in Manufacturing revenue. The increase in Manufacturing revenue
was primarily due to a 30% increase in the volume of deliveries in response to strong demand in the freight car
market and an increase in marine activity as compared to the prior comparable period. The increase in revenue
also included a 17.5% increase in Leasing & Services revenue which was primarily the result of a higher average
volume of newly built rent-producing railcars. These were partially offset by a 25.1% decrease in Wheels & Parts
revenue primarily due to 2015 excluding repair revenue as a result of contributing our Repair business to GBW,
while 2014 included repair revenue through July 18, 2014.
The 9.9% increase in cost of revenue for the year ended August 31, 2015 as compared to the year ended
August 31, 2014 was primarily due to a 23.1% increase in Manufacturing cost of revenue. The increase in
Manufacturing cost of revenue was primarily due to an increase of 30% in the volume of railcar deliveries with a
mix which had a lower average labor and material content. This was partially offset by improved production
efficiencies and favorable foreign currency exchange rates. The increase in Manufacturing cost of revenue was
partially offset by a 27.9% decrease in Wheels & Parts cost of revenue primarily due to 2015 excluding repair
cost of revenue as a result of contributing our Repair business to GBW, while 2014 included repair cost of
revenue through July 18, 2014. In addition, the increase in Manufacturing cost of revenue was partially offset by
a 4.5% decrease in Leasing & Services cost of revenue. This was primarily due to lower transportation costs and
a decrease in the cost of revenue associated with purchased railcars that were sold.
Margin as a percentage of revenue was 20.6% and 14.6% for the years ended August 31, 2015 and 2014,
respectively. The overall 6.0% increase in margin percentage was due to an increase in margin in all three of our
consolidated segments. Manufacturing margin increased to 20.8% for 2015 compared to 15.4% for 2014
primarily due to favorable pricing, improved production efficiencies and favorable foreign currency exchange
rates. In addition, 2015 had higher volumes of new railcar sales with leases attached which typically result in
higher sales prices and margins. Wheels & Parts margin increased to 9.8% for 2015 compared to 6.4% for 2014,
primarily as the result of 2015 excluding the results of our Repair operations which in the recent past have had
lower margins as a percentage of revenue than the rest of the segment. Leasing & Services margin increased to
57.3% for 2015 compared to 47.5% for 2014 which was primarily the result of a higher average volume of newly
built rent-producing railcars as compared to the prior year and lower transportation costs.
The $80.9 million increase in Net earnings attributable to Greenbrier for the year ended August 31, 2015 as
compared to the year ended August 31, 2014 was primarily attributable to an increase in margin. This was
partially offset by an increase in selling and administrative expense as compared to the prior year and a Gain on
contribution to joint venture in 2014.
T h e G r e e n b r i e r C o m p a n i e s 2 0 1 6 A n n u a l R e p o r t 37

Manufacturing Segment
Years ended August 31, 2016 vs 2015 2015 vs 2014
(In thousands) 2016 2015 2014Increase
(Decrease)%
ChangeIncrease
(Decrease)%
Change
Revenue $2,096,331 $2,136,051 $1,624,916 $(39,720) (1.9%) $511,135 31.5%
Cost of revenue $1,630,554 $1,691,414 $1,374,008 $(60,860) (3.6%) $317,406 23.1%
Margin (%) 22.2% 20.8% 15.4% 1.4% * 5.4% *
Operating profit ($) $ 415,094 $ 396,921 $ 202,555 $ 18,173 4.6% $194,366 96.0%
Operating profit (%) 19.8% 18.6% 12.5% 1.2% * 6.1% *
Deliveries 20,300 21,100 16,200 (800) (3.8%) 4,900 30.2%* Not meaningful
Manufacturing revenue was $2.096 billion, $2.136 billion and $1.625 billion for the years ended August 31,
2016, 2015 and 2014. Manufacturing revenue decreased $39.7 million or 1.9% in 2016 compared to 2015
primarily due to a 3.8% decrease in the volume of railcar deliveries. However, the manufacturing product mix in
the current period had a higher average selling price as compared to the prior comparable period. Manufacturing
revenue increased $511.1 million or 31.5% in 2015 compared to 2014 primarily due to a 30% increase in the
volume of deliveries in response to strong demand in the freight car market and an increase in marine activity as
compared to the prior comparable period.
Manufacturing cost of revenue was $1.631 billion, $1.691 billion and $1.374 billion for the years ended
August 31, 2016, 2015 and 2014. Cost of revenue decreased $60.9 million or 3.6% in 2016 compared to 2015
due to a decrease of 3.8% in the volume of railcar deliveries. This was partially offset by a mix which had a
higher average labor and material content and improved production efficiencies. Cost of revenue increased
$317.4 million or 23.1% in 2015 compared to 2014 primarily due to an increase of 30% in the volume of railcar
deliveries with a mix that had a lower average labor and material content. This was partially offset by improved
production efficiencies and favorable foreign currency exchange rates. In addition, the increase in Manufacturing
cost of revenue was attributed to an increase in marine activity as compared to the prior comparable period.
Manufacturing margin as a percentage of revenue was 22.2% in 2016, 20.8% in 2015 and 15.4% in 2014. The
1.4% increase in margin in 2016 compared to 2015 was primarily due to a change in product mix and improved
production efficiencies. This was partially offset by lower volumes of new railcar sales with leases attached
which typically result in higher sales prices and margins. The 5.4% increase in margin in 2015 compared to 2014
was primarily due to favorable pricing, improved production efficiencies and favorable foreign currency
exchange rates. In addition, 2015 had higher volumes of new railcar sales with leases attached which typically
result in higher sales prices and margins.
Manufacturing operating profit was $415.1 million and 19.8% of revenue for the year ended August 31, 2016,
$396.9 million and 18.6% of revenue for the year ended August 31, 2015 and $202.6 million and 12.5% of
revenue for the year ended August 31, 2014. The $18.2 million or 4.6% increase in operating profit in 2016
compared to 2015 and $194.4 million or 96.0% increase in operating profit in 2015 compared to 2014 were both
primarily attributed to higher margins.
Wheels & Parts Segment
Years ended August 31, 2016 vs 2015 2015 vs 2014
(In thousands) 2016 2015 2014Increase
(Decrease)%
ChangeIncrease
(Decrease)%
Change
Revenue $322,395 $371,237 $495,627 $(48,842) (13.2%) $(124,390) (25.1%)Cost of revenue $293,751 $334,680 $463,938 $(40,929) (12.2%) $(129,258) (27.9%)Margin (%) 8.9% 9.8% 6.4% (0.9%) * 3.4% *Operating profit ($) $ 19,948 $ 27,563 $ 40,597 $ (7,615) (27.6%) $ (13,034) (32.1%)Operating profit (%) 6.2% 7.4% 8.2% (1.2%) * (0.8%) ** Not meaningful
Wheels & Parts revenue was $322.4 million, $371.2 million and $495.6 million for the years ended August 31,
2016, 2015 and 2014. The $48.8 million or 13.2% decrease in revenue in 2016 compared to 2015 was primarily a
38 T h e G r e e n b r i e r C o m p a n i e s 2 0 1 6 A n n u a l R e p o r t

result of lower wheel set, component and parts volumes due to a decrease in demand and a decrease in scrap
metal volume and pricing. The $124.4 million or 25.1% decrease in revenue in 2015 compared to 2014 was
primarily due to 2015 excluding repair revenue as a result of contributing our Repair business to GBW, while
2014 included $138.4 million of repair revenue. The decrease in revenue was also attributed to a decrease in
scrap metal pricing.
Wheels & Parts cost of revenue was $293.8 million, $334.7 million and $463.9 million for the years ended
August 31, 2016, 2015 and 2014. Cost of revenue decreased $40.9 million or 12.2% in 2016 compared to 2015
primarily due to lower wheel set, component and parts costs associated with decreased volumes. Cost of revenue
decreased $129.3 million or 27.9% in 2015 compared to 2014 primarily due to 2015 excluding repair cost of
revenue as a result of contributing our Repair business to GBW, while 2014 included repair cost of revenue.
Wheels & Parts margin as a percentage of revenue was 8.9% for 2016, 9.8% for 2015 and 6.4% for 2014. The
0.9% decrease in margin in 2016 compared to 2015 was due to lower wheel set and component volumes and a
decrease in scrap metal pricing. These were partially offset by a more favorable parts product mix. The 3.4%
increase in margin as a percentage of revenue in 2015 compared to 2014 was primarily the result of 2015
excluding the results of our Repair operations which in the recent past have had lower margins as a percentage of
revenue than the rest of the segment. In addition, the increase in margin was due to a favorable change in wheel
pricing and a more favorable parts product mix. These were partially offset by the adverse effect of a decline in
scrap metal pricing on wheel margins during 2015.
Wheels & Parts operating profit was $19.9 million and 6.2% of revenue for the year ended August 31, 2016,
$27.6 million and 7.4% of revenue for the year ended August 31, 2015 and $40.6 million and 8.2% of revenue
for the year ended August 31, 2014. The $7.6 million or 27.6% decrease in operating profit in 2016 compared to
2015 was primarily attributable to a decrease in margin due to a decrease in volumes partially offset by $2.3
million in insurance proceeds received in excess of net book value on assets destroyed in a fire at a Wheels &
Parts facility in 2015. The $13.0 million or 32.1% decrease in operating profit in 2015 compared to 2014 was
primarily attributed to a $29.0 million pre-tax non-cash gain on contribution to joint venture in 2014. This was
partially offset by repair selling and administrative expense being excluded in 2015 as a result of contributing our
Repair business to GBW and an increase in margin in the current year.
Leasing & Services Segment
Years ended August 31, 2016 vs 2015 2015 vs 2014
(In thousands) 2016 2015 2014Increase
(Decrease)%
ChangeIncrease
(Decrease)%
Change
Revenue $260,798 $97,990 $83,419 $162,808 166.1% $14,571 17.5%
Cost of revenue $203,782 $41,831 $43,796 $161,951 387.2% $ (1,965) (4.5%)
Margin (%) 21.9% 57.3% 47.5% (35.4%) * 9.8% *
Operating profit ($) $ 51,723 $41,887 $41,055 $ 9,836 23.5% $ 832 2.0%
Operating profit (%) 19.8% 42.7% 49.2% (22.9%) * (6.5%) ** Not meaningful
Leasing & Services revenue was $260.8 million, $98.0 million and $83.4 million for the years ended August 31,
2016, 2015 and 2014. The $162.8 million or 166.1% increase in revenue in 2016 compared to 2015 was
primarily the result of the sale of railcars for $159.4 million that we purchased from a related third party with the
intent to resell them and a 14% increase in management services revenue due to the addition of new management
service agreements. This was partially offset by a lower average volume of newly built rent-producing railcars
which are held short term and classified as Leased railcars for syndication on our Consolidated Balance Sheet.
The $14.6 million or 17.5% increase in revenue in 2015 compared to 2014 was primarily the result of a higher
average volume of newly built rent-producing railcars. The increase in revenue was also attributed to a 29%
increase in management services revenue due to the addition of new management service agreements.
Leasing & Services cost of revenue was $203.8 million, $41.8 million and $43.8 million for the years ended
August 31, 2016, 2015 and 2014. Cost of revenue increased $162.0 million or 387.2% in 2016 compared to 2015
T h e G r e e n b r i e r C o m p a n i e s 2 0 1 6 A n n u a l R e p o r t 39

primarily due to costs associated with the sale of railcars that we purchased from a related third party. Cost of
revenue decreased $2.0 million or 4.5% in 2015 compared to 2014 primarily due to lower transportation costs
and a decrease in the cost of revenue associated with purchased railcars that were sold.
Leasing & Services margin as a percentage of revenue was 21.9% in 2016 compared to 57.3% in 2015 and
47.5% in 2014. The 35.4% decrease in 2016 compared to 2015 was primarily as a result of a lower margin
percentage on the syndication, or sale, of railcars purchased from a related third party and a lower average
volume of newly built rent-producing railcars. The 9.8% increase in 2015 compared to 2014 was primarily the
result of a higher average volume of rent-producing leased railcars for syndication as compared to the prior year
and lower transportation costs.
Leasing & Services operating profit was $51.7 million and 19.8% of revenue for the year ended August 31, 2016,
$41.9 million and 42.7% of revenue for the year ended August 31, 2015 and $41.1 million and 49.2% of revenue
for the year ended August 31, 2014. The $9.8 million or 23.5% increase in operating profit in 2016 compared to
2015 was primarily attributed to an $11.3 million increase in net gain on disposition of equipment and profit
from the sale of railcars that we purchased from a related third party. This was partially offset by accelerated
depreciation and amortization due to changes in the estimated useful lives of certain assets. The decrease in
operating profit as a percentage of revenue in 2016 compared to 2015 was primarily as a result of a lower margin
percentage on the syndication of railcars purchased from a related third party. The $0.8 million or 2.0% increase
in operating profit in 2015 compared to 2014 was primarily attributed to a $16.5 million increase in gross margin.
This was partially offset by a $12.8 million decrease in Net gain on disposition of equipment.
The percentage of owned units on lease excluding newly manufactured railcars not yet on lease and a recent
railcar portfolio acquisition was 91.0% at August 31, 2016 compared to 98.6% at August 31, 2015.
GBW Joint Venture Segment
GBW, an unconsolidated 50/50 joint venture, generated total revenue of $373.5 million and $349.8 million for
the year ended August 31, 2016 and 2015, respectively. The increase in revenue of $23.7 million was primarily
due an increase in volume and favorable pricing.
GBW margin as a percentage of revenue for the year ended August 31, 2016 was 9.1% compared to 6.2% for the
year ended August 31, 2015. The increase was primarily attributed to an increase in labor efficiencies in the
current year.
To reflect our 50% share of GBW’s results, we recorded earnings of $3.2 million and $0.8 million in Earnings
from unconsolidated affiliates associated with GBW for the year ended August 31, 2016 and 2015, respectively.
Selling and Administrative
Years ended August 31, 2016 vs 2015 2015 vs 2014
(In thousands) 2016 2015 2014Increase
(Decrease)%
ChangeIncrease
(Decrease)%
Change
Selling and Administrative $158,681 $151,791 $125,270 $6,890 4.5% $26,521 21.2%
Selling and administrative expense was $158.7 million, or 5.9% of revenue for the year ended August 31, 2016,
$151.8 million, or 5.8% of revenue for the year ended August 31, 2015 and $125.3 million, or 5.7% of revenue
for the year ended August 31, 2014.
The $6.9 million increase in 2016 compared to 2015 was primarily attributed to a $13.7 million increase in
employee-related costs including long-term and short-term incentive compensation, additional headcount and
employee separation costs. The increase was also attributed to a $5.1 million increase in consulting costs
primarily associated with strategic business development and IT initiatives. These were partially offset by costs
incurred in the prior year which included $6.2 million in professional fees and other transaction costs in
40 T h e G r e e n b r i e r C o m p a n i e s 2 0 1 6 A n n u a l R e p o r t

connection with a potential acquisition, $2.4 million in costs associated with our advocacy of new tank car
regulations and $1.9 million in legal, accounting and consulting costs associated with the investigation at our
Concarril manufacturing facility.
The $26.5 million increase in 2015 compared to 2014 was primarily attributed to a $14.6 million increase in
employee-related costs including long-term and short-term incentive compensation and additional headcount
based on current levels of activity, $6.2 million in professional fees and other transaction costs in 2015 in
connection with a potential acquisition, a $3.4 million increase in travel and entertainment expenses primarily for
new business development, $2.4 million in costs in 2015 associated with our advocacy of new tank car
regulations and $1.9 million in legal, accounting and consulting costs in 2015 associated with the investigation at
our Concarril manufacturing facility. These were partially offset by our Repair operations being excluded from
2015.
Net Gain on Disposition of Equipment
Net gain on disposition of equipment was $15.8 million, $1.3 million and $15.0 million for the years ended
August 31, 2016, 2015 and 2014. Net gain on disposition of equipment is primarily composed of the sale of
assets from our lease fleet (Equipment on operating leases, net) that are periodically sold in the normal course of
business in order to take advantage of market conditions and to manage risk and liquidity, along with the
disposition of property, plant and equipment.
The gain for the year ended August 31, 2016 primarily consisted of $12.0 million in gains realized on the
disposition of leased assets and property, plant and equipment and $3.5 million in insurance proceeds received in
excess of net book value on assets destroyed in fires which occurred in 2015 at a manufacturing facility and a
Wheels & Parts facility. All of the gain for the year ended August 31, 2015 was realized on the disposition of
leased assets. The gain for the year ended August 31, 2014 consists of $14.6 million in gains realized on the
disposition of leased assets and $0.4 million on the disposition of equipment related to our restructuring plan to
sell or close certain wheels, repair and parts facilities to enhance margins and improve capital efficiency.
Gain on Contribution to Joint Venture
On July 18, 2014, we and Watco contributed our respective Repair operations to a newly formed entity, GBW, an
unconsolidated 50/50 joint venture with Watco. As a result of the formation of GBW, we recognized a pre-tax
non-cash gain of $29.0 million for the year ended August 31, 2014 which was calculated as the fair value of our
50% share in GBW, less cash and intangibles contributed to GBW and an allocation in goodwill attributed to the
Repair business contributed to GBW.
Restructuring Charges
During 2013, we implemented a restructuring plan to sell or close certain wheels, repair and parts facilities to
enhance margins and improve capital efficiency. Restructuring charges related to this plan totaled $1.5 million
for the year ended August 31, 2014 and consisted of employee related termination costs, contract termination
expenses and other costs. As of August 31, 2016, all amounts related to this plan have been paid.
Interest and Foreign Exchange
Interest and foreign exchange expense was composed of the following:
(In thousands)
Years ended August 31, Increase (decrease)
2016 2015 2014 2016 vs 2015 2015 vs 2014
Interest and foreign exchange:
Interest and other expense $17,268 $18,975 $18,306 $(1,707) $ 669
Foreign exchange gain (3,766) (7,796) 389 4,030 (8,185)
$13,502 $11,179 $18,695 $ 2,323 $(7,516)
Interest and other expense increased $2.3 million in 2016 from 2015 primarily due a $4.0 million decrease in
foreign exchange gain as compared to the prior comparable period primarily attributed to the change in the
T h e G r e e n b r i e r C o m p a n i e s 2 0 1 6 A n n u a l R e p o r t 41

Mexican Peso relative to the U.S. Dollar. This was partially offset by a $1.7 million decrease in interest expense
as a result of lower average borrowings as compared to the prior year.
Interest and other expense decreased $7.5 million in 2015 from 2014 primarily due to the strengthening of the
U.S. Dollar against the Mexican Peso which resulted in a $7.8 million foreign exchange gain in 2015 compared
to a $0.4 million foreign exchange loss in 2014. This was partially offset by an increase of $0.7 million due to
higher interest expense on increased levels of average borrowings as compared to the prior comparable period.
Income Tax
In 2016 our tax expense was $112.3 million on $395.0 million of pre-tax earnings for an effective tax rate of
28.4%. In 2015 our tax expense was $112.2 million on $375.7 million of pre-tax earnings for an effective tax rate
of 29.9%. In 2014 our tax expense was $72.4 million on $220.8 million of pre-tax earnings for an effective tax
rate of 32.8%. The 2014 rate would have been 29.5% had nondeductible goodwill not reduced the gain
recognized on the contribution of our Repair operations to GBW.
Even without regard to any changes caused by nondeductible goodwill, our tax rate can fluctuate year-to year due
to changes in the mix of foreign and domestic pre-tax earnings. It can also fluctuate with changes in the
proportion of pre-tax earnings attributable to our Mexican railcar manufacturing joint venture. This is because the
joint venture is predominantly treated as a partnership for tax purposes and, as a result, the partnership’s entire
pre-tax earnings are included in Earnings before income taxes and earnings from unconsolidated affiliates,
whereas only our 50% share of the tax is included in Income tax expense.
Earnings from Unconsolidated Affiliates
Earnings from unconsolidated affiliates was $2.1 million, $1.8 million and $1.4 million for the years ended
August 31, 2016, 2015 and 2014. Earnings from unconsolidated affiliates primarily included our share of after-
tax results from GBW including eliminations associated with GBW transactions with other Greenbrier entities
and our share of after-tax results from our castings joint ventures. In addition, the year ended August 31, 2016
included our share of after-tax results from our tank head joint venture and our share of after-tax results from our
ownership stake in a railcar manufacturer in Brazil.
Net Earnings Attributable to Noncontrolling Interest
The years ended August 31, 2016, 2015 and 2014 include net earnings attributable to noncontrolling interest of
$101.6 million, $72.5 million and $37.9 million which primarily represents our joint venture partner’s share in
the results of operations of our Mexican railcar manufacturing joint venture, adjusted for intercompany sales. The
increase of $29.1 million in 2016 compared to 2015 is primarily a result of the joint venture operating at higher
production rates with higher margins. The increase of $34.6 million in 2015 compared to 2014 is primarily a
result of operating at higher production rates and improved efficiencies.
Liquidity and Capital Resources
Years Ended August 31,
(In thousands) 2016 2015 2014
Net cash provided by operating activities $ 331,670 $ 192,333 $135,907
Net cash used in investing activities (55,708) (131,531) (30,078)
Net cash used in financing activities (221,915) (62,824) (17,561)
Effect of exchange rate changes (4,298) (9,964) (787)
Net (decrease) increase in cash and cash equivalents $ 49,749 $ (11,986) $ 87,481
We have been financed through cash generated from operations and borrowings. At August 31, 2016 cash and
cash equivalents was $222.7 million, an increase of $49.8 million from $172.9 million at the prior year end.
Cash provided by operating activities was $331.7 million, $192.3 million and $135.9 million for the years ended
August 31, 2016, 2015 and 2014. The increase in 2016 compared to 2015 was primarily due to higher earnings, a
42 T h e G r e e n b r i e r C o m p a n i e s 2 0 1 6 A n n u a l R e p o r t

net change in working capital and a decrease in leased railcars for syndication. The increase in 2015 compared to
2014 was primarily due to higher earnings and a net change in working capital needs partially offset by an
increase in leased railcars for syndication due to higher levels of production moving through our lease
syndication model.
Cash used in investing activities primarily related to capital expenditures net of proceeds from the sale of assets.
Cash used in investing activities was $55.7 million, $131.5 million and $30.1 million for the years ended
August 31, 2016, 2015 and 2014. The change in 2016 compared to 2015 was primarily attributable to higher
proceeds from the sale of assets and higher capital expenditures for the year ended August 31, 2016 compared to
the prior year. The change in 2015 compared to 2014 was primarily attributed to lower proceeds from the sale of
assets and higher capital expenditures for the year ended August 31, 2015 compared to the prior year.
Capital expenditures totaled $139.0 million, $106.0 million and $70.2 million for the years ended August 31,
2016, 2015 and 2014. Proceeds from the sale of assets, which primarily related to sales of railcars from our lease
fleet within Leasing & Services, were approximately $103.7 million, $5.3 million and $54.2 million for the years
ended August 31, 2016, 2015 and 2014. Proceeds from the sale of assets for the year ended August 31, 2016
included approximately $44.1 million of equipment that was sold pursuant to sale and leaseback transactions.
Approximately $51.3 million, $84.4 million and $56.0 million of capital expenditures for the years ended
August 31, 2016, 2015 and 2014 were attributable to Manufacturing operations. Capital expenditures for
Manufacturing are expected to be approximately $45 million in 2017 and primarily relate to enhancements of our
existing manufacturing facilities.
Approximately $77.5 million, $12.2 million and $5.4 million for the years ended August 31, 2016, 2015 and
2014 of capital expenditures were attributable to Leasing & Services operations and corporate. Leasing &
Services and corporate capital expenditures for 2017 are expected to be approximately $13 million. Proceeds
from sales of leased railcar equipment are expected to be nominal for 2017. Assets from our lease fleet are
periodically sold in the normal course of business in order to take advantage of market conditions and to manage
risk and liquidity.
Approximately $10.2 million, $9.4 million and $8.8 million for the years ended August 31, 2016, 2015 and 2014
of capital expenditures were attributable to Wheels & Parts operations. Capital expenditures for Wheels & Parts
are expected to be approximately $13 million in 2017 for maintenance and enhancements of our existing
facilities.
Cash used in financing activities was $221.9 million, $62.8 million and $17.6 million for the years ended
August 31, 2016, 2015 and 2014. The change in cash used in financing activities in 2016 compared to 2015 was
primarily attributed to a net repayment of debt, an increase in cash distributions to our joint venture partner and
an increase in dividends. These were partially offset by a decrease in the repurchase of our stock. The change in
cash used in financing activities in 2015 compared to 2014 was primarily attributed to a $36.4 million increase in
the repurchase of stock, a $15.3 million increase in cash distributions to our joint venture partner and a $12.4
million increase in dividend payments.
A quarterly dividend of $0.21 per share was declared on October 20, 2016.
During the year ended August 31, 2016, we retired the remaining $14.9 million of outstanding convertible senior
notes due 2026 of which $14.0 million was retired pursuant to a scheduled put option and $0.9 million was
retired pursuant to our call option.
Since October 2013, the Board of Directors has authorized our company to repurchase in aggregate up to $225
million of our common stock. During the year ended August 31, 2016, we purchased a total of 1,054,687 shares
for approximately $32.4 million. As of August 31, 2016 we had cumulatively repurchased 3,206,226 shares for
approximately $137.0 million and had $88.0 million available under the share repurchase program which has an
expiration date of January 1, 2018.
In March 2014, we refinanced approximately $125 million of existing senior term debt, due in March 2014 and
May 2015, secured by a pool of leased railcars with new 6-year $200 million senior term debt also secured by a
pool of leased railcars and cash.
T h e G r e e n b r i e r C o m p a n i e s 2 0 1 6 A n n u a l R e p o r t 43

Senior secured credit facilities, consisting of three components, aggregated to $615.6 million as of August 31,
2016. We had an aggregate of $350.4 million available to draw down under committed credit facilities as of
August 31, 2016. This amount consists of $284.8 million available on the North American credit facility, $15.6
million on the European credit facilities and $50.0 million on the Mexican railcar manufacturing joint venture
credit facilities.
As of August 31, 2016, a $550.0 million revolving line of credit, maturing October 2020, secured by
substantially all of our assets in the U.S. not otherwise pledged as security for term loans, was available to
provide working capital and interim financing of equipment, principally for the U.S. and Mexican
operations. Advances under this facility bear interest at LIBOR plus 1.75% or Prime plus 0.75% depending on
the type of borrowing. Available borrowings under the credit facility are generally based on defined levels of
inventory, receivables, property, plant and equipment and leased equipment, as well as total debt to consolidated
capitalization and fixed charges coverage ratios.
As of August 31, 2016, lines of credit totaling $15.6 million secured by certain of our European assets, with
various variable rates that range from Warsaw Interbank Offered Rate (WIBOR) plus 1.2% to WIBOR plus
1.3%, were available for working capital needs of the European manufacturing operation. European credit
facilities are continually being renewed. Currently these European credit facilities have maturities that range
from February 2017 through June 2017.
As of August 31, 2016, our Mexican railcar manufacturing joint venture had two lines of credit totaling $50.0
million. The first line of credit provides up to $30.0 million and is fully guaranteed by us and our joint venture
partner. Advances under this facility bear interest at LIBOR plus 2.0%. The Mexican railcar manufacturing joint
venture will be able to draw against this facility through January 2019. The second line of credit provides up to
$20.0 million, of which we and our joint venture partner have each guaranteed 50%. Advances under this facility
bear interest at LIBOR plus 2.0%. The Mexican railcar manufacturing joint venture will be able to draw amounts
available under this facility through August 2017.
As of August 31, 2016, outstanding commitments under the senior secured credit facilities consisted of $81.3
million in letters of credit under the North American credit facility.
The revolving and operating lines of credit, along with notes payable, contain covenants with respect to us and
our various subsidiaries, the most restrictive of which, among other things, limit our ability to: incur additional
indebtedness or guarantees; pay dividends or repurchase stock; enter into sale leaseback transactions; create
liens; sell assets; engage in transactions with affiliates, including joint ventures and non U.S. subsidiaries,
including but not limited to loans, advances, equity investments and guarantees; enter into mergers,
consolidations or sales of substantially all our assets; and enter into new lines of business. The covenants also
require certain maximum ratios of debt to total capitalization and minimum levels of fixed charges (interest plus
rent) coverage. As of August 31, 2016, we were in compliance with all such restrictive covenants.
We may from time to time seek to repurchase or otherwise retire or exchange securities, including outstanding
borrowings and equity securities, and take other steps to reduce our debt or otherwise improve our balance
sheet. These actions may include open market repurchases, unsolicited or solicited privately negotiated
transactions or other retirements, repurchases or exchanges. Such repurchases or exchanges, if any, will depend
on a number of factors, including, but not limited to, prevailing market conditions, trading levels of our debt, our
liquidity requirements and contractual restrictions, if applicable.
We have global operations that conduct business in their local currencies as well as other currencies. To mitigate
the exposure to transactions denominated in currencies other than the functional currency, we enter into foreign
currency forward exchange contracts with established financial institutions to protect the margin on a portion of
foreign currency sales in firm backlog. Given the strong credit standing of the counterparties, no provision has
been made for credit loss due to counterparty non-performance.
As of August 31, 2016, the Mexican railcar manufacturing joint venture had $0.7 million of third party debt, of
which we and our joint venture partner have each guaranteed approximately $0.3 million.
44 T h e G r e e n b r i e r C o m p a n i e s 2 0 1 6 A n n u a l R e p o r t

In accordance with customary business practices in Europe, we have $2.6 million in third party warranty
guarantee facilities as of August 31, 2016. To date no amounts have been drawn under these guarantee facilities.
We made $7.9 million in cash contributions and $5.0 million in loans to GBW, an unconsolidated 50/50 joint
venture, for the year ended August 31, 2016. We are likely to make additional capital contributions or loans to
GBW in the future. As of August 31, 2016, we had a $36.5 million note receivable balance from GBW which is
included on the Consolidated Balance Sheet in Accounts receivable, net.
We expect existing funds and cash generated from operations, together with proceeds from financing activities
including borrowings under existing credit facilities and long-term financings, to be sufficient to fund dividends,
working capital needs, additional investments in GBW, planned capital expenditures and expected debt
repayments during the next twelve months.
The following table shows our estimated future contractual cash obligations as of August 31, 2016:
Years Ending August 31,
(In thousands) Total 2017 2018 2019 2020 2021 Thereafter
Notes payable $303,969 $ 7,437 $126,282 $ 7,000 $163,250 $ – $ –
Railcar leases 26,990 6,756 6,158 5,022 4,056 1,181 3,817
Interest (1) 26,928 9,683 9,456 5,072 2,717 – –
Operating leases 15,674 4,716 3,241 2,960 2,773 1,644 340
Contingent liability 8,720 8,720 – – – – –
Other 251 47 59 53 92 – –
$382,532 $37,359 $145,196 $20,107 $172,888 $2,825 $4,157
(1) A portion of the estimated future cash obligation relates to interest on variable rate borrowings.
Due to uncertainty with respect to the timing of future cash flows associated with our unrecognized tax benefits
at August 31, 2016, we are unable to estimate the period of cash settlement with the respective taxing authority.
Therefore, approximately $1.2 million in uncertain tax positions, including interest, have been excluded from the
contractual table above. See Note 18 to the Consolidated Financial Statements for a discussion on income taxes.
Off Balance Sheet Arrangements
We do not currently have off balance sheet arrangements that have or are likely to have a material current or
future effect on our Consolidated Financial Statements.
Critical Accounting Policies and Estimates
The preparation of financial statements in conformity with accounting principles generally accepted in the U.S.
requires judgment on the part of management to arrive at estimates and assumptions on matters that are
inherently uncertain. These estimates may affect the amount of assets, liabilities, revenue and expenses reported
in the financial statements and accompanying notes and disclosure of contingent assets and liabilities within the
financial statements. Estimates and assumptions are periodically evaluated and may be adjusted in future periods.
Actual results could differ from those estimates.
Income taxes - For financial reporting purposes, income tax expense is estimated based on amounts anticipated to
be reported on tax return filings. Those anticipated amounts may change from when the financial statements are
prepared to when the tax returns are filed. Further, because tax filings are subject to review by taxing authorities,
there is risk that a position taken in preparation of a tax return may be challenged by a taxing authority. If a
challenge is successful, differences in tax expense or between current and deferred tax items may arise in future
periods. Any material effect of such differences would be reflected in the financial statements when management
considers the effect more likely than not of occurring and the amount reasonably estimable. Valuation allowances
reduce deferred tax assets to amounts more likely than not that will be realized based on information available
when the financial statements are prepared. This information may include estimates of future income and other
assumptions that are inherently uncertain.
T h e G r e e n b r i e r C o m p a n i e s 2 0 1 6 A n n u a l R e p o r t 45

Maintenance obligations - We are responsible for maintenance on a portion of the managed and owned lease
fleet under the terms of maintenance obligations defined in the underlying lease or management agreement. The
estimated maintenance liability is based on maintenance histories for each type and age of railcar. These
estimates involve judgment as to the future costs of repairs and the types and timing of repairs required over the
lease term. As we cannot predict with certainty the prices, timing and volume of maintenance needed in the
future on railcars under long-term leases, this estimate is uncertain and could be materially different from
maintenance requirements. The liability is periodically reviewed and updated based on maintenance trends and
known future repair or refurbishment requirements. These adjustments could be material due to the inherent
uncertainty in predicting future maintenance requirements.
Warranty accruals - Warranty costs to cover a defined warranty period are estimated and charged to operations.
The estimated warranty cost is based on historical warranty claims for each particular product type. For new
product types without a warranty history, preliminary estimates are based on historical information for similar
product types. These estimates are inherently uncertain as they are based on historical data for existing products
and judgment for new products. If warranty claims are made in the current period for issues that have not
historically been the subject of warranty claims and were not taken into consideration in establishing the accrual
or if claims for issues already considered in establishing the accrual exceed expectations, warranty expense may
exceed the accrual for that particular product. Conversely, there is the possibility that claims may be lower than
estimates. The warranty accrual is periodically reviewed and updated based on warranty trends. However, as we
cannot predict future claims, the potential exists for the difference in any one reporting period to be material.
Environmental costs - At times we may be involved in various proceedings related to environmental matters. We
estimate future costs for known environmental remediation requirements and accrue for them when it is probable
that we have incurred a liability and the related costs can be reasonably estimated based on currently available
information. If further developments in or resolution of an environmental matter result in facts and circumstances
that are significantly different than the assumptions used to develop these reserves, the accrual for environmental
remediation could be materially understated or overstated. Adjustments to these liabilities are made when
additional information becomes available that affects the estimated costs to study or remediate any environmental
issues or when expenditures for which reserves are established are made. Due to the uncertain nature of
environmental matters, there can be no assurance that we will not become involved in future litigation or other
proceedings or, if we were found to be responsible or liable in any litigation or proceeding, that such costs would
not be material to us.
Revenue recognition - Revenue is recognized when persuasive evidence of an arrangement exists, delivery has
occurred or services have been rendered, the price is fixed or determinable and collectability is reasonably
assured.
Railcars are generally manufactured, repaired or refurbished and wheels and parts produced under firm orders
from third parties. Revenue is recognized when these products or services are completed, accepted by an
unaffiliated customer and contractual contingencies removed. Certain leases are operated under car hire
arrangements whereby revenue is earned based on utilization, car hire rates and terms specified in the lease
agreement. Car hire revenue is reported from a third party source two months in arrears; however, such revenue
is accrued in the month earned based on estimates of use from historical activity and is adjusted to actual as
reported. These estimates are inherently uncertain as they involve judgment as to the estimated use of each
railcar. Adjustments to actual have historically not been significant. Revenues from construction of marine
barges are either recognized on the percentage of completion method during the construction period or on the
completed contract method based on the terms of the contract. Under the percentage of completion method,
judgment is used to determine a definitive threshold against which progress towards completion can be measured
to determine timing of revenue recognition. Under the percentage of completion method, revenue is recognized
based on the progress toward contract completion measured by actual costs incurred to date in relation to the
estimate of total expected costs. Under the completed contract method, revenue is not recognized until the project
has been fully completed.
We will periodically sell railcars with leases attached to financial investors. Revenue and cost of revenue
associated with railcars that the Company has manufactured are recognized in Manufacturing once sold. Revenue
and cost of revenue associated with railcars which were obtained from a third party with the intent to resell them
46 T h e G r e e n b r i e r C o m p a n i e s 2 0 1 6 A n n u a l R e p o r t

and subsequently sold are recognized in Leasing & Services. In addition we will often perform management or
maintenance services at market rates for these railcars. Pursuant to the guidance in Accounting Standards
Codification (ASC) 840-20-40, we evaluate the terms of any remarketing agreements and any contractual
provisions that represent retained risk and the level of retained risk based on those provisions. We determine
whether the level of retained risk exceeds 10% of the individual fair value of the railcars with leases attached that
are delivered. For any contracts with multiple elements (i.e. railcars, maintenance, management services, etc.) we
allocate revenue among the deliverables primarily based upon objective and reliable evidence of the fair value of
each element in the arrangement. If objective and reliable evidence of fair value of any element is not available,
we will use the element’s estimated selling price for purposes of allocating the total arrangement consideration
among the elements.
Impairment of long-lived assets - When changes in circumstances indicate the carrying amount of certain long-
lived assets may not be recoverable, the assets are evaluated for impairment. If the forecast undiscounted future
cash flows are less than the carrying amount of the assets, an impairment charge to reduce the carrying value of
the assets to fair value is recognized in the current period. These estimates are based on the best information
available at the time of the impairment and could be materially different if circumstances change. If the forecast
undiscounted future cash flows exceeded the carrying amount of the assets it would indicate that the assets were
not impaired.
Goodwill and acquired intangible assets - We periodically acquire businesses in purchase transactions in which
the allocation of the purchase price may result in the recognition of goodwill and other intangible assets. The
determination of the value of such intangible assets requires management to make estimates and assumptions.
These estimates affect the amount of future period amortization and possible impairment charges.
Goodwill and indefinite-lived intangible assets are tested for impairment annually during the third quarter.
Goodwill and indefinite-lived intangible assets are also tested more frequently if changes in circumstances or the
occurrence of events indicates that a potential impairment exists. When changes in circumstances, such as a
decline in the market price of our common stock, changes in demand or in the numerous variables associated
with the judgments, assumptions and estimates made in assessing the appropriate valuation of goodwill indicate
the carrying amount of certain indefinite lived assets may not be recoverable, the assets are evaluated for
impairment. Among other things, our assumptions used in the valuation of goodwill include growth of revenue
and margins, market multiples, discount rates and increased cash flows over time. If actual operating results were
to differ from these assumptions, it may result in an impairment of our goodwill.
The provisions of ASC 350, Intangibles - Goodwill and Other, require that we perform a two-step impairment
test on goodwill. In the first step, we compare the fair value of each reporting unit with its carrying value. We
determine the fair value of our reporting units based on a weighting of income and market approaches. Under the
income approach, we calculate the fair value of a reporting unit based on the present value of estimated future
cash flows. Under the market approach, we estimate the fair value based on observed market multiples for
comparable businesses. The second step of the goodwill impairment test is required only in situations where the
carrying value of the reporting unit exceeds its fair value as determined in the first step. In the second step, we
would compare the implied fair value of goodwill to its carrying value. The implied fair value of goodwill is
determined by allocating the fair value of a reporting unit to all of the assets and liabilities of that unit as if the
reporting unit had been acquired in a business combination and the fair value of the reporting unit was the price
paid to acquire the reporting unit. The excess of the fair value of a reporting unit over the amounts assigned to its
assets and liabilities is the implied fair value of goodwill. An impairment loss is recorded to the extent that the
carrying amount of the reporting unit goodwill exceeds the implied fair value of that goodwill. The goodwill
balance relates to the Wheels & Parts segment.
New Accounting Pronouncements
See Note 2 of Notes to Consolidated Financial Statements included in Part II, Item 8 of this Annual Report on
Form 10-K.
T h e G r e e n b r i e r C o m p a n i e s 2 0 1 6 A n n u a l R e p o r t 47

Item 7A. QUANTITATIVE AND QUALITATIVE DISCLOSURES ABOUT MARKETRISK
Foreign Currency Exchange Risk
We have global operations that conduct business in their local currencies as well as other currencies. To mitigate
the exposure to transactions denominated in currencies other than the functional currency of each entity, we enter
into foreign currency forward exchange contracts to protect revenue or margin on a portion of forecast foreign
currency sales and expenses. At August 31, 2016 exchange rates, forward exchange contracts for the purchase of
Polish Zlotys and the sale of Euros and U.S. Dollars; and for the purchase of U.S. Dollars and the sale of Saudi
Riyals aggregated to $405.2 million. Because of the variety of currencies in which purchases and sales are
transacted and the interaction between currency rates, it is not possible to predict the impact a movement in a
single foreign currency exchange rate would have on future operating results.
In addition to exposure to transaction gains or losses, we are also exposed to foreign currency exchange risk
related to the net asset position of our foreign subsidiaries where the functional currency is not U.S. Dollars. At
August 31, 2016, net assets of foreign subsidiaries aggregated $79.2 million and a 10% strengthening of the U.S.
Dollar relative to the foreign currencies would result in a decrease in equity of $7.9 million, or 0.9% of Total
equity – Greenbrier. This calculation assumes that each exchange rate would change in the same direction
relative to the U.S. Dollar.
Interest Rate Risk
We have managed a portion of our variable rate debt with interest rate swap agreements, effectively converting
$92.1 million of variable rate debt to fixed rate debt. As a result, we are exposed to interest rate risk relating to
our revolving debt and a portion of term debt, which are at variable rates. At August 31, 2016, 69% of our
outstanding debt had fixed rates and 31% had variable rates. At August 31, 2016, a uniform 10% increase in
variable interest rates would result in approximately $0.2 million of additional annual interest expense.
48 T h e G r e e n b r i e r C o m p a n i e s 2 0 1 6 A n n u a l R e p o r t

Report of Independent Registered Public Accounting Firm
The Board of Directors and Stockholders
The Greenbrier Companies, Inc. and subsidiaries:
We have audited the accompanying consolidated balance sheets of The Greenbrier Companies, Inc. and
subsidiaries (the “Company”) as of August 31, 2016 and 2015, and the related consolidated statements of
income, comprehensive income, equity, and cash flows for each of the years in the three-year period ended
August 31, 2016. These consolidated financial statements are the responsibility of the Company’s management.
Our responsibility is to express an opinion on these consolidated financial statements based on our audits.
We conducted our audits in accordance with the standards of the Public Company Accounting Oversight Board
(United States). Those standards require that we plan and perform the audit to obtain reasonable assurance about
whether the financial statements are free of material misstatement. An audit includes examining, on a test basis,
evidence supporting the amounts and disclosures in the financial statements. An audit also includes assessing the
accounting principles used and significant estimates made by management, as well as evaluating the overall
financial statement presentation. We believe that our audits provide a reasonable basis for our opinion.
In our opinion, the consolidated financial statements referred to above present fairly, in all material respects, the
financial position of The Greenbrier Companies, Inc. and subsidiaries as of August 31, 2016 and 2015, and the
results of their operations and their cash flows for each of the years in the three-year period ended August 31,
2016, in conformity with U.S. generally accepted accounting principles.
We also have audited, in accordance with the standards of the Public Company Accounting Oversight Board
(United States), The Greenbrier Companies, Inc. and subsidiaries’ internal control over financial reporting as of
August 31, 2016, based on criteria established in Internal Control – Integrated Framework (2013) issued by the
Committee of Sponsoring Organizations of the Treadway Commission (COSO), and our report dated October 25,
2016 expressed an unqualified opinion on the effectiveness of the Company’s internal control over financial
reporting.
/s/ KPMG LLP
Portland, OR
October 25, 2016
T h e G r e e n b r i e r C o m p a n i e s 2 0 1 6 A n n u a l R e p o r t 49

Item 8. FINANCIAL STATEMENTS AND SUPPLEMENTARY DATA
Consolidated Balance SheetsAS OF AUGUST 31,
(In thousands) 2016 2015
Assets
Cash and cash equivalents $ 222,679 $ 172,930
Restricted cash 24,279 8,869
Accounts receivable, net 232,517 196,029
Inventories 365,805 445,535
Leased railcars for syndication 144,932 212,534
Equipment on operating leases, net 306,266 255,391
Property, plant and equipment, net 329,990 303,135
Investment in unconsolidated affiliates 98,682 87,270
Intangibles and other assets, net 69,475 65,554
Goodwill 43,265 43,265
$1,837,890 $1,790,512
Liabilities and Equity
Revolving notes $ – $ 50,888
Accounts payable and accrued liabilities 369,754 455,213
Deferred income taxes 51,619 60,657
Deferred revenue 95,721 33,836
Notes payable 303,969 326,429
Commitments and contingencies (Notes 21 & 22)
Equity:
Greenbrier
Preferred stock – without par value; 25,000 shares authorized; none outstanding – –
Common stock – without par value; 50,000 shares authorized; 28,205 and 28,907
outstanding at August 31, 2016 and 2015 – –
Additional paid-in capital 282,886 295,444
Retained earnings 618,178 458,599
Accumulated other comprehensive loss (26,753) (21,205)
Total equity – Greenbrier 874,311 732,838
Noncontrolling interest 142,516 130,651
Total equity 1,016,827 863,489
$1,837,890 $1,790,512
The accompanying notes are an integral part of these financial statements.
50 T h e G r e e n b r i e r C o m p a n i e s 2 0 1 6 A n n u a l R e p o r t

Consolidated Statements of IncomeYEARS ENDED AUGUST 31,
(In thousands, except per share amounts) 2016 2015 2014
Revenue
Manufacturing $2,096,331 $2,136,051 $1,624,916
Wheels & Parts 322,395 371,237 495,627
Leasing & Services 260,798 97,990 83,419
2,679,524 2,605,278 2,203,962
Cost of revenue
Manufacturing 1,630,554 1,691,414 1,374,008
Wheels & Parts 293,751 334,680 463,938
Leasing & Services 203,782 41,831 43,796
2,128,087 2,067,925 1,881,742
Margin 551,437 537,353 322,220
Selling and administrative 158,681 151,791 125,270
Net gain on disposition of equipment (15,796) (1,330) (15,039)
Gain on contribution to joint venture – – (29,006)
Restructuring charges – – 1,475
Earnings from operations 408,552 386,892 239,520
Other costs
Interest and foreign exchange 13,502 11,179 18,695
Earnings before income tax and earnings from unconsolidated affiliates 395,050 375,713 220,825
Income tax expense (112,322) (112,160) (72,401)
Earnings before earnings from unconsolidated affiliates 282,728 263,553 148,424
Earnings from unconsolidated affiliates 2,096 1,756 1,355
Net earnings 284,824 265,309 149,779
Net earnings attributable to noncontrolling interest (101,611) (72,477) (37,860)
Net earnings attributable to Greenbrier $ 183,213 $ 192,832 $ 111,919
Basic earnings per common share: $ 6.28 $ 6.85 $ 3.97
Diluted earnings per common share: $ 5.73 $ 5.93 $ 3.44
Weighted average common shares:
Basic 29,156 28,151 28,164
Diluted 32,468 33,328 34,209
Dividends declared per common share $ 0.81 $ 0.60 $ 0.15
The accompanying notes are an integral part of these financial statements.
T h e G r e e n b r i e r C o m p a n i e s 2 0 1 6 A n n u a l R e p o r t 51
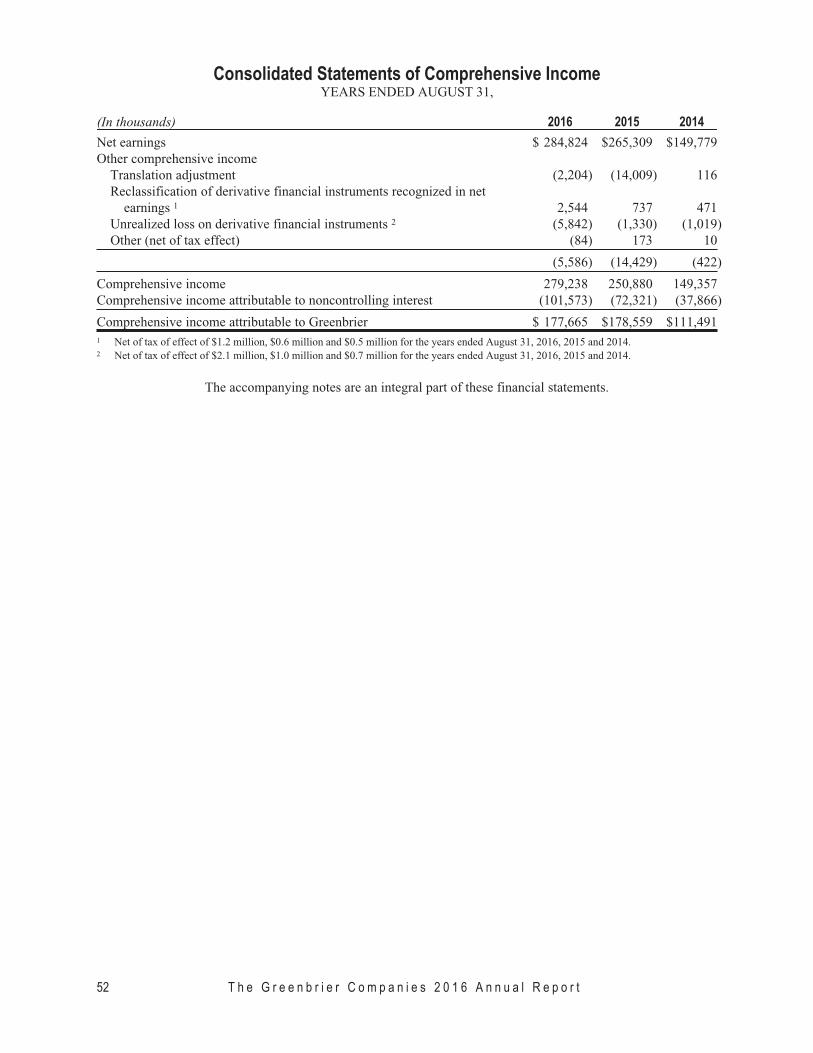
Consolidated Statements of Comprehensive IncomeYEARS ENDED AUGUST 31,
(In thousands) 2016 2015 2014
Net earnings $ 284,824 $265,309 $149,779
Other comprehensive income
Translation adjustment (2,204) (14,009) 116
Reclassification of derivative financial instruments recognized in net
earnings 1 2,544 737 471
Unrealized loss on derivative financial instruments 2 (5,842) (1,330) (1,019)
Other (net of tax effect) (84) 173 10
(5,586) (14,429) (422)
Comprehensive income 279,238 250,880 149,357
Comprehensive income attributable to noncontrolling interest (101,573) (72,321) (37,866)
Comprehensive income attributable to Greenbrier $ 177,665 $178,559 $111,491
1 Net of tax of effect of $1.2 million, $0.6 million and $0.5 million for the years ended August 31, 2016, 2015 and 2014.2 Net of tax of effect of $2.1 million, $1.0 million and $0.7 million for the years ended August 31, 2016, 2015 and 2014.
The accompanying notes are an integral part of these financial statements.
52 T h e G r e e n b r i e r C o m p a n i e s 2 0 1 6 A n n u a l R e p o r t

Consolidated Statements of Equity
Attributable to Greenbrier
(In thousands)
CommonStock
Shares
AdditionalPaid-inCapital
RetainedEarnings
AccumulatedOther
ComprehensiveLoss
TotalAttributable
to Greenbrier
Attributable toNoncontrolling
InterestTotal
Equity
Balance September 1, 2013 28,084 $259,864 $174,842 $ (6,504) $428,202 $ 28,625 $ 456,827Net earnings – – 111,919 – 111,919 37,860 149,779Other comprehensive income (loss), net – – – (428) (428) 6 (422)Noncontrolling interest adjustments – – – – – 2,774 2,774Investment by joint venture partner – – – – – 419 419Joint venture partner distribution declared – – – – – (7,353) (7,353)Restricted stock awards (net of cancellations
and expense) 44 11,303 – – 11,303 – 11,303Unamortized restricted stock – (12,360) – – (12,360) – (12,360)Restricted stock amortization – 11,285 – – 11,285 – 11,285Excess tax benefit from restricted stock
awards – 109 – – 109 – 109Dividends – – (4,202) – (4,202) – (4,202)Repurchase of stock (764) (34,438) – – (34,438) – (34,438)
Balance August 31, 2014 27,364 $235,763 $282,559 $ (6,932) $511,390 $ 62,331 $ 573,721Net earnings – – 192,832 – 192,832 72,477 265,309Other comprehensive loss, net – – – (14,273) (14,273) (156) (14,429)Noncontrolling interest adjustments – – – – – 17,215 17,215Purchase of noncontrolling interest – – – – – (80) (80)Joint venture partner distribution declared – – – – – (21,136) (21,136)Restricted stock awards (net of
cancellations) (15) 22,622 – – 22,622 – 22,622Unamortized restricted stock – (24,477) – – (24,477) – (24,477)Restricted stock amortization – 19,459 – – 19,459 – 19,459Excess tax benefit from restricted stock
awards – 2,908 – – 2,908 – 2,908Conversion of convertible notes, net of debt
issuance costs 2,945 109,387 – – 109,387 – 109,387Dividends – – (16,792) – (16,792) – (16,792)Repurchase of stock (1,387) (70,218) – – (70,218) – (70,218)
Balance August 31, 2015 28,907 $295,444 $458,599 $(21,205) $732,838 $130,651 $ 863,489Net earnings – – 183,213 – 183,213 101,611 284,824Other comprehensive loss, net – – – (5,548) (5,548) (38) (5,586)Noncontrolling interest adjustments – – – – – 526 526Purchase of noncontrolling interest – – – – – (1,195) (1,195)Joint venture partner distribution declared – – – – – (94,439) (94,439)Investment by joint venture partner – – – – – 5,400 5,400Restricted stock awards (net of
cancellations) 353 6,055 – – 6,055 – 6,055Unamortized restricted stock – (11,555) – – (11,555) – (11,555)Restricted stock amortization – 22,502 – – 22,502 – 22,502Excess tax benefit from restricted stock
awards – 2,813 – – 2,813 – 2,813Dividends – – (23,634) – (23,634) – (23,634)Repurchase of stock (1,055) (32,373) – – (32,373) – (32,373)
Balance August 31, 2016 28,205 $282,886 $618,178 $(26,753) $874,311 $142,516 $1,016,827
The accompanying notes are an integral part of these financial statements.
T h e G r e e n b r i e r C o m p a n i e s 2 0 1 6 A n n u a l R e p o r t 53

Consolidated Statements of Cash FlowsYEARS ENDED AUGUST 31,
(In thousands) 2016 2015 2014
Cash flows from operating activities:Net earnings $ 284,824 $ 265,309 $ 149,779Adjustments to reconcile net earnings to net cash provided by operating activities:Deferred income taxes (8,935) (20,151) (4,687)Depreciation and amortization 63,345 45,156 40,422Net gain on disposition of equipment (15,796) (1,330) (15,039)Stock based compensation expense 24,037 19,459 11,285Gain on contribution to joint venture – – (29,006)Noncontrolling interest adjustments 526 17,215 2,774Other 560 1,184 576Decrease (increase) in assets:
Accounts receivable, net (32,051) 13,652 (23,749)Inventories 53,711 (143,849) (9,675)Leased railcars for syndication 19,154 (90,614) (57,779)Other (16,989) 575 (4,069)
Increase (decrease) in liabilities:Accounts payable and accrued liabilities (91,428) 72,419 63,362Deferred revenue 50,712 13,308 11,713
Net cash provided by operating activities 331,670 192,333 135,907
Cash flows from investing activities:Proceeds from sales of assets 103,715 5,295 54,235Capital expenditures (139,013) (105,989) (70,227)Decrease (increase) in restricted cash (15,410) 271 (333)Investment in and advances to unconsolidated affiliates (12,855) (34,453) (13,753)Cash distribution from joint ventures 7,855 3,345 –
Net cash used in investing activities (55,708) (131,531) (30,078)
Cash flows from financing activities:Net changes in revolving notes with maturities of 90 days or less (49,000) 49,000 –Proceeds from revolving notes with maturities longer than 90 days – 44,451 37,819Repayments of revolving notes with maturities longer than 90 days (1,888) (55,644) (72,947)Proceeds from issuance of notes payable – – 200,000Repayments of notes payable (22,299) (7,475) (128,797)Debt issuance costs (4,161) – (382)Decrease (increase) in restricted cash – 11,000 (11,000)Repurchase of stock (33,498) (69,950) (33,583)Dividends (23,303) (16,491) (4,123)Cash distribution to joint venture partner (95,092) (20,375) (5,076)Investment by joint venture partner 5,400 – 419Excess tax benefit from restricted stock awards 2,813 2,908 109Other (887) (248) –
Net cash used in financing activities (221,915) (62,824) (17,561)
Effect of exchange rate changes (4,298) (9,964) (787)Increase (decrease) in cash and cash equivalents 49,749 (11,986) 87,481Cash and cash equivalentsBeginning of period 172,930 184,916 97,435
End of period $ 222,679 $ 172,930 $ 184,916
Cash paid during the period for:Interest $ 12,277 $ 15,535 $ 14,347Income taxes, net $ 125,455 $ 139,960 $ 69,263Non-cash activity
Transfer from Leased railcars for syndication to Equipment on operating leases, net $ 48,096 $ 3,313 $ –Transfer from Inventories to Equipment on operating leases, net $ 25,069 $ – $ –Capital expenditures accrued in Accounts payable and accrued liabilities $ 8,408 $ 8,758 $ 3,349Change in Accounts payable and accrued liabilities associated with cash distributions
to joint venture partner $ 652 $ – $ –Change in Accounts payable and accrued liabilities associated with repurchase of stock $ 1,125 $ 268 $ –Transfer of Property, plant and equipment, net to Intangibles and other assets, net $ 588 $ 4,045 $ –Change in Accounts payable and accrued liabilities associated with dividends declared $ (331) $ 301 $ 79Conversion of convertible notes, net of debt issuance costs $ – $ 109,387 $ –Transfer of Inventories to Accounts receivable, net $ – $ – $ 20,986
The accompanying notes are an integral part of these financial statements.
54 T h e G r e e n b r i e r C o m p a n i e s 2 0 1 6 A n n u a l R e p o r t

Notes to Consolidated Financial Statements
Note 1 - Nature of Operations
The Greenbrier Companies, Inc. and its subsidiaries currently operate in four reportable segments:
Manufacturing; Wheels & Parts; Leasing & Services; and GBW Joint Venture. The segments are operationally
integrated. The Manufacturing segment, operating from facilities in the United States, Mexico and Poland,
produces double-stack intermodal railcars, tank cars, conventional railcars, automotive railcar products and
marine vessels. The Wheels & Parts segment performs wheel and axle servicing in North America and
production of a variety of parts for the railroad industry. The Leasing & Services segment owns approximately
8,900 railcars (6,600 railcars held as equipment on operating leases, 2,200 held as leased railcars for syndication
and 100 held as finished goods inventory) and provides management services for approximately 264,000 railcars
for railroads, shippers, carriers, institutional investors and other leasing and transportation companies in North
America. The GBW Joint Venture segment provides repair services at over 30 locations across North America,
including more than 10 tank car repair and maintenance facilities certified by the Association of American
Railroads (AAR). The results of these operations were included as part of Earnings from unconsolidated affiliates
as the Company accounts for their interest in GBW under the equity method of accounting. Through
unconsolidated joint ventures the Company also produces rail castings, tank heads and other components and has
a direct and indirect 35% ownership stake in a railcar manufacturer in Brazil.
Note 2 - Summary of Significant Accounting Policies
Principles of consolidation - The financial statements include the accounts of the Company and its subsidiaries in
which it has a controlling interest. All intercompany transactions and balances are eliminated upon consolidation.
Unclassified balance sheet - The balance sheets of the Company are presented in an unclassified format as a
result of significant leasing activities for which the current or non-current distinction is not relevant. In addition,
the activities of the Manufacturing; Wheels & Parts; and Leasing & Services segments are so intertwined that in
the opinion of management, any attempt to separate the respective balance sheet categories would not be
meaningful and may lead to the development of misleading conclusions by the reader.
Foreign currency translation - Certain operations outside the U.S., primarily in Poland, prepare financial
statements in currencies other than the U.S. Dollar. Revenues and expenses are translated at average exchange
rates for the year, while assets and liabilities are translated at year-end exchange rates. Translation adjustments
are accumulated as a separate component of equity in other comprehensive income (loss). The foreign currency
translation adjustment balances were $20.8 million, $18.7 million and $4.8 million as of August 31, 2016, 2015
and 2014.
Cash and cash equivalents - Cash may temporarily be invested primarily in money market funds. All highly-
liquid investments with a maturity of three months or less at the date of acquisition are considered cash
equivalents.
Restricted cash - Restricted cash primarily relates to amounts associated with funds temporarily held in
connection with a performance guarantee as part of a recent transaction, amounts held to support a target
minimum rate of return on certain agreements and a pass through account for activity related to management
services provided for certain third party customers.
T h e G r e e n b r i e r C o m p a n i e s 2 0 1 6 A n n u a l R e p o r t 55

Accounts receivable - Accounts receivable includes receivables from related parties (see Note 17 – Related Party
Transactions) and is stated net of allowance for doubtful accounts of $2.2 million and $2.4 million as of
August 31, 2016 and 2015.
As of August 31,
(In thousands) 2016 2015 2014
Allowance for doubtful accountsBalance at beginning of period $2,449 $2,033 $ 3,894Additions, net of reversals 70 684 604Usage (277) (108) (2,524)Currency translation effect (27) (160) 59
Balance at end of period $2,215 $2,449 $ 2,033
Inventories - Inventories are valued at the lower of cost or market using the first-in first-out method. Work-in-
process includes material, labor and overhead. Finished goods includes completed wheels, parts and railcars not
on lease or in transit.
Leased railcars for syndication - Leased railcars for syndication consist of newly-built railcars manufactured at
one of the Company’s facilities or railcars purchased from a third party, which have been placed on lease to a
customer and which the Company intends to sell to an investor with the lease attached. These railcars are
generally anticipated to be sold within six months of delivery of the last railcar or six months from when the
Company acquires the railcar from a third party and are typically not depreciated during that period as the
Company does not believe any economic value of a railcar is lost in the first six months. In the event the railcars
are not sold in the first six months, the railcars are either held in Leased railcars for syndication and are
depreciated or are transferred to Equipment on operating leases and are depreciated. As of August 31, 2016,
Leased railcars for syndication was $144.9 million compared to $212.5 million as of August 31, 2015.
Equipment on operating leases, net - Equipment on operating leases is stated net of accumulated depreciation.
Depreciation to estimated salvage value is provided on the straight-line method over the estimated useful lives of
up to thirty-five years. Management periodically reviews salvage value estimates based on current scrap prices
and what the Company expects to receive upon disposal.
Investment in unconsolidated affiliates - Investment in unconsolidated affiliates includes the Company’s interests
which are accounted for under the equity method of accounting. As of August 31, 2016 this included the
Company’s 50% interest in GBW Railcar Services LLC, 33% interest in Ohio Castings Company LLC, 19.5%
interest in Greenbrier-Maxion, 19.5% interest in Amsted-Maxion Cruzeiro (which owns 80.5% of Greenbrier-
Maxion), 50% interest in GGSynergy SA de C.V., 8% interest in MUL Greenbrier LLC and a 1% interest in each
of Green Union I Trust, Green Union II Trust and Green Union III Trust.
Property, plant and equipment - Property, plant and equipment is stated at cost, net of accumulated depreciation.
Depreciation is provided on the straight-line method over estimated useful lives which are as follows:
DepreciableLife
Buildings and improvements 10 – 25 yearsMachinery and equipment 3 – 15 yearsOther 3 – 7 years
Goodwill - Goodwill is recorded when the purchase price of an acquisition exceeds the fair market value of the
net assets acquired. Goodwill is not amortized and is tested for impairment at least annually and more frequently
if material changes in events or circumstances arise. The provisions of ASC 350, Intangibles – Goodwill and
Other, require the Company to perform a two-step impairment test on goodwill. In the first step, the Company
compares the fair value of each reporting unit with its carrying value. The second step of the goodwill
impairment test is required only in situations where the carrying value of the reporting unit exceeds its fair value
as determined in the first step. In the second step, the Company compares the implied fair value of goodwill to its
carrying value. An impairment loss is recorded to the extent that the carrying amount of the reporting unit
goodwill exceeded the implied fair value of that goodwill.
56 T h e G r e e n b r i e r C o m p a n i e s 2 0 1 6 A n n u a l R e p o r t

Intangible and other assets, net - Intangible assets are recorded when a portion of the purchase price of an
acquisition is allocated to assets such as customer contracts and relationships and trade names. Intangible assets
with finite lives are amortized using the straight line method over their estimated useful lives and primarily
include long-term customer agreements which are amortized over 5 to 20 years. Other assets include loan fees
and debt acquisition costs which are capitalized and amortized as interest expense over the life of the related
borrowings.
Impairment of long-lived assets - When changes in circumstances indicate the carrying amount of certain long-
lived assets may not be recoverable, the assets are evaluated for impairment. If the forecasted undiscounted
future cash flows are less than the carrying amount of the assets, an impairment charge to reduce the carrying
value of the assets to estimated realizable value is recognized in the current period. No impairment was recorded
in the years ended August 31, 2016, 2015 and 2014.
Maintenance obligations - The Company is responsible for maintenance on a portion of the managed and owned
lease fleet under the terms of maintenance obligations defined in the underlying lease or management agreement.
The estimated liability is based on maintenance histories for each type and age of railcar. The liability, included
in Accounts payable and accrued liabilities, is reviewed periodically and updated based on maintenance trends
and known future repair or refurbishment requirements.
Warranty accruals - Warranty costs are estimated and charged to operations to cover a defined warranty period.
The estimated warranty cost is based on history of warranty claims for each particular product type. For new
product types without a warranty history, preliminary estimates are based on historical information for similar
product types. The warranty accruals, included in Accounts payable and accrued liabilities, are reviewed
periodically and updated based on warranty trends.
Income taxes - The liability method is used to account for income taxes. Deferred income taxes are provided for
the temporary effects of differences between assets and liabilities recognized for financial statement and income
tax reporting purposes. Valuation allowances reduce deferred tax assets to an amount that will more likely than
not be realized. As a result, we recognize liabilities for uncertain tax positions based on whether evidence
indicates that it is more likely than not that the position will be sustained on audit. It is inherently difficult and
subjective to estimate such amounts, as this requires us to estimate the probability of various possible outcomes.
The Company reevaluates these uncertain tax positions on a quarterly basis. Changes in assumptions may result
in the recognition of a tax benefit or an additional charge to the tax provision.
Noncontrolling interest - The Company has a joint venture with Grupo Industrial Monclova, S.A. (GIMSA) that
manufactures new railroad freight cars for the North American marketplace at GIMSA’s existing manufacturing
facility located in Frontera, Mexico. Each party owns a 50% interest in the joint venture. The financial results of
this operation are consolidated for financial reporting purposes as the Company maintains a controlling interest
as evidenced by the right to appoint the majority of the Board of Directors, control over accounting, financing,
marketing and engineering and approval and design of products. The noncontrolling interest reflected in the
Company’s consolidated financial statements primarily represents the joint venture partner’s equity in this
venture.
T h e G r e e n b r i e r C o m p a n i e s 2 0 1 6 A n n u a l R e p o r t 57
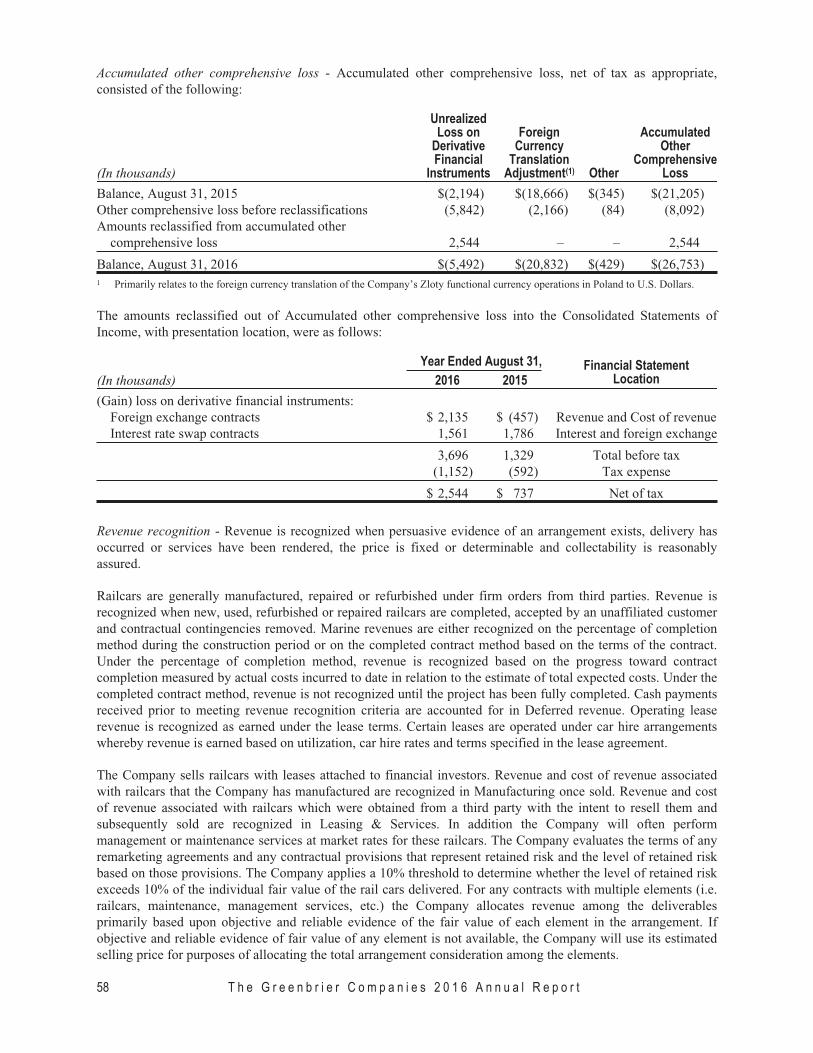
Accumulated other comprehensive loss - Accumulated other comprehensive loss, net of tax as appropriate,
consisted of the following:
(In thousands)
UnrealizedLoss on
DerivativeFinancial
Instruments
ForeignCurrency
TranslationAdjustment(1) Other
AccumulatedOther
ComprehensiveLoss
Balance, August 31, 2015 $(2,194) $(18,666) $(345) $(21,205)
Other comprehensive loss before reclassifications (5,842) (2,166) (84) (8,092)
Amounts reclassified from accumulated other
comprehensive loss 2,544 – – 2,544
Balance, August 31, 2016 $(5,492) $(20,832) $(429) $(26,753)
1 Primarily relates to the foreign currency translation of the Company’s Zloty functional currency operations in Poland to U.S. Dollars.
The amounts reclassified out of Accumulated other comprehensive loss into the Consolidated Statements of
Income, with presentation location, were as follows:
Year Ended August 31, Financial StatementLocation(In thousands) 2016 2015
(Gain) loss on derivative financial instruments:
Foreign exchange contracts $ 2,135 $ (457) Revenue and Cost of revenue
Interest rate swap contracts 1,561 1,786 Interest and foreign exchange
3,696 1,329 Total before tax
(1,152) (592) Tax expense
$ 2,544 $ 737 Net of tax
Revenue recognition - Revenue is recognized when persuasive evidence of an arrangement exists, delivery has
occurred or services have been rendered, the price is fixed or determinable and collectability is reasonably
assured.
Railcars are generally manufactured, repaired or refurbished under firm orders from third parties. Revenue is
recognized when new, used, refurbished or repaired railcars are completed, accepted by an unaffiliated customer
and contractual contingencies removed. Marine revenues are either recognized on the percentage of completion
method during the construction period or on the completed contract method based on the terms of the contract.
Under the percentage of completion method, revenue is recognized based on the progress toward contract
completion measured by actual costs incurred to date in relation to the estimate of total expected costs. Under the
completed contract method, revenue is not recognized until the project has been fully completed. Cash payments
received prior to meeting revenue recognition criteria are accounted for in Deferred revenue. Operating lease
revenue is recognized as earned under the lease terms. Certain leases are operated under car hire arrangements
whereby revenue is earned based on utilization, car hire rates and terms specified in the lease agreement.
The Company sells railcars with leases attached to financial investors. Revenue and cost of revenue associated
with railcars that the Company has manufactured are recognized in Manufacturing once sold. Revenue and cost
of revenue associated with railcars which were obtained from a third party with the intent to resell them and
subsequently sold are recognized in Leasing & Services. In addition the Company will often perform
management or maintenance services at market rates for these railcars. The Company evaluates the terms of any
remarketing agreements and any contractual provisions that represent retained risk and the level of retained risk
based on those provisions. The Company applies a 10% threshold to determine whether the level of retained risk
exceeds 10% of the individual fair value of the rail cars delivered. For any contracts with multiple elements (i.e.
railcars, maintenance, management services, etc.) the Company allocates revenue among the deliverables
primarily based upon objective and reliable evidence of the fair value of each element in the arrangement. If
objective and reliable evidence of fair value of any element is not available, the Company will use its estimated
selling price for purposes of allocating the total arrangement consideration among the elements.
58 T h e G r e e n b r i e r C o m p a n i e s 2 0 1 6 A n n u a l R e p o r t

Interest and foreign exchange - Includes foreign exchange transaction gains and losses, amortization of loan fee
expense, accretion of debt discounts and external interest expense.
(In thousands)
Years ended August 31,
2016 2015 2014
Interest and foreign exchange:
Interest and other expense $17,268 $18,975 $18,306
Foreign exchange (gain) loss (3,766) (7,796) 389
$13,502 $11,179 $18,695
Research and development - Research and development costs are expensed as incurred. Research and
development costs incurred for new product development during the years ended August 31, 2016, 2015 and
2014 were $2.7 million, $2.5 million and $3.6 million.
Forward exchange contracts - Foreign operations give rise to risks from changes in foreign currency exchange
rates. Forward exchange contracts with established financial institutions are used to hedge a portion of such risk.
Realized and unrealized gains and losses are deferred in other comprehensive income (loss) and recognized in
earnings concurrent with the hedged transaction or when the occurrence of the hedged transaction is no longer
considered probable. Ineffectiveness is measured and any gain or loss is recognized in foreign exchange gain or
loss. Even though forward exchange contracts are entered into to mitigate the impact of currency fluctuations,
certain exposure remains, which may affect operating results. In addition, there is risk for counterparty non-
performance.
Interest rate instruments - Interest rate swap agreements are used to reduce the impact of changes in interest rates
on certain debt. The net cash amounts paid or received under the agreements are recognized as an adjustment to
interest expense.
Net earnings per share - Basic earnings per common share (EPS) excludes the potential dilution that would occur
if additional shares were issued upon conversion of bonds. Restricted share grants are treated as outstanding
when issued and restricted stock units are not treated as outstanding when issued. Restricted share grants and
restricted stock units are included in weighted average basic common shares outstanding when calculating EPS
when the Company is in a net earnings position.
Dilutive EPS is calculated using the more dilutive of two approaches. The first approach includes the dilutive
effect, using the treasury stock method, associated with shares underlying the 2026 Convertible notes and
performance based restricted stock units that are subject to performance criteria, for which actual levels of
performance above target have been achieved. The second approach supplements the first by including the “if
converted” effect of the 2018 Convertible notes issued in March 2011. Under the “if converted” method, debt
issuance and interest costs, both net of tax, associated with the convertible notes are added back to net earnings
and the share count is increased by the shares underlying the convertible notes. The 2026 Convertible notes are
included in the calculation of both approaches using the treasury stock method when the average stock price is
greater than the applicable conversion price.
Stock-based compensation - The value of stock based compensation awards is amortized as compensation
expense from the date of grant through the earlier of the vesting period or the recipient’s eligible retirement date.
Awards are expensed upon grant when the recipient’s eligible retirement date precedes the grant date. Stock
based compensation expense consists of restricted stock units, restricted stock and phantom stock units awards.
Stock based compensation expense for the years ended August 31, 2016, 2015 and 2014 was $24.0 million, $19.5
million and $11.3 million and was recorded in Selling and administrative on the Consolidated Statements of
Income.
Restricted stock units and restricted stock are accounted for as equity based awards (see Note 15 – Equity).
Phantom stock units are accounted for as liability based awards.
T h e G r e e n b r i e r C o m p a n i e s 2 0 1 6 A n n u a l R e p o r t 59

Phantom Stock Units
The Company began granting phantom stock units during the year ended August 31, 2016. Every phantom stock
unit entitles the participant to receive a cash payment equal to the value of a single share of the Company’s
common stock upon vesting. The holders of unvested phantom stock units are entitled to participate in dividend
equivalents.
During the year ended August 31, 2016, the Company awarded 268,161 phantom stock units which include
performance-based grants. As of August 31, 2016, there were a total of 133,139 phantom stock units associated
with unvested performance-based grants. The actual number of phantom stock units that will vest associated with
performance-based phantom stock units will vary depending on the Company’s performance. Approximately
133,139 additional phantom stock units may be granted if performance-based phantom stock units vest at stretch
level of performance. These additional units are associated with phantom stock unit awards granted during the
year ended August 31, 2016. The grant date fair value of phantom stock awards was $7.9 million for the year
ended August 31, 2016.
Our phantom stock unit grants are considered liability based awards and therefore are re-measured at the end of
each reporting period. Compensation expense is recognized through the earlier of the vesting period or the
recipient’s eligible retirement date. Awards are expensed upon grant when the recipient’s eligible retirement date
precedes the grant date. Compensation expense related to phantom stock unit grants is recorded in Selling and
administrative expense and Cost of revenue on the Company’s Consolidated Statements of Income.
Compensation expense recognized related to phantom stock units for the year ended August 31, 2016 was $1.5
million. Unamortized compensation cost related to phantom stock unit grants was $7.5 million as of August 31,
2016.
Management estimates - The preparation of financial statements in conformity with accounting principles
generally accepted in the U.S. requires judgment on the part of management to arrive at estimates and
assumptions on matters that are inherently uncertain. These estimates may affect the amount of assets, liabilities,
revenue and expenses reported in the financial statements and accompanying notes and disclosure of contingent
assets and liabilities within the financial statements. Estimates and assumptions are periodically evaluated and
may be adjusted in future periods. Actual results could differ from those estimates.
Prospective Accounting Changes - In May 2014, the Financial Accounting Standards Board (FASB) issued
Accounting Standards Update 2014-09, Revenue from Contracts with Customers (ASU 2014-09). The issued
guidance converges the criteria for reporting revenue, and requires disclosures sufficient to describe the nature,
amount, timing, and uncertainty of revenue and cash flows arising from these contracts. Companies can transition
to the standard either retrospectively or as a cumulative effect adjustment as of the date of adoption. The FASB
issued a one year deferral and the new standard is effective for fiscal years and interim periods within those years
beginning after December 15, 2017. The Company plans to adopt this guidance beginning September 1, 2018.
The Company is evaluating the impact of this standard as well as its method of adoption on its consolidated
financial statements and disclosures.
In April 2015, the FASB issued Accounting Standards Update 2015-03, Simplifying the Presentation of Debt
Issuance Costs (ASU 2015-03). The FASB issued this update to simplify the presentation of debt issuance costs
related to a recognized debt liability to present the debt issuance costs as a direct deduction from the carrying
value of the debt liability rather than showing the debt issuance costs as an asset. The guidance is limited to the
presentation of debt issuance costs and does not impact its recognition and measurement. The new guidance is
effective for fiscal years and interim periods within those years beginning after December 15, 2015, with early
adoption permitted, and is required to be applied on a retrospective basis. The Company plans to adopt this
guidance beginning September 1, 2016. As the adoption of this new guidance only amends presentation and
disclosure requirements, the adoption will not affect the Company’s financial position, results of operations or
cash flows.
In August 2015, the FASB issued Accounting Standards Update 2015-15, Interest-Imputation of Interest:
Presentation and Subsequent Measurement of Debt Issuance Costs Associated with Line of Credit Arrangements
(ASU 2015-15). This update was released because the guidance within ASU 2015-03 for debt issuance costs does
60 T h e G r e e n b r i e r C o m p a n i e s 2 0 1 6 A n n u a l R e p o r t

not address presentation or subsequent measurement of debt issuance costs related to line of credit arrangements.
The SEC staff would not object to an entity deferring and presenting debt issuance costs as an asset and
subsequently amortizing the deferred debt issuance costs ratably over the term of the line of credit arrangement,
regardless of whether there are any outstanding borrowings on the line of credit arrangement. The new guidance
is effective for fiscal years and interim periods within those fiscal years beginning after December 15, 2015. The
Company plans to adopt this guidance beginning September 1, 2016. Upon adoption, the Company continues to
present debt issuance costs related to line of credit arrangements as an asset. The adoption of this new guidance
will not affect the Company’s financial position, results of operations or cash flows.
In February 2016, the FASB issued Accounting Standards Update 2016-02, Leases (ASU 2016-02). The new
guidance supersedes existing guidance on accounting for leases in Topic 840 and is intended to increase the
transparency and comparability of accounting for lease transactions. ASU 2016-02 requires most leases to be
recognized on the balance sheet. Lessees will need to recognize a right-of-use asset and a lease liability for
virtually all leases. The liability will be equal to the present value of lease payments. The asset will be based on
the liability, subject to adjustment, such as for initial direct costs. For income statement purposes, the FASB
retained a dual model, requiring leases to be classified as either operating or finance. Lessor accounting remains
similar to the current model, but updated to align with certain changes to the lessee model and the new revenue
recognition standard. The ASU will require both quantitative and qualitative disclosures regarding key
information about leasing arrangements. The standard is effective for fiscal years, and interim periods within
those fiscal years, beginning after December 15, 2018. Early adoption is permitted. The new standard must be
adopted using a modified retrospective transition, and provides for certain practical expedients. Transition will
require application of the new guidance at the beginning of the earliest comparative period presented. The
Company plans to adopt this guidance beginning September 1, 2019. The Company is currently evaluating the
impact of this standard on its consolidated financial statements and disclosures.
In March 2016, the FASB issued Accounting Standards Update 2016-09, Improvements to Employee Share-
Based Payment Accounting (ASU 2016-09). This update will change how companies account for certain aspects
of share-based payments to employees. Excess tax benefits or deficiencies related to vested awards, previously
recognized in stockholders’ equity, will be required to be recognized in the income statement when the awards
vest. The new guidance is effective for fiscal years and interim periods within those years beginning after
December 15, 2016, with early adoption permitted. The Company plans to adopt this guidance beginning
September 1, 2017. The effect of adopting this standard will result in volatility in the provision for income taxes
depending on fluctuations in the price of the Company’s stock.
Note 3 - Gain on Contribution to Joint Venture
On July 18, 2014 the Company and Watco contributed its respective Repair operations to a newly formed entity,
GBW, a 50/50 unconsolidated joint venture. The Company accounts for its interest in GBW under the equity
method of accounting.
Upon formation of GBW, the Company recognized a pre-tax non-cash gain of $29.0 million for the year ended
August 31, 2014 which was calculated as the fair value of the Company’s 50% share in GBW, less cash and
intangibles contributed to GBW and an allocation of goodwill attributed to the Repair business the Company
contributed to GBW. The gain was included as Gain on contribution to joint venture in the Consolidated
Statements of Income.
Note 4 - Restructuring
During 2013, the Company implemented a restructuring plan to sell or close certain wheels, repair and parts
facilities to enhance margins and improve capital efficiency and completed the restructuring plan during 2014.
Restructuring charges related to this plan totaled $1.5 million for the year ended August 31, 2014 and were
included in the Consolidated Statement of Income. All of the restructuring charges for the year ended August 31,
2014 related to the Company’s wheels, repair and parts operations. As of August 31, 2016, all amounts related to
this plan have been paid.
T h e G r e e n b r i e r C o m p a n i e s 2 0 1 6 A n n u a l R e p o r t 61

Note 5 - Inventories
As of August 31,
(In thousands) 2016 2015
Manufacturing supplies and raw materials $240,865 $311,880
Work-in-process 68,727 75,032
Finished goods 59,470 61,302
Excess and obsolete adjustment (3,257) (2,679)
$365,805 $445,535
As of August 31,
(In thousands) 2016 2015 2014
Excess and obsolete adjustment
Balance at beginning of period $ 2,679 $ 2,866 $ 4,228
Charge to cost of revenue 2,422 2,564 1,945
Disposition of inventory (1,792) (2,434) (3,307)
Currency translation effect (52) (317) –
Balance at end of period $ 3,257 $ 2,679 $ 2,866
Note 6 - Equipment on Operating Leases, net
Equipment on operating leases is reported net of accumulated depreciation of $92.6 million and $96.6 million as
of August 31, 2016 and 2015. Depreciation expense was $16.6 million, $9.4 million and $9.8 million as of
August 31, 2016, 2015 and 2014. In addition, certain railcar equipment leased-in by the Company on operating
leases (see Note 21 Lease Commitments) is subleased to customers under non-cancelable operating leases.
Aggregate minimum future amounts receivable under all non-cancelable operating leases and subleases are as
follows:
(In thousands)
Year ending August 31,
2017 $29,892
2018 24,198
2019 19,177
2020 11,883
2021 4,849
Thereafter 6,463
$96,462
Certain equipment is also operated under daily, monthly or car hire utilization arrangements. Associated revenue
amounted to $14.7 million, $20.2 million and $24.8 million for the years ended August 31, 2016, 2015 and 2014.
Note 7 - Property, Plant and Equipment, net
As of August 31,
(In thousands) 2016 2015
Land and improvements $ 50,979 $ 46,849
Machinery and equipment 325,100 283,032
Buildings and improvements 147,160 130,577
Construction in progress 42,879 63,518
Other 46,428 41,252
612,546 565,228
Accumulated depreciation (282,556) (262,093)
$ 329,990 $ 303,135
62 T h e G r e e n b r i e r C o m p a n i e s 2 0 1 6 A n n u a l R e p o r t

Depreciation expense was $39.2 million, $31.4 million and $25.8 million as of August 31, 2016, 2015 and 2014.
Note 8 - Goodwill
The Company’s goodwill balance of $43.3 million as of August 31, 2016 and 2015 related to our Wheels & Parts
segment. The gross goodwill balance before accumulated goodwill impairment losses and other reductions was
$195.8 million. Total accumulated goodwill impairment losses and other reductions were $152.5 million, of
which $128.2 million related to goodwill impairment losses, all of which occurred prior to 2016.
The Company performs a goodwill impairment test annually during the third quarter. Goodwill is also tested
more frequently if changes in circumstances or the occurrence of events indicates that a potential impairment
exists. The provisions of ASC 350, Intangibles – Goodwill and Other, require the Company to perform a two-
step impairment test on goodwill.
In the first step, the Company compares the fair value of each reporting unit with its carrying value. The
Company determines the fair value of the reporting unit based on a weighting of income and market approaches.
Under the income approach, the Company calculates the fair value of a reporting unit based on the present value
of estimated future cash flows. Under the market approach, the Company estimates the fair value based on
observed market multiples for comparable businesses.
The Company completed step 1 as part of its annual goodwill impairment test during the third quarter of 2016
and concluded that goodwill was not impaired. As a result, step 2 was not considered necessary.
Note 9 - Intangibles and Other Assets, net
Intangible assets that are determined to have finite lives are amortized over their useful lives. Intangible assets
with indefinite useful lives are not amortized and are periodically evaluated for impairment.
The following table summarizes the Company’s identifiable intangible and other assets balance:
As of August 31,
(In thousands) 2016 2015
Intangible assets subject to amortization:
Customer relationships $ 65,023 $ 65,023
Accumulated amortization (37,251) (33,828)
Other intangibles 6,298 3,422
Accumulated amortization (5,967) (3,121)
28,103 31,496
Intangible assets not subject to amortization 912 912
Prepaid and other assets 14,891 13,111
Nonqualified savings plan investments 15,864 11,815
Debt issuance costs, net 5,597 3,823
Assets held for sale 4,108 4,397
$ 69,475 $ 65,554
Amortization expense for the years ended August 31, 2016, 2015 and 2014 was $6.3 million, $3.7 million and
$4.5 million. Amortization expense for the years ending August 31, 2017, 2018, 2019, 2020 and 2021 is expected
to be $3.6 million, $3.5 million, $3.4 million, $3.4 million and $3.4 million.
T h e G r e e n b r i e r C o m p a n i e s 2 0 1 6 A n n u a l R e p o r t 63
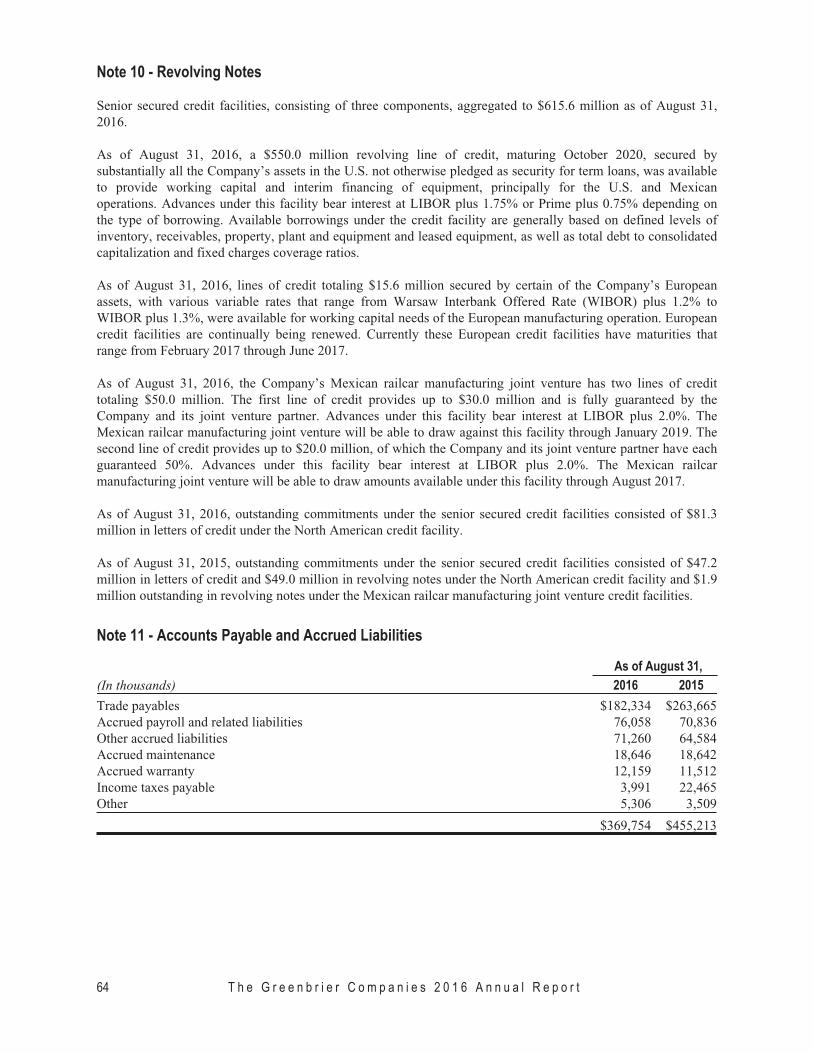
Note 10 - Revolving Notes
Senior secured credit facilities, consisting of three components, aggregated to $615.6 million as of August 31,
2016.
As of August 31, 2016, a $550.0 million revolving line of credit, maturing October 2020, secured by
substantially all the Company’s assets in the U.S. not otherwise pledged as security for term loans, was available
to provide working capital and interim financing of equipment, principally for the U.S. and Mexican
operations. Advances under this facility bear interest at LIBOR plus 1.75% or Prime plus 0.75% depending on
the type of borrowing. Available borrowings under the credit facility are generally based on defined levels of
inventory, receivables, property, plant and equipment and leased equipment, as well as total debt to consolidated
capitalization and fixed charges coverage ratios.
As of August 31, 2016, lines of credit totaling $15.6 million secured by certain of the Company’s European
assets, with various variable rates that range from Warsaw Interbank Offered Rate (WIBOR) plus 1.2% to
WIBOR plus 1.3%, were available for working capital needs of the European manufacturing operation. European
credit facilities are continually being renewed. Currently these European credit facilities have maturities that
range from February 2017 through June 2017.
As of August 31, 2016, the Company’s Mexican railcar manufacturing joint venture has two lines of credit
totaling $50.0 million. The first line of credit provides up to $30.0 million and is fully guaranteed by the
Company and its joint venture partner. Advances under this facility bear interest at LIBOR plus 2.0%. The
Mexican railcar manufacturing joint venture will be able to draw against this facility through January 2019. The
second line of credit provides up to $20.0 million, of which the Company and its joint venture partner have each
guaranteed 50%. Advances under this facility bear interest at LIBOR plus 2.0%. The Mexican railcar
manufacturing joint venture will be able to draw amounts available under this facility through August 2017.
As of August 31, 2016, outstanding commitments under the senior secured credit facilities consisted of $81.3
million in letters of credit under the North American credit facility.
As of August 31, 2015, outstanding commitments under the senior secured credit facilities consisted of $47.2
million in letters of credit and $49.0 million in revolving notes under the North American credit facility and $1.9
million outstanding in revolving notes under the Mexican railcar manufacturing joint venture credit facilities.
Note 11 - Accounts Payable and Accrued Liabilities
As of August 31,
(In thousands) 2016 2015
Trade payables $182,334 $263,665
Accrued payroll and related liabilities 76,058 70,836
Other accrued liabilities 71,260 64,584
Accrued maintenance 18,646 18,642
Accrued warranty 12,159 11,512
Income taxes payable 3,991 22,465
Other 5,306 3,509
$369,754 $455,213
64 T h e G r e e n b r i e r C o m p a n i e s 2 0 1 6 A n n u a l R e p o r t

Note 12 - Maintenance and Warranty Accruals
As of August 31,
(In thousands) 2016 2015 2014
Accrued maintenance
Balance at beginning of period $ 18,642 $14,329 $11,420
Charged to cost of revenue 12,926 13,622 11,423
Payments (12,922) (9,309) (8,514)
Balance at end of period $ 18,646 $18,642 $14,329
Accrued warranty
Balance at beginning of period $ 11,512 $ 9,340 $12,128
Charged to cost of revenue 6,069 7,206 2,205
Payments (5,299) (4,703) (5,122)
Currency translation effect (123) (331) 129
Balance at end of period $ 12,159 $11,512 $ 9,340
Note 13 - Notes Payable
As of August 31,
(In thousands) 2016 2015
Convertible senior notes, due 2018 $119,063 $119,063
Convertible senior notes, due 2026 – 14,851
Term loans 184,906 192,515
$303,969 $326,429
Convertible senior notes, due 2018, bear interest at a fixed rate of 3.5%, paid semi-annually in arrears on April 1st
and October 1st. The convertible notes mature on April 1, 2018, unless earlier repurchased by the Company or
converted in accordance with their terms. Holders may convert at their option at any time prior to the business
day immediately preceding the stated maturity date. The convertible notes are senior unsecured obligations and
rank equally with other senior unsecured debt. The convertible notes are convertible into shares of the
Company’s common stock, at an initial conversion rate of 26.2838 shares per $1,000 principal amount of the
notes (which is equal to an initial conversion price of $38.05 per share). The initial conversion rate and
conversion price are subject to adjustment upon the occurrence of certain events, such as distributions, dividends
or stock splits. There were $7.9 million in original debt issuance costs, included in Intangibles and other assets on
the Consolidated Balance Sheets, which are being amortized using the effective interest method. The
amortization expense is being included in Interest and foreign exchange on the Consolidated Statements of
Income. During 2015, $110.9 million in principal of the original $230.0 million was converted into 2.9 million
shares of the Company’s common stock which resulted in a principal balance of $119.1 million. Associated debt
issuance costs of $1.5 million were removed from Intangibles and other assets, net and charged against additional
paid in capital in 2015.
Convertible senior notes, due 2026, all of which have been retired, bore interest at a fixed rate of 2.375%, paid
semi-annually in arrears on May 15th and November 15th. The terms of the 2026 Notes specified dates or events
involving certain fundamental changes, where holders could require the Company to repurchase all or a portion
of their 2026 Notes at a price equal to 100% of the principal amount of the 2026 Notes plus accrued and unpaid
interest (the Put Option). Greenbrier also had an option to redeem all or a portion of the notes at a redemption
price equal to 100% of the principal amount of the notes plus accrued and unpaid interest (the Call Option).
During the year ended August 31, 2016, the Company retired the remaining $14.9 million of outstanding 2026
Notes of which $14.0 million was retired pursuant to a scheduled Put Option and $0.9 million was retired
pursuant to the Company’s Call Option.
T h e G r e e n b r i e r C o m p a n i e s 2 0 1 6 A n n u a l R e p o r t 65

Term loans are primarily composed of:
• $200 million of senior term debt, with a maturity date of March 2020, which is secured by a pool of leased
railcars and cash. The debt bears a floating interest rate of LIBOR plus 1.75% with principal of $1.75 million
paid quarterly in arrears and a balloon payment of $159.8 million due at maturity. An interest rate swap
agreement was entered into on 50% of the initial balance to swap the floating interest rate of LIBOR plus
1.75% to a fixed rate of 3.7375%. The principal balance as of August 31, 2016 was $184.2 million.
• Other term loans with an aggregate balance of $0.7 million as of August 31, 2016 and a maturity date of
February 2018.
The notes payable, along with the revolving and operating lines of credit, contain certain covenants with respect
to the Company and various subsidiaries, the most restrictive of which, among other things, limit the ability to:
incur additional indebtedness or guarantees; pay dividends or repurchase stock; enter into sale leaseback
transactions; create liens; sell assets; engage in transactions with affiliates, including joint ventures and non U.S.
subsidiaries, including but not limited to loans, advances, equity investments and guarantees; enter into mergers,
consolidations or sales of substantially all the Company’s assets; and enter into new lines of business. The
covenants also require certain maximum ratios of debt to total capitalization and minimum levels of fixed
charges (interest and rent) coverage.
Principal payments on the notes payable are expected as follows:
(In thousands)
Year ending August 31,
2017 $ 7,437
2018 (1) 126,282
2019 7,000
2020 163,250
2021 –
Thereafter –
$303,969
(1) The repayment of the $119.1 million of Convertible senior notes due 2018 is assumed to occur at the scheduled maturity in 2018 instead
of assuming an earlier conversion by the holders.
Note 14 - Derivative Instruments
Foreign operations give rise to market risks from changes in foreign currency exchange rates. Foreign currency
forward exchange contracts with established financial institutions are utilized to hedge a portion of that risk.
Interest rate swap agreements are used to reduce the impact of changes in interest rates on certain debt. The
Company’s foreign currency forward exchange contracts and interest rate swap agreements are designated as
cash flow hedges, and therefore the effective portion of unrealized gains and losses is recorded in accumulated
other comprehensive income or loss.
At August 31, 2016 exchange rates, forward exchange contracts for the purchase of Polish Zlotys and the sale of
Euros and U.S. Dollars; and for the purchase of U.S. Dollars and the sale of Saudi Riyals aggregated to $405.2
million. The fair value of the contracts is included on the Consolidated Balance Sheets as Accounts payable and
accrued liabilities when there is a loss, or as Accounts receivable, net when there is a gain. As the contracts
mature at various dates through September 2018, any such gain or loss remaining will be recognized in
manufacturing revenue or cost of revenue along with the related transactions. In the event that the underlying
transaction does not occur or does not occur in the period designated at the inception of the hedge, the amount
classified in accumulated other comprehensive loss would be reclassified to the results of operations in Interest
and foreign exchange at the time of occurrence. At August 31, 2016 exchange rates, approximately $2.5 million
would be reclassified to revenue in the next 12 months.
66 T h e G r e e n b r i e r C o m p a n i e s 2 0 1 6 A n n u a l R e p o r t

At August 31, 2016, an interest rate swap agreement maturing in March 2020 had a notional amount of $92.1
million. The fair value of the contract is included in Accounts payable and accrued liabilities on the Consolidated
Balance Sheets. As interest expense on the underlying debt is recognized, amounts corresponding to the interest
rate swap are reclassified from Accumulated other comprehensive loss and charged or credited to interest
expense. At August 31, 2016 interest rates, approximately $1.3 million would be reclassified to interest expense
in the next 12 months.
Fair Values of Derivative Instruments
Asset Derivatives Liability Derivatives
August 31, August 31,
2016 2015 2016 2015
(In thousands)Balance sheet
locationFair
ValueFair
ValueBalance sheet
locationFair
ValueFair
Value
Derivatives designated as hedging instruments
Foreign forward
exchange contracts
Accounts receivable,
net $1,570 $1,820
Accounts payable and
accrued liabilities $4,287 $ 737
Interest rate swap
contracts
Intangibles and other
assets, net – –
Accounts payable and
accrued liabilities 3,157 2,393
$1,570 $1,820 $7,444 $3,130
Derivatives not designated as hedging instruments
Foreign forward
exchange contracts
Accounts receivable,
net $ 25 $ 93
Accounts payable and
accrued liabilities $ 22 $ 76
The Effect of Derivative Instruments on the Consolidated Statements of Income
Derivatives incash flowhedging
relationshipsLocation of gain (loss) recognized in
income on derivative
Gain (loss) recognized inincome on derivative
Years endedAugust 31,
2016 2015
Foreign forward exchange contract Interest and foreign exchange $336 $(366)
Interest rate swap contracts Interest and foreign exchange 90 60
$426 $(306)
Derivatives incash flowhedging
relationships
Gain (loss)recognized in OCI onderivatives (effective
portion)Years
ended August 31,
Location ofgain (loss)reclassified
fromaccumulated
OCI intoincome
Gain (loss)reclassified from
accumulated OCI intoincome (effective
portion)Years
ended August 31,
Location ofgain (loss)
in income onderivative
(ineffectiveportion and
amountexcluded fromeffectiveness
testing)
Gainrecognized on
derivative(ineffectiveportion and
amountexcluded fromeffectiveness
testing)Yearsended
August 31,
2016 2015 2016 2015 2016 2015
Foreign forward
exchange
contracts $(4,698) $ 457 Revenue $(1,224) $ 457 Revenue $138 $2,843
Foreign forward
exchange
contracts (944) – Cost of revenue (911) – Cost of revenue 121 –
Interest rate swap
contracts (2,354) (2,936)
Interest and
foreign
exchange (1,561) (1,786)
Interest and
foreign
exchange – –
$(7,996) $(2,479) $(3,696) $(1,329) $259 $2,843
T h e G r e e n b r i e r C o m p a n i e s 2 0 1 6 A n n u a l R e p o r t 67

Note 15 - Equity
Stock Incentive Plan
The 2014 Amended and Restated Stock Incentive Plan provides for the grant of incentive stock options, non-
statutory stock options, restricted shares, restricted stock units and stock appreciation rights. The maximum
aggregate number of the Company’s common shares authorized for issuance is 4,325,000. On August 31, 2016
there were 476,770 shares available for grant compared to 905,139 and 1,144,143 shares available for grant as of
the years ended August 31, 2015 and 2014. There are no stock options or stock appreciation rights outstanding as
of August 31, 2016. The Company currently grants restricted shares and restricted stock units. Restricted share
grants are considered outstanding shares of common stock at the time they are issued. The holders of unvested
restricted shares are entitled to voting rights and participation in dividends. The dividends are not forfeitable if
the awards are later forfeited prior to vesting. Shares associated with restricted stock unit awards are not
considered legally outstanding shares of common stock until vested. Restricted stock unit awards, including
performance-based awards, are entitled to participate in dividends and these awards are considered participating
securities and are considered outstanding for earnings per share purposes when the effect is dilutive.
During the years ended August 31, 2016, 2015 and 2014, the Company awarded restricted share and restricted
stock unit grants totaling 447,895, 402,196 and 269,665 shares which include performance-based grants. As of
August 31, 2016, there were a total of 495,137 shares associated with unvested performance-based grants. The
actual number of shares that will vest associated with performance-based grants will vary depending on the
Company’s performance. Approximately 495,137 additional shares may be granted if performance-based
restricted stock unit awards vest at stretch levels of performance. These additional shares are associated with
restricted stock unit awards granted during the years ended August 31, 2016, 2015 and 2014. The fair value of
awards granted was $12.5 million, $24.6 million and $13.1 million for the years ended August 31, 2016, 2015
and 2014.
The value, at the date of grant, of stock awarded under restricted share grants and restricted stock unit grants is
amortized as compensation expense over the lesser of the vesting period of one to three years or to the recipients
eligible retirement date. Compensation expense recognized related to restricted share grants and restricted stock
unit grants for the years ended August 31, 2016, 2015 and 2014 was $22.5 million, $19.5 million and $11.3
million and was recorded in Selling and administrative and Cost of Revenue on the Consolidated Statements of
Income. Unamortized compensation cost related to restricted stock grants was $22.3 million as of August 31,
2016.
The unvested restricted share and restricted stock unit grants were 902,068 and 815,496 as of August 31, 2016
and 2015. The following table summarizes restricted share and restricted stock unit grant transactions for shares,
both vested and unvested, under the 2014 Amended and Restated Stock Incentive Plan:
Shares
Balance at August 31, 2013 (1) 2,940,003
Granted 269,665
Forfeited (28,811)
Balance at August 31, 2014 (1) 3,180,857
Granted 402,196
Forfeited (163,192)
Balance at August 31, 2015 (1) 3,419,861
Granted 447,895
Forfeited (19,526)
Balance at August 31, 2016 (1) 3,848,230
(1) Balance represents cumulative grants net of forfeitures.
68 T h e G r e e n b r i e r C o m p a n i e s 2 0 1 6 A n n u a l R e p o r t

Share Repurchase Program
Since October 2013, the Board of Directors has authorized the Company to repurchase in aggregate up to $225
million of the Company’s common stock. The program may be modified, suspended or discontinued at any time
without prior notice. Under the share repurchase program, shares of common stock may be purchased on the
open market or through privately negotiated transactions from time-to-time. The timing and amount of purchases
will be based upon market conditions, securities law limitations and other factors. The share repurchase program
does not obligate the Company to acquire any specific number of shares in any period.
During the year ended August 31, 2016 and August 31, 2015, the Company repurchased a total of 1,054,687
shares for approximately $32.4 million and 1,386,993 shares for approximately $70.2 million, respectively, under
these share repurchase programs. As of August 31, 2016 the Company had cumulatively repurchased 3,206,226
shares for approximately $137.0 million and had $88.0 million available under the share repurchase program
which has an expiration date of January 1, 2018.
Note 16 - Earnings per Share
The shares used in the computation of the Company’s basic and diluted earnings per common share are
reconciled as follows:
Years ended August 31,
(In thousands) 2016 2015 2014
Weighted average basic common shares outstanding (1) 29,156 28,151 28,164
Dilutive effect of 2018 Convertible notes (2) 3,214 5,130 6,045
Dilutive effect of 2026 Convertible notes (3) – 2 –
Dilutive effect of performance based restricted stock units (4) 98 45 –
Weighted average diluted common shares outstanding 32,468 33,328 34,209
(1) Restricted stock grants and restricted stock units, including some grants subject to certain performance criteria, are included in weighted
average basic common shares outstanding when the Company is in a net earnings position. No restricted stock and restricted stock units
were anti-dilutive for the years ended August 31, 2016, 2015 and 2014.
(2) The dilutive effect of the 2018 Convertible notes was included for the years ended August, 2016, 2015 and 2014 as they were considered
dilutive under the “if converted” method as further discussed below.
(3) The 2026 Convertible notes were retired during 2016. The effect of the 2026 Convertible notes was excluded for the years ended August
31, 2016 and 2014 as the average stock price was less than $48.05 and therefore the notes were considered anti-dilutive. The dilutive
effect of the 2026 Convertible notes was included for the year ended August 31, 2015 as the average stock price was greater than $48.05,
as further described below.
(4) Restricted stock units that are subject to performance criteria, for which actual levels of performance above target have been achieved, are
included in weighted average diluted common shares outstanding when the Company is in a net earnings position.
T h e G r e e n b r i e r C o m p a n i e s 2 0 1 6 A n n u a l R e p o r t 69

Dilutive EPS is calculated using the more dilutive of two approaches. The first approach includes the dilutive
effect, using the treasury stock method, associated with shares underlying the 2026 Convertible notes and
performance based restricted stock units that are subject to performance criteria, for which actual levels of
performance above target have been achieved. The second approach supplements the first by including the “if
converted” effect of the 2018 Convertible notes issued in March 2011. Under the “if converted” method, debt
issuance and interest costs, both net of tax, associated with the convertible notes are added back to net earnings
and the share count is increased by the shares underlying the convertible notes. The 2026 Convertible notes are
included in the calculation of both approaches using the treasury stock method when the average stock price is
greater than the applicable conversion price.
Years ended August 31,
2016 2015 2014
Net earnings attributable to Greenbrier $183,213 $192,832 $111,919
Add back:
Interest and debt issuance costs on the 2018 Convertible notes, net of tax 2,695 4,818 5,664
Earnings before interest and debt issuance costs on convertible notes $185,908 $197,650 $117,583
Weighted average diluted common shares outstanding 32,468 33,328 34,209
Diluted earnings per share (1) $ 5.73 $ 5.93 $ 3.44(1) Diluted earnings per share was calculated as follows:
Earnings before interest and debt issuance costs on convertible notes
Weighted average diluted common shares outstanding
Note 17 - Related Party Transactions
In July 2014, the Company and Watco completed the formation of GBW, an unconsolidated 50/50 joint venture.
The Company accounts for its interest in GBW under the equity method of accounting. The Company leases real
and personal property to GBW with lease revenue totaling $4.9 million for the years ended August 31, 2016 and
2015. The Company sold wheel sets and components to GBW which totaled $28.5 million and $25.4 million for
the years ended August 31, 2016 and 2015, respectively. GBW provided Repair services to the Company which
totaled $1.3 million and $2.4 million for the years ended August 31, 2016 and 2015, respectively. As of August
31, 2016, the Company had a $36.5 million note receivable balance from GBW.
In April 2010, WLR–Greenbrier Rail Inc. (WLR-GBX) was formed and acquired a lease fleet of nearly 4,000
railcars valued at approximately $256.0 million. WLR-GBX is wholly owned by affiliates of WL Ross & Co,
LLC (WL Ross) and a member of the Company’s board of directors, Wendy Teramoto, is also an affiliate of WL
Ross. In September 2015, the Company purchased the entire remaining WLR-GBX lease fleet of 3,885 railcars
for approximately $148.0 million plus a $1.0 million fee with the intent to sell the railcars and underlying
attached leases to third parties in the short-term and therefore has classified these railcars as Leased railcars for
syndication on the Company’s Consolidated Balance Sheet. The transaction was approved by the Company’s
disinterested, independent directors. During the year ended August 31, 2016, the Company sold to third parties
3,406 of these railcars with the underlying leases attached for $167.2 million. The Company recognized revenue
on 3,017 of these railcars for $159.4 million and deferred revenue recognition on 389 of these railcars for $7.8
million due to the Company’s continuing involvement. The remaining 479 railcars are anticipated to be sold or
disposed of in the next year. The Company and WL Ross have agreed that the Company will receive a preferred
return on the proceeds of the sale of the portfolio, after which it will share a portion of the profits with WL Ross
up to certain defined levels. The Company is first entitled to recoup its assumed equity portion of its investment
plus a rate of return of 25%. The Company and WL Ross will then share in the profits up to certain defined
levels. Once those defined levels have been met, the Company is entitled to receive 100% of the remaining
profits. During the year ended August 31, 2016, the Company paid a total of $7.2 million to WL Ross pursuant to
this profit sharing agreement and as of August 31, 2016 has accrued an additional $8.7 million that it anticipates
will be paid to WL Ross in the future.
70 T h e G r e e n b r i e r C o m p a n i e s 2 0 1 6 A n n u a l R e p o r t

William Furman, Chairman of the Board, President and Chief Executive Officer of the Company, also served as
director of Schnitzer Steel Industries, Inc. (Schnitzer) until January 2016. In the normal course of business, the
Company sells scrap metal to Schnitzer. During the years ended August 31, 2016, 2015 and 2014, the Company
sold scrap metal to Schnitzer totaling $2.0 million, $3.5 million and $3.0 million, respectively.
Mr. Furman is the owner of a private aircraft managed by a private independent management company. From
time to time, the Company’s business requires charter use of privately-owned aircraft. In such instances, it is
possible that charters may be placed on Mr. Furman’s aircraft. The Company placed charters on Mr. Furman’s
aircraft aggregating $0.8 million, $0.5 million and $0.5 million for each of the years ended August 31, 2016,
2015 and 2014, respectively.
Note 18 - Income Taxes
Components of income tax expense of continuing operations were as follows:
Years ended August 31,
(In thousands) 2016 2015 2014
Current
Federal $ 66,455 $ 92,525 $49,795
State 4,595 6,349 3,791
Foreign 50,299 32,748 23,229
121,349 131,622 76,815
Deferred
Federal (6,199) (13,565) (79)
State (1,174) (1,112) (1,142)
Foreign (1,644) (4,423) (3,148)
(9,017) (19,100) (4,369)
Change in valuation allowance (10) (362) (45)
Income Tax Expense $112,322 $112,160 $72,401
Income tax expense is computed at rates different from statutory rates. The reconciliation between effective and
statutory tax rates on operations is as follows:
Years ended August 31,
2016 2015 2014
Federal statutory rate 35.0% 35.0% 35.0%
State income taxes, net of federal benefit 0.7 1.0 1.3
Impact of foreign operations 0.1 (0.5) (0.8)
Change in valuation allowance related to deferred tax asset – (0.1) –
Noncontrolling interest in flow-through entity (7.4) (5.7) (5.3)
Permanent differences and other – 0.2 0.7
Non-deductible goodwill – – 1.9
Effective Tax Rate 28.4% 29.9% 32.8%
Earnings before income tax and earnings from unconsolidated affiliates for the years ended August 31, 2016,
2015 and 2014 were $264.8 million, $292.6 million and $161.1 million, respectively, for our domestic U.S.
operations and $130.3 million, $83.1 million and $59.7 million, respectively, for our foreign operations.
T h e G r e e n b r i e r C o m p a n i e s 2 0 1 6 A n n u a l R e p o r t 71

The tax effects of temporary differences that give rise to significant portions of deferred tax assets and deferred
tax liabilities were as follows:
As of August 31,
(In thousands) 2016 2015
Deferred tax assets:
Accrued payroll and related liabilities $ 26,384 $ 21,083
Deferred revenue 18,533 7,575
Maintenance and warranty accruals 10,604 11,037
Inventories and other 7,599 9,612
Derivative instruments and translation adjustment 1,153 858
Investment and asset tax credits 511 776
Net operating losses 429 689
Contract placement – 1,828
65,213 53,458
Deferred tax liabilities:
Fixed assets 97,490 87,031
Investment in GBW Joint Venture 16,144 16,356
Original issue discount – 4,036
Intangibles 3,212 3,030
Deferred gain on redemption of debt 1,718 2,611
Other (2,344) 357
116,220 113,421
Valuation allowance 612 694
Net deferred tax liability $ 51,619 $ 60,657
As of August 31, 2016 the Company had $0.7 million of state net operating loss (NOL) carryforwards that will
begin to expire in 2020, $0.4 million of state credit carryforwards that will begin to expire in 2021, and $3.7
million of foreign NOL carryforwards that will begin to expire in 2017. The Company has placed valuation
allowances against any deferred tax assets for which no benefit is anticipated, including those for loss and credit
carryforwards likely to expire before their expiration dates. The net decrease in the total valuation allowance was
approximately $0.1 million for the year ended August 31, 2016. The Company uses tax law ordering for purposes
of determining when excess tax benefits have been realized. During the current year the Company also realized
excess tax benefits of $2.8 million from the vesting of restricted stock awards.
The net decrease in the total valuation allowance on deferred taxes for which no benefit is anticipated was
approximately $0.1 million for the year ended August 31, 2016.
No provision has been made for U.S. income taxes on approximately $160.1 million of cumulative undistributed
earnings of certain foreign subsidiaries because the Company plans to reinvest these earnings indefinitely in
operations outside the U.S. Generally, such amounts become subject to U.S. taxation upon the remittance of
dividends and under certain other circumstances. It is not practicable to estimate the amount of deferred tax
liability related to investments in foreign subsidiaries.
72 T h e G r e e n b r i e r C o m p a n i e s 2 0 1 6 A n n u a l R e p o r t
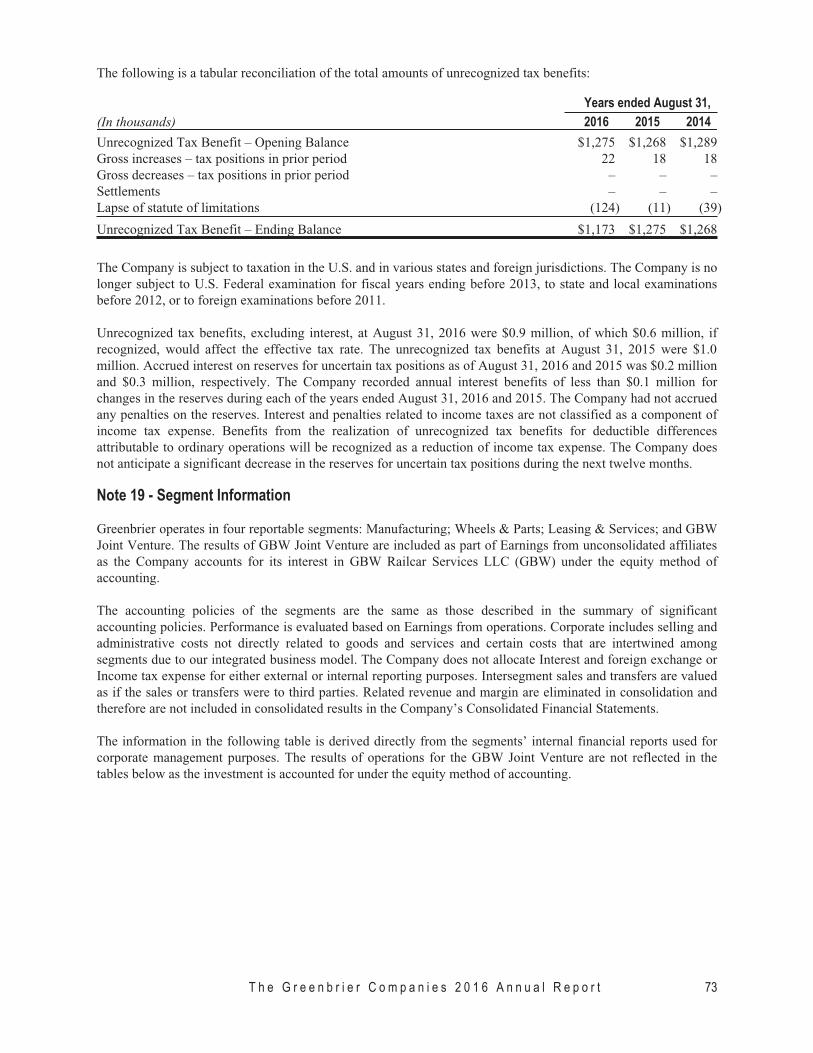
The following is a tabular reconciliation of the total amounts of unrecognized tax benefits:
Years ended August 31,
(In thousands) 2016 2015 2014
Unrecognized Tax Benefit – Opening Balance $1,275 $1,268 $1,289
Gross increases – tax positions in prior period 22 18 18
Gross decreases – tax positions in prior period – – –
Settlements – – –
Lapse of statute of limitations (124) (11) (39)
Unrecognized Tax Benefit – Ending Balance $1,173 $1,275 $1,268
The Company is subject to taxation in the U.S. and in various states and foreign jurisdictions. The Company is no
longer subject to U.S. Federal examination for fiscal years ending before 2013, to state and local examinations
before 2012, or to foreign examinations before 2011.
Unrecognized tax benefits, excluding interest, at August 31, 2016 were $0.9 million, of which $0.6 million, if
recognized, would affect the effective tax rate. The unrecognized tax benefits at August 31, 2015 were $1.0
million. Accrued interest on reserves for uncertain tax positions as of August 31, 2016 and 2015 was $0.2 million
and $0.3 million, respectively. The Company recorded annual interest benefits of less than $0.1 million for
changes in the reserves during each of the years ended August 31, 2016 and 2015. The Company had not accrued
any penalties on the reserves. Interest and penalties related to income taxes are not classified as a component of
income tax expense. Benefits from the realization of unrecognized tax benefits for deductible differences
attributable to ordinary operations will be recognized as a reduction of income tax expense. The Company does
not anticipate a significant decrease in the reserves for uncertain tax positions during the next twelve months.
Note 19 - Segment Information
Greenbrier operates in four reportable segments: Manufacturing; Wheels & Parts; Leasing & Services; and GBW
Joint Venture. The results of GBW Joint Venture are included as part of Earnings from unconsolidated affiliates
as the Company accounts for its interest in GBW Railcar Services LLC (GBW) under the equity method of
accounting.
The accounting policies of the segments are the same as those described in the summary of significant
accounting policies. Performance is evaluated based on Earnings from operations. Corporate includes selling and
administrative costs not directly related to goods and services and certain costs that are intertwined among
segments due to our integrated business model. The Company does not allocate Interest and foreign exchange or
Income tax expense for either external or internal reporting purposes. Intersegment sales and transfers are valued
as if the sales or transfers were to third parties. Related revenue and margin are eliminated in consolidation and
therefore are not included in consolidated results in the Company’s Consolidated Financial Statements.
The information in the following table is derived directly from the segments’ internal financial reports used for
corporate management purposes. The results of operations for the GBW Joint Venture are not reflected in the
tables below as the investment is accounted for under the equity method of accounting.
T h e G r e e n b r i e r C o m p a n i e s 2 0 1 6 A n n u a l R e p o r t 73

For the year ended August 31, 2016:
Revenue Earnings (loss) from operations
External Intersegment Total External Intersegment Total
Manufacturing $2,096,331 $ 89,158 $2,185,489 $415,094 $ 24,299 $439,393
Wheels & Parts 322,395 32,436 354,831 19,948 2,602 22,550
Leasing & Services 260,798 13,101 273,899 51,723 13,101 64,824
Eliminations – (134,695) (134,695) – (40,002) (40,002)
Corporate – – – (78,213) – (78,213)
$2,679,524 $ – $2,679,524 $408,552 $ – $408,552
For the year ended August 31, 2015:
Revenue Earnings (loss) from operations
External Intersegment Total External Intersegment Total
Manufacturing $2,136,051 $ 7,534 $2,143,585 $396,921 $ 795 $397,716
Wheels & Parts 371,237 27,257 398,494 27,563 2,629 30,192
Leasing & Services 97,990 62,600 160,590 41,887 62,600 104,487
Eliminations – (97,391) (97,391) – (66,024) (66,024)
Corporate – – – (79,479) – (79,479)
$2,605,278 $ – $2,605,278 $386,892 $ – $386,892
For the year ended August 31, 2014:
Revenue Earnings (loss) from operations
External Intersegment Total External Intersegment Total
Manufacturing $1,624,916 $ 790 $1,625,706 $202,555 $ 61 $202,616
Wheels & Parts 495,627 11,833 507,460 40,597 442 41,039
Leasing & Services 83,419 25,973 109,392 41,055 25,973 67,028
Eliminations – (38,596) (38,596) – (26,476) (26,476)
Corporate – – – (44,687) – (44,687)
$2,203,962 $ – $2,203,962 $239,520 $ – $239,520
Years ended August 31,
(In thousands) 2016 2015 2014
Assets:
Manufacturing $ 701,296 $ 675,409 $ 521,711
Wheels & Parts 275,599 291,798 298,009
Leasing & Services 518,263 549,073 436,075
Unallocated 342,732 274,232 261,373
$1,837,890 $1,790,512 $1,517,168
Depreciation and amortization:
Manufacturing $ 27,137 $ 20,668 $ 15,341
Wheels & Parts 11,971 11,748 12,582
Leasing & Services 24,237 12,740 12,499
$ 63,345 $ 45,156 $ 40,422
Capital expenditures:
Manufacturing $ 51,294 $ 84,354 $ 55,979
Wheels & Parts 10,190 9,381 8,774
Leasing & Services 77,529 12,254 5,474
$ 139,013 $ 105,989 $ 70,227
74 T h e G r e e n b r i e r C o m p a n i e s 2 0 1 6 A n n u a l R e p o r t

The following table summarizes selected geographic information.
Years ended August 31,
(In thousands) 2016 2015 2014
Revenue (1):
U.S. $2,297,501 $2,404,266 $1,998,579
Foreign 382,023 201,012 205,383
$2,679,524 $2,605,278 $2,203,962
Identifiable assets:
U.S. $ 957,790 $1,184,811 $1,115,473
Mexico 788,878 524,724 321,391
Europe 91,222 80,977 80,304
$1,837,890 $1,790,512 $1,517,168
(1) Revenue is presented on the basis of geographic location of customers.
Reconciliation of Earnings from operations to Earnings before income tax and earnings from unconsolidated
affiliates:
Years ended August 31,
(In thousands) 2016 2015 2014
Earnings from operations $408,552 $386,892 $239,520
Interest and foreign exchange 13,502 11,179 18,695
Earnings before income tax and earnings from unconsolidated affiliates $395,050 $375,713 $220,825
The results of operations for the GBW Joint Venture are accounted for under the equity method of accounting.
The GBW Joint Venture is the Company’s fourth reportable segment and information for 2016, 2015 and 2014
are included in the tables below.
Years ended August 31,
(In thousands) 2016 2015 2014 (1)
GBW Joint Venture:
Revenue $373,490 $349,849 $ 38,549
Earnings (loss) from operations $ 8,558 $ (1,160) $ 702
Assets (2) $247,610 $239,871 $210,631
Depreciation and amortization $ 7,676 $ 4,590 $ 470
Capital expenditures $ 16,110 $ 26,396 $ 1,255(1) 2014 includes activity after July 18, 2014, the date GBW was formed.(2) Includes goodwill and intangible assets of $93.4 million, $96.9 million and $100.2 million as of August 31, 2016, 2015 and 2014.
Note 20 - Customer Concentration
Customer concentration is defined as a single customer that accounts for more than 10% of total revenues or
accounts receivable. In 2016, revenue from two customers represented 17% and 14% of total revenue. In 2015,
revenue from one customer represented 17% of total revenue. In 2014, revenue from two customers represented
24% and 17% of total revenue, respectively. No other customers accounted for more than 10% of total revenues
for the years ended August 31, 2016, 2015, or 2014. Two customers had balances that individually equaled or
exceeded 10% of accounts receivable and represented 23% and 11% of the consolidated accounts receivable
balance at August 31, 2016. Two customers had balances that individually equaled or exceeded 10% of accounts
receivable and represented 28% and 12% of the consolidated accounts receivable balance at August 31, 2015.
T h e G r e e n b r i e r C o m p a n i e s 2 0 1 6 A n n u a l R e p o r t 75

Note 21 - Lease Commitments
Lease expense for railcar equipment leased-in under non-cancelable leases was $6.6 million, $6.3 million and
$6.8 million for the years ended August 31, 2016, 2015 and 2014. Aggregate minimum future amounts payable
under these non-cancelable railcar equipment leases are as follows:
(In thousands)
Year ending August 31,
2017 $ 6,756
2018 6,158
2019 5,022
2020 4,056
2021 1,181
Thereafter 3,817
$26,990
Operating leases for domestic railcar repair facilities, office space and certain manufacturing and office
equipment expire at various dates through May 2022. Rental expense for facilities, office space and equipment
was $9.3 million, $9.3 million and $12.3 million for the years ended August 31, 2016, 2015 and 2014. Aggregate
minimum future amounts payable under these non-cancelable operating leases are as follows:
(In thousands)
Year ending August 31,
2017 $ 4,716
2018 3,241
2019 2,960
2020 2,773
2021 1,644
Thereafter 340
$15,674
Note 22 - Commitments and Contingencies
The Company’s Portland, Oregon manufacturing facility is located adjacent to the Willamette River. The
Company has entered into a Voluntary Cleanup Agreement with the Oregon Department of Environmental
Quality (DEQ) in which the Company agreed to conduct an investigation of whether, and to what extent, past or
present operations at the Portland property may have released hazardous substances into the environment.
In December 2000, the U.S. Environmental Protection Agency (EPA) classified portions of the Willamette River
bed known as the Portland Harbor, including the portion fronting the Company’s manufacturing facility, as a
federal “National Priority List” or “Superfund” site due to sediment contamination (the Portland Harbor Site).
The Company and more than 140 other parties have received a “General Notice” of potential liability from the
EPA relating to the Portland Harbor Site. The letter advised the Company that it may be liable for the costs of
investigation and remediation (which liability may be joint and several with other potentially responsible parties)
as well as for natural resource damages resulting from releases of hazardous substances to the site. At this time,
ten private and public entities, including the Company (the Lower Willamette Group or LWG), have signed an
Administrative Order on Consent (AOC) to perform a remedial investigation/feasibility study (RI/FS) of the
Portland Harbor Site under EPA oversight, and several additional entities have not signed such consent, but are
nevertheless contributing money to the effort. The EPA-mandated RI/FS is being produced by the LWG and has
cost over $110 million during a 15-year period. The Company has agreed to initially bear a percentage of the
total costs incurred by the LWG in connection with the investigation. The Company’s aggregate expenditure has
not been material during the 15-year period. Some or all of any such outlay may be recoverable from other
responsible parties.
76 T h e G r e e n b r i e r C o m p a n i e s 2 0 1 6 A n n u a l R e p o r t

Eighty-three parties, including the State of Oregon and the federal government, have entered into a non-judicial
mediation process to try to allocate costs associated with the Portland Harbor site. Approximately 110 additional
parties have signed tolling agreements related to such allocations. On April 23, 2009, the Company and the other
AOC signatories filed suit against 69 other parties due to a possible limitations period for some such claims;
Arkema Inc. et al v. A & C Foundry Products, Inc. et al, U.S. District Court, District of Oregon, Case #3:09-cv-
453-PK. All but 12 of these parties elected to sign tolling agreements and be dismissed without prejudice, and the
case has now been stayed by the court, pending the EPA’s Record of Decision, currently scheduled by the EPA
for December 31, 2016.
On June 8, 2016, the EPA issued its Feasibility Study (FS) and Proposed Plan for the Portland Harbor Site. The
EPA accepted comments from the public on its Proposed Plan through September 6, 2016. The EPA’s FS
includes remediation alternatives that would take from 4 to 62 years of active remediation, with an estimated
undiscounted cost ranging from $642 million to $10.2 billion and a net present value assuming a 7% discount
rate ranging between $451 million and $9.4 billion. The Proposed Plan identifies the alternative currently favored
by the EPA, which it assigns an estimated undiscounted cost of between $1.1 and $1.2 billion and a net present
value of between $746 and $811 million. The EPA expects its cost estimates to be accurate within a range of +50
to -30 percent. The EPA estimates that the remedy in the Proposed Plan would take 7 years of active remediation
followed by 30 years of monitoring. The EPA’s FS and its Proposed Plan identify 13 Sediment Decision Units.
One of the units, RM9W, includes the nearshore area of the river sediments offshore of the Company’s Portland,
Oregon manufacturing facility as well as upstream and downstream of the facility. It also includes a portion of
our riverbank. Neither the FS nor the Proposed Plan breaks down total remediation costs by unit.
Neither the EPA’s FS nor its Proposed Plan addresses responsibility for the costs of clean-up, allocates such costs
among the potentially responsible parties, or defines precise boundaries for the cleanup. Responsibility for
funding and implementing the EPA’s selected cleanup option will be determined after the issuance of the Record
of Decision, currently scheduled by the EPA for December 31, 2016. Based on the investigation to date, the
Company believes that it did not contribute in any material way to contamination in the river sediments or the
damage of natural resources in the Portland Harbor Site and that the damage in the area of the Portland Harbor
Site adjacent to its property precedes its ownership of the Portland, Oregon manufacturing facility. Because these
environmental investigations are still underway, sufficient information is currently not available to determine the
Company’s liability, if any, for the cost of any required remediation or restoration of the Portland Harbor Site or
to estimate a range of potential loss. Based on the results of the pending investigations and future assessments of
natural resource damages, the Company may be required to incur costs associated with additional phases of
investigation or remedial action, and may be liable for damages to natural resources. In addition, the Company
may be required to perform periodic maintenance dredging in order to continue to launch vessels from its launch
ways in Portland, Oregon, on the Willamette River, and the river’s classification as a Superfund site could result
in some limitations on future dredging and launch activities. Any of these matters could adversely affect the
Company’s business and Consolidated Financial Statements, or the value of its Portland property.
The Company has also signed an Order on Consent with the DEQ to finalize the investigation of potential onsite
sources of contamination that may have a release pathway to the Willamette River. Interim precautionary
measures are also required in the order and the Company is currently discussing with the DEQ potential remedial
actions which may be required. Our aggregate expenditure has not been material, however the Company could
incur significant expenses for remediation. Some or all of any such outlay may be recoverable from other
responsible parties.
From time to time, Greenbrier is involved as a defendant in litigation in the ordinary course of business, the
outcome of which cannot be predicted with certainty. While the ultimate outcome of such legal proceedings
cannot be determined at this time, management believes that the resolution of these actions will not have a
material adverse effect on the Company’s Consolidated Financial Statements.
In accordance with customary business practices in Europe, the Company has $2.6 million in third party warranty
guarantee facilities. To date no amounts have been drawn under these guarantee facilities.
As of August 31, 2016, the Mexican joint venture had $0.7 million of third party debt outstanding, for which the
Company and its joint venture partner had each guaranteed approximately $0.3 million.
T h e G r e e n b r i e r C o m p a n i e s 2 0 1 6 A n n u a l R e p o r t 77
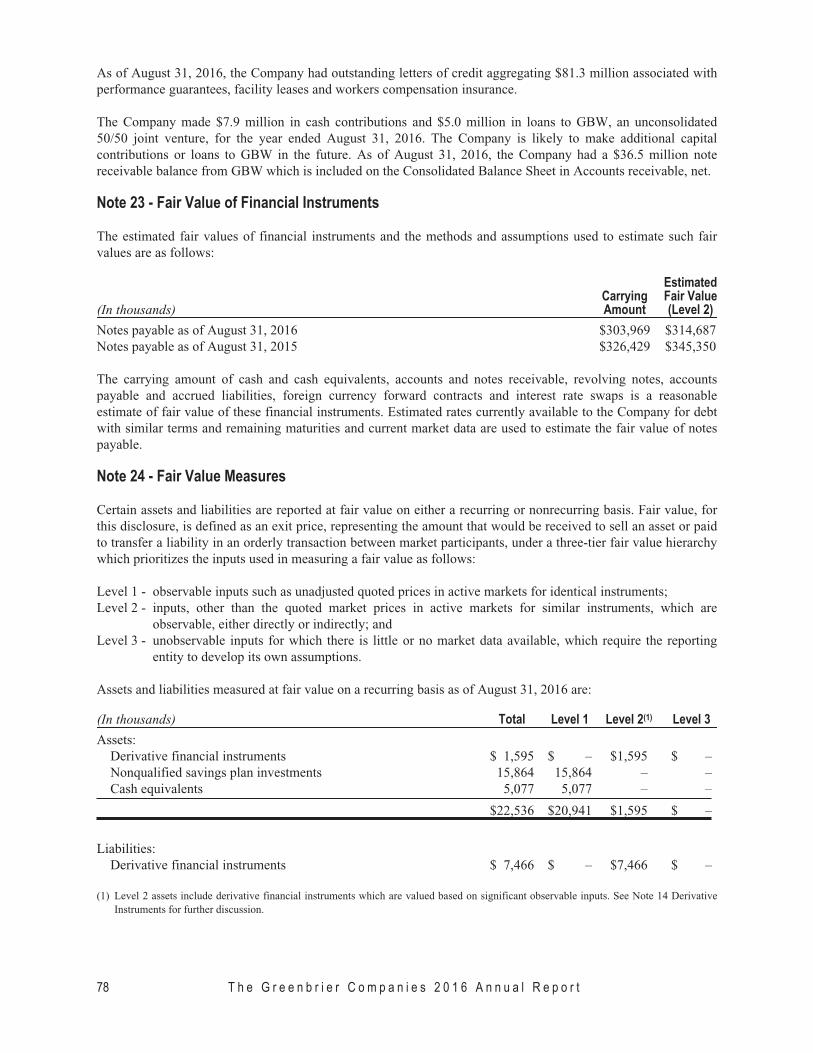
As of August 31, 2016, the Company had outstanding letters of credit aggregating $81.3 million associated with
performance guarantees, facility leases and workers compensation insurance.
The Company made $7.9 million in cash contributions and $5.0 million in loans to GBW, an unconsolidated
50/50 joint venture, for the year ended August 31, 2016. The Company is likely to make additional capital
contributions or loans to GBW in the future. As of August 31, 2016, the Company had a $36.5 million note
receivable balance from GBW which is included on the Consolidated Balance Sheet in Accounts receivable, net.
Note 23 - Fair Value of Financial Instruments
The estimated fair values of financial instruments and the methods and assumptions used to estimate such fair
values are as follows:
(In thousands)CarryingAmount
EstimatedFair Value(Level 2)
Notes payable as of August 31, 2016 $303,969 $314,687
Notes payable as of August 31, 2015 $326,429 $345,350
The carrying amount of cash and cash equivalents, accounts and notes receivable, revolving notes, accounts
payable and accrued liabilities, foreign currency forward contracts and interest rate swaps is a reasonable
estimate of fair value of these financial instruments. Estimated rates currently available to the Company for debt
with similar terms and remaining maturities and current market data are used to estimate the fair value of notes
payable.
Note 24 - Fair Value Measures
Certain assets and liabilities are reported at fair value on either a recurring or nonrecurring basis. Fair value, for
this disclosure, is defined as an exit price, representing the amount that would be received to sell an asset or paid
to transfer a liability in an orderly transaction between market participants, under a three-tier fair value hierarchy
which prioritizes the inputs used in measuring a fair value as follows:
Level 1 - observable inputs such as unadjusted quoted prices in active markets for identical instruments;
Level 2 - inputs, other than the quoted market prices in active markets for similar instruments, which are
observable, either directly or indirectly; and
Level 3 - unobservable inputs for which there is little or no market data available, which require the reporting
entity to develop its own assumptions.
Assets and liabilities measured at fair value on a recurring basis as of August 31, 2016 are:
(In thousands) Total Level 1 Level 2(1) Level 3
Assets:
Derivative financial instruments $ 1,595 $ – $1,595 $ –
Nonqualified savings plan investments 15,864 15,864 – –
Cash equivalents 5,077 5,077 – –
$22,536 $20,941 $1,595 $ –
Liabilities:
Derivative financial instruments $ 7,466 $ – $7,466 $ –
(1) Level 2 assets include derivative financial instruments which are valued based on significant observable inputs. See Note 14 Derivative
Instruments for further discussion.
78 T h e G r e e n b r i e r C o m p a n i e s 2 0 1 6 A n n u a l R e p o r t

Assets and liabilities measured at fair value on a recurring basis as of August 31, 2015 are:
(In thousands) Total Level 1 Level 2(1) Level 3
Assets:
Derivative financial instruments $ 1,913 $ – $1,913 $ –
Nonqualified savings plan investments 11,815 11,815 – –
Cash equivalents 5,071 5,071 – –
$18,799 $16,886 $1,913 $ –
Liabilities:
Derivative financial instruments $ 3,206 $ – $3,206 $ –
(1) Level 2 assets include derivative financial instruments which are valued based on significant observable inputs. See Note 14 Derivative
Instruments for further discussion.
Note 25 - Subsequent Event
In October 2016, the Company entered into an agreement with Astra Rail Management GmbH (Astra) to form a
new company, Greenbrier-Astra Rail, which will create an end-to-end, Europe-based freight railcar
manufacturing, engineering and repair business. The combined enterprise will be formed between Greenbrier’s
European operations headquartered in Swidnica, Poland and Astra Rail based in Germany and Arad, Romania. It
will be led by an experienced Europe-based management team from both companies. Greenbrier-Astra Rail will
offer manufacturing and service capability in Europe with greater scale and efficiency for current customers. It
also provides the opportunity to pursue growth in railcar markets in the GCC nations and Eurasia. Greenbrier-
Astra Rail will be controlled by Greenbrier with an approximate 75% interest. As partial consideration for its
majority interest, Greenbrier will pay Astra Rail €30 million at closing and €30 million 12 months after closing.
Greenbrier will provide a guarantee in connection with the €30 million to be paid to Astra twelve months after
the closing. Closing of the transaction is contingent on, among other conditions, achieving antitrust approval in
certain EU countries.
T h e G r e e n b r i e r C o m p a n i e s 2 0 1 6 A n n u a l R e p o r t 79

Quarterly Results of Operations (Unaudited)
(In thousands, except per share amount) First Second Third Fourth Total
2016
Revenue
Manufacturing $698,661 $454,531 $458,494 $484,645 $2,096,331
Wheels & Parts 78,729 90,458 78,417 74,791 322,395
Leasing & Services 24,999 124,090 75,955 35,754 260,798
802,389 669,079 612,866 595,190 2,679,524
Cost of revenue
Manufacturing 533,033 361,827 352,775 382,919 1,630,554
Wheels & Parts 73,002 81,388 69,818 69,543 293,751
Leasing & Services 11,589 105,973 63,175 23,045 203,782
617,624 549,188 485,768 475,507 2,128,087
Margin 184,765 119,891 127,098 119,683 551,437
Selling and administrative 36,549 38,244 43,280 40,608 158,681
Net gain on disposition of equipment (269) (10,746) (311) (4,470) (15,796)
Earnings from operations 148,485 92,393 84,129 83,545 408,552
Other costs
Interest and foreign exchange 5,436 1,417 3,712 2,937 13,502
Earnings before income tax and earnings (loss) from
unconsolidated affiliates 143,049 90,976 80,417 80,608 395,050
Income tax expense (44,719) (25,734) (22,449) (19,420) (112,322)
Earnings (loss) from unconsolidated affiliates 383 974 1,564 (825) 2,096
Net earnings 98,713 66,216 59,532 60,363 284,824
Net earnings attributable to noncontrolling interest (29,280) (21,348) (24,180) (26,803) (101,611)
Net earnings attributable to Greenbrier $ 69,433 $ 44,868 $ 35,352 $ 33,560 $ 183,213
Basic earnings per common share: (1) $ 2.36 $ 1.54 $ 1.22 $ 1.15 $ 6.28
Diluted earnings per common share: (1) $ 2.15 $ 1.41 $ 1.12 $ 1.06 $ 5.73
(1) Quarterly amounts may not total to the year to date amount as each period is calculated discretely. Diluted earnings per common share
includes the dilutive effect of the 2026 Convertible Notes using the treasury stock method when dilutive and the dilutive effect of shares
underlying the 2018 Convertible Notes using the “if converted” method in which debt issuance and interest costs, net of tax, were added
back to net earnings.
80 T h e G r e e n b r i e r C o m p a n i e s 2 0 1 6 A n n u a l R e p o r t

Quarterly Results of Operations (Unaudited)
(In thousands, except per share amount) First Second Third Fourth Total
2015
Revenue
Manufacturing $379,949 $505,241 $593,376 $657,485 $2,136,051
Wheels & Parts 86,624 102,640 97,407 84,566 371,237
Leasing & Services 28,485 22,268 23,823 23,414 97,990
495,058 630,149 714,606 765,465 2,605,278
Cost of revenue
Manufacturing 316,037 403,227 465,658 506,492 1,691,414
Wheels & Parts 76,872 92,768 89,645 75,395 334,680
Leasing & Services 14,081 8,844 10,017 8,889 41,831
406,990 504,839 565,320 590,776 2,067,925
Margin 88,068 125,310 149,286 174,689 537,353
Selling and administrative 33,729 32,899 45,595 39,568 151,791
Net gain on disposition of equipment (83) (121) (720) (406) (1,330)
Earnings from operations 54,422 92,532 104,411 135,527 386,892
Other costs
Interest and foreign exchange 3,141 1,929 4,285 1,824 11,179
Earnings before income tax and earnings (loss) from
unconsolidated affiliates 51,281 90,603 100,126 133,703 375,713
Income tax expense (16,054) (29,372) (30,783) (35,951) (112,160)
Earnings (loss) from unconsolidated affiliates 755 (185) 982 204 1,756
Net earnings 35,982 61,046 70,325 97,956 265,309
Net earnings attributable to noncontrolling interest (3,196) (10,695) (27,514) (31,072) (72,477)
Net earnings attributable to Greenbrier $ 32,786 $ 50,351 $ 42,811 $ 66,884 $ 192,832
Basic earnings per common share: (1) $ 1.19 $ 1.86 $ 1.54 $ 2.23 $ 6.85
Diluted earnings per common share: (1) $ 1.01 $ 1.57 $ 1.33 $ 2.02 $ 5.93
(1) Quarterly amounts do not total to the year to date amount as each period is calculated discretely. Diluted earnings per common share
includes the dilutive effect of the 2026 Convertible Notes using the treasury stock method when dilutive and the dilutive effect of shares
underlying the 2018 Convertible Notes using the “if converted” method in which debt issuance and interest costs, net of tax, were added
back to net earnings.
T h e G r e e n b r i e r C o m p a n i e s 2 0 1 6 A n n u a l R e p o r t 81
Item 9. CHANGES IN AND DISAGREEMENTS WITH ACCOUNTANTS ONACCOUNTING AND FINANCIAL DISCLOSURE
None.
Item 9A. CONTROLS AND PROCEDURES
Evaluation of Disclosure Controls and Procedures
Our management has evaluated, under the supervision and with the participation of our President and Chief
Executive Officer and Chief Financial Officer, the effectiveness of our disclosure controls and procedures as of
the end of the period covered by this report pursuant to Rule 13a-15(b) under the Securities Exchange Act of
1934 (the Exchange Act). Based on that evaluation, our President and Chief Executive Officer and Chief
Financial Officer have concluded that, as of the end of the period covered by this report, our disclosure controls
and procedures were effective in ensuring that information required to be disclosed in our Exchange Act reports
is (1) recorded, processed, summarized and reported in a timely manner, and (2) accumulated and communicated
to our management, including our President and Chief Executive Officer and Chief Financial Officer, as
appropriate to allow timely decisions regarding required disclosure.
Changes in Internal Controls
There have been no changes in our internal control over financial reporting during the quarter ended August 31,
2016 that have materially affected, or are reasonably likely to materially affect, the Company’s internal control
over financial reporting.
Management’s Report on Internal Control over Financial Reporting
Management of The Greenbrier Companies, Inc. together with its consolidated subsidiaries (the Company), is
responsible for establishing and maintaining adequate internal control over financial reporting. The Company’s
internal control over financial reporting is a process designed under the supervision of the Company’s principal
executive and principal financial officers to provide reasonable assurance regarding the reliability of financial
reporting and the preparation of the Company’s financial statements for external reporting purposes in
accordance with accounting principles generally accepted in the United States of America.
As of the end of the Company’s 2016 fiscal year, management conducted an assessment of the effectiveness of
the Company’s internal control over financial reporting based on the framework established in Internal Control –
Integrated Framework (2013) issued by the Committee of Sponsoring Organizations of the Treadway
Commission (COSO). Based on this assessment, management has determined that the Company’s internal
control over financial reporting as of August 31, 2016 is effective.
Our independent registered public accounting firm, KPMG LLP, independently assessed the effectiveness of the
Company’s internal control over financial reporting, as stated in their attestation report, which is included at the
end of Part II, Item 9A of this Form 10-K.
Inherent Limitations on Effectiveness of Controls
The Company’s management, including the Chief Executive Officer and Chief Financial Officer, does not expect
that our disclosure controls and procedures or our internal control over financial reporting will prevent or detect
all error and all fraud. A control system, no matter how well designed and operated, can provide only reasonable,
not absolute, assurance that the control system’s objectives will be met. The design of a control system must
reflect the fact that there are resource constraints, and the benefits of controls must be considered relative to their
costs. Further, because of the inherent limitations in all control systems, no evaluation of controls can provide
absolute assurance that misstatements due to error or fraud will not occur or that all control issues and instances
of fraud, if any, within the Company have been detected. These inherent limitations include the realities that
82 T h e G r e e n b r i e r C o m p a n i e s 2 0 1 6 A n n u a l R e p o r t

judgments in decision-making can be faulty and that breakdowns can occur because of simple error or mistake.
Controls can also be circumvented by the individual acts of some persons, by collusion of two or more people, or
by management override of the controls. The design of any system of controls is based in part on certain
assumptions about the likelihood of future events, and there can be no assurance that any design will succeed in
achieving its stated goals under all potential future conditions. Projections of any evaluation of controls
effectiveness to future periods are subject to risks. Over time, controls may become inadequate because of
changes in conditions or deterioration in the degree of compliance with policies or procedures.
T h e G r e e n b r i e r C o m p a n i e s 2 0 1 6 A n n u a l R e p o r t 83

REPORT OF INDEPENDENT REGISTERED PUBLIC ACCOUNTING FIRM
The Board of Directors and Stockholders
The Greenbrier Companies, Inc. and subsidiaries:
We have audited The Greenbrier Companies, Inc. and subsidiaries (the Company) internal control over financial
reporting as of August 31, 2016, based on “criteria established in Internal Control – Integrated Framework
(2013) issued by the Committee of Sponsoring Organizations of the Treadway Commission (COSO). The
Company’s management is responsible for maintaining effective internal control over financial reporting and for
its assessment of the effectiveness of internal control over financial reporting, included in the accompanying
Management’s Report on Internal Control over Financial Reporting. Our responsibility is to express an opinion
on the Company’s internal control over financial reporting based on our audit.
We conducted our audit in accordance with the standards of the Public Company Accounting Oversight Board
(United States). Those standards require that we plan and perform the audit to obtain reasonable assurance about
whether effective internal control over financial reporting was maintained in all material respects. Our audit
included obtaining an understanding of internal control over financial reporting, assessing the risk that a material
weakness exists, and testing and evaluating the design and operating effectiveness of internal control based on
the assessed risk. Our audit also included performing such other procedures as we considered necessary in the
circumstances. We believe that our audit provides a reasonable basis for our opinion.
A company’s internal control over financial reporting is a process designed to provide reasonable assurance
regarding the reliability of financial reporting and the preparation of financial statements for external purposes in
accordance with generally accepted accounting principles. A company’s internal control over financial reporting
includes those policies and procedures that (1) pertain to the maintenance of records that, in reasonable detail,
accurately and fairly reflect the transactions and dispositions of the assets of the company; (2) provide reasonable
assurance that transactions are recorded as necessary to permit preparation of financial statements in accordance
with generally accepted accounting principles, and that receipts and expenditures of the company are being made
only in accordance with authorizations of management and directors of the company; and (3) provide reasonable
assurance regarding prevention or timely detection of unauthorized acquisition, use, or disposition of the
company’s assets that could have a material effect on the financial statements.
Because of its inherent limitations, internal control over financial reporting may not prevent or detect
misstatements. Also, projections of any evaluation of effectiveness to future periods are subject to the risk that
controls may become inadequate because of changes in conditions, or that the degree of compliance with the
policies or procedures may deteriorate.
In our opinion, the Company maintained, in all material respects, effective internal control over financial
reporting as of August 31, 2016, based on criteria established in Internal Control – Integrated Framework (2013)
issued by the Committee of Sponsoring Organizations of the Treadway Commission (COSO).
We also have audited, in accordance with the standards of the Public Company Accounting Oversight Board
(United States), the consolidated balance sheets of The Greenbrier Companies, Inc. and subsidiaries as of August
31, 2016 and 2015, and the related consolidated statements of income, comprehensive income, equity, and cash
flows for each of the years in the three-year period ended August 31, 2016, and our report dated October 25,
2016 expressed an unqualified opinion on those consolidated financial statements.
/s/ KPMG LLP
Portland, OR
October 25, 2016
84 T h e G r e e n b r i e r C o m p a n i e s 2 0 1 6 A n n u a l R e p o r t

Item 9B. OTHER INFORMATION
None
PART III
Item 10. DIRECTORS AND EXECUTIVE OFFICERS AND CORPORATEGOVERNANCE
There is hereby incorporated by reference the information under the captions “Election of Directors,” “Board
Committees, Meetings and Charters,” “Section 16(a) Beneficial Ownership Reporting Compliance” and
“Executive Officers of the Company” in the Company’s definitive Proxy Statement to be filed pursuant to
Regulation 14A, which Proxy Statement is anticipated to be filed with the Securities and Exchange Commission
within 120 days after the end of Registrant’s year ended August 31, 2016.
Item 11. EXECUTIVE COMPENSATION
There is hereby incorporated by reference the information under the caption “Executive Compensation” and
“Compensation Committee Report” in Registrant’s definitive Proxy Statement to be filed pursuant to Regulation
14A, which Proxy Statement is anticipated to be filed with the Securities and Exchange Commission within 120
days after the end of Registrant’s year ended August 31, 2016.
Item 12. SECURITY OWNERSHIP OF CERTAIN BENEFICIAL OWNERS ANDMANAGEMENT AND RELATED STOCKHOLDERS MATTERS
There is hereby incorporated by reference the information under the captions “Security Ownership of Certain
Beneficial Owners and Management” and “Equity Compensation Plan Information” in Registrant’s definitive
Proxy Statement to be filed pursuant to Regulation 14A, which Proxy Statement is anticipated to be filed with the
Securities and Exchange Commission within 120 days after the end of Registrant’s year ended August 31, 2016.
Item 13. CERTAIN RELATIONSHIPS AND RELATED TRANSACTIONS ANDDIRECTOR INDEPENDENCE
There is hereby incorporated by reference the information under the caption “Transactions with Related Persons”
and “Independence of Directors” in Registrant’s definitive Proxy Statement to be filed pursuant to Regulation
14A, which Proxy Statement is anticipated to be filed with the Securities and Exchange Commission within 120
days after the end of Registrant’s year ended August 31, 2016.
Item 14. PRINCIPAL ACCOUNTING FEES AND SERVICES
There is hereby incorporated by reference the information under the caption “Ratification of Appointment of
Auditors” in Registrant’s definitive Proxy Statement to be filed pursuant to Regulation 14A, which Proxy
Statement is anticipated to be filed with the Securities and Exchange Commission within 120 days after the end
of the Registrant’s year ended August 31, 2016.
T h e G r e e n b r i e r C o m p a n i e s 2 0 1 6 A n n u a l R e p o r t 85

PART IV
Item 15. EXHIBITS AND FINANCIAL STATEMENT SCHEDULES
(1) Financial Statements
See Consolidated Financial Statements in Item 8
(a) (2) Financial Statements Schedule*
* All other schedules have been omitted because they are inapplicable, not required or because the information is given in the
Consolidated Financial Statements or notes thereto. This supplemental schedule should be read in conjunction with the
Consolidated Financial Statements and notes thereto included in this report.
(a) (3) The following exhibits are filed herewith and this list is intended to constitute the exhibit index:
3.1 Registrant’s Articles of Incorporation are incorporated herein by reference to Exhibit 3.1 to the
Registrant’s Form 10-Q filed April 5, 2006.
3.2 Articles of Merger amending the Registrant’s Articles of Incorporation are incorporated herein by
reference to Exhibit 3.2 to the Registrant’s Form 10-Q filed April 5, 2006.
3.3 Registrant’s Bylaws, as amended January 11, 2006, are incorporated herein by reference to Exhibit
3.3 to the Registrant’s Form 10-Q filed April 5, 2006.
3.4 Amendment to the Registrant’s Bylaws, dated October 31, 2006, is incorporated herein by reference
to Exhibit 3.1 to the Registrant’s Form 8-K filed November 6, 2006.
3.5 Amendment to the Registrant’s Bylaws, dated January 8, 2008, is incorporated herein by reference to
Exhibit 3.1 to the Registrant’s Form 8-K filed November 8, 2007.
3.6 Amendment to the Registrant’s Bylaws, dated April 8, 2008, is incorporated herein by reference to
Exhibit 3.1 to the Registrant’s Form 8-K filed April 11, 2008.
3.7 Amendment to the Registrant’s Bylaws, dated April 7, 2009, is incorporated herein by reference to
Exhibit 3.1 to the Registrant’s Form 8-K filed April 13, 2009.
3.8 Amendment to the Registrant’s Bylaws, dated June 8, 2009, is incorporated herein by reference to
Exhibit 3.1 to the Registrant’s Form 8-K filed June 10, 2009.
3.9 Amendment to the Registrant’s Bylaws, dated June 10, 2009, is incorporated herein by reference to
Exhibit 3.1 to the Registrant’s Form 8-K filed June 12, 2009.
3.10 Amendment to the Registrant’s Bylaws, dated October 30, 2012, is incorporated herein by reference
to Exhibit 3.1 to the Registrant’s Form 8-K filed November 5, 2012.
3.11 Amendment to the Registrant’s Bylaws, dated January 9, 2013, is incorporated herein by reference to
Exhibit 3.1 to the Registrant’s Form 8-K filed January 15, 2013.
3.12 Amendment to the Registrant’s Bylaws, dated October 29, 2013, is incorporated herein by reference
to Exhibit 3.1 to the Registrant’s Form 8-K filed October 31, 2013.
3.13 Amendment to the Registrant’s Bylaws, dated October 29, 2014, is incorporated herein by reference
to Exhibit 3.1 to the Registrant’s Form 8-K filed November 3, 2014.
3.14 Amendment to the Registrant’s Bylaws, dated March 31, 2015, is incorporated herein by reference to
Exhibit 3.1 to the Registrant’s Form 8-K filed April 6, 2015.
3.15 Amendment to the Registrant’s Bylaws, dated July 1, 2015, is incorporated herein by reference to
Exhibit 3.1 to the Registrant’s Form 8-K filed July 8, 2015.
3.16 Amendment to the Registrant’s Bylaws, dated October 21, 2015, is incorporated herein by reference
to Exhibit 3.1 to the Registrant’s Form 8-K filed October 22, 2015.
3.17 Amendment to the Registrant’s Bylaws, dated October 30, 2015, is incorporated herein by reference
to Exhibit 3.1 to the Registrant’s Form 8-K filed November 2, 2015.
86 T h e G r e e n b r i e r C o m p a n i e s 2 0 1 6 A n n u a l R e p o r t

4.1 Specimen Common Stock Certificate of Registrant is incorporated herein by reference to
Exhibit 4.1 to the Registrant’s Registration Statement on Form S-3 filed April 7, 2010 (SEC File
Number 333-165924).
4.2 Indenture between the Registrant and U.S. Bank National Association, as Trustee, including the
form of Global Note attached as Exhibit A thereto, dated April 5, 2011, is incorporated herein by
reference to Exhibit 4.1 to the Registrant’s Form 8-K filed April 5, 2011.
10.1* Amended and Restated Employment Agreement between the Registrant and Mr. William A.
Furman, dated August 28, 2012, is incorporated herein by reference to Exhibit 10.3 to the
Registrant’s Form 10-Q filed January 9, 2013.
10.2* Form of Amended and Restated Employment Agreement between the Registrant and certain of its
executive officers, as amended and restated on August 28, 2012, is incorporated herein by
reference to Exhibit 10.8 to the Registrant’s Form 10-K filed November 1, 2012.
10.3* Amendment No. 1 to Form of Amended and Restated Employment Agreement between the
Registrant and certain of its executive officers, as amended and restated on August 28, 2012, is
incorporated herein by reference to Exhibit 10.1 to the Registrant’s Form 10-Q filed January 8,
2014.
10.4* Form of Agreement concerning Indemnification and Related Matters (Directors) between
Registrant and its directors is incorporated herein by reference to Exhibit 10.2 to the Registrant’s
Form 10-Q filed July 1, 2015.
10.5* Form of Agreement concerning Indemnification and Related Matters (Officers) between
Registrant and its officers is incorporated herein by reference to Exhibit 10.2 to the Registrant’s
Form 10-Q filed April 4, 2013.
10.6* Form of Change of Control Agreement is incorporated herein by reference to Exhibit 10.5 to the
Registrant’s Form 10-Q filed April 4, 2013.
10.7* The Greenbrier Companies, Inc. Form of Amendment to Change of Control Agreement, approved
on May 28, 2013, is incorporated herein by reference to Exhibit 10.2 of the Registrant’s Form 8-K
filed June 6, 2013.
10.8* The Greenbrier Companies, Inc. 2014 Amended and Restated Stock Incentive Plan is incorporated
herein by reference to Appendix A to the Registrant’s Proxy Statement on Schedule 14A filed
November 19, 2014.
10.9* Form of Director Restricted Share Agreement related to the 2010 Amended and Restated Stock
Incentive Plan is incorporated herein by reference to Exhibit 10.1 to the Registrant’s Form 10-Q
filed April 3, 2014.
10.10* The Greenbrier Companies, Inc. Nonqualified Deferred Compensation Plan Basic Plan Document
is incorporated herein by reference to Exhibit 10.38 to the Registrant’s Form 10-K filed
November 4, 2011.
10.11* The Greenbrier Companies Nonqualified Deferred Compensation Plan Adoption Agreement is
incorporated herein by reference to Exhibit 10.39 to the Registrant’s Form 10-K filed
November 4, 2011.
10.12* Amendment No. 1 to the Greenbrier Companies Nonqualified Deferred Compensation Plan
Adoption Agreement, dated May 25, 2011, is incorporated herein by reference to Exhibit 10.1 to
the Registrant’s Form 10-Q filed July 8, 2011.
10.13* Amendment No. 2 to the Greenbrier Companies Nonqualified Deferred Compensation Plan
Adoption Agreement, dated August 28, 2012, is incorporated herein by reference to Exhibit 10.27
to the Registrant’s Form 10-K filed November 1, 2012.
10.14* Amendment No. 3 to the Greenbrier Companies Nonqualified Deferred Compensation Plan
Adoption Agreement, dated January 1, 2014, is incorporated herein by reference to Exhibit 10.1 to
the Registrant’s Form 10-Q filed January 7, 2015.
T h e G r e e n b r i e r C o m p a n i e s 2 0 1 6 A n n u a l R e p o r t 87

10.15* Amendment No. 4 to the Greenbrier Companies Nonqualified Deferred Compensation Plan
Adoption Agreement, dated October 28, 2014, is incorporated herein by reference to Exhibit 10.2
to the Registrant’s Form 10-Q filed January 7, 2015.
10.16* Amendment No. 5 to the Greenbrier Companies Nonqualified Deferred Compensation Plan
Adoption Agreement, dated December 8, 2015, is incorporated herein by reference to Exhibit 10.2
to the Registrant’s Form 10-Q filed April 5, 2016.
10.17* Updated Rabbi Trust Agreements, dated October 1, 2012, related to The Greenbrier Companies,
Inc. Nonqualified Deferred Compensation Plan, are incorporated herein by reference to Exhibit
10.1 to the Registrant’s Form 10-Q filed January 9, 2013.
10.18* The Greenbrier Companies Nonqualified Deferred Compensation Plan Adoption Agreement for
Directors, dated July 1, 2012, is incorporated herein by reference to Exhibit 10.28 to the
Registrant’s Form 10-K filed November 1, 2012.
10.19* Amendment No. 1 to the Greenbrier Companies Nonqualified Deferred Compensation Plan
Adoption Agreement for Directors, dated December 15, 2015, is incorporated herein by reference
to Exhibit 10.1 to the Registrant’s Form 10-Q filed April 5, 2016.
10.20* Updated Rabbi Trust Agreements, dated October 1, 2012, related to the Greenbrier
Companies, Inc. Nonqualified Deferred Compensation Plan for Directors, are incorporated herein
by reference to Exhibit 10.2 to the Registrant’s Form 10-Q filed January 9, 2013.
10.21* The Greenbrier Companies, Inc. Form of Restricted Stock Unit Agreement, approved on May 5,
2014, is incorporated herein by reference to Exhibit 10.1 of the Registrant’s Form 8-K filed
May 9, 2014.
10.22* The Greenbrier Companies, Inc. Form of Restricted Stock Unit Agreement, approved on May 22,
2015, is incorporated herein by reference to Exhibit 10.1 of the Registrant’s Form 10-Q filed
July 1, 2015.
10.23* The Greenbrier Companies, Inc. 2014 Employee Stock Purchase Plan is incorporated herein by
reference to Appendix B to the Registrant’s Definitive Proxy Statement on Schedule 14A filed on
November 19, 2014.
10.24* Consulting Services Agreement between Greenbrier Leasing Company LLC and Charles J.
Swindells dated January 7, 2016 is incorporated herein by reference to Exhibit 10.3 to the
Registrant’s Form 10-Q filed April 5, 2016.
10.25* Separation and Consulting Agreement between James T. Sharp and the Registrant dated May 10,
2016 is incorporated herein by reference to Exhibit 10.2 to the Registrant’s Form 10-Q filed
July 6, 2016.
10.26 Purchase Agreement among The Greenbrier Companies, Inc., Merrill Lynch, Pierce, Fenner &
Smith Incorporated and Goldman, Sachs & Co., dated March 30, 2011, is incorporated herein by
reference to Exhibit 10.1 to the Registrant’s Form 8-K filed April 5, 2011.
10.27 The Greenbrier Companies, Inc. Executive Stock Ownership Guidelines, adopted as of August 28,
2012, are incorporated herein by reference to Exhibit 10.39 to the Registrant’s Form 10-K filed
November 1, 2012.
10.28 Contribution Agreement, dated July 18, 2014, by and among Watco Companies, L.L.C., the
Registrant, and with respect to Article III and Article IX only, GBW Railcar Services Holdings,
L.L.C., is incorporated herein by reference to Exhibit 10.1 to the Registrant’s Form 8-K filed
July 24, 2014.
10.29 Amended and Restated Limited Liability Company Agreement of GBW Railcar Services
Holdings, L.L.C., dated July 18, 2014, by and among the Registrant, Watco Mechanical Services,
L.L.C., and Millennium Rail, Inc., is incorporated herein by reference to Exhibit 10.2 to the
Registrant’s Form 8-K filed July 24, 2014.
10.30 Credit Agreement, dated March 20, 2014, by and among Greenbrier Leasing Company LLC, an
Oregon limited liability company, Bank of America, N.A., as Administrative Agent, Union Bank,
88 T h e G r e e n b r i e r C o m p a n i e s 2 0 1 6 A n n u a l R e p o r t

N.A., as Syndication Agent, Merrill Lynch, Pierce, Fenner & Smith Incorporated, as Sole Lead
Arranger and Sole Book Manager, and the lenders identified therein is incorporated herein by
reference to Exhibit 10.1 to the Registrant’s Form 8-K filed March 26, 2014.
10.31 First Amendment to Credit Agreement, dated February 29, 2016, among Greenbrier Leasing
Company LLC, Bank of America, N.A. as Administrative Agent, and the lenders identified therein
is incorporated herein by reference to Exhibit 10.5 to the Registrant’s Form 10-Q filed April 5,
2016.
10.32 Termination and Future Sharing Agreement, dated September 30, 2015, between Greenbrier
Leasing Company and WLR-Greenbrier Rail Inc. is incorporated herein by reference to Exhibit
10.1 to the Registrant’s Form 10-Q/A filed March 25, 2016.
10.33 Purchase and Sale Agreement, dated September 30, 2015, between Greenbrier Leasing Company
and WL Ross-Greenbrier Rail I LLC is incorporated herein by reference to Exhibit 10.2 to the
Registrant’s Form 10-Q/A filed March 25, 2016.
10.34 Third Amended and Restated Credit Agreement, dated as of October 29, 2015, by and among The
Greenbrier Companies, Inc., Bank of America, N.A., as Administrative Agent, MUFG Union
Bank, N.A., as Syndication Agent, Bank of the West, Fifth Third Bank and Wells Fargo Bank,
National Association, as Co-Documentation Agents, Merrill Lynch, Pierce, Fenner & Smith
Incorporated, as Sole Lead Arranger and Sole Bookrunner, and the lenders identified therein is
incorporated herein by reference to Exhibit 10.1 of the Registrant’s Form 8-K filed October 30,
2015.
10.35 Third Amended and Restated Security Agreement, dated as of October 29, 2015, by and among
The Greenbrier Companies, Inc., and the other parties identified as Debtors therein, in favor of
Bank of America, N.A., as Administrative Agent is incorporated herein by reference to Exhibit
10.2 of the Registrant’s Form 8-K filed October 30, 2015.
10.36 Third Amended and Restated Pledge Agreement, dated as of October 29, 2015, by and among The
Greenbrier Companies, Inc., and the other parties identified as Debtors therein, in favor of Bank of
America, N.A., as Administrative Agent is incorporated herein by reference to Exhibit 10.3 of the
Registrant’s Form 8-K filed October 30, 2015.
14.1 Code of Business Conduct and Ethics is incorporated herein by reference to Exhibit 14.1 to the
Registrant’s Form 8-K filed January 12, 2016.
21.1 List of the subsidiaries of the Registrant.
23.1 Consent of KPMG LLP, independent auditors.
31.1 Certification pursuant to Rule 13(a) – 14(a).
31.2 Certification pursuant to Rule 13(a) – 14(a).
32.1 Certification pursuant to 18 U.S.C. Section 1350 as adopted pursuant to Section 906 of the
Sarbanes-Oxley Act of 2002.
32.2 Certification pursuant to 18 U.S.C. Section 1350 as adopted pursuant to Section 906 of the
Sarbanes-Oxley Act of 2002.
101 The following financial information from the Company’s Annual Report on Form 10-K for the
year ended August 31, 2016, formatted in XBRL (eXtensible Business Reporting Language) and
furnished electronically herewith: (i) the Consolidated Balance Sheets; (ii) the Consolidated
Statements of Income; (iii) Consolidated Statements of Comprehensive Income (iv) the
Consolidated Statements of Equity (v) the Consolidated Statements of Cash Flows; (vi) the Notes
to Condensed Consolidated Financial Statements.
* Management contract or compensatory plan or arrangement
Note: For all exhibits incorporated by reference, unless otherwise noted above, the SEC file number is 001-
13146.
T h e G r e e n b r i e r C o m p a n i e s 2 0 1 6 A n n u a l R e p o r t 89

SIGNATURES
Pursuant to the requirements of Section 13 or 15(d) of the Securities and Exchange Act of 1934, the Registrant
has duly caused this report to be signed on its behalf by the undersigned, thereunto duly authorized.
THE GREENBRIER COMPANIES, INC.
Dated: October 25, 2016 By: /s/ William A. Furman
William A. Furman
President and Chief Executive Officer
Pursuant to the requirements of the Securities Exchange Act of 1934, this report has been signed below by the
following persons on behalf of the Registrant and in the capacities and on the dates indicated.
Signature Date
/s/ William A. Furman
William A. Furman, President,
Chief Executive Officer and Chairman of the Board
October 25, 2016
/s/ Duane C. McDougall
Duane C. McDougall, Director
October 25, 2016
/s/ Graeme A. Jack
Graeme A. Jack, Director
October 25, 2016
/s/ Charles J. Swindells
Charles J. Swindells, Director
October 25, 2016
/s/ Wendy L. Teramoto
Wendy L. Teramoto, Director
October 25, 2016
/s/ Donald A. Washburn
Donald A. Washburn, Director
October 25, 2016
/s/ Kelly M. Williams
Kelly M. Williams, Director
October 25, 2016
/s/ Thomas B. Fargo
Thomas B. Fargo, Director
October 25, 2016
/s/ Lorie L. Tekorius
Lorie L. Tekorius, Senior Vice President, Chief Financial
Officer and Treasurer (Principal Financial Officer)
October 25, 2016
/s/ Adrian J. Downes
Adrian J. Downes, Senior Vice President and Chief
Accounting Officer (Principal Accounting Officer)
October 25, 2016
90 T h e G r e e n b r i e r C o m p a n i e s 2 0 1 6 A n n u a l R e p o r t

CERTIFICATIONS
The Company filed the required 303A.12(a) New York Stock Exchange Certification of its Chief Financial
Officer with the New York Stock Exchange with no qualifications following the 2016 Annual Meeting of
Shareholders and the Company filed as an exhibit to its Annual Report on Form 10-K for the year ended August
31, 2015, as filed with the Securities and Exchange Commission, a Certification of the Chief Executive Officer
and a Certification of the Chief Financial Officer pursuant to 18 U.S.C. Section 1350, as adopted pursuant to
Section 302 of the Sarbanes-Oxley Act of 2002.
T h e G r e e n b r i e r C o m p a n i e s 2 0 1 6 A n n u a l R e p o r t 91
DIRECTORS
William A. Furman Duane C. McDougall (1)(2)(3) Donald A. Washburn (1)(2)(3)
Chairman of the Board
Director
Independent Director Independent Director
Thomas B. Fargo (2)(3) Charles J. Swindells (3) Kelly M. Williams (1)(3)
Independent Director Independent Director Independent Director
Graeme A. Jack (1)(2)(3) Wendy L. Teramoto
Independent Director Director
(1)Member of Audit Committee(2)Member of Compensation Committee(3)Member of Nominating and Corporate
Governance Committee
OFFICERS
William A. Furman Adrian J. Downes Mark J. Rittenbaum
Chief Executive Officer Senior Vice President Executive Vice President
Chief Accounting Officer Commercial and Leasing
Martin R. Baker Walter T. Hannan James T. Sharp
Senior Vice President Senior Vice President Executive Vice President
Chief Compliance Officer Chief Human Resources Officer President, Greenbrier Leasing Company
General Counsel
Alejandro Centurion Anne T. Manning Lorie L. Tekorius
Executive Vice President Vice President Senior Vice President
President, Global Manufacturing Operations Corporate Controller Chief Financial Officer and Treasurer
James A. Cowan Victoria McManus Rick M. Turner
President, Greenbrier International Executive Vice President Senior Vice President
Chief Executive Officer, Chief Strategic Officer Greenbrier Rail Services
GBW Railcar Services, LLC Strategic Execution and Operations
Sherrill A. Corbett
Corporate Secretary
INVESTOR INFORMATION
CORPORATE OFFICES FINANCIAL INFORMATION INDEPENDENT AUDITORS
The Greenbrier Companies, Inc. Requests for copies of this annual report KPMG LLP
One Centerpointe Drive, Suite 200 and other financial information should Portland, Oregon
Lake Oswego, OR 97035 be made to:
ANNUAL SHAREHOLDERS’
MEETING
Investor Relations
The Greenbrier Companies, Inc.
One Centerpointe Drive, Suite 200
Lake Oswego, Oregon 97035
TRANSFER AGENT
Computershare Trust Company, N.A.
PO Box 30170
Friday, January 6, 2017
2:00 p.m.
Benson Hotel
309 SW Broadway, Portland, Oregon
E-mail: [email protected]
503-684-7000
College Station, TX 77842-3170
Greenbrier’s Transfer Agent maintains
stockholder records, issues stock certificates
and distributes dividends. Requests
LEGAL COUNSEL
Tonkon Torp LLP
Portland, Oregon
concerning these matters should be directed
to Computershare Trust Company, N.A.

www.gbrx.com