[email protected] school of dental sciences bascd survey sampling girvan burnside university of...
TRANSCRIPT

[email protected] School of Dental Sciences
BASCD Survey Sampling
Girvan Burnside
University of Liverpool

[email protected] School of Dental Sciences
Survey sampling
• British Association for the Study of Community Dentistry (BASCD) guidance on sampling for surveys of child dental health. A BASCD coordinated dental epidemiology programme quality standard. C.M. Pine, N.B. Pitts and Z.J. Nugent. Community Dental Health (1997) 14. (Supplement 1). 10-17
• The sampling principles detailed in this paper stand. This presentation shows how they can be applied to the new requirement to report at both LA and PCT level.

[email protected] School of Dental Sciences
Sampling schools
• CDH paper suggests• Small schools: ≤15 pupils – examine all
• Medium schools: 16-49 pupils – examine 1 in 2
• Large schools: ≥50 pupils – examine 1 in 4
• Suggested alternative• Small schools: <30 pupils – examine all
• Large school: ≥30 pupils – examine 1 in 2

[email protected] School of Dental Sciences
Example of sampling
School size Number of schools
Number of children
<30 66 851
≥30 51 2688
Total 117 3539

[email protected] School of Dental Sciences
Example of sampling
School size
Number of schools
Number of children
% of population
Sample required
<30 66 851 24% 120
≥30 51 2688 76% 380
Total 117 3539 100% 500

[email protected] School of Dental Sciences
• Sampling procedure follows the same steps as detailed in Appendix 1 to Pine et al (1997)
• Recommended minimum number sampled in each sampling unit is 300


[email protected] School of Dental Sciences
Scenario 1
• Sampling unit is LA
• Aim for minimum of 250 children examined
• Estimates for LA and PCT calculated normally, no weighting required
• Estimates for LA/PCT are identical

[email protected] School of Dental Sciences
Scenario 2
• Multiple LAs completely contained in one PCT
LA 1
LA 3
LA 2
LA 4
PCT 1

[email protected] School of Dental Sciences
• Sampling unit is LA
• Aim for minimum 250 children examined in each LA
• Estimates for each LA calculated normally, no weighting required
• Estimates for PCT must be calculated using weighting
[email protected] School of Dental Sciences
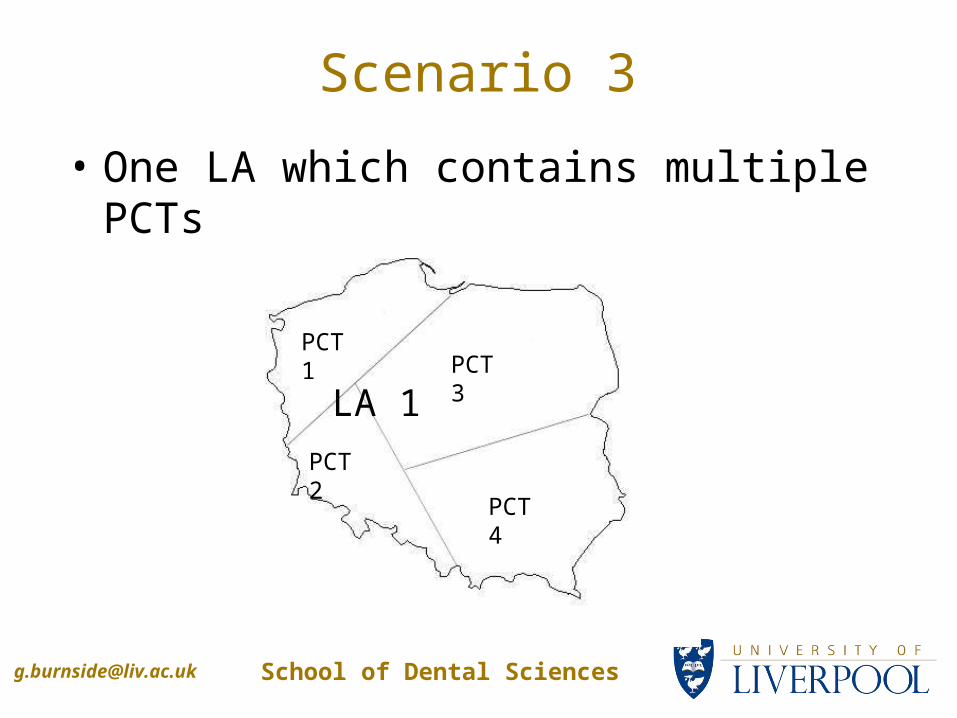
Scenario 3
• One LA which contains multiple PCTs
PCT 1
PCT 2
PCT 3
PCT 4
LA 1

[email protected] School of Dental Sciences
• Sampling unit is PCT
• Aim for minimum 250 children examined in each PCT
• Estimates for each PCT calculated normally, no weighting required
• Estimates for LA must be calculated using weighting

[email protected] School of Dental Sciences
Weighting
• This procedure for calculation of weighted estimates is detailed in Pine et al., (1997)
• Example:
• One PCT, containing 4 local authorities, each with 250 children examined.

[email protected] School of Dental Sciences
Weighting example
• For each LA, we need to know:
• The number of children in the 5-year-old population (N)
• The number of children examined (n)
• The sample mean (y)
• The sample standard deviation (s), or sample variance (s2)

[email protected] School of Dental Sciences
Weighting example (cont)LA Popn Number
examinedSample mean
Sample s.d
Sample variance
Weight Weight squared
1 1000 250 2.5 3.46 12 0.13 0.018
2 2000 250 1.1 2.83 8 0.27 0.071
3 500 250 3.2 3.87 15 0.07 0.004
4 4000 250 2.2 3.16 10 0.53 0.284
Total 7500 1000
Weights are calculated as the proportion of the total population in the area.
So, for LA1, the weight is 1000/7500 = 0.13
Note the variance is the square of the standard deviation
[email protected] School of Dental Sciences
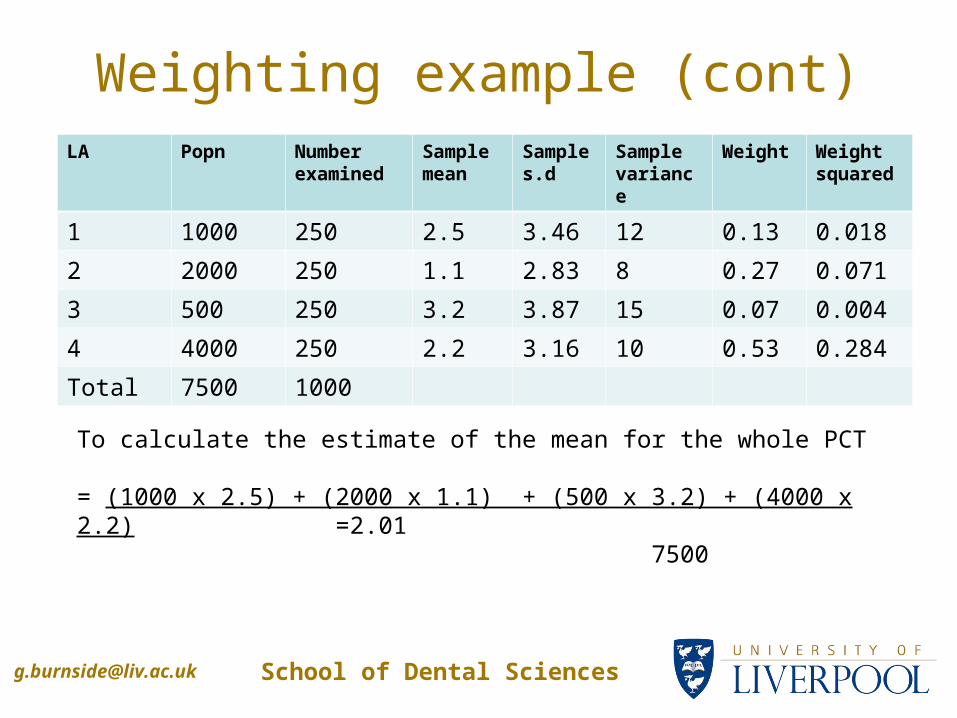
Weighting example (cont)
To calculate the estimate of the mean for the whole PCT
= (1000 x 2.5) + (2000 x 1.1) + (500 x 3.2) + (4000 x 2.2) =2.01 7500
LA Popn Number examined
Sample mean
Sample s.d
Sample variance
Weight Weight squared
1 1000 250 2.5 3.46 12 0.13 0.018
2 2000 250 1.1 2.83 8 0.27 0.071
3 500 250 3.2 3.87 15 0.07 0.004
4 4000 250 2.2 3.16 10 0.53 0.284
Total 7500 1000

[email protected] School of Dental Sciences
Weighting example (cont)
To calculate the estimate of the standard error for the population mean for the PCT
= 0.018 x 12 + 0.071 x 8 + 0.004 x 15 + 0.284 x 10 =0.12 250 250 250 250
LA Popn Number examined
Sample mean
Sample s.d
Sample variance
Weight Weight squared
1 1000 250 2.5 3.46 12 0.13 0.018
2 2000 250 1.1 2.83 8 0.27 0.071
3 500 250 3.2 3.87 15 0.07 0.004
4 4000 250 2.2 3.16 10 0.53 0.284
Total 7500 1000

[email protected] School of Dental Sciences
Weighting example (cont)
• To calculate the 95% confidence interval for the population mean
• Mean estimate ± 1.96 x S.E. estimate
• In this example, 95% CI is
2.01 ± 1.96 x 0.12
= 1.78 to 2.25

[email protected] School of Dental Sciences
Weighted estimates of proportions
• Some areas may wish to calculate estimates of the proportion affected by caries
LA Popn Number examined
Sample proportion
Variance of sample proportion
Weight Weight squared
1 1000 250 0.58 0.13 0.018
2 2000 250 0.29 0.27 0.071
3 500 250 0.65 0.07 0.004
4 4000 250 0.42 0.53 0.284
Total 7500 1000

[email protected] School of Dental Sciences
Weighted estimates of proportions
• The variance of a sample proportion p is given by p(1-p)
• So for LA 1, variance is 0.58 x (1 - 0.58) = 0.244
LA Popn Number examined
Sample proportion
Variance of sample proportion
Weight Weight squared
1 1000 250 0.58 0.244 0.13 0.018
2 2000 250 0.29 0.206 0.27 0.071
3 500 250 0.65 0.228 0.07 0.004
4 4000 250 0.42 0.244 0.53 0.284
Total 7500 1000

[email protected] School of Dental Sciences
Weighted estimates of proportions
LA Popn Number examined
Sample proportion
Variance of sample proportion
Weight Weight squared
1 1000 250 0.58 0.244 0.13 0.018
2 2000 250 0.29 0.206 0.27 0.071
3 500 250 0.65 0.228 0.07 0.004
4 4000 250 0.42 0.244 0.53 0.284
Total 7500 1000
To calculate the estimate of the proportion for the whole PCT
= (1000 x 0.58) + (2000 x 0.29) + (500 x 0.65) + (4000 x 0.42) = 0.42 7500

[email protected] School of Dental Sciences
Weighted estimates of proportions
LA Popn Number examined
Sample proportion
Variance of sample proportion
Weight Weight squared
1 1000 250 0.58 0.244 0.13 0.018
2 2000 250 0.29 0.206 0.27 0.071
3 500 250 0.65 0.228 0.07 0.004
4 4000 250 0.42 0.244 0.53 0.284
Total 7500 1000
To calculate the estimate of the standard error for the population mean for the PCT
= 0.018 x 0.244 + 0.071 x 0.206 + 0.004 x 0.228 + 0.284 x 0.244 =0.019 250 250 250 250

[email protected] School of Dental Sciences
Weighting estimates of proportions
• To calculate the 95% confidence interval for the population proportion
• Proportion estimate ± 1.96 x S.E. estimate
• In this example, 95% CI is
0.42 ± 1.96 x 0.019
= 0.38 to 0.46

[email protected] School of Dental Sciences
• LA crosses PCT boundaries
Scenario 4
LA 1
LA 2
LA 3
LA 5
LA 4
PCT 1 (grey)
PCT 2 (white)

[email protected] School of Dental Sciences
Scenario 4
• Here LA 3 crosses between 2 PCTs.
• Sampling of LA 3 must ensure that valid estimates can be produced for both PCTs.

[email protected] School of Dental Sciences
Scenario 4 guidelines
• The 2 parts of LA 3 should be sampled from separately, and weighting applied to calculated estimates
• If either section only has a few schools, examine all schools in that section
• Please discuss plans for sampling these areas with me

[email protected] School of Dental Sciences
List of LAs which cross PCT boundaries
• Aylesbury Vale• Braintree• City of Stoke-on-Trent• Crewe and Nantwich• High Peak• North Lincolnshire• Runnymede• South Oxfordshire• Staffordshire Moorlands• Vale of White Horse• Vale Royal• Wealden

[email protected] School of Dental Sciences
Subgroups
• Some PCTs may wish to examine subgroups within a local authority
• This can be done following the guidance in appendix 2 of Pine et al., (1997).

[email protected] School of Dental Sciences
Example
• A local authority is made up of an city (5-year old population 2500), and surrounding rural areas (population 500)
• We want to obtain estimates for both the urban and rural areas of the LA.
• For subgroup analysis, a minimum sample of 100 in each subgroup is desirable
[email protected] School of Dental Sciences
Example (continued)
• It is decided to take a sample of 250 in the urban area, and 100 in the rural areas.

[email protected] School of Dental Sciences
Example (continued)
Mean = (2500 x 2.7) + (500 x 1.4) =2.48 3000
S.E. = 0.694 x 10 + 0.028 x 8 =0.17 250 100
95% CI = 2.48 ± 1.96 x 0.17 = 2.14 to 2.82
LA Popn Number examined
Sample mean
Sample variance
Weight Weight squared
Urban 2500 250 2.7 10 0.83 0.694
Rural 500 100 1.4 8 0.17 0.028
Total 3000 350

[email protected] School of Dental Sciences
Example (continued)
• The LA we have just sampled is part of a PCT which contains one other LA
LA 1
LA 2Rural
Urban

[email protected] School of Dental Sciences
Example (continued)
• When calculating the estimates for the PCT, it is important to keep the individual sampling units in LA 1 separate
LA Popn Number examined
Sample mean
Sample variance
Weight Weight squared
LA1 Urban
2500 250 2.7 10
LA1 Rural
500 100 1.4 8
LA2 1500 300 3.6 12
Total 4500 650

[email protected] School of Dental Sciences
Example (continued)
• When calculating the estimates for the PCT, it is important to keep the individual sampling units in LA 1 separate
LA Popn Number examined
Sample mean
Sample variance
Weight Weight squared
LA1 Urban
2500 250 2.7 10 0.56 0.309
LA1 Rural
500 100 1.4 8 0.11 0.012
LA2 1500 300 3.6 12 0.33 0.111
Total 4500 650

[email protected] School of Dental Sciences
Mean = (2500 x 2.7) + (500 x 1.4) + (1500 x 3.6) =2.86 4500
S.E. = 0.309 x 10 + 0.012 x 8 + 0.111 x 12 =0.13 250 100 300
95% CI = 2.86 ± 1.96 x 0.13 = 2.59 to 3.12
LA Popn Number examined
Sample mean
Sample variance
Weight Weight squared
LA1 Urban
2500 250 2.7 10 0.56 0.309
LA1 Rural
500 100 1.4 8 0.11 0.012
LA2 1500 300 3.6 12 0.33 0.111
Total 4500 650

[email protected] School of Dental Sciences
Weighting calculations
• An Excel spreadsheet to perform calculation of weighted means and confidence intervals can be downloaded
http://pcwww.liv.ac.uk/~gburnsid/bascd.htm

[email protected] School of Dental Sciences
Note
• The confidence intervals here are approximations
• Approximations are accurate where the number examined is much smaller than the population
• Where large proportions of the population are examined (e.g. census), the confidence intervals may be too wide
• The Excel spreadsheet calculates accurate confidence intervals

[email protected] School of Dental Sciences
Summary
• Ensure estimates can be calculated at both LA and PCT level
• Sample at LA level, except where one LA contains multiple PCTs
• For non-coterminous PCTs/LAs, seek advice
• This presentation can be downloaded at
http://pcwww.liv.ac.uk/~gburnsid/bascd.htm