gaylord opryland resort and convention center nashville,...
TRANSCRIPT
Thursday, October 11, 2012 Gaylord Opryland Resort and Convention Center
Nashville, TN

Keynote
Quint Studer Thursday, October 11, 2012

Observations
No victim thinking Control our own destiny People need you You not only save lives but you save healthcare

WHY
WHAT
HOW
Communication Tip

Field of Dreams

Tips
Validating the Message - Feedback/Communication Power of Role Modeling

“Vision without execution is hallucination.” Thomas Edison

Structure Execution
Strategy
Results
Result Triangle

Consistency Reliability
Accountability
Execution Triangle

Myths
Patients: They have unrealistic expectations Staff: Leaders job is to get everyone on board Physicians: It is impossible to get physicians aligned Leadership: Engagement of people and patient experience are soft skills Data: Low “n” – means the data isn’t useful Scoring: The best way to improve a score is to focus on it Easy: Seems common sense so it is simple

Reimbursement changes, technology changes, procedures
change, medications change, events and people change, the
most important skill is to create a culture that has the agility and
ability and to adapt to the changes.

When you know you have a solution to a
problem that is causing pain for someone – you have a human
responsibility to act, and to do so with all
urgency.
~ Quint Studer
Human Responsibility

Beth Keane

Studer Group Partners Outperform the Nation across HCAHPS Composites
25 Overall Rating
Studer Group Difference over Non-Partners in National Percentile Ranking
Studer Group Difference over Non-Partners in National Percentile Ranking
Source: The graph above shows a comparison of the average percentile rank for Studer Group Partners that have received EBL coaching since Oct 2008 and non-partners for each composite; updated 7.24.12 using 4Q10-3Q11 CMS data.

Studer Group Partners Outperform the Nation across HCAHPS Composites
1.7
0.9 Patients who gave a ratingof 9 or 10 (high)
Average Change in Top Box Results in One Year
Studer Group Partners vs. Non Partner
Non-Partner Change 4Q09-3Q10 to 4Q10-3Q11SG Partners Change 4Q09-3Q10 to 4Q10-3Q11
Source: The graph compares the change In one year in “top box” results achieved by Studer Group partners vs. non-partners. Change is from 4Q09-3Q10 to 4Q10-3Q11. The “top-box” is the most positive response to HCAHPS survey questions.

Studer Group Partners Perform Better Than the Nation in Core Measures
92.50%
96.90%94.90%
98.34% 98.29%96.98%
95.83%
87.70%
95.70%
93.20%
96.42%97.29%
95.82%94.55%
80%82%84%86%88%90%92%94%96%98%
100%
Heart failure ptsgiven discharge
instructions
Pneumonia ptswhose initial ER
blood culture wasperformed priorto the admin ofthe first Hosp
dose ofAntibiotics
Pneumonia ptsgiven the most
appropriateinitial
antibiotics(s)
Surgery pts whowere given an
antibiotic at thert time
Surgery pts whowere given the rtkind of antibioticto help prevent
infection
Surgery ptswhose
preventativeantibiotics werestopped at the rt
time
Heart surgery ptswhose bloodsugar is keptunder good
control in thedays rt after
surgery
SG Partners SG Non-Partners
Heart Failure Pneumonia Healthcare-Associated Infections
Data that CMS footnoted, “number of cases is too small to be sure how well a hospital is performing” has been removed from this analysis
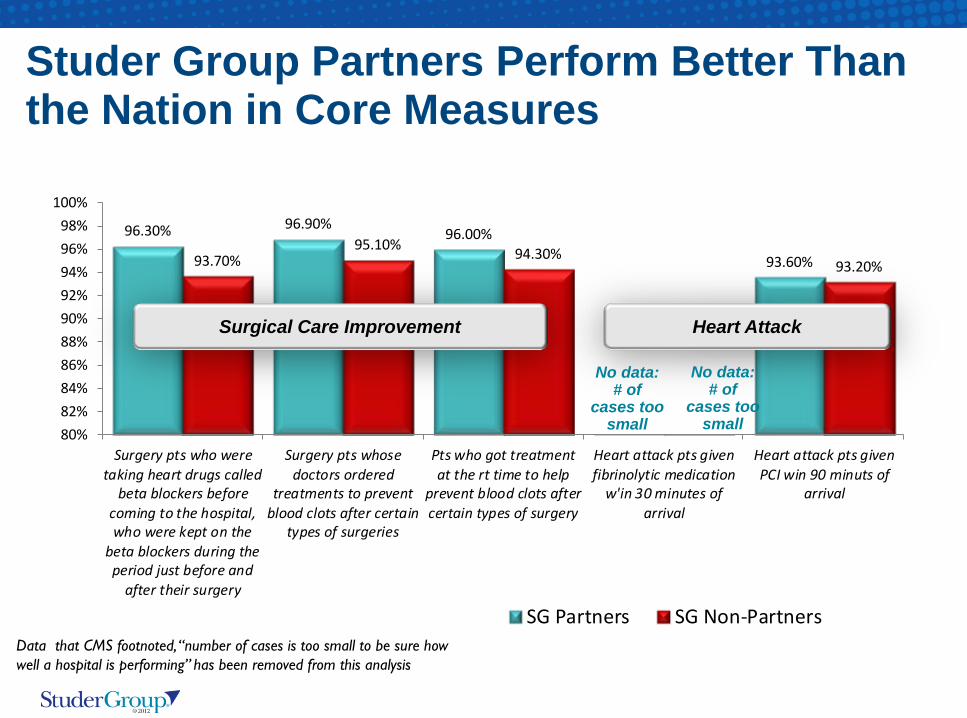
Studer Group Partners Perform Better Than the Nation in Core Measures
96.30% 96.90%96.00%
93.60%93.70%95.10% 94.30%
93.20%
80%82%84%86%88%90%92%94%96%98%
100%
Surgery pts who weretaking heart drugs called
beta blockers beforecoming to the hospital,who were kept on the
beta blockers during theperiod just before and
after their surgery
Surgery pts whosedoctors ordered
treatments to preventblood clots after certain
types of surgeries
Pts who got treatmentat the rt time to help
prevent blood clots aftercertain types of surgery
Heart attack pts givenfibrinolytic medication
w'in 30 minutes ofarrival
Heart attack pts givenPCI win 90 minuts of
arrival
SG Partners SG Non-Partners
Surgical Care Improvement Heart Attack
No data: # of
cases too small
Data that CMS footnoted, “number of cases is too small to be sure how well a hospital is performing” has been removed from this analysis
No data: # of
cases too small

Patients’ Perception of Care = Quality Vascular Catheter-Association Infection

Patients’ Perception of Care = Quality Manifestations of Poor Glycemic Control

Patients’ Perception of Care = Quality Pressure Ulcer Stages III and IV
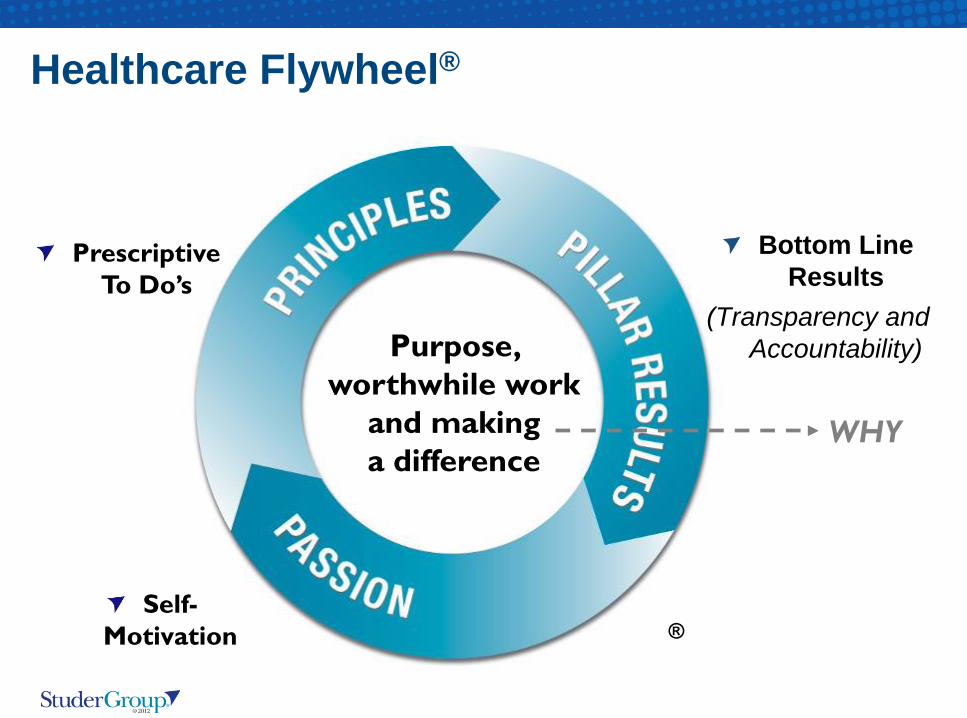
Purpose, worthwhile work
and making a difference
®
Healthcare Flywheel®
Bottom Line Results
(Transparency and Accountability)
Self-Motivation
Prescriptive To Do’s
WHY

Execution Framework Evidence-Based LeadershipSM
Standardization Accelerators Must Haves®
Performance Management
Objective Evaluation
System
Leader Development
Foundation
STUDER GROUP®:
Agreed upon tactics and behaviors to achieve goals Principle 3, 5, 6, & 9
Re-recruit high and middle/solid performers
Move low performers up or out Principle 4
Processes that are consistent and standardized Process Improvement
PDCA Lean Six Sigma Baldrige Framework Principle 1 & 2
Software
Aligned Goals Aligned Behavior Aligned Process Create process to assist leaders in developing skills and leadership competencies necessary to attain desired results Principle 4 & 8
Implement an organization-wide staff/leadership evaluation system to hardwire objective accountability Principle 1, 2, & 7
Rev 4.8.11

High Performing Organizations
What were the most influential factors in their success? Executive and Senior Leadership Commitment Leadership Evaluation / Accountability Leadership Development Communication / Employee Sessions Knowing this was the “Right” Thing To Do (Why)
High Performing Organization Study 2004 Measures

Only through standardized implementation of leadership best practices will healthcare systems maximize the human
potential within their organization and most
importantly achieve their desired mission.

Hardwiring Excellence
Hardwired Mission
Creates
Creates
Hardwired Positive Margins

Challenges
Quality Access Cost

Source: Pamela Villarreal, National Center for Policy Analysis, “Social Security and Medicare Projections: 2009,” October 11, 2009, No. 662, page 2.
U.S. Health Related Money Woes

Total expenditure on health, % of gross domestic
product
Total health expenditure per capita, US$ PPP
Gross domestic product (GDP), current PPPs,
billion US dollars
% Change, 2000-2008
CAGR, 2000-2008
Healthcare Costs 2000-
2008 % change
CAGR, 2000-2008
GDP 2000-2008 % change
CAGR, 2000-2008
CANADA 18.18% 2.11% 61.93% 6.21% 48.40% 5.06%
GERMANY 1.94% 0.24% 40.01% 4.30% 42.13% 4.49%
ISRAEL 4.00% 0.49% 22.96% 2.62% 57.03% 5.80%
MEXICO 67.72% 64.46% 6.42%
NETHERLANDS 23.75% 2.70% 73.63% 7.14% 51.16% 5.30%
SPAIN 25.00% 2.83% 88.69% 8.26% 75.03% 7.25%
SWEDEN 14.63% 1.72% 51.79% 5.36% 46.61% 4.90%
SWITZERLAND 4.90% 0.60% 43.65% 4.63% 52.28% 5.40%
UNITED KINGDOM 24.29% 2.75% 70.33% 6.88% 48.96% 5.11%
UNITED STATES 19.40% 2.24% 60.28% 6.07% 44.43% 4.70%
Source: OECD, Source OECD database, accessed November 12, 2010
Total expenditure on health, % of gross domestic product
Total health expenditure per capita, US$ PPP
Gross domestic product (GDP), current PPPs,
billion US dollars
% Change, 2000-2008
CAGR, 2000-2008
Healthcare Costs
2000-2008 % change
CAGR, 2000-2008
GDP 2000-2008 % change
CAGR, 2000-2008
UNITED STATES 19.40% 2.24% 60.28% 6.07% 44.43% 4.70%
United States Health Care Expense
The healthcare expense increase is taking up more of the growth domestic product

“People wish to be settled; but only as far as they are unsettled, is there any hope for them.”
Ralph Waldo Emerson

Phases of Competency and Change
Even with positive change, there is resistance . . .

2.2%
-16.8%
The average hospital has a 2.2% operating
margin.
Looking at reimbursement cuts,
2.2% will be a 16.8% deficit.
Operating Margin Outlook
2011
2021

The Normal Toolkit
Squeeze vendors Stop Travel Eliminate Overtime Slow Down Capital Expenditures Reduction in Force Not filling opened positions Supply Chain Management Revenue Cycle Managed Care Negotiations

An Additional Approach: Accomplish more with less pain
Capture Withheld Reimbursement
Increase Market Share
Become more efficient and
effective (work process improvement)
Eliminate Never Events
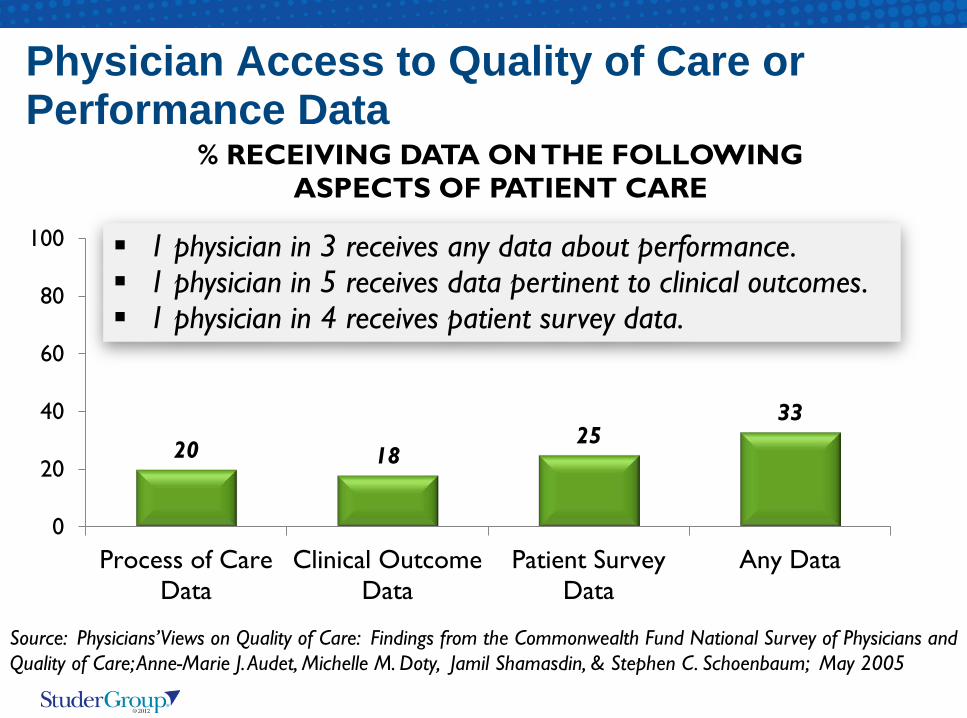
Physician Access to Quality of Care or Performance Data
20 18 25
33
0
20
40
60
80
100
Process of CareData
Clinical OutcomeData
Patient SurveyData
Any Data
% RECEIVING DATA ON THE FOLLOWING ASPECTS OF PATIENT CARE
Source: Physicians’ Views on Quality of Care: Findings from the Commonwealth Fund National Survey of Physicians and Quality of Care; Anne-Marie J. Audet, Michelle M. Doty, Jamil Shamasdin, & Stephen C. Schoenbaum; May 2005
1 physician in 3 receives any data about performance. 1 physician in 5 receives data pertinent to clinical outcomes. 1 physician in 4 receives patient survey data.

2010 2011 2012 2013 2014 2015 2016 2017 2018
REPORTING HOSPITAL QUALITY DATA FOR ANNUAL PAYMENT UPDATE
VALUE-BASED PURCHASING
READMISSIONS
2% of APU
2%
3%
CMS quality-based payment initiatives will put more than 11% of payment at risk
HOSPITAL-ACQUIRED CONDITIONS 1%
MEANINGFUL USE 5%
1% 1.25% 1.5% 1.75% 2%
1% 2% 3% 3% 3%
1% 2% 3% 4% 5%
Value-Based Purchasing Roadmap

VBP Dollars at Risk
Bed Size of
Examples Used
Avg. Total VBP dollars at risk
HCAHPS Patient
Experience (30%) at risk
Large Hospitals 622-683 $ 1,200,000 $360,000
Medium Hospitals 288-361 $748,000 $224,400
Small Hospitals 186-200 $312,000 $93,600

Never Events Financial Impact
Condition $ / Stay Stage III & IV Pressure Ulcers $43,180
Falls & Trauma $33,894
Deep Vein Thrombosis/Pulmonary Embolism $50,937
Vascular Catheter-Associated Infection $103,027
Certain Manifestations of Poor Control of Blood Sugar Levels Range: $35k-45,989
Catheter-Associated Urinary Tract Infections $44,043
Foreign Object Retained After Surgery $63,631
Surgical Site Infections Following Certain Elective Procedures Range: $63k-180,142
Infection after Coronary Artery Bypass Graft $299,237
Air Embolism $71,636
Blood Incompatibility $50,455
Source: CMS Fact Sheet, “CMS PROPOSES ADDITIONS TO LIST OF HOSPITAL-ACQUIRED CONDITIONS FOR FISCAL YEAR 2009”

Research Straight A Leadership Assessment
Survey data collected 2009-2012, Database of 17,104 leader
responses, >300 hospital systems, located in 44 different states,
ranging in bed size from 11 beds to 1,100 beds.

Executive Summary: Straight A Leadership
What organization does well: Leader perception of organizational strengths are not always supported by the data. Alignment: The more aligned the senior team is, the more positive HCAHPS and process of care outcomes. Objective Evaluation System: High ratings on leadership evaluation systems positively affect HCAHPS and process of care outcomes. Leadership Development: High ratings on leader training positively affect HCAHPS outcomes.
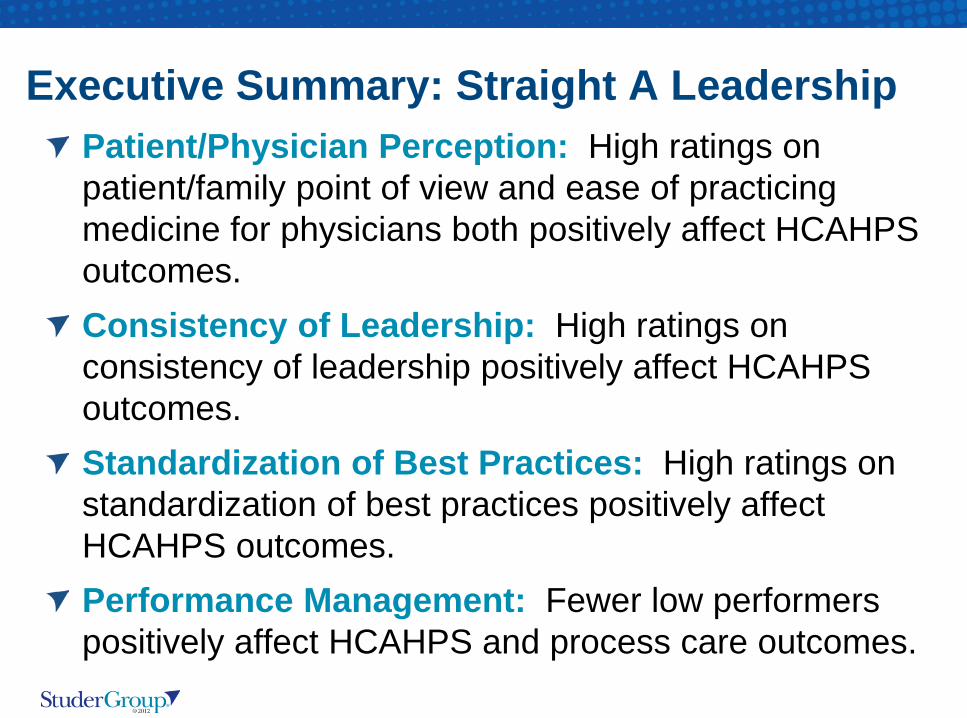
Executive Summary: Straight A Leadership Patient/Physician Perception: High ratings on patient/family point of view and ease of practicing medicine for physicians both positively affect HCAHPS outcomes. Consistency of Leadership: High ratings on consistency of leadership positively affect HCAHPS outcomes. Standardization of Best Practices: High ratings on standardization of best practices positively affect HCAHPS outcomes. Performance Management: Fewer low performers positively affect HCAHPS and process care outcomes.

3% 8%
9% 11% 11% 12%
13% 14%
16% 18% 18%
21% 23% 24% 25%
30% 44%
0% 10% 20% 30% 40% 50%
Dealing with Low PerformersPhysician Engagement and Satisfaction
AccountabilityEmployee Engagement and Satisfaction
MeasurementCommunication (transparent and open)
Employee Compensation and BenefitsEducation, Training, and Skill Development
TechnologyGoal Setting and Strategic Planning
Leadership (engagement, visibility, and support)Community Outreach
Patient Satisfaction/Perception of CareFinancial Performance/Fiscal Responsibility (net revenue, EBDITA, etc)
Focus on Mission/Vision/ValuesPatient Safety
Quality of Care
Percent
Please list the top three (3) things your organization does well and should continue to do?
What the Organization Does Well
Top 3 Things Does Well: Quality of Care Patient Safety Focus on Mission,
Vision and Values

4% 5% 5%
7% 8%
10% 10%
19% 19% 20% 21%
23% 25%
27% 28%
31% 36%
0% 10% 20% 30% 40%
Focus on Mission/Vision/ValuesPatient SafetyMeasurement
Quality of CareFinancial Performance/Fiscal Responsibility (net revenue,…
Goal Setting and Strategic PlanningCommunity Outreach
TechnologyLeadership (engagement, visibility, and support)
Education, Training, and Skill DevelopmentEmployee Compensation and Benefits
Physician Engagement and SatisfactionPatient Satisfaction/Perception of CareEmployee Engagement and Satisfaction
Communication (transparent & open)Accountability
Dealing with Low Performers
Percent
Please list the top three (3) opportunities for improvement at your organization
Opportunities for Improvement
Top 3 Opportunities: Dealing with Low
Performance Accountability Communication

0% 1%
5% 6%
9% 10%
11% 13% 14%
17% 18%
21% 24% 25%
30% 45%
48%
0% 10% 20% 30% 40% 50%
Patient SafetyQuality of Care
Patient Satisfaction/Perception of CareLeadership Development and Skill
Leadership (engagement, visibility, and support)Employee Turnover
Education, Training, and Skill Development GapsPhysician Engagement and Satisfaction
Time ManagementLow PerformersCommunication
System/Silo ThinkingEmployee engagement/buy-in
Inconsistency/Lack of Standardization and HardwiringFinancial Constraints and Industry Pressures
Resource Limitations (staffing,equipment,space, etc.)Too Many Priorities
Percent
Please list the top three (3) barriers/challenges you face that keep you from achieving your results in your area of
responsibility at your organization
Barriers and Challenges
Top 3 Barriers: Too Many Priorities Resource Limitations Financial Constraints
and Industry Pressures

External Environment
37% of the leaders who took the survey feel if the organization stays the same, the results will be the
same, better or much better.
If your organization continues to act/perform exactly as it does today (with the same processes, same cost structure, same efficiencies, same patient care volume, same productivity,
same techniques) your results over the next five years will be: (1=Much Worse, 2=Worse, 3=Same, 4=Better, 5=Much Better)

It is crucial for all healthcare organizations to correctly frame the
external environment and communicate it in a manner whereby stakeholders have the same sense of urgency and understand the needed actions to take for the organization
to achieve desired results.

52%
41% 39%
48% 45%
36%
45% 44% 45%
35%
64% 64% 62% 66%
63% 59% 59%
65%
55% 50%
30%35%40%45%50%55%60%65%70%
Quiet atNight
DoctorComm
NurseComm
PainMgmt
Responsive-ness
Rating of9 or 10
RoomCleanliness
ExplainedMeds
DischargeInfo
Recommend
Aver
age
Perc
entil
e Ra
nk
HCAHPS Average Percentile Rank by Response to Question. Lowest Quartile Responses vs. Highest Quartile Responses
Lowest Quartile Responses Highest Quartile Responses
Objective Evaluation: HCAHPS Lowest vs. Highest Responses
Organizations who gave high ratings on their leadership evaluation systems had better HCAHPS outcomes.
How well does your leadership evaluation system help build leadership accountability today?
(1=Very Poor, 2=Poor, 3=Fair, 4=Good, 5=Excellent)

Example Hospital
0%
10%
20%
30%
40%
50%
60%
70%
80%
90%
100%
Feb
Apr
Jun
Aug
Oct
Dec
Feb
Apr
Jun
Aug
Oct
Dec
Feb
Apr
Jun
Aug
Oct
Dec
Feb
Apr
Jun
Aug
Oct
Dec
Feb
Apr
Jun
Aug
Inpatient Monthly Percentile Score Year 1 – Year 5
Goal = 90%
Year 1 Year 2 Year 3 Year 4 Year 5
95%
Leader Evaluation Tool Implemented

Example Hospital
0%
10%
20%
30%
40%
50%
60%
70%
80%
90%
100%
Jan
Mar
May Ju
l
Sep
Nov Ja
n
Mar
May Ju
l
Sep
Nov Ja
n
Mar
May
Inpatient Monthly Percentile Score Year 5 – Year 7
Year 5 Year 6 Year 7
99%
Goal = 90%
Leader Evaluation Tool Implemented

48% 42%
37% 43% 46%
32%
46% 45% 46%
28%
68% 66% 70% 71%
67% 64% 61% 68%
56% 52%
20%
30%
40%
50%
60%
70%
80%
Quiet atNight
DoctorComm
Nurse Comm
PainMgmt
Responsive-ness
Rating of9 or 10
RoomCleanliness
Explained Meds
DischargeInfo
Recommend
Aver
age
Per
cent
ile R
ank
HCAHPS Average Percentile Rank by Response to Question. Lowest Quartile Responses vs. Highest Quartile Responses
Lowest Quartile Responses Highest Quartile Responses
Leader Development: HCAHPS Lowest vs. Highest Responses
Organizations where leaders felt their leader training well prepared them for success had higher average HCAHPS outcomes.
How well does your current leader training prepare you to lead for success in the organization today?
(1=Very Poor, 2=Poor, 3=Fair, 4=Good, 5=Excellent)

SKILL SET DESCRIPTION Senior Mgmt
Dept Director
Manager / Supervisor
Running effective meetings 75 73 65 Managing financial resources 79.55 76.92 65 Answering tough questions so as to not create a “we/they” culture (compensation w’ salaries)
84.5 76.28 65
Selection of talent 81.82 77.56 60 Development of talent 93.18 82.05 75 Critical thinking 59.5 59.62 55 De-selection 82.27 75.23 70 Understanding the external environment 72.73 76.28 65
Manage up the positive, the solution and the decision 77.27 75.28 68
Improving processes 72.73 78.21 64 Communication 75 73 65
Total 85.58 82.22 70.70
Leadership Foundational Skills - Mentoring

56%
43% 36%
42% 42% 32%
40% 43% 39%
27%
66% 64% 62% 63% 63% 61% 60% 65%
54% 53%
0%
10%
20%
30%
40%
50%
60%
70%
Quiet atNight
DoctorComm
NurseComm
PainMgmt
Responsive-ness
Rating of9 or 10
RoomCleanliness
Explained Meds
DischargeInfo
Recommend
Aver
age
Perc
entil
e Ra
nk
HCAHPS Average Percentile Rank by Response to Question. Lowest Quartile Responses vs. Highest Quartile Responses
Lowest Quartile Responses Highest Quartile Responses
Organizations whose leaders gave high ratings to the ability to implement and standardize best practices had higher average HCAHPS outcomes.
Standardization of Best Practices: HCAHPS Lowest vs. Highest Response
Rate the skill set at your organization in implementing and standardizing best practices throughout the organization today.
(1=Worst to 10=Best in Class)

51%
40% 33%
44% 40%
27%
38% 42% 38%
25%
57% 55% 63% 60% 57%
61% 58% 62% 60%
55%
0%
10%
20%
30%
40%
50%
60%
70%
Quiet at Night
DoctorComm
NurseComm
PainMgmt
Responsive-ness
Rating of9 or 10
RoomCleanliness
ExplainedMeds
DischargeInfo
Recommend
Aver
age
Perc
entil
e Ra
nk
HCAHPS Average Percentile Rank by Response to Question. Lowest Quartile Responses vs. Highest Quartile Responses
Lowest Quartile Responses Highest Quartile Responses
Leadership Consistency: HCAHPS Lowest vs. Highest Response
Organizations whose leaders rated consistency of leadership highly had higher average HCAHPS outcomes.
Rate your perception of the consistency in the leadership throughout the organization today.
(1=Worst to 10=Best in Class)

Nurse Manager Patient Rounding Impact Patients who ‘strongly agree’ that a nurse manager visited them daily have higher Rate Hospital and Nurse Communication scores.
Survey Question: “A nurse manager or leader visited me about my care daily.” Data Source: Kaiser Permanente Program wide All IP combined average results (Jan 2010 – Aug 2011) National 75th percentile for Rate Hospital is 73% and for Nurse Communication is 80% (CMS 2010Q1-Q4)
HC
AHPS
Res
ults
80 73

Nurse Knowledge Exchange (NKE) Full Bundle Impact The Full Bundle of NKE Behaviors has the greatest impact.
Data Source: Kaiser Permanente Program wide All IP combined average results (Jan 2010 – Aug 2011) National 75th percentile for Rate Hospital is 73% and for Nurse Communication is 80% (CMS 2010Q1-Q4) Survey Questions:
HC
AH
PS R
esul
ts
73 80
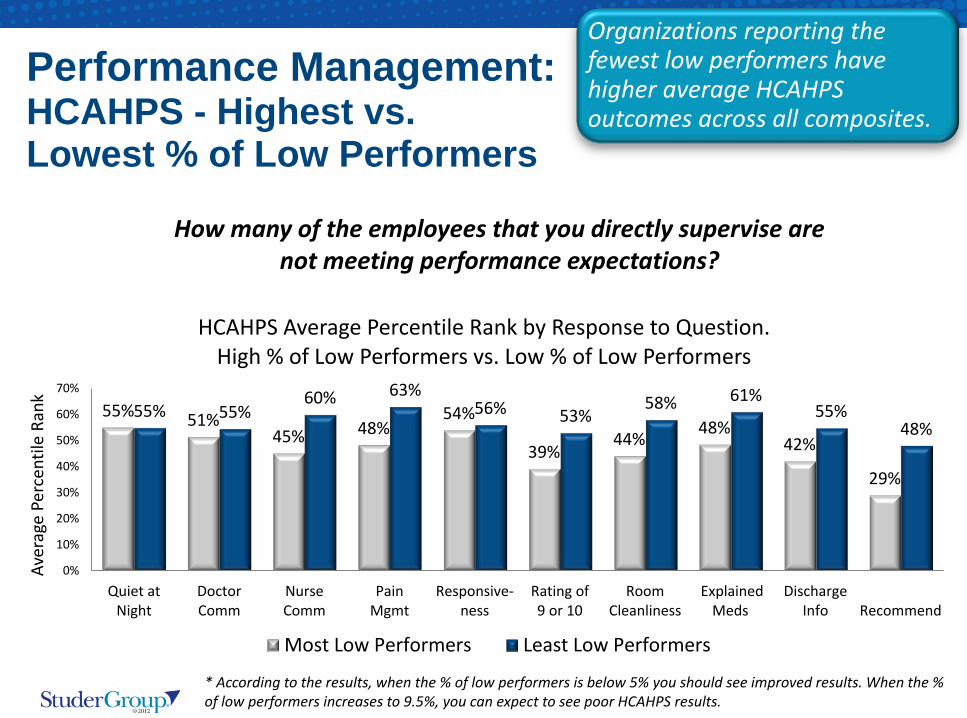
55% 51% 45% 48%
54%
39% 44% 48%
42%
29%
55% 55% 60% 63%
56% 53% 58% 61%
55% 48%
0%
10%
20%
30%
40%
50%
60%
70%
Quiet atNight
DoctorComm
NurseComm
PainMgmt
Responsive-ness
Rating of9 or 10
RoomCleanliness
ExplainedMeds
DischargeInfo Recommend
Aver
age
Perc
entil
e Ra
nk
HCAHPS Average Percentile Rank by Response to Question. High % of Low Performers vs. Low % of Low Performers
Most Low Performers Least Low Performers
Performance Management: HCAHPS - Highest vs. Lowest % of Low Performers
Organizations reporting the fewest low performers have higher average HCAHPS outcomes across all composites.
* According to the results, when the % of low performers is below 5% you should see improved results. When the % of low performers increases to 9.5%, you can expect to see poor HCAHPS results.
How many of the employees that you directly supervise are not meeting performance expectations?
On a scale of 1-10 …
• Where would you rank in how value driven you are as an organization?
Values

On a scale of 1-10 …
• Where would you rank in dealing with performance issues?
Performance

Good performers deserve a great place to
work

Beth Keane

A Calling

Thank You for Answering