gate-to-gate ghg emissions for carbon activation of … ppt gate to... · gate-to-gate ghg...
TRANSCRIPT
Gate-to-gate GHG emissions for carbon
activation of biochar
Hongmei Gu and Rick BergmanUS Forest Products Laboratory
Madison, WI, USA
2016 Society of Wood Science and Technology, March 6-11, 2016 Curitiba, Brasil
Presentation overview
A. Overall project – Process chain for woody
biomass to bioenergy/bio-product conversion
B. LCA on carbon activation from biochar and coal
1. Goal and scope of LCA
2. Process flows
3. Results and comparison
4. Conclusions
2Gate-to-gate GHG emissions for carbon activation of biochar

-- Integration of Biofuels and Bioproducts Production into Forest
Products supply Chains using Modular Biomass Gasification and
Carbon Activation
Technical Area 3: Biofuels development analysis
1. Find GHG emissions and mass and energy balances for the
Tucker renewable natural gas (RNG) unit
2. Evaluate the impacts for forest biomass utilization
3. Develop financial models for biomass on economic conditions in
the US West
4. Develop an economic synthesis of modular gasification at forest
industry facilities
3
Overall project: Biomass Research
Development Initiatives (BRDI)
Gate-to-gate GHG emissions for carbon activation of biochar
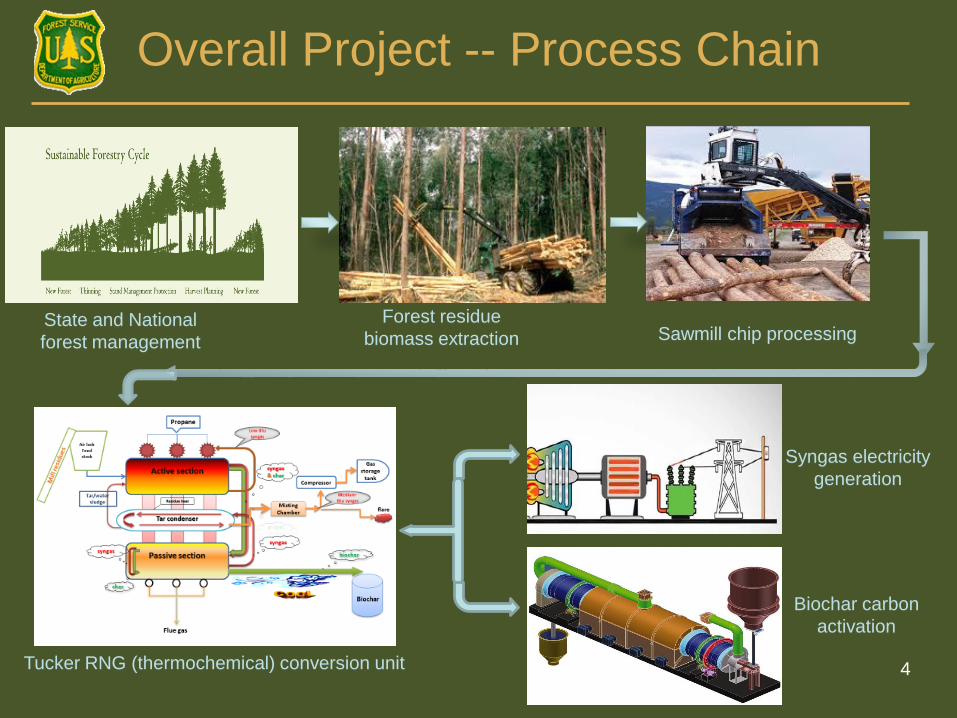
Overall Project -- Process Chain
4
State and National
forest management
Forest residue
biomass extraction Sawmill chip processing
Tucker RNG (thermochemical) conversion unit
Syngas electricity
generation
Biochar carbon
activation

Upstream: forest
management, log
extraction, chip
production
Midstream: advanced
pyrolysis
Downstream: syngas
to electricity, biochar
to activated carbon
Biomass
System Chain
5Gate-to-gate GHG emissions for
carbon activation of biochar

Physical activation with heat and steam (our process)
Chemical activation with impregnation of agents
Carbon activation system
6Gate-to-gate GHG emissions for carbon activation of biochar
Source: Rodriguez-Reinoso F (2002) Production and applications of activated carbons. Figure 9.1: General
flow for the manufacture of activated carbon. In: Handbook of Porous Solids. Eds. Schuth F, Sing KSW,
Weitkamp J. Wiley-VCH Verlag GmmH, Weinheim, Germany, pp. 1766-1827.

Life cycle analysis
LCA calculates all kinds
of environmental
impacts (carbon
footprint, energy, water,
acidity, toxicity, etc.) for
a product or service
across the entire life
cycle – from raw
material extraction, to
product making, to
distribution, use, and
end of life.
7Gate-to-gate GHG emissions for carbon activation of biochar
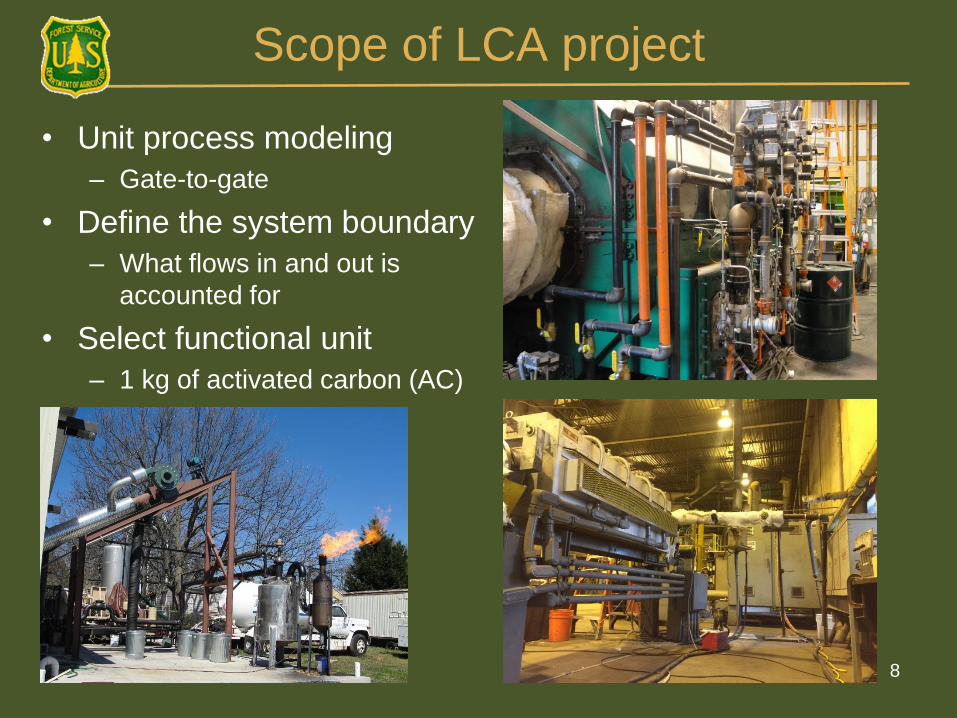
Scope of LCA project
• Unit process modeling
– Gate-to-gate
• Define the system boundary
– What flows in and out is
accounted for
• Select functional unit
– 1 kg of activated carbon (AC)
8

System boundary
9Gate-to-gate GHG emissions for carbon activation of biochar
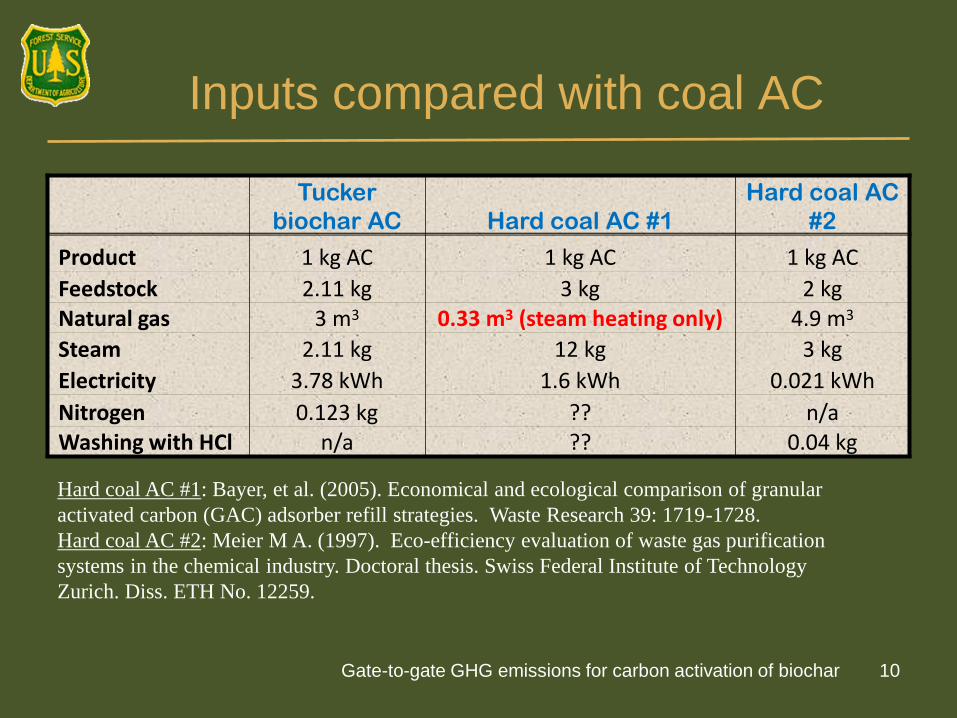
Inputs compared with coal AC
10
Tucker
biochar AC Hard coal AC #1
Hard coal AC
#2
Product 1 kg AC 1 kg AC 1 kg AC
Feedstock 2.11 kg 3 kg 2 kgNatural gas 3 m3 0.33 m3 (steam heating only) 4.9 m3
Steam 2.11 kg 12 kg 3 kg
Electricity 3.78 kWh 1.6 kWh 0.021 kWh
Nitrogen 0.123 kg ?? n/aWashing with HCl n/a ?? 0.04 kg
Hard coal AC #1: Bayer, et al. (2005). Economical and ecological comparison of granular
activated carbon (GAC) adsorber refill strategies. Waste Research 39: 1719-1728.
Hard coal AC #2: Meier M A. (1997). Eco-efficiency evaluation of waste gas purification
systems in the chemical industry. Doctoral thesis. Swiss Federal Institute of Technology
Zurich. Diss. ETH No. 12259.
Gate-to-gate GHG emissions for carbon activation of biochar
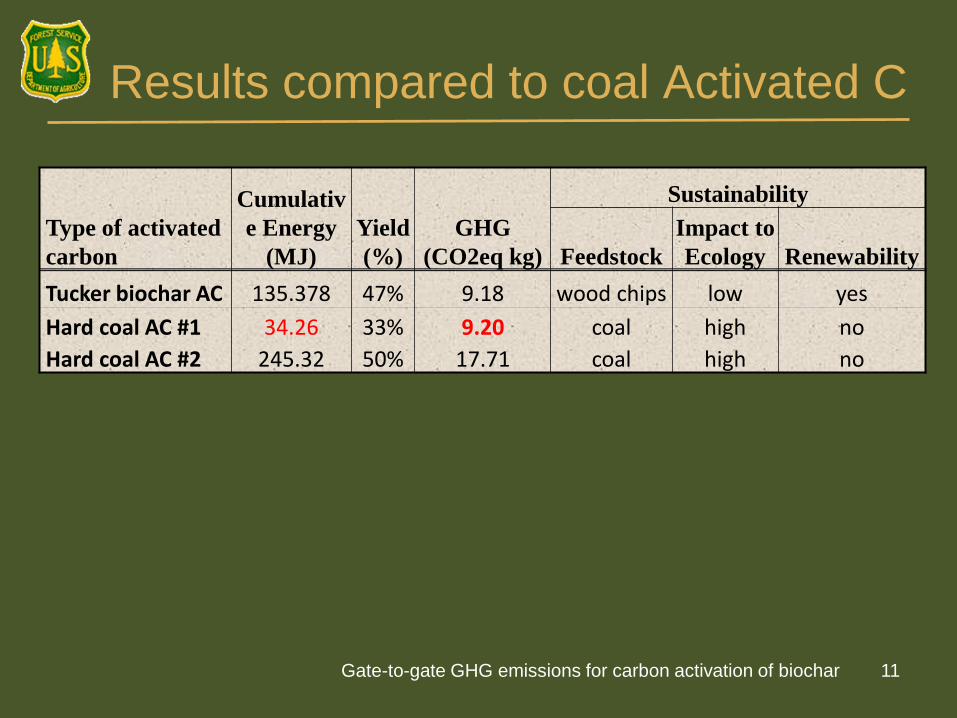
Results compared to coal Activated C
11
Type of activated
carbon
Cumulativ
e Energy
(MJ)
Yield
(%)
GHG
(CO2eq kg)
Sustainability
Feedstock
Impact to
Ecology Renewability
Tucker biochar AC 135.378 47% 9.18 wood chips low yes
Hard coal AC #1 34.26 33% 9.20 coal high no
Hard coal AC #2 245.32 50% 17.71 coal high no
Gate-to-gate GHG emissions for carbon activation of biochar
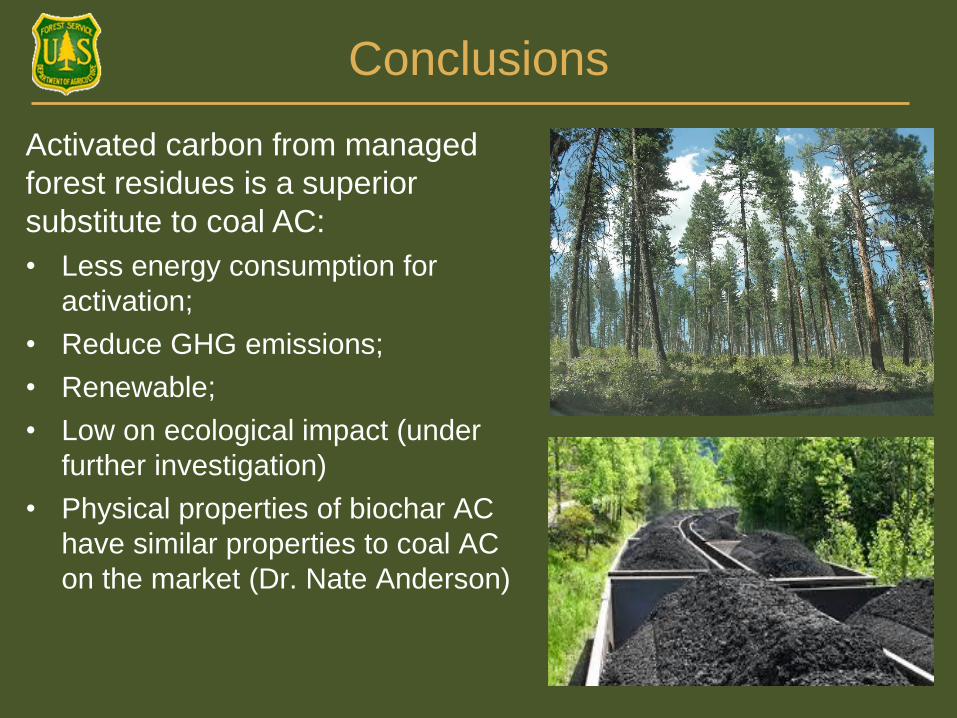
Conclusions
Activated carbon from managed
forest residues is a superior
substitute to coal AC:
• Less energy consumption for
activation;
• Reduce GHG emissions;
• Renewable;
• Low on ecological impact (under
further investigation)
• Physical properties of biochar AC
have similar properties to coal AC
on the market (Dr. Nate Anderson)
12
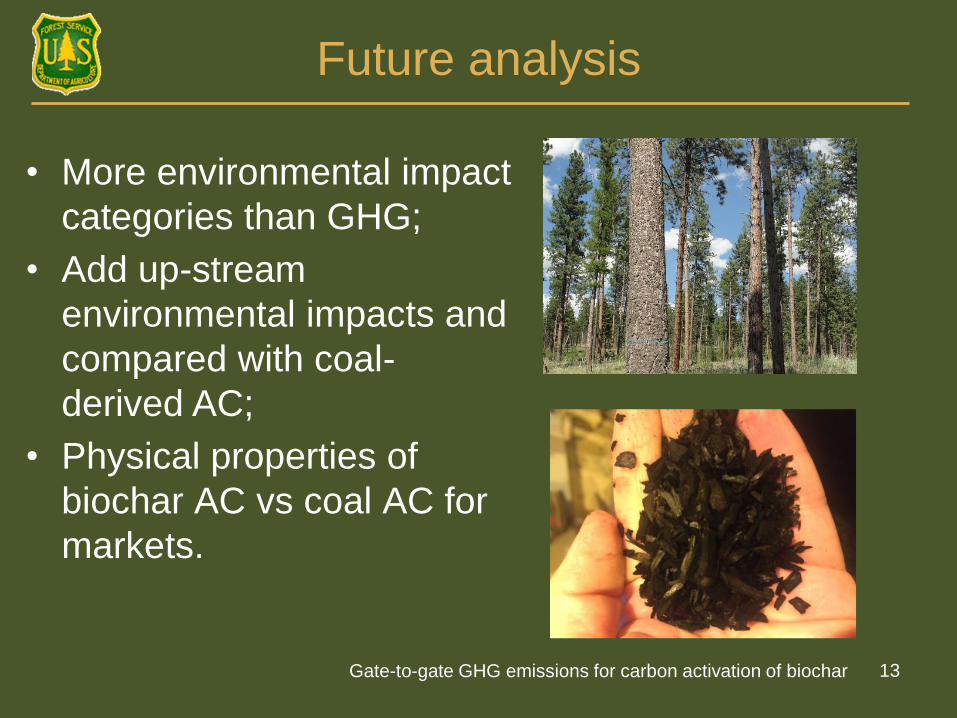
Future analysis
• More environmental impact
categories than GHG;
• Add up-stream
environmental impacts and
compared with coal-
derived AC;
• Physical properties of
biochar AC vs coal AC for
markets.
13Gate-to-gate GHG emissions for carbon activation of biochar

Acknowledgement
“This project was supported by the Agriculture
and Food Research Initiative, Biomass Research
and Development Initiative, Competitive Grant
no. 2010-05325 from the USDA National Institute
of Food and Agriculture”.
14Gate-to-gate GHG emissions for carbon activation of biochar
Questions?
Hongmei Gu
(608) 231-9589
Rick Bergman
(608) 231-9477
15Gate-to-gate GHG emissions for carbon activation of biochar