gate: graphic approach to epidemiology 1 picture, 2 formulas & 3 acronyms 1 rod jackson 2013
TRANSCRIPT

GATE: Graphic Approach To Epidemiology
1 picture, 2 formulas & 3 acronyms 1
Rod Jackson 2013

The GATE frame:• Graphic Appraisal Tool for Epidemiological
studies – a framework for appraising studies
• Graphic Architectural Tool for Epidemiological studies – a framework for designing studies
Presentation outline
1. a framework for study design2. a framework for study analysis3. a framework for study error4. a framework for practicing EBP
1 picture, 2 formulas & 3 acronyms

1. GATE: design of epidemiological studies: the picture & 1st acronym: PECOT
4every epidemiological study can be hung on the GATE frame

a cohort of British doctors
non-smokerssmokers
lung cancer events counted
yes
no
follow for 10 years
smoking status measured (observed)
longitudinal (cohort or follow-up ) study5
GATE Frame picture
observational studies: allocated to groups by measurement

British doctors
non-smokerssmokers
Lung canceryes
no 10 years
smoking status measured
6
1st acronym: PECOT
Population/Participants
ComparisonExposure
OutcomesTime
P
E C
OT

cohort of British doctors
heart attacks counted
yes
nofollow for 5
years
randomised controlled trial7
GATE Frame picture & 1st acronym
randomly allocated to aspirin or placebo
placeboaspirin
P
E C
OT
RCT: allocated to E & C by randomisation process
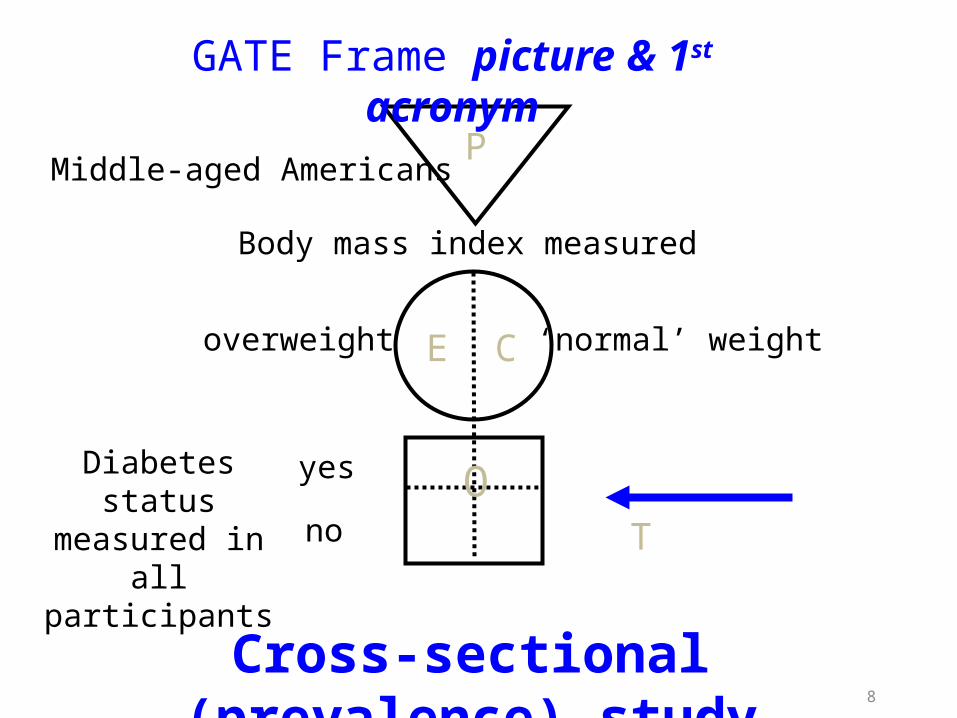
Middle-aged Americans
‘normal’ weightoverweight
Diabetes status measured in all
participants
yes
no
Body mass index measured
Cross-sectional (prevalence) study8
P
E C
OT
GATE Frame picture & 1st acronym
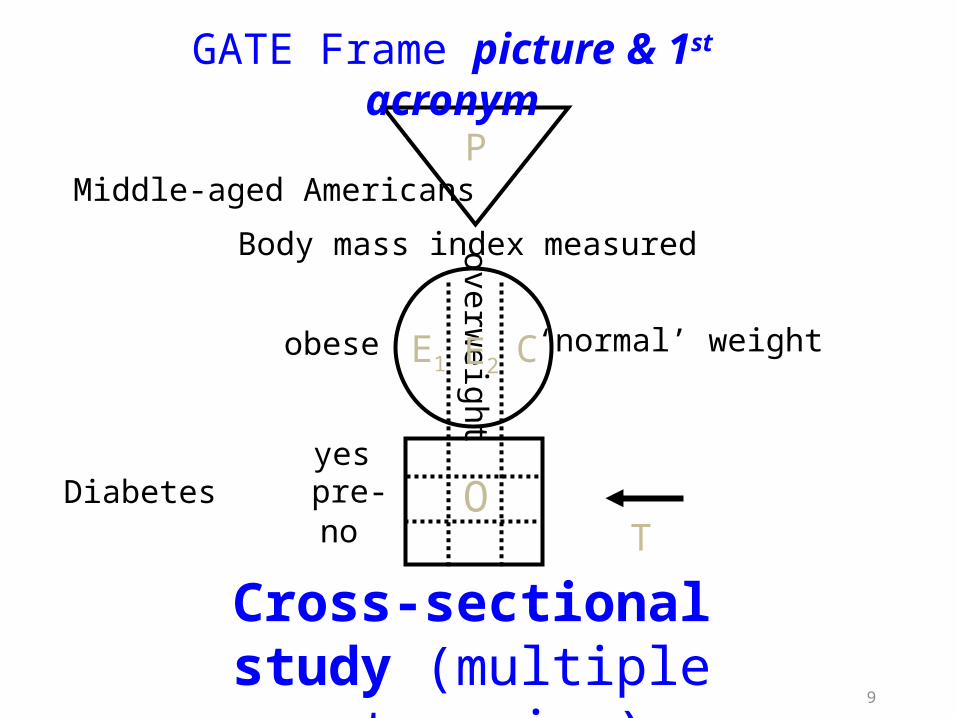
Middle-aged Americans
‘normal’ weightobese
Diabetesyes
no
Body mass index measured
Cross-sectional study (multiple categories)
9
overweight
pre-
P
E1 C
OT
E2
GATE Frame picture & 1st acronym

Middle-aged Americans
Low BMI High BMI
mean (average) Blood glucose
high
low
Body Mass Index (BMI) measured
Cross-sectional study (with numerical outcome) 10
P
E C
OT
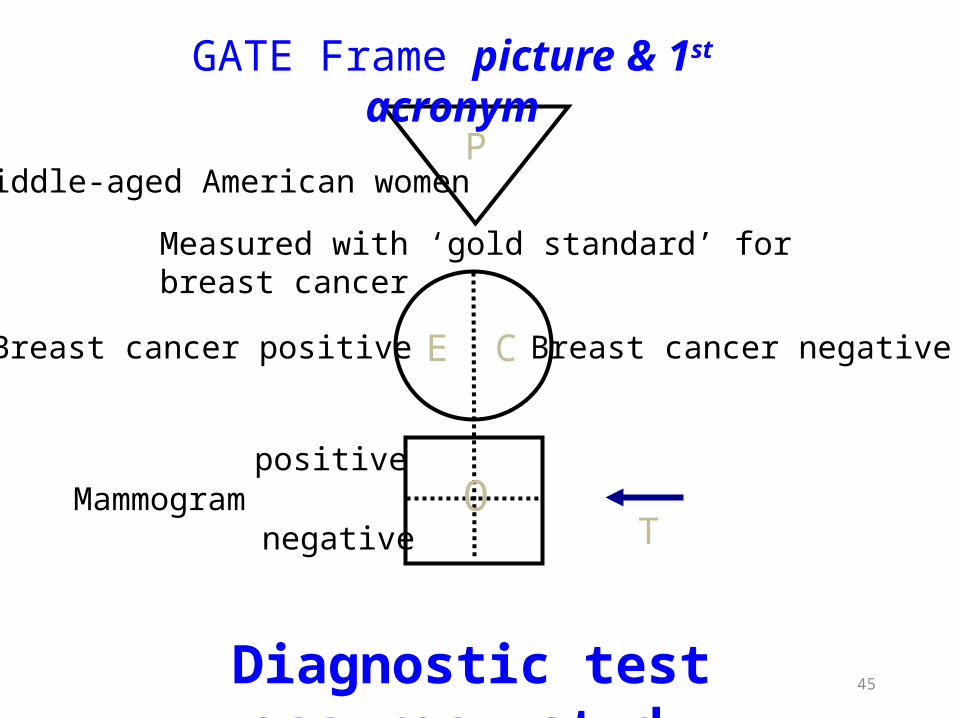
GATE Frame picture & 1st acronym

Middle-aged American women
Breast cancer
Mammogram negative
yes
no
Receive Mammogram screening Test
Diagnostic (prediction) study
Mammogram positive
11
P
E C
OT
GATE Frame picture & 1st acronym

2. GATE: analysis of epidemiological studies: the 1st formula: outcomes ÷population
12the numbers in every epidemiological study can be hung on
the GATE frame
British doctors
non-smokerssmokers
Lung cancer
yes
no 10 years
smoking status measured
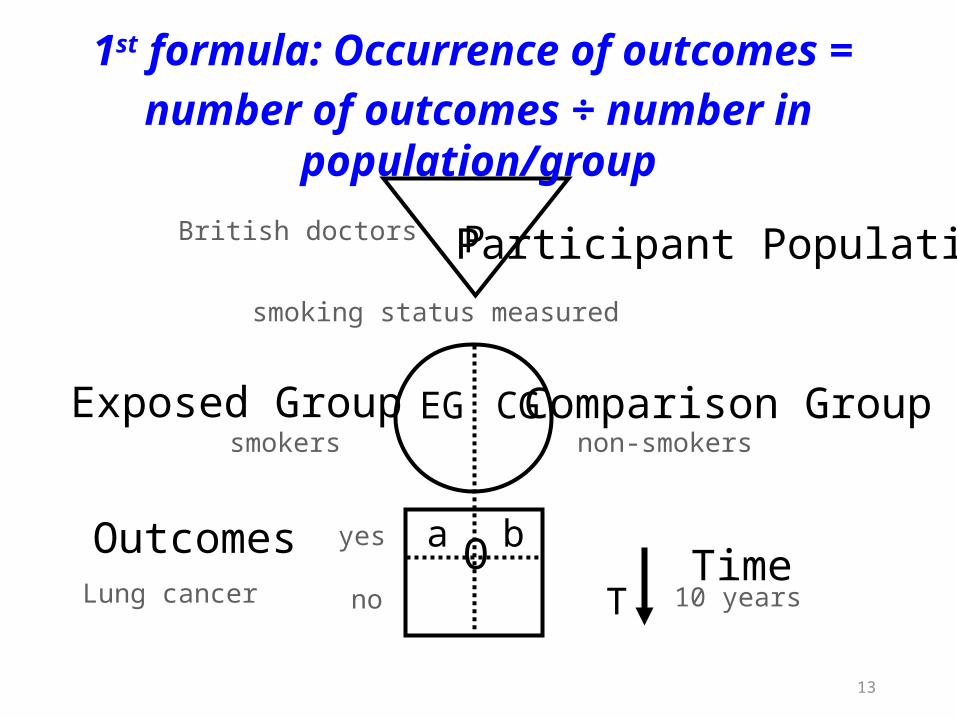
13
1st formula: Occurrence of outcomes = number of outcomes ÷ number in population/group
Participant Population
Comparison GroupExposed Group
OutcomesTime
P
EG CG
OT
a b

British doctors
non-smokerssmokers
Lung cancer
yes
no 10 years
smoking status measured
14
1st formula: occurrence = outcomes ÷ population
Population
Comparison GroupExposed Group
OutcomesTime
P
EG CG
OT
Exposed Group Occurrence (EGO) = a÷EG= number of outcomes (a) ÷ number in exposed population (EG)
a b

British doctors
non-smokerssmokers
Lung cancer
yes
no10 years
smoking status measured
15
1st formula: occurrence = outcomes ÷ population
Population
Comparison GroupExposed Group
OutcomesTime
P
EG CG
OT
a b
Comparison Group Occurrence (CGO) = b÷CG= number of outcomes (b) ÷ number in comparison population (CG)

British doctors
non-smokerssmokers
Lung cancer
yes
no
10 years
smoking status measured
16
goal of all epidemiological studies is to measure (& compare) the occurrence of outcomes in (different)
populations (EGO compared with CGO)
P
EG CG
OT
a bEGO:
Occurrence (risk) of cancer in smokers
CGO:Occurrence of cancer
in non-smokers
British doctors
yes
no
17
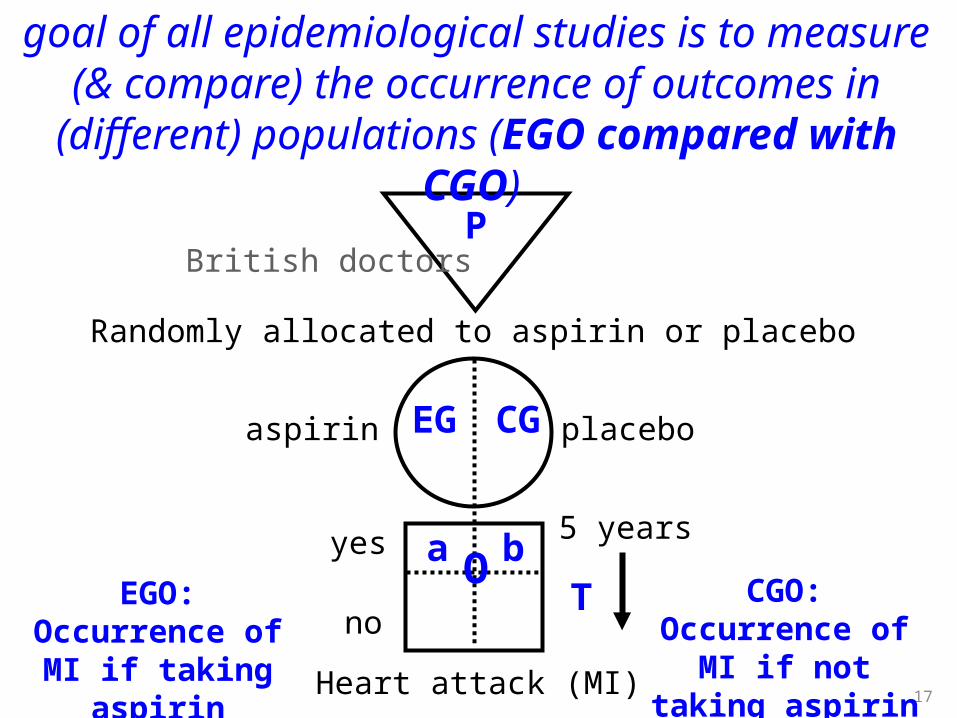
goal of all epidemiological studies is to measure (& compare) the occurrence of outcomes in (different)
populations (EGO compared with CGO)
P
EG CG
OT
a bEGO:
Occurrence of MI if taking aspirin
CGO:Occurrence of MI if not taking aspirinHeart attack (MI)
5 years
Randomly allocated to aspirin or placebo
placeboaspirin

Middle-aged Americans
Low BMI High BMI
EGO:Average blood glucose
in EG
high
low
Body Mass Index (BMI) measured
18
P
EG CG
O
goal of all epidemiological studies is to measure (& compare) the occurrence of outcomes in (different)
populations (EGO compared with CGO)
CGO:Average blood glucose
in CG
EGO = sum of all glucose levels in EG ÷ number in EG
yes
no
19
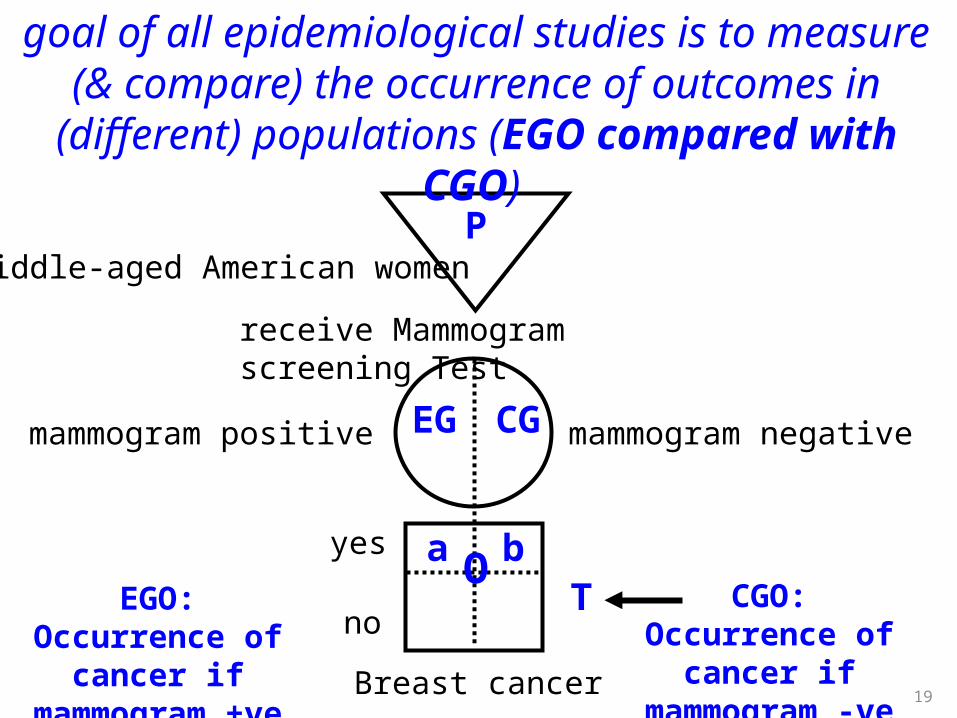
goal of all epidemiological studies is to measure (& compare) the occurrence of outcomes in (different)
populations (EGO compared with CGO)
P
EG CG
OT
a bEGO:
Occurrence of cancer if mammogram +ve
CGO:Occurrence of cancer if mammogram -ve
Middle-aged American women
Breast cancer
mammogram negative
receive Mammogram screening Test
mammogram positive

comparing EGO & CGO
• Risk Ratio or Relative Risk (RR) = EGO ÷ CGO• Risk Difference (RD) = EGO – CGO• Number Needed to Treat/’expose’ (NNT) =
1 ÷ RD
its all about EGO and CGOMeasures of occurrence include: risk; rate; likelihood;
probability; average; incidence; prevalence
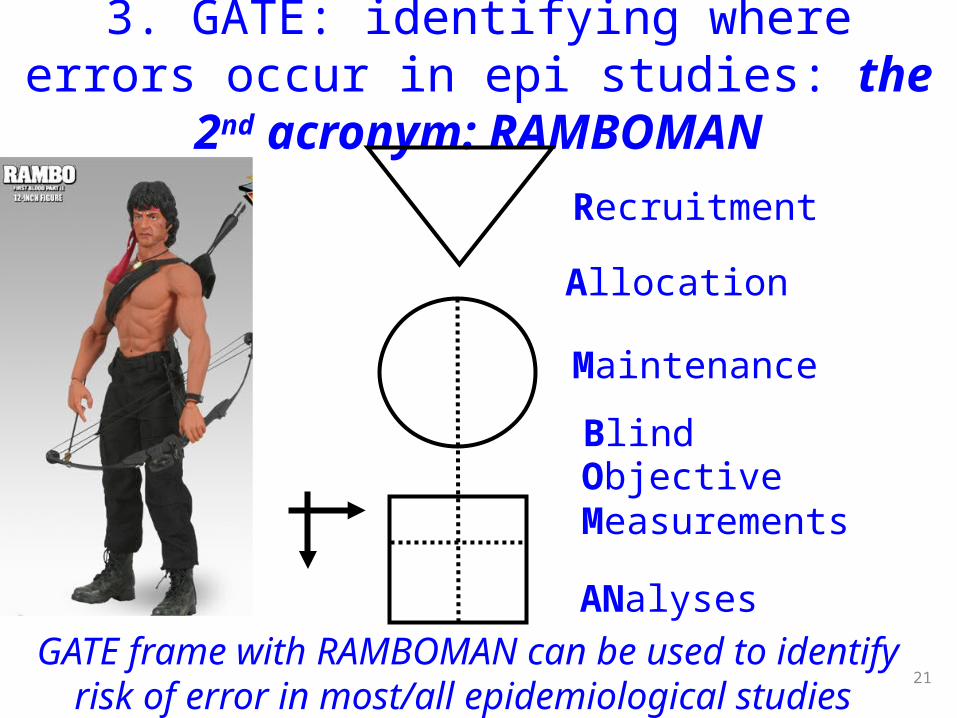
3. GATE: identifying where errors occur in epi studies: the 2nd acronym: RAMBOMAN
21GATE frame with RAMBOMAN can be used to identify risk
of error in most/all epidemiological studies
Recruitment
Allocation
Maintenance
BlindObjectiveMeasurements
ANalyses
RAMBOMAN
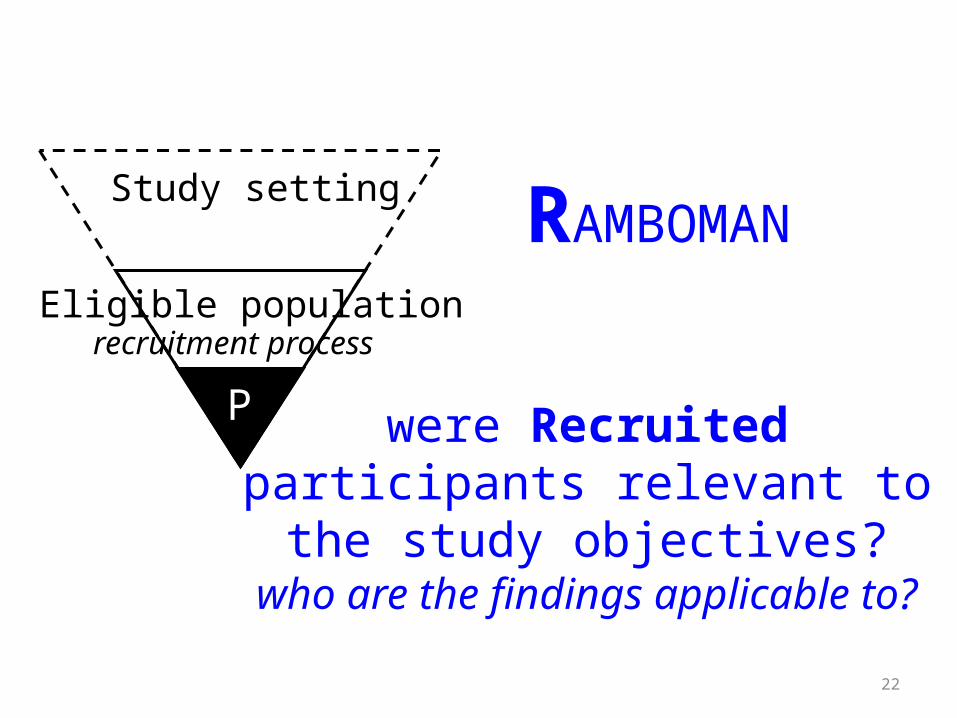
were Recruited participants relevant to the study objectives?who are the findings applicable to?
PP
Study setting
Eligible population
22
recruitment process

EG CG
OT
RCT: Allocated by randomisation (e.g to drugs)
EG CG
OT
Cohort: Allocated by measurement (e.g. smoking)
RAMBOMAN: how well were participants Allocated to exposure & comparison groups?
EG & CG similar?
was Allocation to EG & CG successful?
23
E & C measures accurate?

RAMBOMAN
EG CG
OT
how well were Participants Maintained in the groups they were
allocated to (i.e. to EG & CG) throughout the study?
P
completeness of follow-upcompliancecontaminationco-interventions
24
RAMBOMAN
EG CG
OT
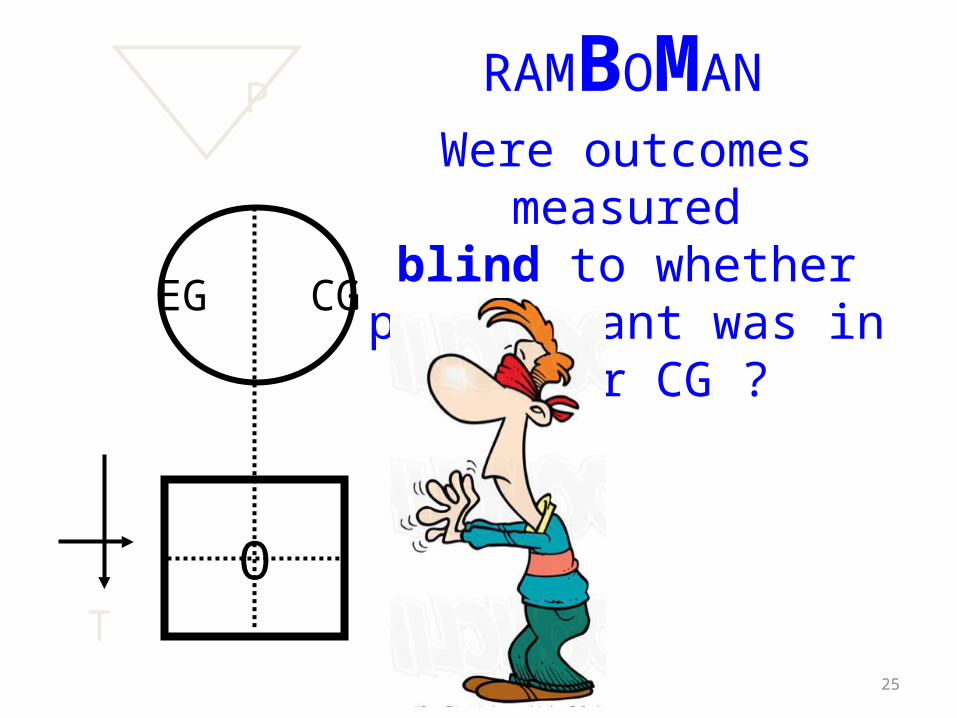
Were outcomes measuredblind to whether participant
was in EG or CG ?
P
25

RAMBOMAN
EG CG
OT
Were outcomes measuredObjectively?
P
26
RAMBOMAN
EG CG
OT
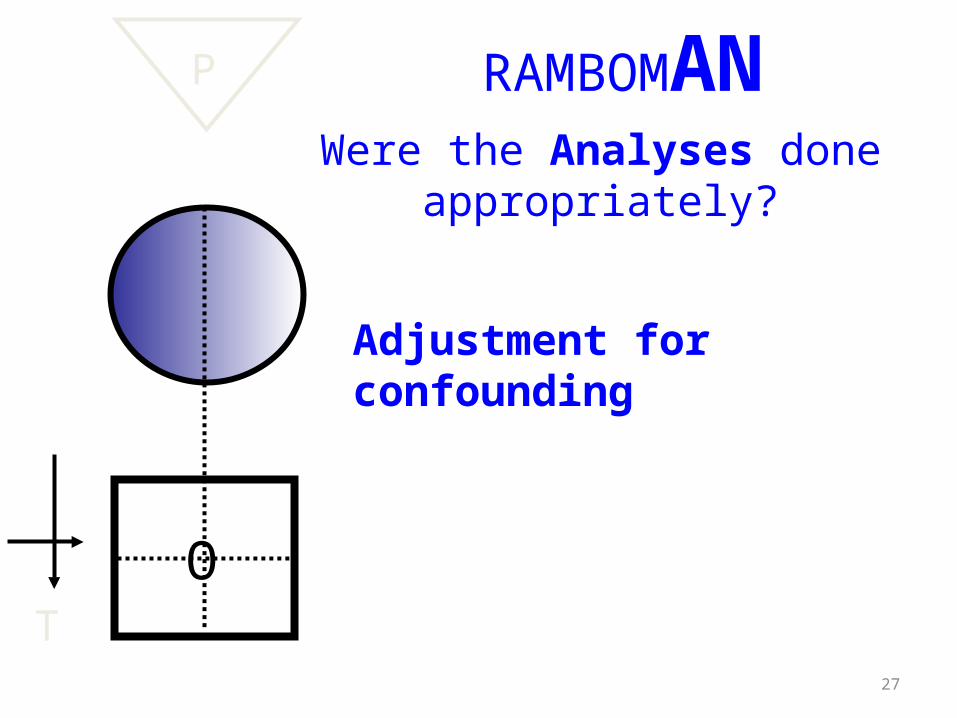
Were the Analyses done appropriately?
P
Adjustment for confounding
27

RAMBOMAN
EGC CGC
OT
Were the Analyses done appropriately?
Intention to treat?
P
28
EGA CGA
a b

the 2nd formula: random error = 95% confidence interval
29
There is about a 95% chance that the true value of EGO & CGO (in the underlying population) lies somewhere in the 95% CI (assuming no
non-random error)
EGO ± 95% CI CGO ± 95% CI

the 3rd acronym: FAITHCritically appraising a systematic review
• Find – were all potentially relevant studies found?• Appraise – were studies appraised for validity?• Include – were only appropriate studies included
in the final analyses?• Total-up – were studies pooled appropriately?• Heterogeneity – were studies too heterogeneous
(i.e. too different) to pool?

4. GATE : a framework for the 4 steps of EBP
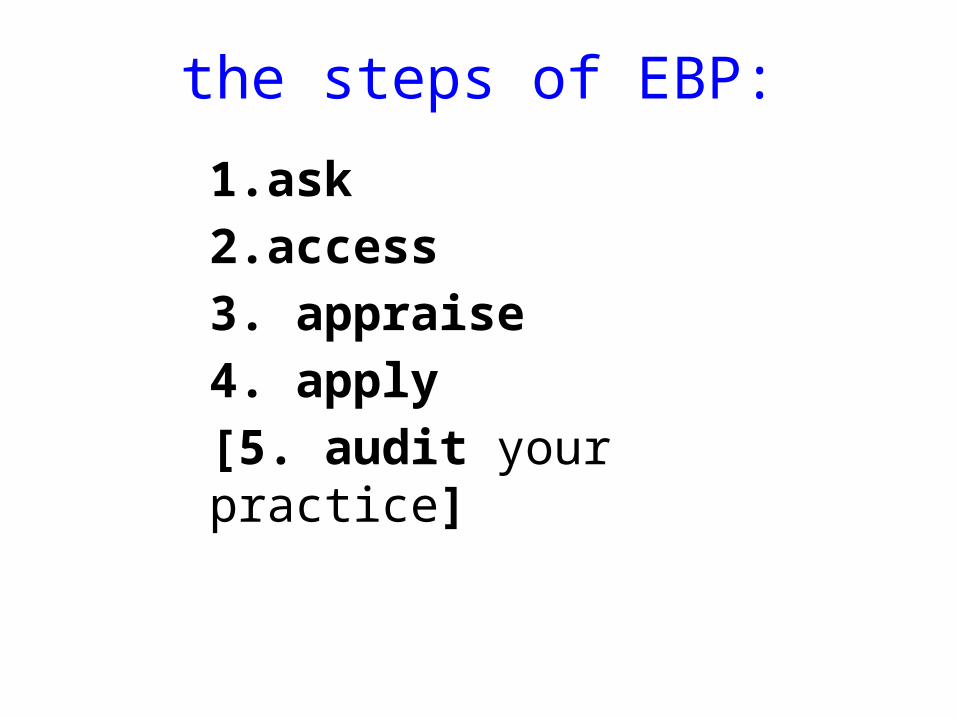
the steps of EBP:
1. ask2. access3. appraise4. apply[5. audit your practice]

yes
no
33
1. Participants
3. Comparison2. Exposure
4. Outcomes5. Time
P
E C
OT
EBP Step 1: ASK - turn your question into a focused 5-part PECOT question

EBP Step 2: ACCESS the evidence – use PECOT to help choose search terms
1. Participants2. Exposure3. Comparison4. Outcome5. Time frame
34
P
E C
O
T
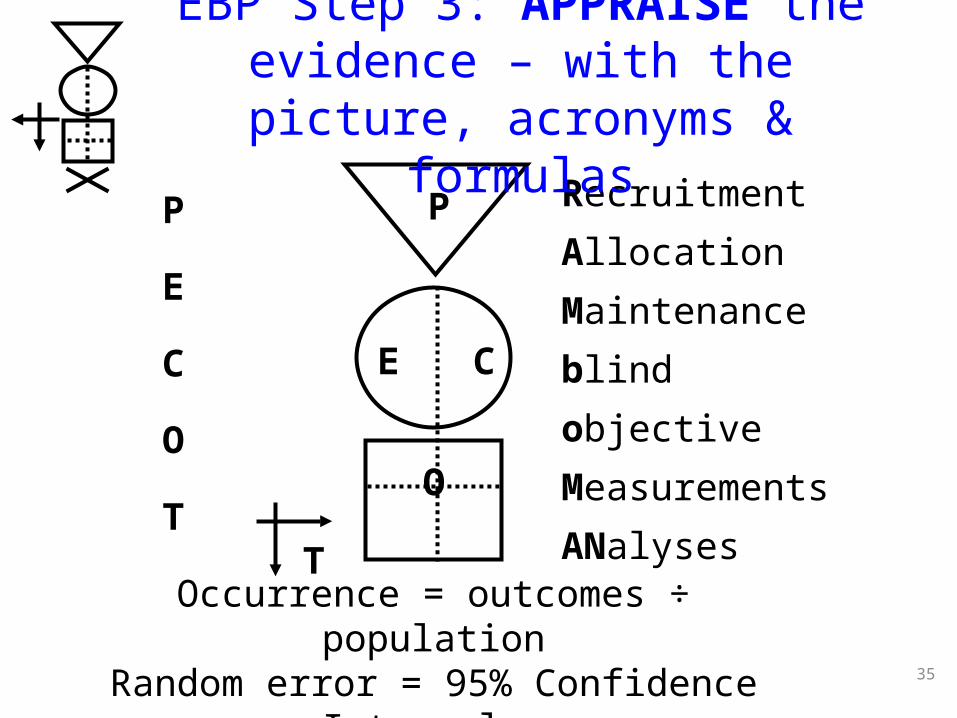
P
E
C
O
T
Recruitment
Allocation
Maintenance
blind
objective
Measurements
ANalyses
35
EBP Step 3: APPRAISE the evidence – with the picture, acronyms & formulas
Occurrence = outcomes ÷ populationRandom error = 95% Confidence Interval
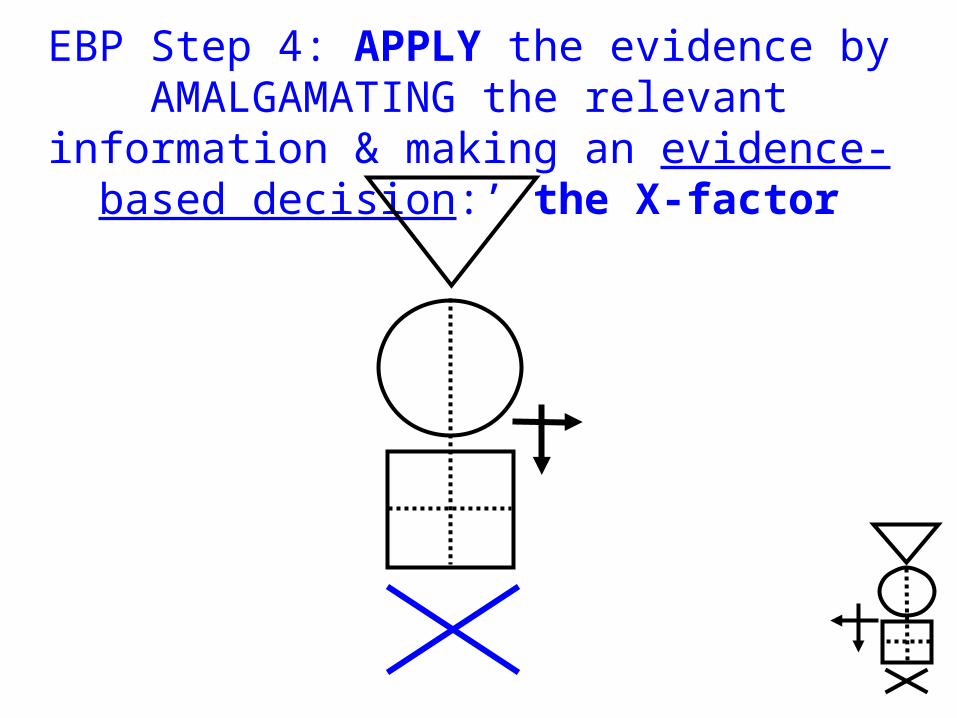
EBP Step 4: APPLY the evidence by AMALGAMATING the relevant information &
making an evidence-based decision:’ the X-factor
©

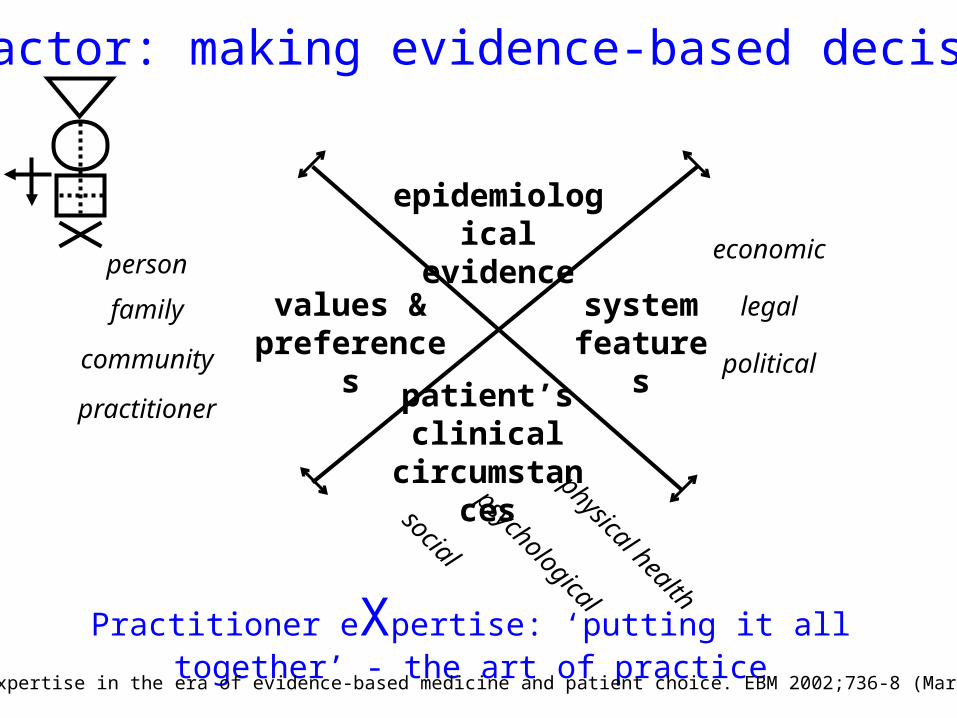
epidemiological evidence
patient’s clinical
circumstances
system features
values & preferences
X-factor: making evidence-based decisions
Practitioner eXpertise: ‘putting it all together’ - the art of practice
economic
legal
political
person
family
community
practitioner
social
physical health
psychological
Clinical expertise in the era of evidence-based medicine and patient choice. EBM 2002;736-8 (March/April)

6-page GATE CATs (word docs)
39

1-page GATE Calculators (excel files)
40

1-page GATE-lites (writeable pdf files)
41
all forms on Cecil EBM site


extra slides

non-smokerssmokers
Lung canceryes
no
smoking status measured
Case-control study44
GATE Frame picture & 1st acronym
P
E C
OT
cases
controls
Observational study: allocated by measurement
Middle-aged American women
Mammogram
Breast cancer negative
positive
negative
Measured with ‘gold standard’ for breast cancer
Diagnostic test accuracy study
Breast cancer positive
45
P
E C
OT
GATE Frame picture & 1st acronym

positive
negative
46
The goal of all epidemiological studies is to measure (& compare) the occurrence of outcomes in
(different) populations (EGO compared with CGO)
P
EG CG
OT
a bEGO:Likelihood of +veMammogram if breast cancer
Middle-aged American women
Mammogram
No breast cancer
Measured with gold standard for breast cancer
Breast cancer
CGO:Likelihood of +ve
Mammogram if no breast cancer

British doctors
non-smokerssmokers
Lung cancer
yes
no10 years
smoking status measured
47
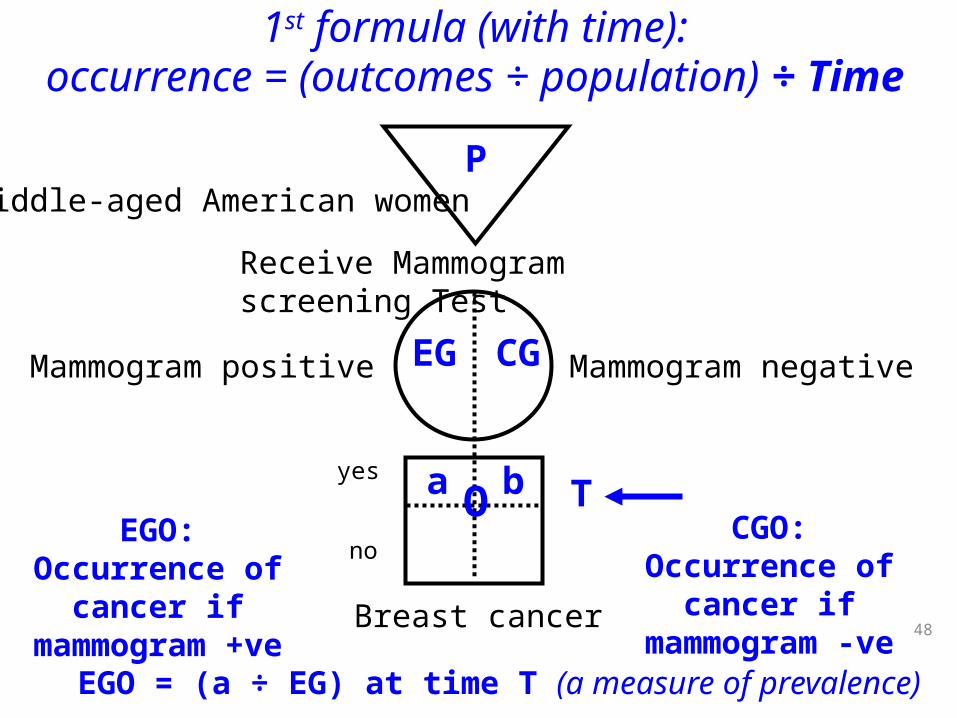
1st formula (with time):occurrence = (outcomes ÷ population) ÷ Time
Population
Comparison GroupExposed Group
OutcomesTime
P
EG CG
OT
EGO = (a ÷ EG) during time T (a measure of cumulative incidence)EGO = (a ÷ EG) ÷ T (a measure of incidence rate)
a b
yes
no
48
P
EG CG
O Ta bEGO:
Occurrence of cancer if mammogram +ve
CGO:Occurrence of cancer if mammogram -ve
Middle-aged American women
Breast cancer
Mammogram negative
Receive Mammogram screening Test
Mammogram positive
1st formula (with time):occurrence = (outcomes ÷ population) ÷ Time
EGO = (a ÷ EG) at time T (a measure of prevalence)