gas turbine seminar -17 - microsoft fatigue high-cycle fatigue ... state-of-the-art combined cycle...
TRANSCRIPT

Gas Turbine Seminar -17Lund University

Lund University / LTH / Energy Sciences / TPE / Magnus Genrup / 2017-10-03 Page 2
Farligaste djuret?

Lund University / LTH / Energy Sciences / TPE / Magnus Genrup / 2017-10-03 Page 3
Farligaste djuret?

Lund University / LTH / Energy Sciences / TPE / Magnus Genrup / 2017-10-03 Page 4
Additive Manufacturing - AM

Lund University / LTH / Energy Sciences / TPE / Magnus Genrup / 2017-10-03 Page 5
Almost 100% renewable in Germany W616

Lund University / LTH / Energy Sciences / TPE / Magnus Genrup / 2017-10-03 Page 6
The European issue…

Lund University / LTH / Energy Sciences / TPE / Magnus Genrup / 2017-10-03 Page 7
Cost of Electricity (CoE) vs. OH
×4
×2
Design
Courtesy of VGB Powertech
0.761
6000 6000t
0.961CoE
tCoE

Lund University / LTH / Energy Sciences / TPE / Magnus Genrup / 2017-10-03 Page 8
The ”Duck-Curve”…
4.3 GW/h
California
Sweden

Lund University / LTH / Energy Sciences / TPE / Magnus Genrup / 2017-10-03 Page 9
Grid codes

Lund University / LTH / Energy Sciences / TPE / Magnus Genrup / 2017-10-03 Page 10
Flexibility
Star
t Steady state Active generation control
Spinning reserve off-peak turndown
SS
Shut
dow
n
Load
LF
Load
Cou
rtesy
of S
iem
ens

Lund University / LTH / Energy Sciences / TPE / Magnus Genrup / 2017-10-03 Page 11
Flexibility
• Start-up– Air attemperation– Sky venting– Cascaded steam bypass with attemperation
• Ramping• Turn-down
– MECL
• Lock-out

Lund University / LTH / Energy Sciences / TPE / Magnus Genrup / 2017-10-03 Page 12
GT start-up

Lund University / LTH / Energy Sciences / TPE / Magnus Genrup / 2017-10-03 Page 13
Emissions vs. firing level
0 10 20 30 40 50 60AFR = FAR-1
Incr
easi
ng
Incr
easi
ngCombustion temp, °C
CONOx
NOx formation rate
Temperature
Stoichiometric
1100 1300 1500 1700
Flame temperature vs air/fuel Temperature influence on NOx and CO
Rich Lean
Tmax
Typical optimum for design at AFR ≈ 30 (i.e. λ ≈ 2)

Lund University / LTH / Energy Sciences / TPE / Magnus Genrup / 2017-10-03 Page 14
Min Emission Compliance Load – MECL
NOx
CO
Exha
ust t
empe
ratu
re, °
C
Emis
sion
s, m
ass/
unit
time
EGT
IIIIII
10 30 50 70 90
Maximum EGT
GT load, percent
MECL
Staging to prevent from:• Lean blow out (LBO)• Combustion dynamics
Lund University / LTH / Energy Sciences / TPE / Magnus Genrup / 2017-10-03 Page 15
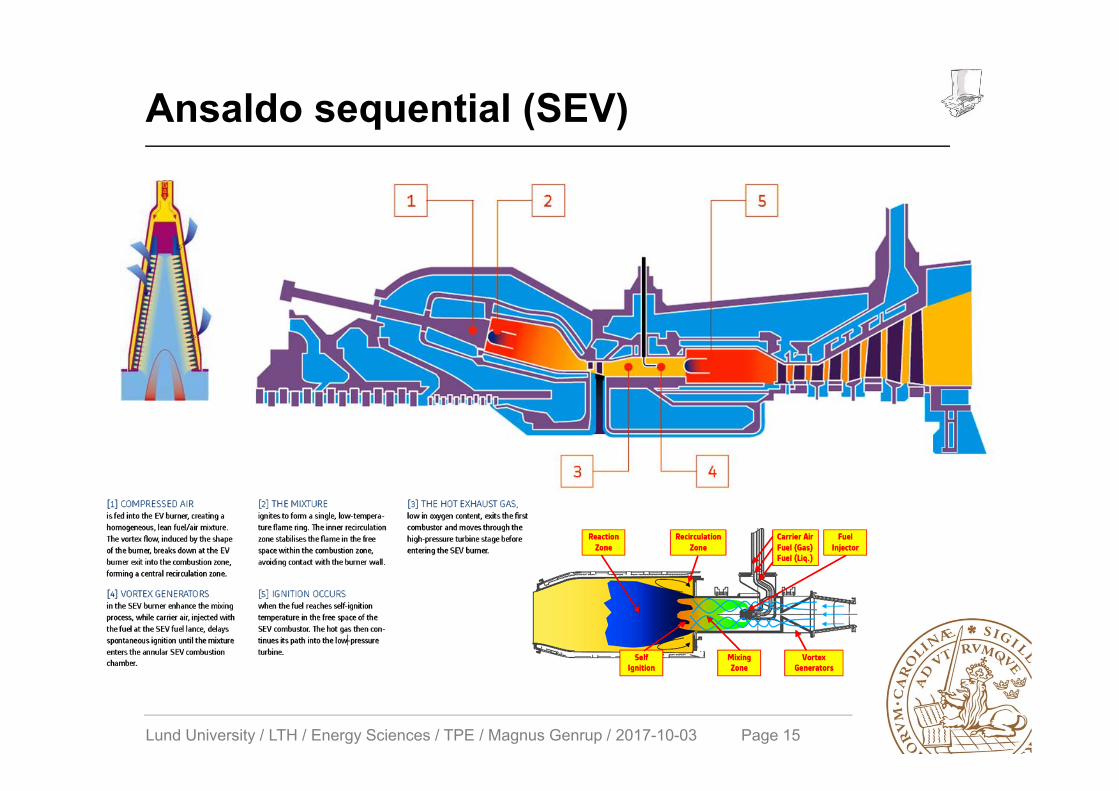
Ansaldo sequential (SEV)
Lund University / LTH / Energy Sciences / TPE / Magnus Genrup / 2017-10-03 Page 16
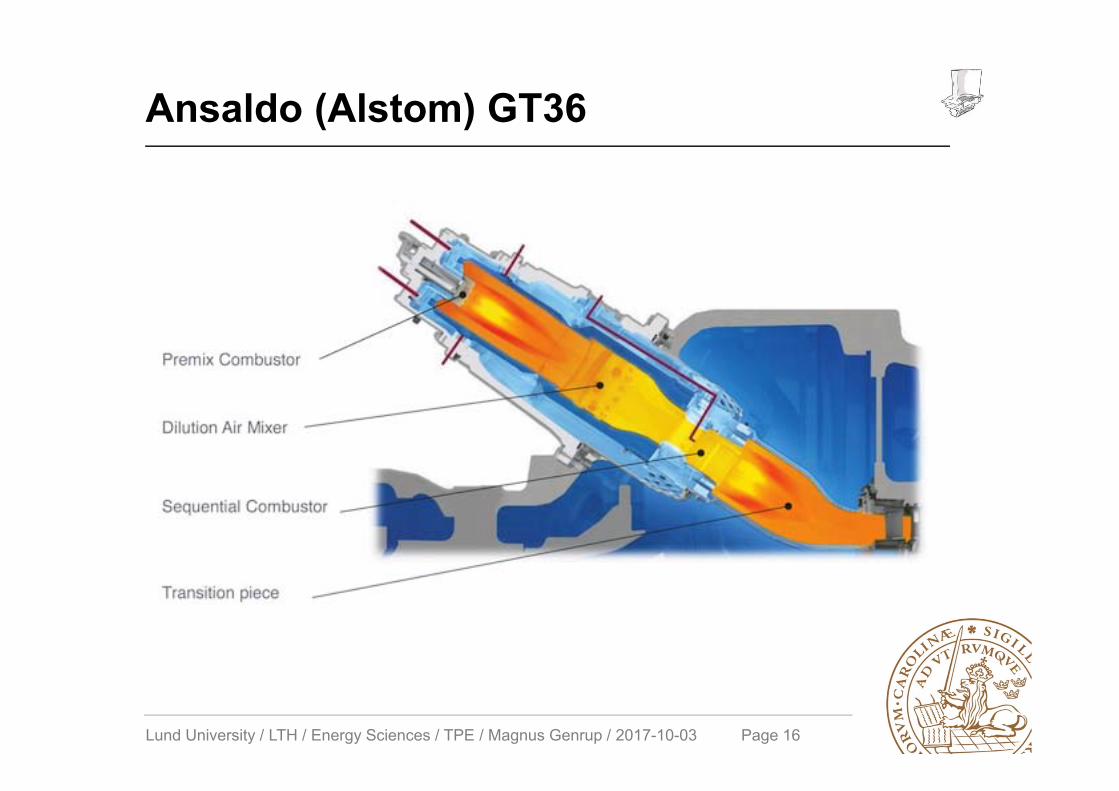
Ansaldo (Alstom) GT36

Lund University / LTH / Energy Sciences / TPE / Magnus Genrup / 2017-10-03 Page 17
Exhaust loss
0
10
20
30
40
50
60Optimum design Super-
sonic
c2
u
w2
aΔh
c2
smV 3
2cΔh
22
a
N.B. The figure is based on a certain exhaust size – a general figure should be based on the annulus velocity (VAN=Q/A) since:• Loss ~ rating or flow• Loss ~ 1/pressure• Loss ~ 1/area ~ 1/ stress
Turn-up region

Lund University / LTH / Energy Sciences / TPE / Magnus Genrup / 2017-10-03 Page 18
Fatigue – low or high?
Life cycles, [n]
Stre
ss a
mpl
itude
, [σ a
]
Low-cycle fatigue High-cycle fatigue
Fatigue limit
σσa
σa
Time
Stre
ss
Failure
No failure – no crack initiation
105…7
Wöhler- or σ,N curve

Lund University / LTH / Energy Sciences / TPE / Magnus Genrup / 2017-10-03 Page 19
Rotor stress – temperature gradients
T
r
TCenter
TAverage
TSteam
TSurface
ΔT
y
i i
r
r
r
r2i
2y
2i
2
2r drrTdrrTrrrr
rμ1Eαrσ
y
i i
r
r
r
r
22i
2y
2i
2
2θ TrdrrTdrrTrrrr
rμ1Eαrσ
rim
r
0
r
022
rimr r
r13ΔTEαdrrT
r1drrT
r1Eαrσ
rim
rim
r
0
r
022
rimθ r
r213ΔTEαTdrrT
r1drrT
r1Eαrσ
rim
Temperature induced stresses (radial and hoop):
Simplified equations for a case without a bore:
α = 1.8∙105 °C-1
E = 6.9∙104 MPaΔT = 55 °Cσ@r=0 = 46 MPa
Example

Lund University / LTH / Energy Sciences / TPE / Magnus Genrup / 2017-10-03 Page 20
Compressor blade failure
Lund University / LTH / Energy Sciences / TPE / Magnus Genrup / 2017-10-03 Page 21
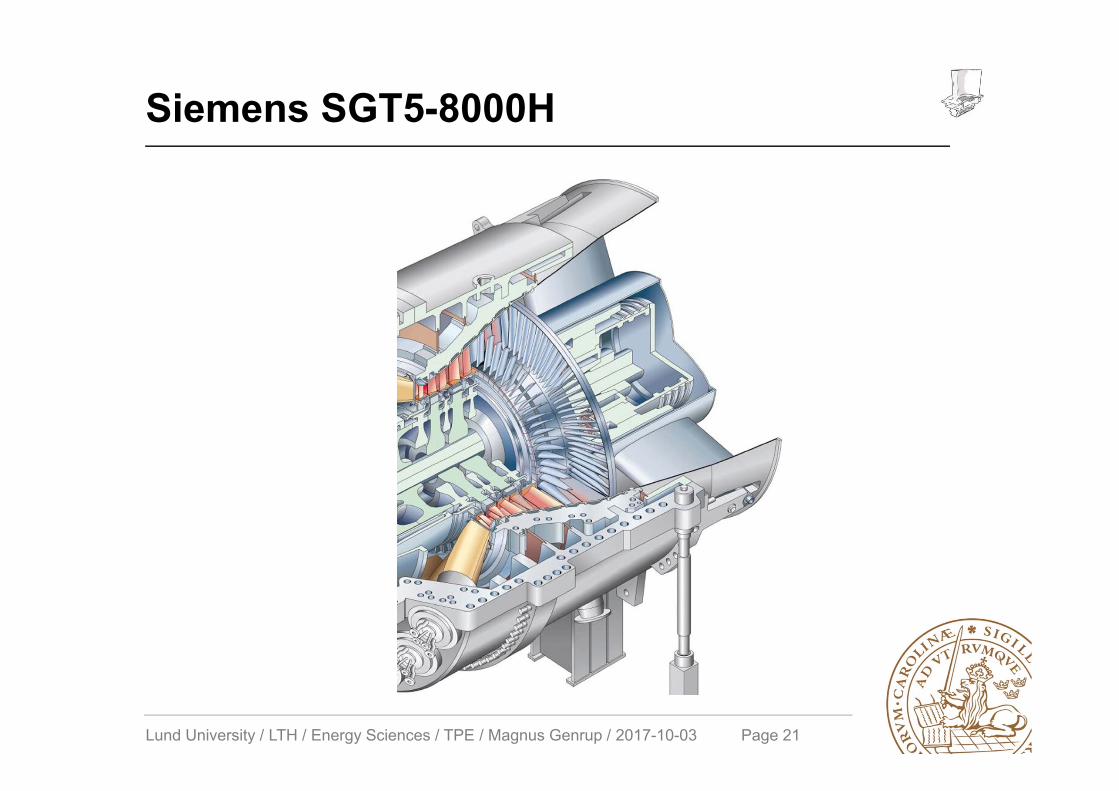
Siemens SGT5-8000H

Lund University / LTH / Energy Sciences / TPE / Magnus Genrup / 2017-10-03 Page 22
Turbine flow path – typical 3-spool aero
Rolls-Royce: The Jet Engine

Lund University / LTH / Energy Sciences / TPE / Magnus Genrup / 2017-10-03 Page 23
State-of-the-art combined cycle – GTCC
Combustor
~ 600°C (+) steam admission
~ 0.02 bar(a)
COT ~ 1,500°C (+)PR ~ 19…25
~ 40%
100%
GTHRSGSCGTCC η1ηηηη
SCR
~ 20%
Compressor Turbine
~ 625…680°C
~ 1.4…1.5 kg/MWs

Lund University / LTH / Energy Sciences / TPE / Magnus Genrup / 2017-10-03 Page 24
Siemens HL-class
Courtesy of Siemens
• 42% efficiency• 85 MW/min• 1000 kg/s• 680 °C EGT

Lund University / LTH / Energy Sciences / TPE / Magnus Genrup / 2017-10-03 Page 25
Siemens HL-class rotor #1
NuL
1~hPr,...Re,fkhL
transferheatConductivetransferheatConvectiveNu
Courtesy of Siemens
Lund University / LTH / Energy Sciences / TPE / Magnus Genrup / 2017-10-03 Page 26
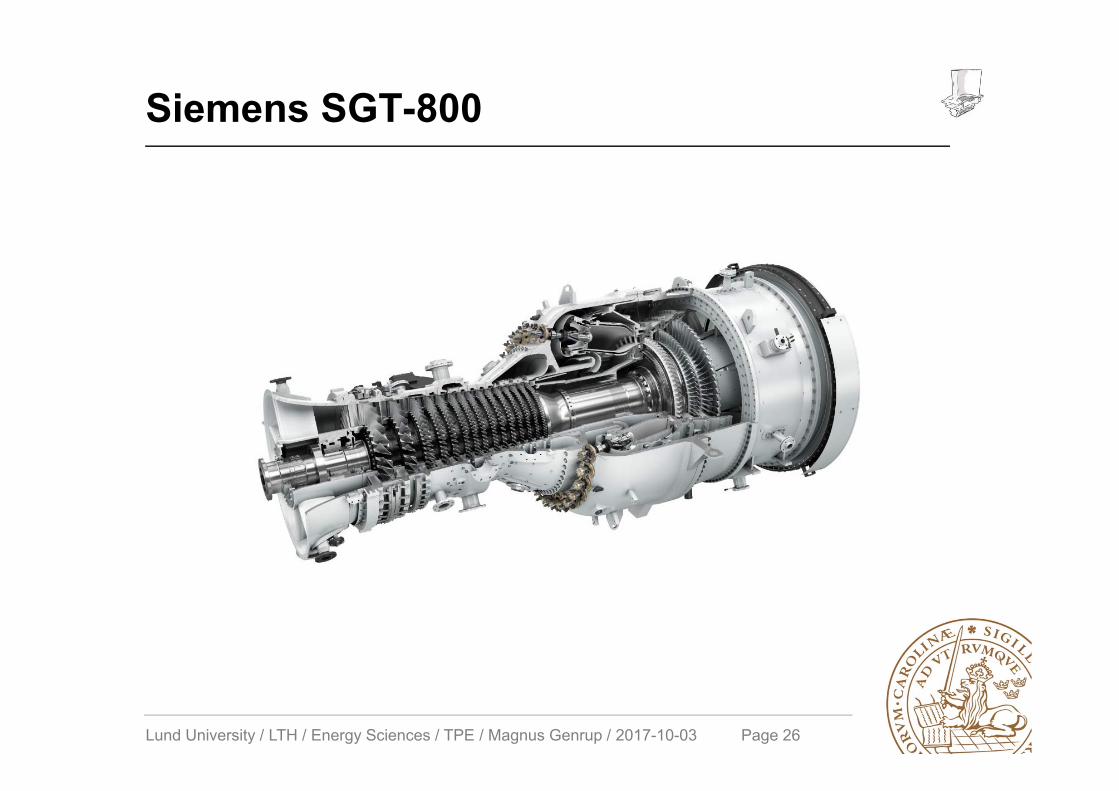
Siemens SGT-800

Lund University / LTH / Energy Sciences / TPE / Magnus Genrup / 2017-10-03 Page 27
GE LM9000Simple Cycle CC & CHP Mechanical Drive• Free power turbine (2400…3780 rpm)
ISO Performance Maintenance Emissions• 65 MW power output• 43% simple-cycle efficiency• 99% availability• >80% cogeneration efficiency• 33:1 pressure ratio• 12,000 hours: inspections• 36,000 hours: hot section replacement• 72,000 hours: overhaul• Package design allows engine swap in 24 hours• 15 ppm DLE NOx & 25 ppm CO• DLE 1.5 dual fuel (natural gas and liquid fuel)
Fuel flex• 30…54 MWI gas
4 stage LPC
9 stage HPC2 stage HPT
1 stage HPT
4 stage HPT

Lund University / LTH / Energy Sciences / TPE / Magnus Genrup / 2017-10-03 Page 28
SGT-A45 TR

Lund University / LTH / Energy Sciences / TPE / Magnus Genrup / 2017-10-03 Page 29
P&W FT4000
Performance• 140 MW nominal output in twin-engine configuration• Wet compression for improved performance above
ISO conditions• Single or dual engine operation (common alternator)• 50 or 60 Hz performance with no penalty• 41% (+) thermal efficiency without external cooling
Operational• Less than 10 minutes start-up time• 30 MW/min ramp rate• Synchronous condensation with spinning PT, a FT has
a windage loss of 500…1,000 kW• NO maintenance penalty for start/stop!• Fleet has 17,500 OH’s and 1400 cycles
P&W has substantial experience in synchronous condensation without SSS-clutch!
>900 engines>20 years>40 MOH

Lund University / LTH / Energy Sciences / TPE / Magnus Genrup / 2017-10-03 Page 30
Ventilation work – spinning PT
• The spinning power turbine will feed work into the ”entrapped” air by increasing the angular momentum
• It is “standard” to assess the work with the equation from the book by Traupel:
• The preceding equation shows why only non-geared PTs can be operated at nominal speed in ventilation
!!!82~
1
3
250@
500@
3222
V
V
V
PP
ulDCP

Lund University / LTH / Energy Sciences / TPE / Magnus Genrup / 2017-10-03 Page 31
Firing level

Lund University / LTH / Energy Sciences / TPE / Magnus Genrup / 2017-10-03 Page 32
Firing temperature – the misery factor…
• Creep follows an Arrhenius type of expression…– The Larson-Miller parameter:
– A more convenient and practical approach is to introduce a maintenance factor – MF (consumed life per hour of operation)
208.1102
2321
3
~10
lnln
10log20
ANANK
KKKP
tTP
Taperc
ccML
MML
Firing Lifing MF850 40000 1860 20000 2870 10000 4880 5000 8
COTeMF 0693.0

Lund University / LTH / Energy Sciences / TPE / Magnus Genrup / 2017-10-03 Page 33
Creep – Larson-Miller parameter
975 1056 1138 1219 @40000 C.R.S

Lund University / LTH / Energy Sciences / TPE / Magnus Genrup / 2017-10-03 Page 34
Lifing
Dtt
NN
rf
• It may be argued that creep-induced damage will reduce the fatigue life of a metal, and that fatigue-induced damage will reduce the metals creep life…
• One approach is to use the linear damage summation (DS) model (also called the linear life fraction, or linear cumulative damage) for assessing creep-fatigue-life: Dfatigue + Dcreep = Dtotal
• By combining the Robinson Rule (1952) for creep and Miner for fatigue, one gets the cumulative damage index (failure at unity):
This is the rationale behind the concept of ”equivalent operating hours”

Lund University / LTH / Energy Sciences / TPE / Magnus Genrup / 2017-10-03 Page 35
The expensive way – equivalent hours…
LCF
n
Trips
n
rateloadstarts
oxidationandcreep
OH
firingfuel
tripsstarts
FFFFFEOH 111111
Where:EOH equivalent operating hoursOH actual operating hoursFfuel factor depending on fuelFfuel factor depending on firing levelnstarts number of “fired” startsFstarts number of hours per startFload rate load rate factor

Lund University / LTH / Energy Sciences / TPE / Magnus Genrup / 2017-10-03 Page 36
LifingM
iner
-Pal
mgr
en
RobinsonD
Nt
NN
rf
Lund University / LTH / Energy Sciences / TPE / Magnus Genrup / 2017-10-03 Page 37
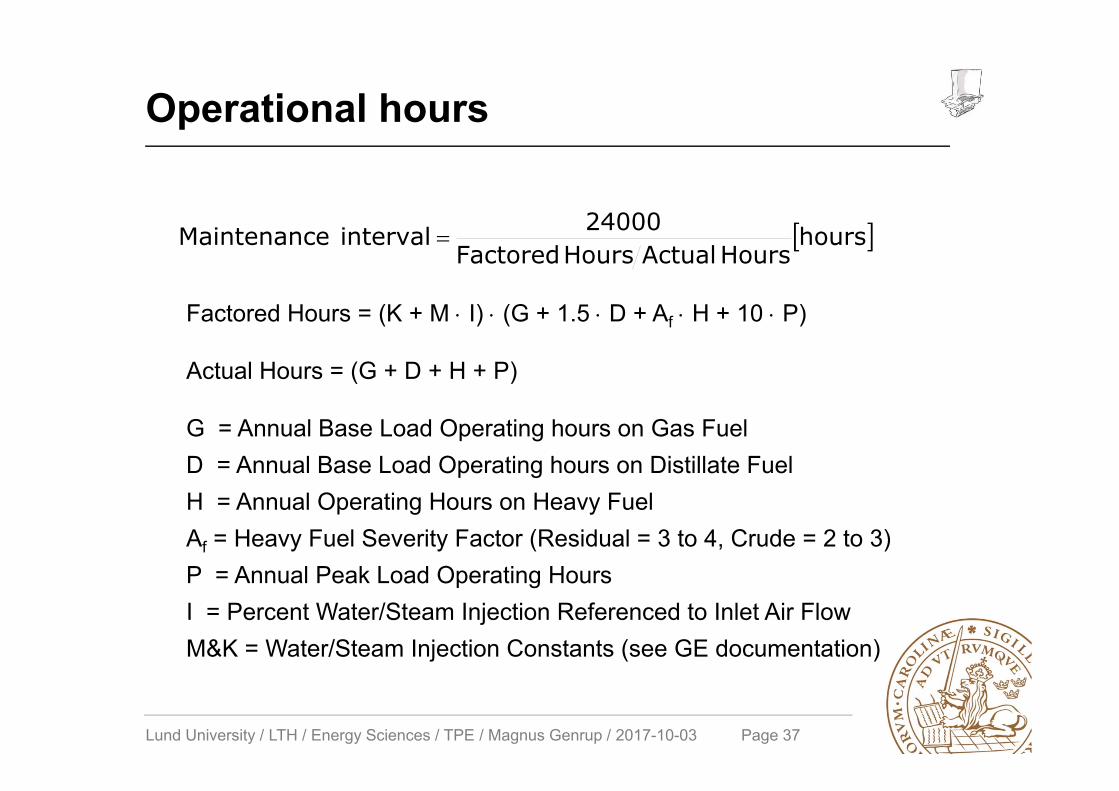
Operational hours
Factored Hours = (K + M I) (G + 1.5 D + Af H + 10 P)
Actual Hours = (G + D + H + P)
G = Annual Base Load Operating hours on Gas FuelD = Annual Base Load Operating hours on Distillate FuelH = Annual Operating Hours on Heavy FuelAf = Heavy Fuel Severity Factor (Residual = 3 to 4, Crude = 2 to 3)P = Annual Peak Load Operating HoursI = Percent Water/Steam Injection Referenced to Inlet Air FlowM&K = Water/Steam Injection Constants (see GE documentation)
hoursHours ActualHours Factored
24000 intervaleMaintenanc

Lund University / LTH / Energy Sciences / TPE / Magnus Genrup / 2017-10-03 Page 38
Noff cycles
• Actual Starts = (NA + NB + NP)• S = Maximum Starts-Based Maintenance Interval (Model Size Dependent)• NA = Annual Number of Part Load Start/Stop Cycles (<60% Load)• NB = Annual Number of Base Load Start/Stop Cycles• NP = Annual Number of Peak Load Start/Stop Cycles (>100% Load)• E = Annual Number of Emergency Starts• F = Annual Number of Fast Load Starts• T = Annual Number of Trips• aTi = Trip Severity Factor = fcn(Load, Trip during accel. = 2, Peak = 10) • η = Number of Trip Categories (i.e. Full Load, Part Load, etc.)
η
1iiTiPBA T1aF2E20N1.6NN0.5 Starts Factored
StartsStarts ActualStarts Factored
900 intervaleMaintenanc

Lund University / LTH / Energy Sciences / TPE / Magnus Genrup / 2017-10-03 Page 39
Turbine governor – twin-shaft
n,...PR,,COTfEGT Nomcontrol
Courtesy of Siemens
s
T 44142
5
P4
P5
n1n
5
4
1η
5
4
5
4x
pp
pp
TT
p
γγ

Lund University / LTH / Energy Sciences / TPE / Magnus Genrup / 2017-10-03 Page 40
Performance modelling
4 8 12 16 20 24 28 32 36 40Mass Flow W25RSTD [kg/s]
.8
1.2
1.6
2
2.4
2.8
3.2
3.6
4
P3q2
5 H
PC P
ress
ure
Rat
io
HPC
N=0.5
N=0.6
N=0.7
N=0.75
N=0.8
N=0.85
N=0.9
N=0.9 5
N=1
N=1 .05
0.86 0.85
0.84
0.82
0.80
0.75
0.70
Not converged points are marked with a red symbol.
44 48 52 56 60 64 68 72 76W48*sqrt(T48)/(P48/Pstd) [Kg/s]
1
1.5
2
2.5
3
P48q
5 P
ower
Tur
bine
Pre
ssur
e R
atio
LPT
N=0.6
N=0.7
N=0.
8N=
0.9N=
1N=
1.1
N=1.
2
0.9
4
0.93
0.92 0.90
0.88 0.85
0.80
Not converged points are marked with a red symbol.

Lund University / LTH / Energy Sciences / TPE / Magnus Genrup / 2017-10-03 Page 41
Some results…
848 856 864 872 880Burner Exit Temperature T4 [C]
1818
.519
19.5
*10 3
Elec
tric
Pow
er [k
W]
02
46
810
1214
2.71
828^
(0.0
693*
(ZT4
-850
))
9810
010
210
410
610
811
011
2R
elat
ive
Torq
ue [%
]
.998
11.
002
1.00
41.
006
1.00
81.
011.
012
Rel
. HP
Spoo
l Spe
ed
Burner Temperature ZT4 = 850 ... 880 [C]

Lund University / LTH / Energy Sciences / TPE / Magnus Genrup / 2017-10-03 Page 42
Impact on output from firing and ambient
848 852 856 860 864 868 872 876 880 884Burner Exit Temperature T4 [C]
14
16
18
20
22
24
26
28*10 3
Elec
tric
Pow
er [k
W]
Burner Temperature ZT4 = 850 ... 880 [C]Ambient Temperature Ts0 = -30 ... 30 [C]
Inlet Temperature T2 [C] = -28...32
-28-24-20-16-12-8-40481216202428
-28
-24
-20
-16-12
-8
-404
8
1216202428
ZT4 = 850 ZT4 = 855 ZT4 = 860 ZT4 = 865 ZT4 = 870 ZT4 = 875 ZT4 = 880

Lund University / LTH / Energy Sciences / TPE / Magnus Genrup / 2017-10-03 Page 43
Flat rate @18 MW
-40 -20 0 20 40Inlet Temperature T2 [C]
700
725
750
775
800
825
850
875
900
925
Burn
er E
xit T
empe
ratu
re T
4 [C
]
.295
.3.3
05.3
1.3
15Th
erm
al E
ffici
ency
-40
48
1216
2024
2832
2.71
83^(
0.06
93*(
ZT4-
850)
)
Ambient Temperature Ts0 = -30 ... 30 [C]

Lund University / LTH / Energy Sciences / TPE / Magnus Genrup / 2017-10-03 Page 44
Emulsionseldning