gas phase transport, adsorption and surface diffusion in a porous glass membrane
TRANSCRIPT

(
0
d
Gas phase transport, adsorption and surface diffusion
in a porous glass membrane
Jianhua Yang a, Jirina Cermakova b, Petr Uchytil b, Christof Hamel a,Andreas Seidel-Morgenstern a,c,*
a Max-Planck-Institute for Dynamics of Complex Technical Systems, D-39106 Magdeburg, Germanyb Institute of Chemical Process Fundamentals, Academy of Sciences, 16502 Prague, Czech Republic
c Otto-von-Guericke-Universitat, Institute of Process Engineering, D-39106 Magdeburg, Germany
www.elsevier.com/locate/cattod
Catalysis Today 104 (2005) 344–351
Available online 13 May 2005
Abstract
Due to their improved performance and excellent chemical resistance, there is a growing interest in applying inorganic membranes not
only for gas separation, but also in combination with heterogeneous-catalysts in membrane reactors. Obviously, a thorough understanding and
a quantification of the mass transfer processes are essential for optimal application. The objective of this work is to study the mass transfer
through a Vycor glass membrane, which might be applied successfully in membrane reactors. Transient diffusion experiments were carried
out and the exchange of two different gases via the membrane was investigated. The observed pressure responses reveal the complicated
nature of the transport through Vycor glass. If adsorbable gases are involved there is a strong asymmetry between corresponding exchange
experiments. Very complex responses were observed for the exchange experiments with C4H10 and C3H8. To understand the observed
behavior, the adsorption capacity of Vycor glass was measured for several gases at ambient temperature. In order to analyze the transient
diffusion experiments, a transport model was applied, which is based on the Dusty Gas Model for the quantification of gas phase transport and
on the generalized Maxwell–Stefan theory for the description of the transport of adsorbed species. The model describes relatively well the
exchange experiments performed with the pairs H2/N2 and He/CO2. It was found that the quality of the theoretical results for experiments with
adsorbable gases depends strongly on the reliability of the model applied to quantify the adsorption isotherms.
# 2005 Elsevier B.V. All rights reserved.
Keywords: Gas phase transport; Adsorption; Surface diffusion; Transient diffusion experiments; Vycor glass
1. Introduction
Currently intensive efforts are devoted to develop
improved inorganic membranes. These materials are attrac-
tive due to their high thermal and chemical stability in
combination with a good mechanical strength. Besides using
inorganic membranes for gas separation (e.g. [1,2]) there is
currently a growing interest in applying them to various
configurations of membrane reactors (e.g. [3–7]). In order to
use membrane separations successfully in combination with
chemical reactions, the relevant rates of transport and reaction
processes must be compatible. Thus, the evaluation of the
* Corresponding author.
E-mail address: [email protected]
A. Seidel-Morgenstern).
920-5861/$ – see front matter # 2005 Elsevier B.V. All rights reserved.
oi:10.1016/j.cattod.2005.03.069
potential and eventually the design and optimization of
membrane reactors require careful determination of the
reaction and mass transfer kinetics.
In a previous study, a systematic investigation of the
dehydrogenation of cyclohexane to benzene using a supported
Pt-catalyst was performed [6,8]. The hydrogen formed in this
reversible model reaction was removed using a porous Vycor
glass membrane leading to enhanced cyclohexane conver-
sion. In several experiments, the equilibrium conversion was
exceeded indicating the potential of such operation. Selected
experimental results of this study are summarized in Fig. 1. In
this figure, predictions are also shown using a 1D isothermal
dispersed plug flow reactor model in combination with the
Dusty Gas Model (DGM) in order to quantify the mass
transfer through the membrane [6]. As can be seen, the
simulations systematically underestimate the performance of

J. Yang et al. / Catalysis Today 104 (2005) 344–351 345
B0 permeability constant (m2)
bi parameter in the Langmuir adsorption iso-
therm (bar�1)
D0i j binary molecular diffusivity in gas phase
(m2 s�1)
Dsi Maxwell–Stefan surface diffusivity (m2 s�1)
Dsi j counter-sorption diffusivity (m2 s�1)
DeK;i Knudsen diffusivity (m2 s�1)
K0 Knudsen coefficient (m)
Mi molecular weight (g mol�1)
Ntot,i, total diffusive molar flux of a species i
(mol m�2 s�1)
Npi diffusive molar flux through gas phase of a
species i (mol m�2 s�1)
Nsi diffusive molar flux of surface diffusion of a
species i (mol m�2 s�1)
n number of diffusing species
p total pressure (Pa)
Dp pressure difference between outer and inner
volume D pðtÞ ¼Pn
i p2;iðtÞ � p1 (Pa)
pi partial pressure of i component (Pa)
qi adsorbed phase concentration of i component
(mmol m�3)
qsat total saturation capacity of adsorbed species
(mmol m�3)
r radius (m)
R universal gas constant (J mol�1 K�1)
t time (s)
V volume (m3)
V volumetric flow rate (m3 s�1)
xi molar fraction of a component i in gas phase
zi molar fraction of a component i in adsorbed
phase
z axial coordinate in eqs. (14) and (15) (m)
1,2 referring to inner/outer volume of the cell
Greek letters
e porosity
h viscosity (Pa s)
m chemical potential (J mol�1)
5m gradient of chemical potential (J mol�1)
t tortuosity
gi activity coefficient of i component in adsorbed
phase
Pmix spreading pressure
Superscript
0 pure component
the membrane reactor. Due to the simplicity of the applied
model there might be several reasons for these discrepancies.
Besides unavoidable thermal effects leading to deviations
from isothermal operation and limitations of the indepen-
dently determined reaction rate model [8], there is strong
evidence that the applied transport model is not sufficient to
quantify correctly the mass transfer in Vycor glass. In refs.
[6,8,9], it was explained that at lower temperatures certain
gases can adsorb on this material, and thus there might be a
significant additional flux related to gradients occurring in the
adsorbed phase.
It is the purpose of this study to present new experimental
results related to the diffusion of inert and adsorbable gases
under transient conditions through a Vycor glass membrane.
These data should lead to a more precise quantification of
the complex mass transfer. Thus, they might support a better
description of membrane reactors in which such membranes
are involved. Since the phenomena of adsorption on
membrane surfaces and transport via surface diffusion are
more general, the results achieved might be also useful for
other membrane types.
2. Mass transfer through porous media and
adsorption isotherms
The mass transfer of gases through a porous solid is
typically due to viscous flow and molecular diffusion in
larger pores and Knudsen diffusion in small pores. In a very
small pore (in the subnanometer range), the transport is
usually an activated process. Details concerning the different
transport mechanisms and useful models are presented, e.g.
in ref. [10]. A frequently used model is the Dusty Gas Model
[11], which is based on the Maxwell–Stefan diffusion
equations. For a gas i in a mixture of n gases, the specific
fluxes in the pores can be described using eq. (1).
� p
RTrxi �
xi
RT1 þ B0
hDeK;i
p
!r p
¼Xn
j¼1; j 6¼ i
x jNpi � xiN
pj
ðe=tÞD0i j
þ Npi
DeK;i
; i ¼ 1; . . . ; n (1)
where Npi is the flux of component i, B0 the permeability
constant of the viscous flow, DeK;i the effective Knudsen
diffusion coefficient, D0i j the binary molecular diffusivity
and e/t is the ratio of porosity to tortuosity. For DeK;i, it holds:
DeK;i ¼
4
3
� �� K0
ffiffiffiffiffiffiffiffiffi8RT
pMi
r; i ¼ 1; . . . ; n (2)
In the above, K0 is the Knudsen coefficient. Thus, for a
homogenous porous structure there are the free parameters
B0, K0 and e/t. In general, for a certain porous material these
parameters must be determined experimentally.
Besides the flux through the pores, in case of adsorbable
gases, an additional flux due to surface diffusion could
contribute significantly to the overall mass transfer. The
Generalized Maxwell–Stefan (GMS) equations [12] can
describe this phenomenon:

J. Yang et al. / Catalysis Today 104 (2005) 344–351346
Fig. 1. Comparison between experimentally (symbols) determined and predicted (lines) conversions of cyclohexane in a membrane reactor using a Pt-catalyst
and a Vycor glass membrane in order to remove selectively the hydrogen out of the reaction zone [6,8]. The sweep ratio g is the ratio of the sweep and feed
volumetric flow rates. Temperature 473 K. Cyclohexane feed concentrations: 3.7 vol% (left), 4.9 vol% (middle) and 5.8 vol% (right). The corresponding
equilibrium conversions Xeq are indicated by dashed lines.
� 1 � eRT
qirmsi ¼
Xn
j¼1; j 6¼ i
q jNsi � qiN
sj
qsatDsi j
þ Nsi
Dsi
; i ¼ 1; . . . ; n
(3)
where Nsi is the flux of component i due to surface diffusion. In
eq. (3), e is again the porosity, qi the adsorbed phase con-
centration, rmsi the chemical surface potential gradient of
component i and Dsi j is the GMS counter-sorption diffusiv-
ities. Dsi is the surface diffusivities of the adsorbed compo-
nents. If surface diffusion is relevant, these are important
additional free parameters. The chemical surface potential
gradient of a species is related to the adsorption isotherms
qi ¼ qið p1; p2; . . . ; pnÞ; i ¼ 1; . . . ; n (4)
In case that for an adsorbable gas both the contributions
by gas phase transport and by surface diffusion are relevant,
the total molar flux can be described using eq. (5):
Ntot;i ¼ Npi þ Ns
i ; i ¼ 1; . . . ; n (5)
An equation frequently used to quantify the adsorption
isotherms for single components is the Langmuir equation
eq. (6).
q0i ¼ qsat;ibi p0
i
1 þ bi p0i
; i ¼ 1; . . . ; n (6)
This equation can be extended in order to quantify the
partial adsorption isotherms of several components in ideal
mixtures.
qi ¼qsat;ibi pi
1 þPn
j¼1 b j p j; i ¼ 1; . . . ; n (7)
A thermodynamically consistent description requires all
saturation capacities qsat,i in eq. (6) to be identical [13].
Besides the competitive Langmuir isotherm equation
(eq. (7)), the more flexible Ideal Adsorbed Solution (IAS)
theory [13,14] can be applied to describe the partial
adsorption isotherms for a mixture. The amounts of each
component adsorbed in a mixture can be calculated from the
following set of equations:
zi ¼qiPNj q j
(8)
XN
i¼1
qi
q0i ð p0
i Þ¼ 1 (9)
zi ¼pi
p0i
(10)
Pmix ¼ P
i ð p0i Þ ¼
Z p0i
0
q0i ð p0
i Þp0
i
d p0i (11)
where zi is the fraction of component i in the adsorbed phase
and P* is the modified spreading pressure. The superscripts
designate single component adsorption. For the individual
isotherms, q0i ð p0
i Þ, arbitrary analytical models can be
applied, including eq. (6).
In case of non-ideal adsorbed solutions, the amounts
adsorbed should better be calculated by the Real Adsorbed
Solution (RAS) theory, where activity coefficients char-
acterize the properties of the adsorbed phase. Instead of
eq. (10), then eq. (12) has to be used [15–17].
g izi ¼pi
p0i
; i ¼ 1; . . . ; n (12)
3. Experimental
The Vycor glass applied for the measurements was
provided by Corning Inc. (USA), equally as for the studies
described in refs. [6,8,9]. It consists of 96% silica with the
remainder being mainly B2O3 (glass code is 7930). The
mean pore diameter is 3.8 nm. The glass was supplied in
tubular geometry. Compared to refs. [8,9] the tubes had
slightly different dimensions: 100 mm (length), 2.85 mm
(inner radius) and 4.05 mm (outer radius).
Two sets of experiments were carried out:

J. Yang et al. / Catalysis Today 104 (2005) 344–351 347
(a) th
Fig.
(acco
e determination of adsorption isotherms for selected
gases;
(b) tr
ansient diffusion experiments for different gasmixtures.
3.1. Adsorption isotherms
Due to their importance for a proper understanding of the
transport of adsorbable gases adsorption isotherms have
been measured at ambient temperature for several gases as
single components and in binary mixtures.
To perform the adsorption measurements one tubular
glass membrane was crushed into small fragments.
Adsorption equilibrium data were determined for CO2,
C3H8 and C4H10 as single gases and for C3H8/CO2 and
C3H8/C4H10 mixtures (1:1) using a volumetric method. The
set-up for measurements with mixtures consists of two
compartments with well-defined volumes, which are
connected by valves and can be evacuated and filled with
gases individually. Before the measurement the mixture
constituents are introduced into the first compartment, while
in the second compartment a known amount of Vycor glass
is placed. The pressures and compositions are determined by
pressure transducers and a gas chromatograph, respectively.
To perform the measurement, the sample compartment is
connected with the other compartment. After reaching the
adsorption equilibrium, the final pressure and composition
of the gas are measured. The adsorbed amounts can then be
calculated from the initial and the equilibrium pressures and
compositions using material balances.
3.2. Transient diffusion experiments
Transient diffusion experiments were performed using a
modified Wicke–Kallenbach arrangement according to [18].
A schematic illustration of the set-up is shown in Fig. 2. This
set-up allows to perform transient experiments, which are
started, after an initialization period, by substituting an
enclosed gas via the membrane by another gas. Before an
2. A schematic diagram of set-up for transient diffusion experiment
rding to ref. [18]).
experiment was started, the cell volume (Fig. 2a–c) was
completely swept through with gas 1. At the beginning of the
measurement, gas 1 is replaced by gas 2 by switching the
four-way valve. The total pressure difference between the
closed outer volume c and the open inner volume b, Dp, is
recorded as a function of time. After reaching a steady-state,
characterized by Dp = 0, the reverse experiment can be
performed by switching back the valve. These experiments
were performed at ambient temperature for exchanging two
non-adsorbable (inert) gases (He/N2), an inert and an
adsorbable gas (He/CO2 and N2/CO2) and two adsorbable
gases (C3H8/CO2 and C3H8/C4H10).
In order to describe the performed transient diffusion
experiments quantitatively, the following mass balances for
the membrane eq. (13), the outer cell volume (closed, index
2, eq. (14)) and the inner cell volume (open, index 1,
eq. (15)) must be solved together [9]:
eRT
@ pi
@tþ ð1 � eÞ @qi
@t¼ rNtot;i; i ¼ 1; . . . ; n (13)
1
RT
@ p2;i
@t¼ 2pr2
V2
ZL0
Ntot;iðz; r ¼ r2Þ dz; i ¼ 1; . . . ; n (14)
1
RT
@ p1;i
@t¼ � 1
RT
p1
A1
@ðx1;iV1Þ@z
� 2pr1
A1
Ntot;iðz; r ¼ r1Þ;
i ¼ 1; . . . ; n (15)
These equations can be solved numerically together with
the required initial and boundary conditions using the
method of lines [8]. Provided the parameter of the transport
models and the isotherms (in case of adsorbable gases) are
known, eqs. (13)–(15)) allow to predict the development of
the pressure difference D pðtÞ ¼Pn
i p2;iðtÞ � p1. And by
comparing such predictions with experimental observations
ofDp(t) free model parameters can be estimated as described
in ref. [9].
4. Results and discussion
4.1. Adsorption isotherms of single components and
mixtures
Fig. 3a shows measured adsorption equilibrium data for
C3H8 and C4H10 as single components and 1:1 mixtures. As
a single component, C4H10 is adsorbed in larger amounts
than C3H8. For C4H10, the amount adsorbed from the
mixture is, as expected, smaller than that for the single
component. Surprisingly, for the same partial pressure, the
amount of C3H8 adsorbed from the mixture is almost the
same as that for the single component. This indicates almost
negligible competition by C4H10 and the presence of severe
non-ideality of this system.

J. Yang et al. / Catalysis Today 104 (2005) 344–351348
Fig. 3. (a) Observed adsorption isotherms for C4H10 and C3H8 single
components and for C3H8/C4H10 binary mixtures (1:1) at ambient tem-
perature. (b) Observed adsorption isotherms for C3H8 and CO2 single
components and for C3H8/CO2 mixtures (1:1) and predicted ones by using
eq. (6) (solid line) and eq. (7) (dashed line) and the parameters in Table 1 for
qsat;CO26¼ qsat;C3H8
.
Fig. 4. Observed and calculated (eqs. (13)–(15)) transient of the pressure
differences between the two chambers of the cell after exchanging the inert
gases He and N2.
In Fig. 3b, the observed adsorption isotherms for the
single components C3H8 and CO2 are shown and
competitive isotherms for C3H8/CO2 mixtures with an
equilibrium partial pressure ratio of 1:1. CO2 is more
adsorbed on Vycor glass than C3H8. However, it is less
adsorbed than C4H10 (Fig. 3a). The two single component
isotherms can be well described by the Langmuir equation
(eq. (6), solid lines). The corresponding parameters are given
in Table 1. Again surprisingly, the observed adsorbed
amounts of C3H8 from the mixture (symbol &) are similar to
those for the single component (symbol &). Thus, they are
larger than the values predicted by the competitive Langmuir
equation (eq. (7), dashed lines). In contrast, for CO2
adsorption the observed amounts adsorbed from the mixture
Table 1
Estimated parameters of the adsorption isotherm eq. (6) for CO2 and C3H8 on V
105qsat;CO2ðmol cm�3Þ bCO2
ðb
qsat;CO26¼ qsat;C3H8
158.7 0.961
qsat;CO2¼ qsat;C3H8
170.0 0.854
are significantly smaller than those for the single component.
This indicates the expected competition in mixtures
compared to single component systems. The multi-
component Langmuir model (eq. (7)) underestimates the
extent of this effect and cannot properly describe the
adsorption behavior of C3H8 and CO2 in the 1:1 mixture.
This holds for both cases assuming different or identical
saturation capacities (Table 1). Additional calculations not
presented here in detail revealed that also the IAS theory
using the single component Langmuir equation in eqs. (9)
and (11) is not capable of quantifying the observed mixture
behavior correctly. An alternative approach based on a more
complicated description of the single component isotherms
using a dual site adsorption model, as suggested in ref. [14],
might offer a solution. Also the introduction of concentra-
tion-dependent activity coefficients gi (eq. (12)) describing
non-ideal adsorbed phases, could offer a possibility to
correlate the observed adsorption equilibrium data. How-
ever, the correct determination of such activity coefficients is
complicated [17] and was not considered at the stage of this
project.
4.2. Transient diffusion experiments with inert and
adsorbable gases
At first, transient experiments were performed for the two
non-adsorbable (inert) gases He and N2. There is a clear
symmetry between two consecutive reverse exchange
experiments as illustrated in Fig. 4. Analyzing these and
ycor at 20 8C (from single component data)
ar�1Þ 105qsat;C3H8ðmol cm�3Þ bC3H8
ðbar�1Þ
199.1 0.327
170.0 0.401

J. Yang et al. / Catalysis Today 104 (2005) 344–351 349
Table 2
DGM parameters (eqs. (1) and (2)) of Vycor glass determined from
experiments with inert gases
1018 � B0 (m2) 1.748
1011 � K0 (m) 6.346
e/t (�) 0.039
Fig. 6. Observed and calculated (eqs. (13)–(15)) results for the exchange of
the two adsorbable gases C3H8 and CO2. (symbol: (*) observations; dotted
lines, Langmuir eq. (6) for both components; solid lines, competitive
Langmuir eq. (7) for both components; dashed lines, single component
Langmuir eq. (6) for C3H8 and competitive Langmuir eq. (7) for CO2).
other experiments with inert gases, the three structural
parameters of the DGM, K0, B0 and e/t, could be determined
by matching experimental and theoretical (eqs. (13)–(15))
transients. The results are summarized in Table 2. The
obtained estimates for K0 and e/t agree quite well with the
values determined in the previous study [8]. A larger
difference was found for the permeability constant B0. This
might be due to the fact that the contribution of viscous flux
to the overall mass transfer is very small and the sensitivity
of the total flux to B0 is low. A further reason might be the
fact that a different batch of membranes was used for the
present investigations. With the parameters obtained, the
predicted transients (the solid curves in Fig. 4) are in a good
agreement with the observations. This supports the validity
of the model applied as well as the parameter estimates.
For the exchange of the inert gas He and the adsorbable
gas CO2, a pronounced asymmetry between two subsequent
exchange experiments was observed as illustrated in Fig. 5
(note the difference in the maxima). In order to describe
these curves, it was found necessary to include contributions
of surface diffusion to the overall flux (eq. (5)). This is in
agreement with results presented in ref. [8]. Using the
parameters of the DGM and the single component Langmuir
isotherm equation only the surface diffusivity DsCO2
was
determined from the observed transients. The obtained
values DsCO2
¼ 1:71 � 10�9 m2 s�1 is again in good agree-
ment with results obtained earlier [8]. Using this value leads
to relatively good agreement between the calculated and
observed transients (Fig. 5). Based on a more detailed
analysis of the profiles of gas phase and surface diffusion
fluxes using eqs. (13)–(15), it can be concluded that during
Fig. 5. Observed and calculated (eqs. (13)–(15)) results for the exchange of
an inert gas (He) and an adsorbable gas (CO2).
these experiments both gas phase and surface diffusion
contributed to the overall flux.
For the exchange of the two adsorbable gases C3H8 and
CO2 an even more pronounced asymmetry between two
corresponding reverse experiments was observed, as shown
in Fig. 6. Using the DGM and the GMS model, it was
attempted to describe these measurements. For this the
surface diffusivity of DsC3H8
as determined in ref. [8] was
used as an additional parameter. The calculations were
performed for different combinations of the adsorption
isotherms with eqs. (6) and (7). As revealed in Fig. 6, all
these calculations show a systematic disagreement com-
pared to the observations. The dotted curves were obtained
using the single component Langmuir adsorption isotherm
(eq. (6)) for both components. In this case, the over-
estimation of the amount of adsorbed CO2 (Fig. 3b) results in
an underestimation of the pressure difference for substitu-
tion of CO2 by C3H8 and in an overestimation for the reverse
experiment. The solid curves were calculated using the
competitive Langmuir model (eq. (7)) for both components.
As could be seen in Fig. 3b, also this adsorption model does
not lead to satisfying results. For the third case, where the
single component Langmuir equation is used to describe
C3H8 adsorption and the competitive Langmuir equation for
CO2 adsorption, a better agreement is achieved between
predicted pressure responses (dashed curve) and the
observations (open circles).
As can be concluded from the results presented in Fig. 6,
the adsorption equilibrium functions have a pronounced
effect on the course of the pressure responses in such
transient diffusion experiments if they are performed with
adsorbable gases. A better quantitative description of the
results apparently requires a more accurate isotherm models
than provided by eqs. (6) and (7).
J. Yang et al. / Catalysis Today 104 (2005) 344–351350
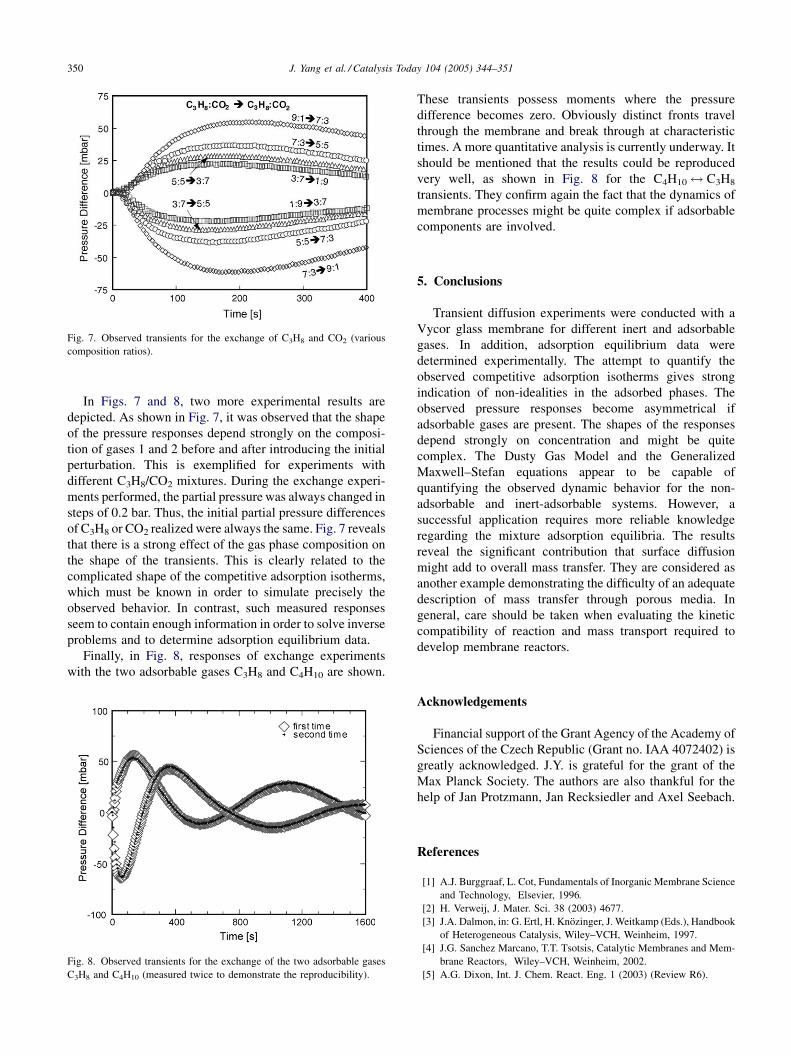
Fig. 7. Observed transients for the exchange of C3H8 and CO2 (various
composition ratios).
In Figs. 7 and 8, two more experimental results are
depicted. As shown in Fig. 7, it was observed that the shape
of the pressure responses depend strongly on the composi-
tion of gases 1 and 2 before and after introducing the initial
perturbation. This is exemplified for experiments with
different C3H8/CO2 mixtures. During the exchange experi-
ments performed, the partial pressure was always changed in
steps of 0.2 bar. Thus, the initial partial pressure differences
of C3H8 or CO2 realized were always the same. Fig. 7 reveals
that there is a strong effect of the gas phase composition on
the shape of the transients. This is clearly related to the
complicated shape of the competitive adsorption isotherms,
which must be known in order to simulate precisely the
observed behavior. In contrast, such measured responses
seem to contain enough information in order to solve inverse
problems and to determine adsorption equilibrium data.
Finally, in Fig. 8, responses of exchange experiments
with the two adsorbable gases C3H8 and C4H10 are shown.
Fig. 8. Observed transients for the exchange of the two adsorbable gases
C3H8 and C4H10 (measured twice to demonstrate the reproducibility).
These transients possess moments where the pressure
difference becomes zero. Obviously distinct fronts travel
through the membrane and break through at characteristic
times. A more quantitative analysis is currently underway. It
should be mentioned that the results could be reproduced
very well, as shown in Fig. 8 for the C4H10 $ C3H8
transients. They confirm again the fact that the dynamics of
membrane processes might be quite complex if adsorbable
components are involved.
5. Conclusions
Transient diffusion experiments were conducted with a
Vycor glass membrane for different inert and adsorbable
gases. In addition, adsorption equilibrium data were
determined experimentally. The attempt to quantify the
observed competitive adsorption isotherms gives strong
indication of non-idealities in the adsorbed phases. The
observed pressure responses become asymmetrical if
adsorbable gases are present. The shapes of the responses
depend strongly on concentration and might be quite
complex. The Dusty Gas Model and the Generalized
Maxwell–Stefan equations appear to be capable of
quantifying the observed dynamic behavior for the non-
adsorbable and inert-adsorbable systems. However, a
successful application requires more reliable knowledge
regarding the mixture adsorption equilibria. The results
reveal the significant contribution that surface diffusion
might add to overall mass transfer. They are considered as
another example demonstrating the difficulty of an adequate
description of mass transfer through porous media. In
general, care should be taken when evaluating the kinetic
compatibility of reaction and mass transport required to
develop membrane reactors.
Acknowledgements
Financial support of the Grant Agency of the Academy of
Sciences of the Czech Republic (Grant no. IAA 4072402) is
greatly acknowledged. J.Y. is grateful for the grant of the
Max Planck Society. The authors are also thankful for the
help of Jan Protzmann, Jan Recksiedler and Axel Seebach.
References
[1] A.J. Burggraaf, L. Cot, Fundamentals of Inorganic Membrane Science
and Technology, Elsevier, 1996.
[2] H. Verweij, J. Mater. Sci. 38 (2003) 4677.
[3] J.A. Dalmon, in: G. Ertl, H. Knozinger, J. Weitkamp (Eds.), Handbook
of Heterogeneous Catalysis, Wiley–VCH, Weinheim, 1997.
[4] J.G. Sanchez Marcano, T.T. Tsotsis, Catalytic Membranes and Mem-
brane Reactors, Wiley–VCH, Weinheim, 2002.
[5] A.G. Dixon, Int. J. Chem. React. Eng. 1 (2003) (Review R6).

J. Yang et al. / Catalysis Today 104 (2005) 344–351 351
[6] A. Seidel-Morgenstern, in: K. Sundmacher, A. Kienle, A. Seidel-
Morgenstern (Eds.), Integrated Chemical Processes, Wiley–VCH,
Weinheim, in press.
[7] J.M. van de Graaf, M. Zwiep, F. Kapteijn, J.A. Moulijn, Appl. Catal.
A: Gen. 178 (1999) 225.
[8] A. Tuchlenski, Charakterisierung poroser Membranen und ihre Char-
akterisierung in Membranreaktoren, Ph.D. Thesis, Otto-von-Guer-
icke-Universitat Magdeburg and Logos Verlag Berlin, ISBN 3-
89722-145-4, 1998.
[9] A. Tuchlenski, P. Uchytil, A. Seidel-Morgenstern, J. Membr. Sci. 140
(1998) 165.
[10] J.A. Wesselingh, R. Krishna, Mass transfer in Multicomponent
Mixtures, Delft University Press, 2000.
[11] E.A. Mason, A.P. Malinauskas, Gas Transport in Porous Media: The
Dusty Gas Model, Elsevier, Amsterdam, 1983.
[12] R. Krishna, Chem. Eng. Sci. 48 (1993) 845.
[13] A.L. Myers, J.M. Prausitz, AIChE 11 (1) (1965) 121.
[14] F. Kapteijn, J.A. Moulijn, R. Krishna, Chem. Eng. Sci. 55 (1) (2000)
2923.
[15] A.L. Myers, AIChE 29 (4) (1983) 691.
[16] A. Seidel, D. Gelbin, Chem. Eng. Sci. 43 (1) (1988) 19.
[17] O. Lisec, P. Hugo, A. Seidel-Morgenstern, J. Chromatogr. A 908
(2001) 19.
[18] M. Novak, K. Ehrhardt, K. Klusacek, P. Schneider, Chem. Eng. Sci. 43
(1988) 185.