gas market report 19 25 may 2019
TRANSCRIPT
© Commonwealth of Australia 1 AER reference: 39270 – D18/82521
Gas Market Report
19 – 25 May 2019
Weekly Summary
With the exception of demand in Brisbane, average demand and prices decreased across all
markets compared to the previous week, settling around $9-10/GJ across the east coast.
There were 4 exchange traded products at the Moomba gas supply hub (one on the
Moomba to Adelaide Pipeline) and a further 8 off market trades on the Moomba to Sydney
Pipeline. Further details of these trades are provided at the end of this report above
figure 6.1.
GPG demand remained stable compared to the previous week.
Long term statistics and explanatory material
The AER has published an explanatory note to assist with interpreting the data presented in
its weekly gas market reports. The AER also publish a range of longer term statistics on the
performance of the gas sector including gas prices, production, pipeline flows and consumer
demand.
Market overview
Figure 1 sets out the average daily prices ($/GJ) for the current week, and demand levels,
compared to historical averages. Regions shown include the Victorian Declared Wholesale
Market (VGM or Victorian gas market) and for the Sydney (SYD), Adelaide (ADL) and
Brisbane (BRI) Short Term Trading Market hubs (STTM).
Figure 1: Average daily prices and demand – all markets ($/GJ, TJ)1
Victoria Sydney Adelaide Brisbane
Price Demand Price Demand Price Demand Price Demand
19 May - 25 May 2019 9.06 539 9.02 250 9.97 59 8.19 86
% change from
previous week -4 -15 -4 -4 -4 -4 -6 1
18-19 financial YTD 9.69 515 9.96 244 10.03 57 9.49 87
% change from
previous financial YTD 23 -5 18 -2 26 -4 31 -8
Figure 2 sets out price and demand information for the voluntary Wallumbilla and Moomba
Gas Supply Hubs (GSH).
1 Average daily quantities are displayed for each region. The weighted average daily imbalance price applies for
Victoria.
2
Figure 2: Average prices and total quantity – Gas supply hub ($/GJ, TJ)2
Moomba South East Queensland Wallumbilla
Price Quantity Price Quantity Price Quantity
19 May - 25 May 2019 9.69 205 7.74 232 8.99 972
% change from
previous week 15 659 -3 41 6 108
18-19 financial YTD 8.87 335 9.35 10581 9.30 9070
% change from
previous financial YTD 61 2477 28 21 21 112
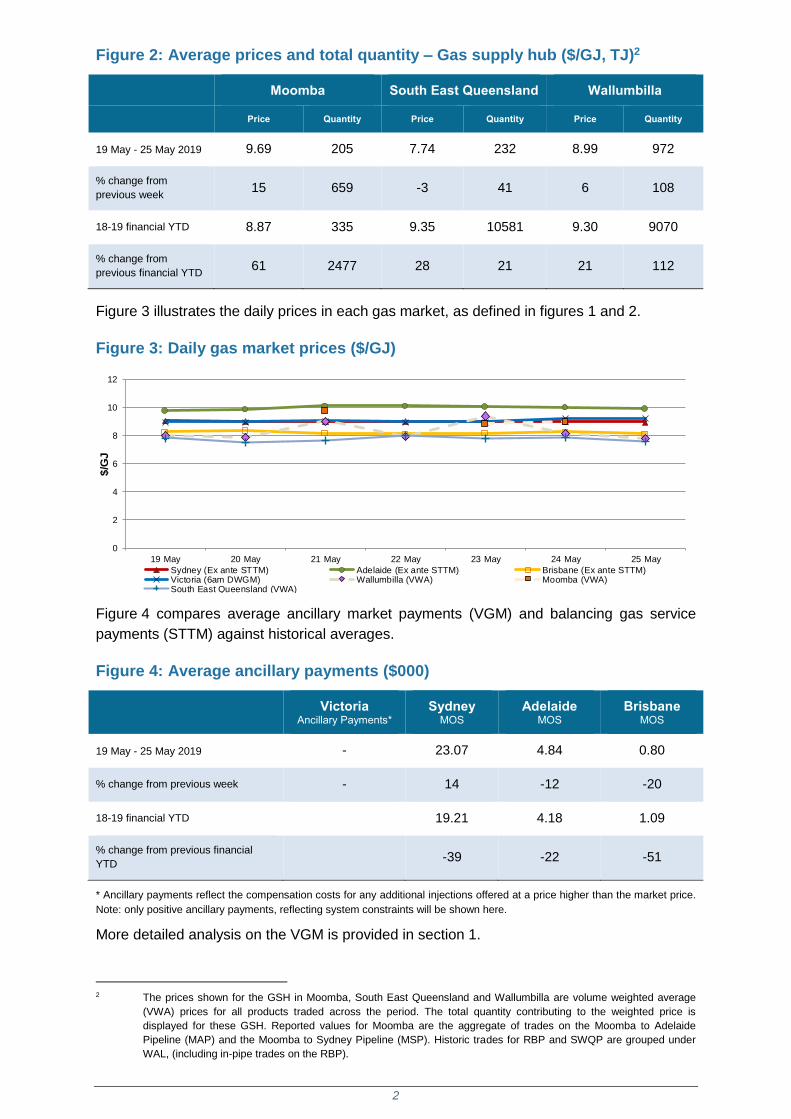
Figure 3 illustrates the daily prices in each gas market, as defined in figures 1 and 2.
Figure 3: Daily gas market prices ($/GJ)
Figure 4 compares average ancillary market payments (VGM) and balancing gas service
payments (STTM) against historical averages.
Figure 4: Average ancillary payments ($000)
Victoria
Ancillary Payments* Sydney
MOS Adelaide
MOS Brisbane
MOS
19 May - 25 May 2019 - 23.07 4.84 0.80
% change from previous week - 14 -12 -20
18-19 financial YTD 19.21 4.18 1.09
% change from previous financial
YTD -39 -22 -51
* Ancillary payments reflect the compensation costs for any additional injections offered at a price higher than the market price.
Note: only positive ancillary payments, reflecting system constraints will be shown here.
More detailed analysis on the VGM is provided in section 1.
2 The prices shown for the GSH in Moomba, South East Queensland and Wallumbilla are volume weighted average
(VWA) prices for all products traded across the period. The total quantity contributing to the weighted price is
displayed for these GSH. Reported values for Moomba are the aggregate of trades on the Moomba to Adelaide
Pipeline (MAP) and the Moomba to Sydney Pipeline (MSP). Historic trades for RBP and SWQP are grouped under
WAL, (including in-pipe trades on the RBP).
0
2
4
6
8
10
12
19 May 20 May 21 May 22 May 23 May 24 May 25 May
$/G
J
Sydney (Ex ante STTM) Adelaide (Ex ante STTM) Brisbane (Ex ante STTM)Victoria (6am DWGM) Wallumbilla (VWA) Moomba (VWA)South East Queensland (VWA)
3
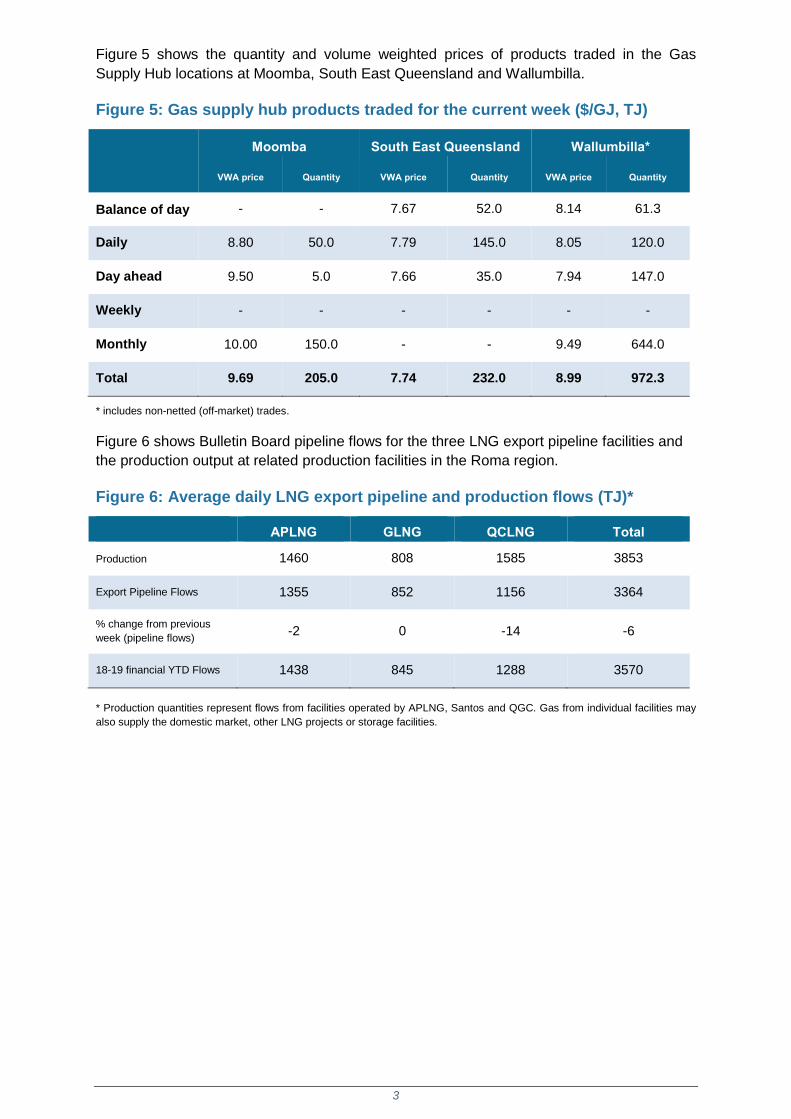
Figure 5 shows the quantity and volume weighted prices of products traded in the Gas
Supply Hub locations at Moomba, South East Queensland and Wallumbilla.
Figure 5: Gas supply hub products traded for the current week ($/GJ, TJ)
Moomba South East Queensland Wallumbilla*
VWA price Quantity VWA price Quantity VWA price Quantity
Balance of day - - 7.67 52.0 8.14 61.3
Daily 8.80 50.0 7.79 145.0 8.05 120.0
Day ahead 9.50 5.0 7.66 35.0 7.94 147.0
Weekly - - - - - -
Monthly 10.00 150.0 - - 9.49 644.0
Total 9.69 205.0 7.74 232.0 8.99 972.3
* includes non-netted (off-market) trades.
Figure 6 shows Bulletin Board pipeline flows for the three LNG export pipeline facilities and
the production output at related production facilities in the Roma region.
Figure 6: Average daily LNG export pipeline and production flows (TJ)*
APLNG GLNG QCLNG Total
Production 1460 808 1585 3853
Export Pipeline Flows 1355 852 1156 3364
% change from previous
week (pipeline flows) -2 0 -14 -6
18-19 financial YTD Flows 1438 845 1288 3570
* Production quantities represent flows from facilities operated by APLNG, Santos and QGC. Gas from individual facilities may
also supply the domestic market, other LNG projects or storage facilities.

4
Detailed market analysis
New Capacity Markets
The figures below show trading trends across the first 3 months of operation of the capacity
trading platform (CTP) and day ahead auction (DAA).
The Day Ahead Capacity Auction went live from 1 March. The platform continues to be used
to transport gas cheaply to the southern states, with most trades still occurring at $0/GJ.3
Auction activity so far has mainly shown a number of successful transactions to move gas
around Wallumbilla on the RBP, and on routes south from Wallumbilla towards Victoria and
New South Wales on the South West Queensland and Moomba to Sydney Pipelines. There
have been no trades on the Capacity Trading platform to-date.
Figure 7: DAA results by gas day4
Figure 8: Monthly quantities and trade trends in the DAA
Number of
participants
Number of
trades*
Capacity
traded (TJ)
Range of prices ($/GJ)
March 1 142 2548 98 per cent of trades at $0,
$0.01 - $0.10 for 3 other trades
April 2 132 1747 98 per cent of trades at $0,
$0.01 - $0.28 for 6 other trades
May 4 260 2853 89 per cent of trades at $0,
$0.02 - $0.70 for 33 other trades
* A trade is counted for each time an auction product is won on a day. For example if gas has been transported
from Queensland to Victoria this might involve four products – RBP, WCFA, SWQP, and MSP.
3 This represents the cost of capacity won through the auction. Additional cost pass through provisions also apply to
recoup administrative costs related to traded capacity. 4 Quantities shown are the sum of auction products allocated on the facilities and do not necessarily represent the
physical volumes of gas actually flowed for each gas day. Facilities included are the South West Queensland Pipeline
(SWQP), Moomba to Sydney Pipeline (MSP), Roma to Brisbane Pipeline (RBP) and Wallumbilla Compression
Facility A (WCFA).
0
20
40
60
80
100
120
140
160
2 M
ar
5 M
ar
8 M
ar
11 M
ar
14 M
ar
17 M
ar
20 M
ar
23 M
ar
26 M
ar
29 M
ar
1 A
pr
4 A
pr
7 A
pr
10 A
pr
13 A
pr
16 A
pr
19 A
pr
23 A
pr
27 A
pr
1 M
ay
4 M
ay
7 M
ay
10 M
ay
13 M
ay
16 M
ay
19 M
ay
22 M
ay
25 M
ay
28 M
ay
31 M
ay
3 J
un
6 J
un
9 J
un
12 J
un
Quantit
y (T
J)
SWQP MSP RBP WCFA WCFB EGP
5
Detailed Market Figures
1. Victorian Declared Wholesale Market
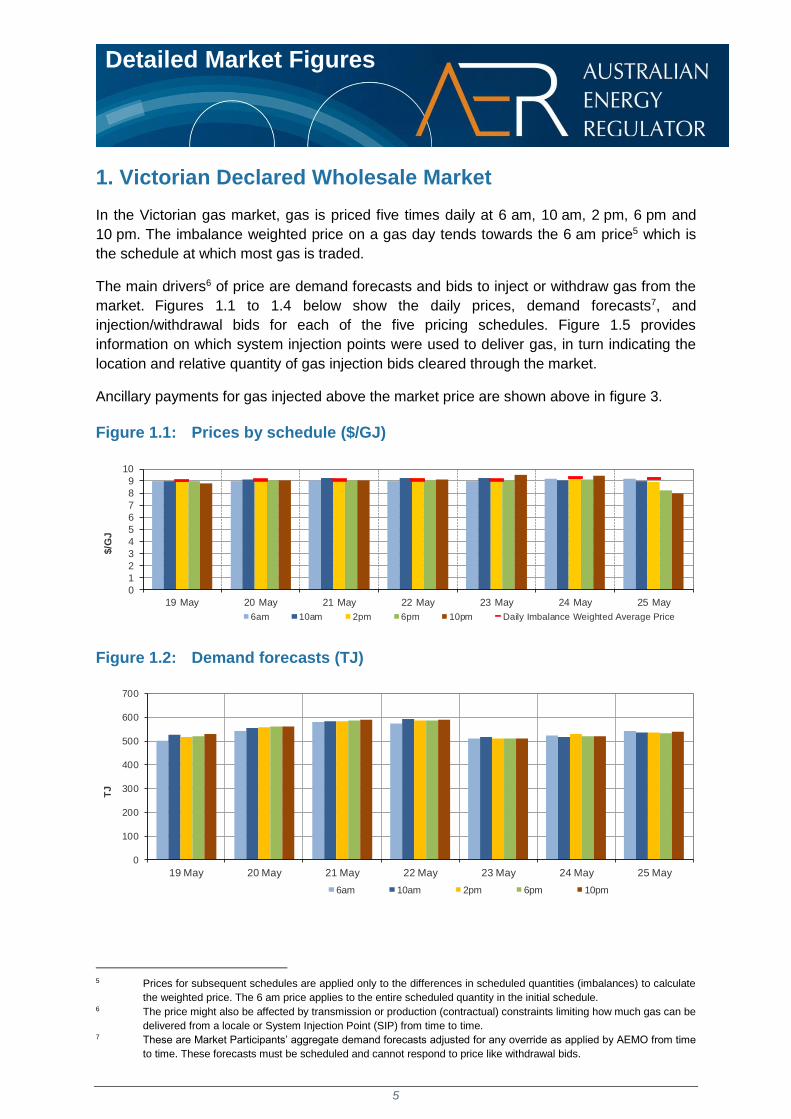
In the Victorian gas market, gas is priced five times daily at 6 am, 10 am, 2 pm, 6 pm and
10 pm. The imbalance weighted price on a gas day tends towards the 6 am price5 which is
the schedule at which most gas is traded.
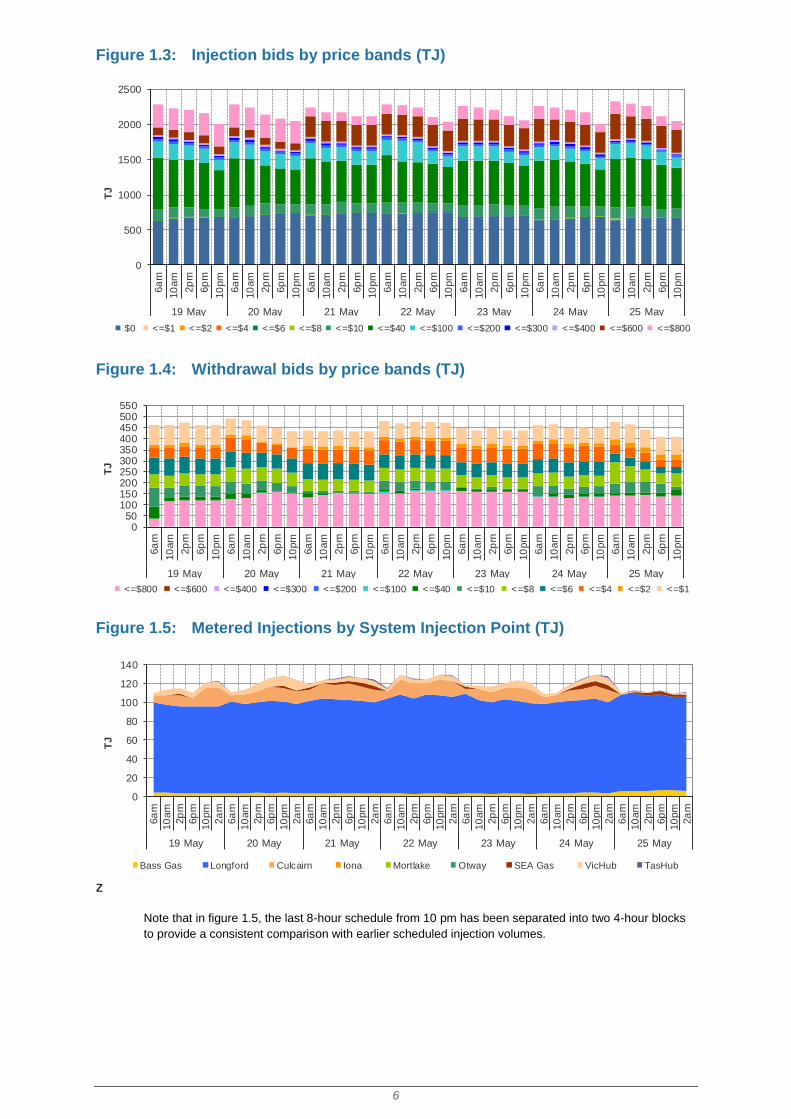
The main drivers6 of price are demand forecasts and bids to inject or withdraw gas from the
market. Figures 1.1 to 1.4 below show the daily prices, demand forecasts7, and
injection/withdrawal bids for each of the five pricing schedules. Figure 1.5 provides
information on which system injection points were used to deliver gas, in turn indicating the
location and relative quantity of gas injection bids cleared through the market.
Ancillary payments for gas injected above the market price are shown above in figure 3.
Figure 1.1: Prices by schedule ($/GJ)
Figure 1.2: Demand forecasts (TJ)
5 Prices for subsequent schedules are applied only to the differences in scheduled quantities (imbalances) to calculate
the weighted price. The 6 am price applies to the entire scheduled quantity in the initial schedule. 6 The price might also be affected by transmission or production (contractual) constraints limiting how much gas can be
delivered from a locale or System Injection Point (SIP) from time to time. 7 These are Market Participants’ aggregate demand forecasts adjusted for any override as applied by AEMO from time
to time. These forecasts must be scheduled and cannot respond to price like withdrawal bids.
0
1
2
3
4
5
6
7
8
9
10
19 May 20 May 21 May 22 May 23 May 24 May 25 May
$/G
J
6am 10am 2pm 6pm 10pm Daily Imbalance Weighted Average Price
0
100
200
300
400
500
600
700
19 May 20 May 21 May 22 May 23 May 24 May 25 May
TJ
6am 10am 2pm 6pm 10pm
6
Figure 1.3: Injection bids by price bands (TJ)
Figure 1.4: Withdrawal bids by price bands (TJ)
Figure 1.5: Metered Injections by System Injection Point (TJ)
z
Note that in figure 1.5, the last 8-hour schedule from 10 pm has been separated into two 4-hour blocks
to provide a consistent comparison with earlier scheduled injection volumes.
0
500
1000
1500
2000
2500
6a
m
10
am
2p
m
6p
m
10
pm
6a
m
10
am
2p
m
6p
m
10
pm
6a
m
10
am
2p
m
6p
m
10
pm
6a
m
10
am
2p
m
6p
m
10
pm
6a
m
10
am
2p
m
6p
m
10
pm
6a
m
10
am
2p
m
6p
m
10
pm
6a
m
10
am
2p
m
6p
m
10
pm
19 May 20 May 21 May 22 May 23 May 24 May 25 May
TJ
$0 <=$1 <=$2 <=$4 <=$6 <=$8 <=$10 <=$40 <=$100 <=$200 <=$300 <=$400 <=$600 <=$800
050
100150200250300350400450500550
6a
m
10
am
2p
m
6p
m
10
pm
6a
m
10
am
2p
m
6p
m
10
pm
6a
m
10
am
2p
m
6p
m
10
pm
6a
m
10
am
2p
m
6p
m
10
pm
6a
m
10
am
2p
m
6p
m
10
pm
6a
m
10
am
2p
m
6p
m
10
pm
6a
m
10
am
2p
m
6p
m
10
pm
19 May 20 May 21 May 22 May 23 May 24 May 25 May
TJ
<=$800 <=$600 <=$400 <=$300 <=$200 <=$100 <=$40 <=$10 <=$8 <=$6 <=$4 <=$2 <=$1
0
20
40
60
80
100
120
140
6a
m
10
am
2p
m
6p
m
10
pm
2a
m
6a
m
10
am
2p
m
6p
m
10
pm
2a
m
6a
m
10
am
2p
m
6p
m
10
pm
2a
m
6a
m
10
am
2p
m
6p
m
10
pm
2a
m
6a
m
10
am
2p
m
6p
m
10
pm
2a
m
6a
m
10
am
2p
m
6p
m
10
pm
2a
m
6a
m
10
am
2p
m
6p
m
10
pm
2a
m
19 May 20 May 21 May 22 May 23 May 24 May 25 May
TJ
Bass Gas Longford Culcairn Iona Mortlake Otway SEA Gas VicHub TasHub
7
2. Sydney STTM
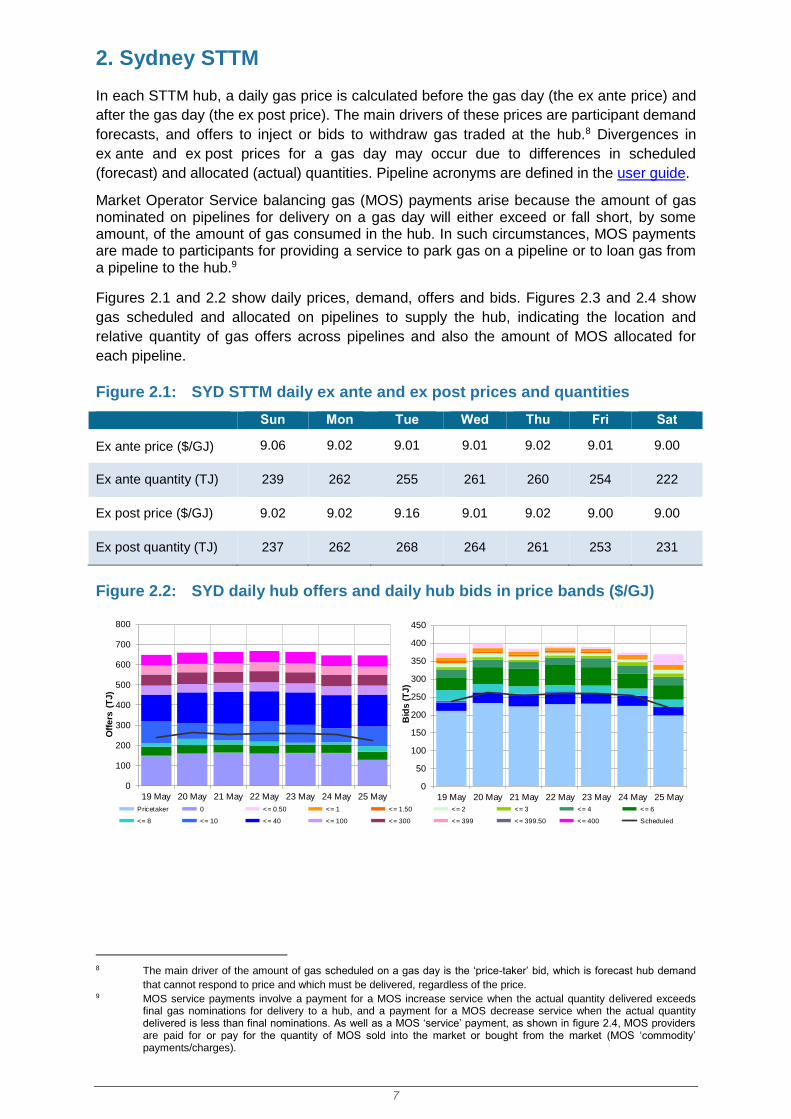
In each STTM hub, a daily gas price is calculated before the gas day (the ex ante price) and
after the gas day (the ex post price). The main drivers of these prices are participant demand
forecasts, and offers to inject or bids to withdraw gas traded at the hub.8 Divergences in
ex ante and ex post prices for a gas day may occur due to differences in scheduled
(forecast) and allocated (actual) quantities. Pipeline acronyms are defined in the user guide.
Market Operator Service balancing gas (MOS) payments arise because the amount of gas nominated on pipelines for delivery on a gas day will either exceed or fall short, by some amount, of the amount of gas consumed in the hub. In such circumstances, MOS payments are made to participants for providing a service to park gas on a pipeline or to loan gas from a pipeline to the hub.9
Figures 2.1 and 2.2 show daily prices, demand, offers and bids. Figures 2.3 and 2.4 show
gas scheduled and allocated on pipelines to supply the hub, indicating the location and
relative quantity of gas offers across pipelines and also the amount of MOS allocated for
each pipeline.
Figure 2.1: SYD STTM daily ex ante and ex post prices and quantities
Sun Mon Tue Wed Thu Fri Sat
Ex ante price ($/GJ) 9.06 9.02 9.01 9.01 9.02 9.01 9.00
Ex ante quantity (TJ) 239 262 255 261 260 254 222
Ex post price ($/GJ) 9.02 9.02 9.16 9.01 9.02 9.00 9.00
Ex post quantity (TJ) 237 262 268 264 261 253 231
Figure 2.2: SYD daily hub offers and daily hub bids in price bands ($/GJ)
8 The main driver of the amount of gas scheduled on a gas day is the ‘price-taker’ bid, which is forecast hub demand
that cannot respond to price and which must be delivered, regardless of the price. 9 MOS service payments involve a payment for a MOS increase service when the actual quantity delivered exceeds
final gas nominations for delivery to a hub, and a payment for a MOS decrease service when the actual quantity delivered is less than final nominations. As well as a MOS ‘service’ payment, as shown in figure 2.4, MOS providers are paid for or pay for the quantity of MOS sold into the market or bought from the market (MOS ‘commodity’ payments/charges).
0
50
100
150
200
250
300
350
400
450
19 May 20 May 21 May 22 May 23 May 24 May 25 May
Bid
s (
TJ
)
0
100
200
300
400
500
600
700
800
19 May 20 May 21 May 22 May 23 May 24 May 25 May
Off
ers
(T
J)
Pricetaker 0 <= 0.50 <= 1 <= 1.50 <= 2 <= 3 <= 4 <= 6
<= 8 <= 10 <= 40 <= 100 <= 300 <= 399 <= 399.50 <= 400 Scheduled

8
Figure 2.3: SYD net scheduled and allocated gas hub supply (excluding MOS)
Figure 2.4: SYD MOS allocations (TJ), service payments and commodity
payments/charges ($000)10
10 The commodity cost of MOS illustrated on the right of the figure represents the commodity quantity at the D+2
ex ante price. Commodity payments and charges for a given gas day relate to quantities traded two days earlier. That
is, the commodity cost for services provided on Sunday will appear in the chart for Tuesday, when the D+2 price is
set. In contrast, service payments are shown alongside the day they occurred.
0
50
100
150
200
250
300
Sched Alloc Sched Alloc Sched Alloc Sched Alloc Sched Alloc Sched Alloc Sched Alloc
19 May 20 May 21 May 22 May 23 May 24 May 25 May
TJ
EGP MSP ROS NGS
-60
-40
-20
0
20
40
60
19 May 20 May 21 May 22 May 23 May 24 May 25 May
TJ
EGP - Allocation MSP - Allocation
EGP - Decrease MSP - Decrease
EGP - Increase MSP - Increase
-$200
-$150
-$100
-$50
$0
$50
$100
19 May 20 May 21 May 22 May 23 May 24 May 25 May
MOS Service Payment MOS Commodity Payment MOS Commodity Charge

9
3. Adelaide STTM
The Adelaide STTM hub functions in the same way as the Sydney STTM hub. The same
data that was presented for the Sydney hub is presented for the Adelaide hub in the figures
below.
Figure 3.1: ADL STTM daily ex ante and ex post prices and quantities
Sun Mon Tue Wed Thu Fri Sat
Ex ante price ($/GJ) 9.77 9.84 10.12 10.12 10.07 10.00 9.91
Ex ante quantity (TJ) 46 61 62 63 63 59 57
Ex post price ($/GJ) 9.78 10.25 10.22 10.59 10.07 10.00 10.00
Ex post quantity (TJ) 49 66 65 70 63 58 60
Figure 3.2: ADL daily hub offers and daily hub bids in price bands ($/GJ)
Figure 3.3: ADL net scheduled and allocated gas hub supply (excluding MOS)
Figure 3.4: ADL MOS allocations (TJ), service payments and commodity
payments/charges ($000)
0
20
40
60
80
100
120
140
19 May 20 May 21 May 22 May 23 May 24 May 25 May
Bid
s (
TJ
)
0
50
100
150
200
250
300
19 May 20 May 21 May 22 May 23 May 24 May 25 May
Off
ers
(T
J)
Pricetaker 0 <= 0.50 <= 1 <= 1.50 <= 2 <= 3 <= 4 <= 6
<= 8 <= 10 <= 40 <= 100 <= 300 <= 399 <= 399.50 <= 400 Scheduled
0
20
40
60
80
Sched Alloc Sched Alloc Sched Alloc Sched Alloc Sched Alloc Sched Alloc Sched Alloc
19 May 20 May 21 May 22 May 23 May 24 May 25 May
TJ
MAP SEAGAS
-50
-40
-30
-20
-10
0
10
20
30
40
50
19 May 20 May 21 May 22 May 23 May 24 May 25 May
TJ
MAP - Allocation SEAGAS - Allocation
MAP - Decrease SEAGAS - Decrease
MAP - Increase SEAGAS - Increase
-$60
-$50
-$40
-$30
-$20
-$10
$0
19 May 20 May 21 May 22 May 23 May 24 May 25 May
MOS Service Payment MOS Commodity Payment MOS Commodity Charge

10
4. Brisbane STTM
The Brisbane STTM hub functions in the same way as the Sydney STTM hub. The same
data that was presented for the Sydney hub is presented for the Brisbane hub in the figures
below.
Figure 4.1: BRI STTM daily ex ante and ex post prices and quantities
Sun Mon Tue Wed Thu Fri Sat
Ex ante price ($/GJ) 8.25 8.35 8.15 8.10 8.14 8.25 8.11
Ex ante quantity (TJ) 75 91 90 90 90 91 73
Ex post price ($/GJ) 8.40 8.35 8.27 8.33 8.26 8.25 8.39
Ex post quantity (TJ) 80 95 95 94 94 88 78
Figure 4.2: BRI daily hub offers and daily hub bids in price bands ($/GJ)
Figure 4.3: BRI net scheduled and allocated gas hub supply (excluding MOS)
Figure 4.4: BRI MOS allocations (TJ), service payments and commodity
payments/charges ($000)
0
20
40
60
80
100
120
140
19 May 20 May 21 May 22 May 23 May 24 May 25 May
Bid
s (
TJ
)
0
50
100
150
200
250
19 May 20 May 21 May 22 May 23 May 24 May 25 May
Off
ers
(T
J)
Pricetaker 0 <= 0.50 <= 1 <= 1.50 <= 2 <= 3 <= 4 <= 6
<= 8 <= 10 <= 40 <= 100 <= 300 <= 399 <= 399.50 <= 400 Scheduled
0
20
40
60
80
100
Sched Alloc Sched Alloc Sched Alloc Sched Alloc Sched Alloc Sched Alloc Sched Alloc
19 May 20 May 21 May 22 May 23 May 24 May 25 May
TJ
RBP
-40
-30
-20
-10
0
10
20
30
19 May 20 May 21 May 22 May 23 May 24 May 25 May
TJ
RBP - Allocation RBP - Decrease RBP - Increase
-$15
-$10
-$5
$0
$5
$10
19 May 20 May 21 May 22 May 23 May 24 May 25 May
MOS Service Payment MOS Commodity Payment MOS Commodity Charge

11
5. National Gas Bulletin Board
Figure 5.1 shows average daily actual flows for the current week11 from the Bulletin Board
(changes from the previous week’s average are shown in brackets). Average daily prices12
are provided for gas markets and gas supply hubs. Average daily quantities are provided for
gas powered generation for each region.
Figure 5.1: Gas market data ($/GJ, TJ); Bulletin Board flows (TJ)13
11 Domestic gas flows are calculated as the total of: SA = MAP + SEAGAS; VIC = SWP + LMP + (flows towards
Victoria on the ‘NSW-VIC interconnect’); NSW/ACT = EGP + MSP; TAS = TGP; QLD (Brisbane) = RBP;
QLD (Mt Isa) = CGP; and QLD (Gladstone) = QGP.
Export gas flows are calculated as the total of: the APLNG pipeline; the GLNG pipeline; and the Wallumbilla to
Gladstone pipeline.
GPG volumes may include gas usage that does not show up on Bulletin Board pipeline flows.
12 GSH supply is the average daily volume of gas ‘traded’, while price is a volume weighted average. Optional hub
services (for compression and redirection) are shown separately from commodity trades.
13 Net flows are shown for Bulletin Board facilities, as outlined in the user guide.

12
6. Gas Supply Hub
The gas supply hub was established at Wallumbilla in March 2014 to facilitate the voluntary
trading of gas between participants, with products listed for sale and purchase at delivery
points on three major connecting pipelines. There are separate products for each trading
location and delivery period (daily, day-ahead, balance-of-day, weekly and monthly
products).14
The Moomba hub commenced operation from June 2016 to further facilitate trading on the
MAP and MSP, with trading between the two hubs on the SWQP via a spread product
(representing the price differential between the hubs). From October 2016, the addition of a
Wallumbilla Compression Product was introduced to facilitate the supply hub’s transition
from three different trading locations into one. From March 2017, Wallumbilla transitioned
into an optional hub services model, replacing the three trading locations (QGP, SWQP and
RBP) with a single product at Wallumbilla (WAL) and an in-pipe RBP trading location at
South East Queensland (SEQ).
This week there were 114 trades for 1409 TJ of gas at a volume weighted price of $8.89/GJ.
The high trade quantity was driven by a number of monthly trades, mostly conducted off
market (6 at WAL totalling 644 TJ and 1 on the MSP for 150 TJ), with the price of non-
monthly product trades lower at $7.99/GJ. The total traded quantity consisted of 58 trades at
WAL (972.3 TJ at $8.99/GJ), 44 trades at SEQ (232 TJ at $7.74/GJ) and 12 trades at MOO
(205 TJ at $9.69), with the volume weighted prices at WAL and MOO driven up $0.98/GJ
and $0.83/GJ respectively due to the large quantity traded in the monthly products. There
were 6 spread trades.
Figure 6.1 shows the quantity of gas traded by product type for each trading day on pipeline
trading locations in the Wallumbilla and Moomba Gas Supply Hubs.15
Figure 6.1: GSH traded quantities
Australian Energy Regulator
June 2019
14 Additional information on trading locations and available products is detailed in the user guide.
15 Non-netted (off-market) trades, allowing the selection of specific delivery point at a trading location, are included with
other Wallumbilla trades (WAL*).
0
100
200
300
400
500
600W
AL
*
MO
O
SE
Q
WA
L*
MO
O
SE
Q
WA
L*
MO
O
SE
Q
WA
L*
MO
O
SE
Q
WA
L*
MO
O
SE
Q
WA
L*
MO
O
SE
Q
WA
L*
MO
O
SE
Q
19 May 20 May 21 May 22 May 23 May 24 May 25 May
Vo
lum
e T
rad
ed
(T
J)
Balance of day Daily Day ahead Monthly Weekly