gas hydraulics
TRANSCRIPT
Gas pipeline hydraulics calculations 314Equivalent lengths for multiple lines based on Panhandle A 315Determine pressure loss for a low-pressure gas system 316Nomograph for determining pipe-equivalent factors.... 317How much gas is contained in a given line section? 318How to estimate equivalent length factors for gas lines 318Estimating comparative capacities of gas pipelines 319Determination of leakage from gas line using
pressure drop method 319A quick way to determine the size of gas gathering lines 320Energy conversion data for estimating 320How to estimate time required to get a shut-in test
on gas transmission lines and approximate amaximum acceptable pressure loss for new lines 321
How to determine the relationship of capacity increaseto investment increase 321
Estimate pipe size requirements for increasing throughputvolumes of natural gas 322
Calculate line loss using cross-sectional areas table whentesting mains with air or gas 323
Flow of fuel gases in pipelines 324Calculate the velocity of gas in a pipeline 325Determining throat pressure in a blow-down system 325Estimate the amount of gas blown off through a line puncture 326A practical way to calculate gas flow for pipelines 326How to calculate the weight of gas in a pipeline 327Estimate average pressure in gas pipeline using upstream and
downstream pressures 327Chart for determining viscosity of natural gas 328Flow of gas 328Multiphase flow 332Nomograph for calculating Reynolds number for compressible
flow friction factor for clean steel and wrought iron pipe 337
11: Gas—Hydraulics
Gas pipeline hydraulics calculations
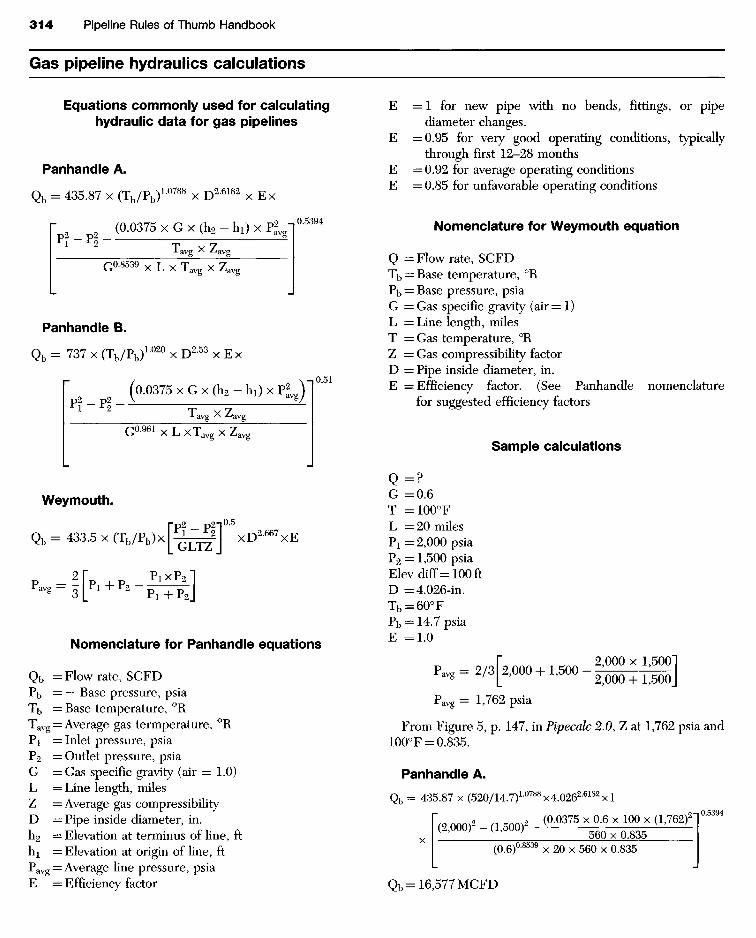
Equations commonly used for calculatinghydraulic data for gas pipelines
Panhandle A.
Qb = 435.87 x (Tb/Pb)L0788 x D2'6182 x Ex
r ( O . C B 7 5 x G x ( h 2 - h 1 ) x P g ^ | °5394
1 2 T x 7x avg ^ ^avg
vj ' X L X 1 avg X Zjavg
Panhandle B.
Qb = 737 x (Tb/Pb)L020 x D2-53 x Ex
(0.0375XGx(K 2-K 1)XP 2 )p2 p2 J fv_
1 2 T x 7xavg ^ z-'avg
VJT ' X L X l ayg X ZjQya
Weymouth.
rp2 _ p2-]0-5
Qb = 433.5 x (T b /P b )x [ -^^J xD2667xE
Nomenclature for Panhandle equations
Qb = Flow rate, SCFDPb = — Base pressure, psiaTb = Base temperature, 0RTavg = Average gas termperature, 0RPi = Inlet pressure, psiaP2 = Outlet pressure, psiaG = Gas specific gravity (air = 1.0)L = Line length, milesZ = Average gas compressibilityD = Pipe inside diameter, in.h2 = Elevation at terminus of line, fthi = Elevation at origin of line, ftPavg = Average line pressure, psiaE = Efficiency factor
E = 1 for new pipe with no bends, fittings, or pipediameter changes.
E =0.95 for very good operating conditions, typicallythrough first 12-28 months
E =0.92 for average operating conditionsE =0.85 for unfavorable operating conditions
Nomenclature for Weymouth equation
Q = Flow rate, SCFDTb = Base temperature, 0RPb = Base pressure, psiaG = Gas specific gravity (air = 1)L = Line length, milesT = Gas temperature, 0RZ = Gas compressibility factorD = Pipe inside diameter, in.E = Efficiency factor. (See Panhandle nomenclature
for suggested efficiency factors
Sample calculations
Q = ?G =0.6T =100°FL = 20 milesP1 =2,000 psiaP2 = 1,500 psiaElevdiff= 100 ftD =4.026-in.Tb = 600FPb = 14.7 psiaE =1.0
Pavg = 1,762 psia
From Figure 5, p. 147, in Pipecalc 2.0, Z at 1,762 psia and1000F = 0.835.
Panhandle A.
Weymouth.
Q = 0.433 x (520/14.7) x [(2,00O)2-
(l,500)2/(0.6 x 20 x 560 x 0.835)]1/2 x (4.026)2667
Q = Il5IOl MCFD
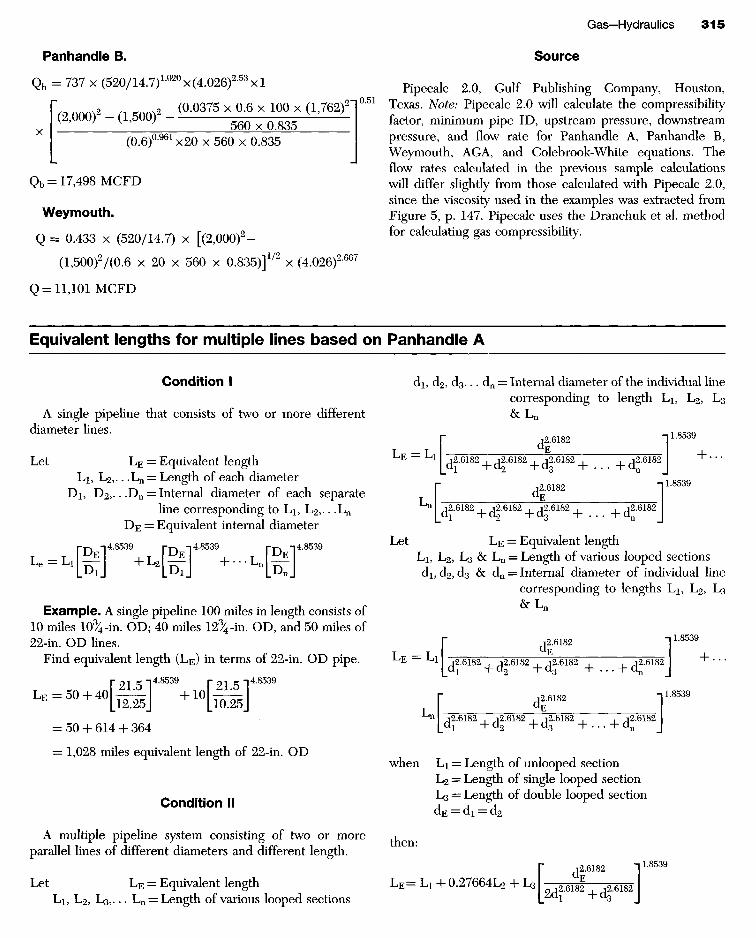
Equivalent lengths for multiple lines based on Panhandle A
Condition I
A single pipeline that consists of two or more differentdiameter lines.
Let LE = Equivalent lengthL1, L2,.. .Ln = Length of each diameter
D1, D2,.. .Dn = Internal diameter of each separateline corresponding to L1, L2,.. .Ln
D E = Equivalent internal diameter
r-y, -,4.8539 f r | -i4.8539 r-y, -i 4.8539
Example. A single pipeline 100 miles in length consists of10 miles 1034-in. OD; 40 miles 12% -in. OD, and 50 miles of22-in. OD lines.
Find equivalent length (LE) in terms of 22-in. OD pipe.
r 2 1 5 -.4.8539 F 21.5"I48539LE=50+40hd + 1 0 M= 50 + 614 + 364
= 1,028 miles equivalent length of 22-in. OD
Condition Il
A multiple pipeline system consisting of two or moreparallel lines of different diameters and different length.
Let LE = Equivalent lengthL1, L2, L3 , . . . Ln = Length of various looped sections
Source
Pipecalc 2.0, Gulf Publishing Company, Houston,Texas. Note: Pipecalc 2.0 will calculate the compressibilityfactor, minimum pipe ID, upstream pressure, downstreampressure, and flow rate for Panhandle A, Panhandle B,Weymouth, AGA, and Colebrook-White equations. Theflow rates calculated in the previous sample calculationswill differ slightly from those calculated with Pipecalc 2.0,since the viscosity used in the examples was extracted fromFigure 5, p. 147. Pipecalc uses the Dranchuk et al. methodfor calculating gas compressibility.
Panhandle B.
di, d2, d3... dn = Internal diameter of the individual linecorresponding to length L1, L2, L3
& L n
Let LE = Equivalent lengthL1, L2, L3 & Ln = Length of various looped sectionsdi, d2, d3 & dn = Internal diameter of individual line
corresponding to lengths L1, L2, L3
& L n
when L1 = Length of unlooped sectionL2 = Length of single looped sectionL3 = Length of double looped sectiondE = di = d2
then:
when dE = di = d2 = d3
then LE = L1 + 0.27664L2 H- 0.1305L3
Example. A multiple system consisting of a 15-milesection of 3 -8^ -in. OD lines and 1-10% -in. OD line, and a30-mile section of 2-8/^-in. lines and 1-10% -in. OD line.
Find the equivalent length in terms of single 12-in. ID line.
= 5.9 + 18.1= 24.0 miles equivalent of 12-in. ID pipe
Example. A multiple system consisting of a single 12-in.ID line 5 miles in length and a 30-mile section of 3-12-in. IDlines.
Find equivalent length in terms of a single 12-in. ID line.
LE = 5 + 0 . 1 3 0 5 X 3 0
= 8.92 miles equivalent of single 12-in. ID line
Determine pressure loss for a low-pressure gas system
Use the Spitzglass equation for systems operating at lessthan 1 psig.
O 2 550 / A h w d 5
V h - - V ^ y SgL(l+(3.6/d)+0.03d)
where: Qh = Rate of flow, in cubic feet per hour at standardconditions (14.7psia and 600F), scfh
hw = Static pressure head, in inches of waterSg = Specific gravity of gas relative to air = the ratio
of the molecular weight of the gas to that of aird = Internal diameter of the pipe, inchesL = Length of the pipe, feet
Example. Given the following conditions, find the flowin the system:
hw = 50 in. of waterSg = 0.65L = 500ftd = 6.187 in.
Nomograph for determining pipe-equivalent factors
Con
vers
ion
Fac
tor
E*omp/e N0. ?
Inte
rnal
D
iam
eter
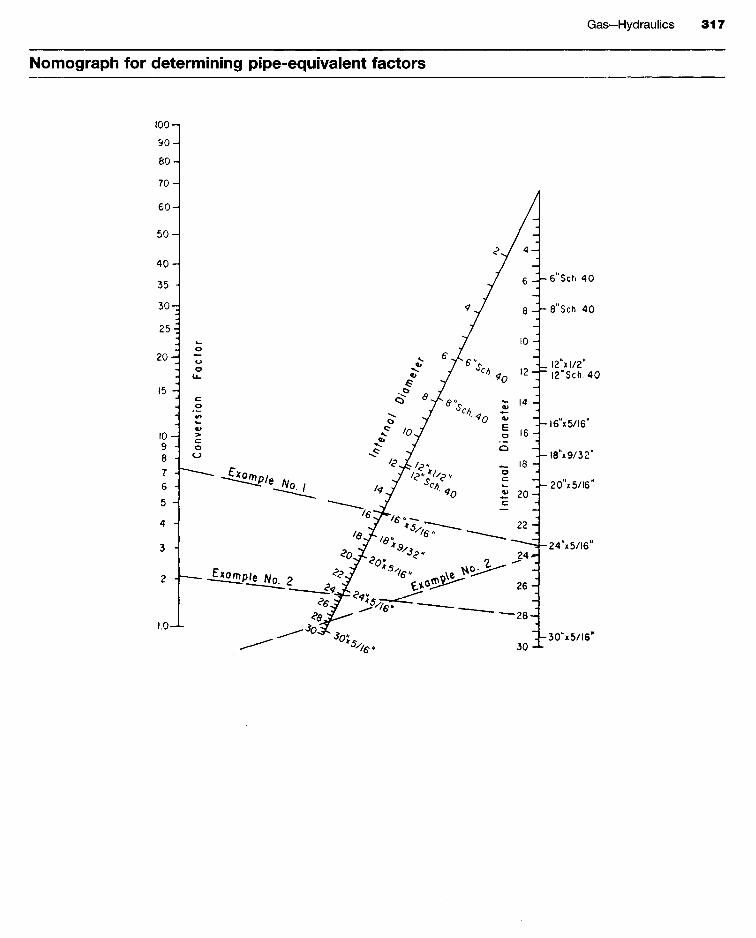
For turbulent flow, this handy nomograph will save a greatdeal of time in flow calculations where different sizes of pipeare connected. The advantage over a table of values is inhaving all sizes of pipe expressed in relation to any other size.
Example 1. 16-in. x 5Z16An. in terms of 24-in. x 5Z16-in.
Example 2. Reciprocal values can be found when chartlimits are exceeded. 28-in. ID in terms of 24-in. ID fallsbeyond the lower limits of the chart; however, 24-in. ID interms of 28-in. ID gives a conversion factor of 2.1.
How much gas is contained in a given line section?
Multiply the square of the inside diameter, in inches, bythe gauge pressure, in lb/in.2; multiply this by 0.372; theanswer is the approximate number of cubic ft of gas(standard conditions) in 1,000 ft of line.
Example. How much gas in 1,000 ft of 16-in. schedule 30pipe at 350-lb pressure?
15.25 x 15.25 x 350 x 0.372 = 30,280 cu. ft of gas
Example. Approximately how much gas in 8 miles of .250wall 24-in. pipe if the pressure is 400 psi?
Cubic ft = (23.5)(23.5)(400)(8)(5.28)(0.372)= 3,470,000 cu. ft
When a section of line is blown down from one pressure toanother, the total gas lost may be computed by the differencein the contents at the two pressures, using the above rule.
How to estimate equivalent length factors for gas lines
Internal
Diameter
Nominal
Diameter
36"
35.250
34"
33.250
30"
29.375
26"
25.375
24"
23.375
24"
23.000
22"
21.500
20"
19.500
18"
17.500
16"
15.50012V
12.250
10% "
10.250
8%"
8.125
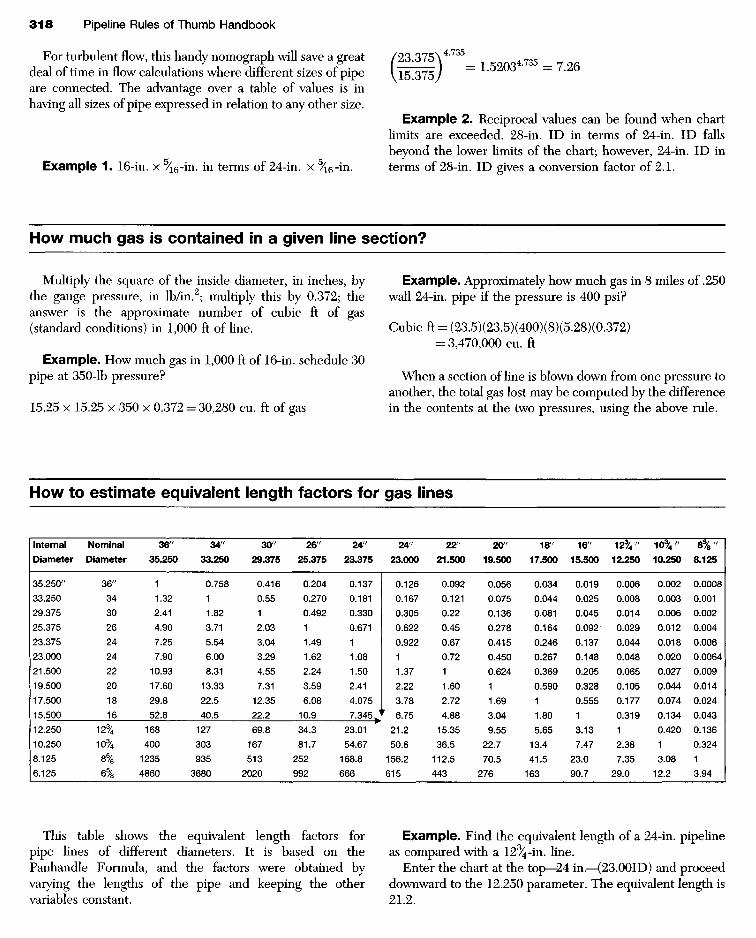
This table shows the equivalent length factors forpipe lines of different diameters. It is based on thePanhandle Formula, and the factors were obtained byvarying the lengths of the pipe and keeping the othervariables constant.
Example. Find the equivalent length of a 24-in. pipelineas compared with a 12% -in. line.
Enter the chart at the top—24 in.—{23.00ID) and proceeddownward to the 12.250 parameter. The equivalent length is21.2.
This means that under the same conditions of tempera-tures, pressures, specific gravities, etc., 1 mile of 12/4-in.pipe will flow the same amount of gas that 21.2 miles of 24-in. pipe will flow. Another way of putting it, the pressure dropin 1 mile of 24-in. pipe will be the same as that in .048 milesof 12/4-in. pipe if the pressures, volumes, etc., are the same.
Where a line is composed of several sizes of pipediameters or where the lines are looped, this chart shouldprove useful. In solving problems of this sort, the line isreduced to an equivalent length of some arbitrarily selectedsize pipe and treated as a single line of uniform size.
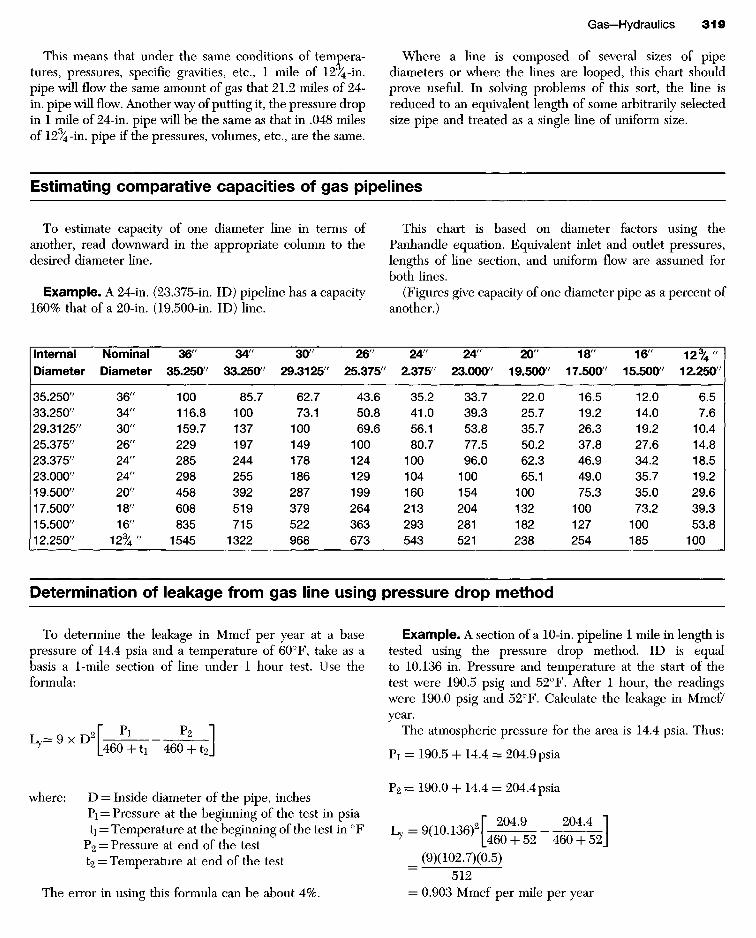
Estimating comparative capacities of gas pipelines
To estimate capacity of one diameter line in terms ofanother, read downward in the appropriate column to thedesired diameter line.
Example. A 24-in. (23.375-in. ID) pipeline has a capacity160% that of a 20-in. (19.500-in. ID) line.
This chart is based on diameter factors using thePanhandle equation. Equivalent inlet and outlet pressures,lengths of line section, and uniform flow are assumed forboth lines.
(Figures give capacity of one diameter pipe as a percent ofanother.)
InternalDiameter
NominalDiameter
Determination of leakage from gas line using pressure drop method
To determine the leakage in Mmcf per year at a basepressure of 14.4 psia and a temperature of 6O0F, take as abasis a 1-mile section of line under 1 hour test. Use theformula:
where: D = Inside diameter of the pipe, inchesPi = Pressure at the beginning of the test in psiati = Temperature at the beginning of the test in 0F
P2 = Pressure at end of the testt2 = Temperature at end of the test
The error in using this formula can be about 4%.
Example. A section of a 10-in. pipeline 1 mile in length istested using the pressure drop method. ID is equalto 10.136 in. Pressure and temperature at the start of thetest were 190.5 psig and 52°F. After 1 hour, the readingswere 190.0 psig and 52°F. Calculate the leakage in Mmcf/year.
The atmospheric pressure for the area is 14.4 psia. Thus:
= 0.903 Mmcf per mile per year
Here is a shortcut to estimate gas flow in gatheringlines. For small gathering lines, the answer will be within10% of that obtained by more difficult and more accurateformulas.
_ (500) (d 3 )^ -P lQ " V L
where: Q = Cubic ft of gas per 24 hoursd = Pipe ID in in.
Pi —Psi (abs) at starting pointP2 = Psi (abs) at ending pointL = Length of line in miles
Example. How much gas would flow through four milesof 6-in. ID pipe if the pressure at the starting point is 485 psiand if the pressure at the downstream terminus is 285 psi?
Answer.
(500)(63)y/(485 + 15)2 - (285 + 15)2
Energy conversion data for estimating
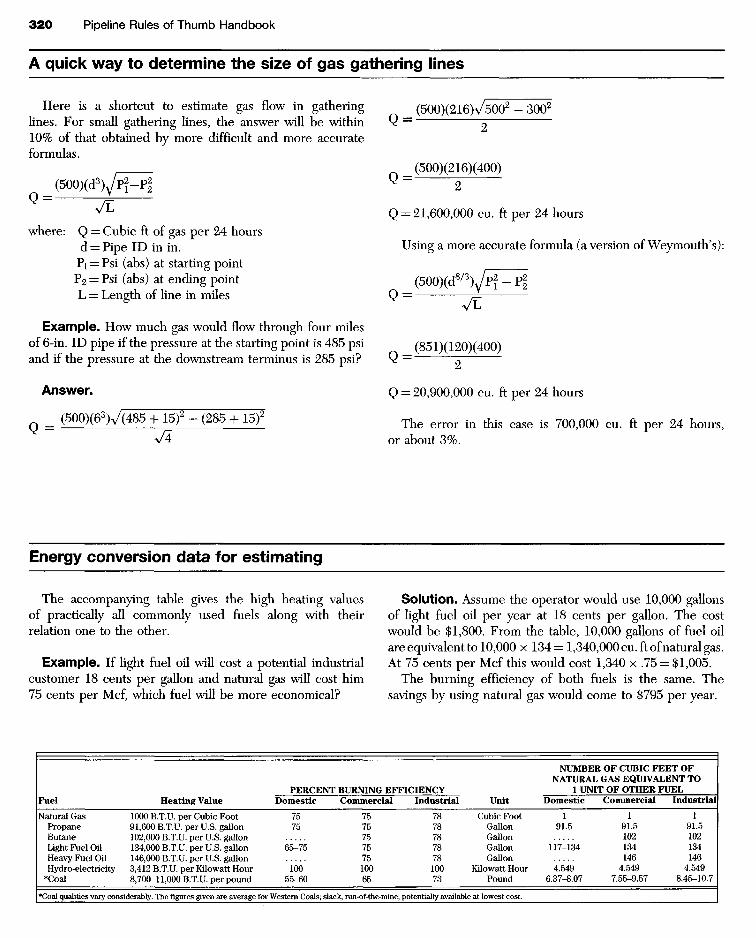
The accompanying table gives the high heating valuesof practically all commonly used fuels along with theirrelation one to the other.
Example. If light fuel oil will cost a potential industrialcustomer 18 cents per gallon and natural gas will cost him75 cents per Mcf, which fuel will be more economical?
Solution. Assume the operator would use 10,000 gallonsof light fuel oil per year at 18 cents per gallon. The costwould be $1,800. From the table, 10,000 gallons of fuel oilare equivalent to 10,000 x 134 = 1,340,000 cu. ft of natural gas.At 75 cents per Mcf this would cost 1,340 x .75 = $1,005.
The burning efficiency of both fuels is the same. Thesavings by using natural gas would come to $795 per year.
A quick way to determine the size of gas gathering lines
Using a more accurate formula (a version of Weymouth's):
The error in this case is 700,000 cu. ft per 24 hours,or about 3%.
Fuel
Natural GasPropaneButaneLight Fuel OilHeavy Fuel OilHydro-electricity
*Coal
Heating Value
1000 B.T.U. per Cubic Foot91,600 B.T.U. per U.S. gallon102,000 B.T.U. per U.S. gallon134,000 B.T.U. per U.S. gallon146,000 B.T.U. per U.S. gallon3,412 B.T.U. per Kilowatt Hour8,700-11,000 B.T.U. per pound
PERCENDomestic
7575
65-75
10055-60
[T BURNING EFFKCommercial
757575757510065
:IENCYIndustrial
787878787810073
Unit
Cubic FootGallonGallonGallonGallon
Kilowatt HourPound
*Coal qualities vary considerably. The figures given are average for Western Coals; slack, run-of-the-mine; potentially available at lowest cost.
NUMBER OF CUBIC FEET OFNATURAL GAS EQUIVALENT TO
1 UNIT OF OTHER FUELDomestic Commercial Industrial
1 1 191.5 91.5 91.5
102 102117-134 134 134
146 1464.549 4.549 4.549
6.37-8.07 7.55-9.57 8.45-10.7

These two rules may prove helpful for air or gas testingof gas transmission lines. They are not applicable forhydrostatic tests. Values of the constants used by differenttransmission companies may vary with economic considera-tions, line conditions, and throughputs.
To determine the minimum time required to achievea good shut-in test after the line has been charged andbecomes stabilized, use the following formula:
3 x D2xLH 1 n - -
where: Hm = Minimum time necessary to achieve anaccurate test in hours
D = Internal diameter of pipe in inchesL = Length of section under test in miles
Pi = Initial test pressure in lb/in.2 gauge
Example. How long should a 14-mile section of 26-in.(25.375-in. ID) pipeline be shut in under a 1,050 psi testpressure to get a good test?
When a new line is being shut in for a test of this durationor longer, the following formula may be used to evaluatewhether or not the line is "tight":
P d - H * x P iad D x 949
where: Pacj = Acceptable pressure drop in lb/in.2 gaugeHt = Shut-in test time in hoursD = Internal diameter of pipe in in.Pj = Initial test pressure in lb/in.2 gague
Example. What would be the maximum acceptablepressure drop for a new gas transmission line under air orgas test when a 44-mile section of 30-in. (29.250-in. ID)pipeline has been shut in for 100 hours at an initial pressureof 1,100 psig?
100 x 1,100 2P ^ 2 9 . 2 5 0 x 9 4 9 = 4 l b / i n -
If the observed pressure drop after stabilization is less than4 psig, the section of line would be considered "tight."
Note: Corrections must he made for the effect of temperature variationsupon pressure during the test.
How to estimate time required to get a shut-in test on gas transmission lines andapproximate a maximum acceptable pressure loss for new lines
= 25.75 hours or 25 hours and 45 minutes
How to determine the relationship of capacity increase to investment increase
Example. Determine the relationship of capacity increaseto investment increase when increasing pipe diameter, whilekeeping the factors P(in), P(out), and L constant.
Solution. The top number in each square represents thepercent increase in capacity when increasing the pipe sizefrom that size shown in the column at the left to the sizeshown by the column at the bottom of the graph. The lowernumbers represent the percent increase in investment of thebottom size over the original pipe size. All numbers arebased on pipe capable of 1,000 psi working pressure.
Top Number represents 7* Increase in capacity when increasingpipe size from ait* on left to size of bottom
Lower Number represents V* increase In Investment for pipe sizeof bottom over pipe size ot left.
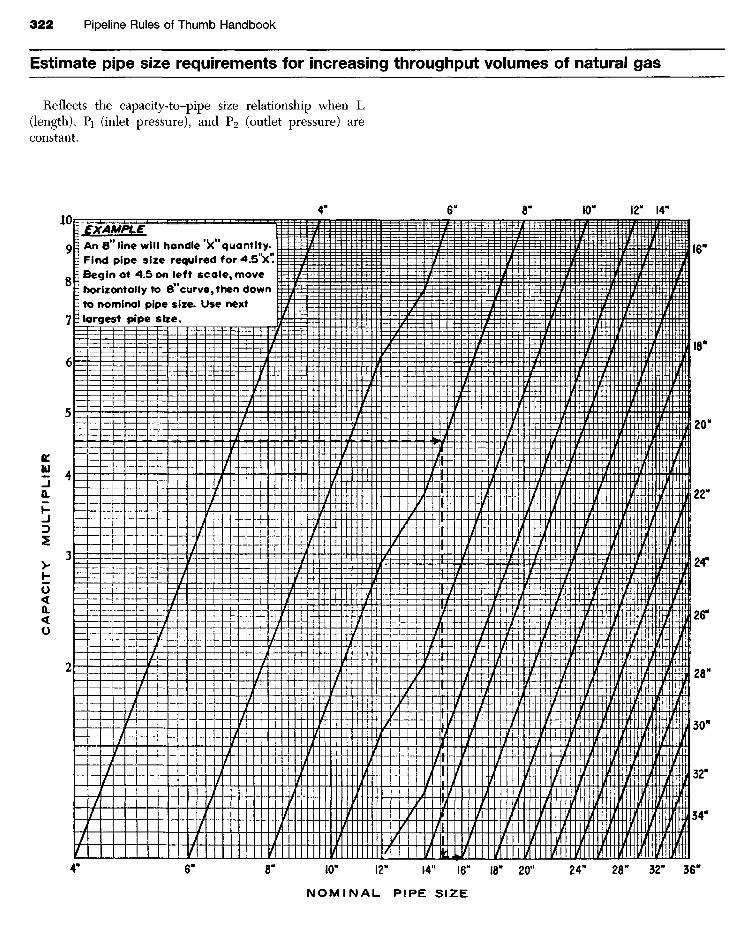
Reflects the capacity-to-pipe size relationship when L(length), Pi (inlet pressure), and P2 (outlet pressure) areconstant.
Estimate pipe size requirements for increasing throughput volumes of natural gas
EXAMPLEAn 8" line will handle Vquan t i t y .Find pipe size required for 4.5"x"Begin at 4.5 on left scale, movehorizontally to 8"curve,then downto nominal pipe size. Use nextlargest pipe size.
CA
PA
CIT
Y
MU
LT
IPL
IER
NOMINAL PIPE SIZE
p.Initial volume = — (AL)
PB
Final volume = — (AL)
where: P1 = Initial pressure, or pressure at start of test, psiaPf = Final pressure, or pressure at end of test, psia
PB = Base pressure, psiaA = Cross-sectional area of inside of pipe in ft2
L = Length of line in ft
The loss then would be the difference of the volumes,found by the above formula, which could be written:
Loss during test = AL—PB
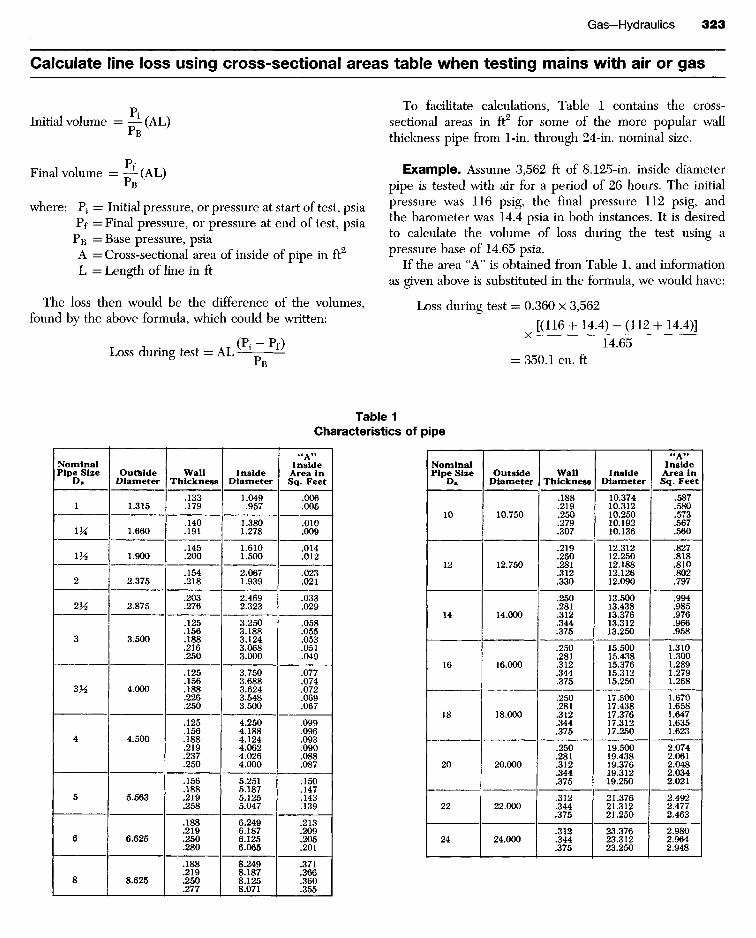
To facilitate calculations, Table 1 contains the cross -sectional areas in ft2 for some of the more popular wallthickness pipe from 1-in. through 24-in. nominal size.
Example. Assume 3,562 ft of 8.125-in. inside diameterpipe is tested with air for a period of 26 hours. The initialpressure was 116 psig, the final pressure 112 psig, andthe barometer was 14.4 psia in both instances. It is desiredto calculate the volume of loss during the test using apressure base of 14.65 psia.
If the area "A" is obtained from Table 1, and informationas given above is substituted in the formula, we would have:
Loss during test
Calculate line loss using cross-sectional areas table when testing mains with air or gas
Table 1Characteristics of pipe
NominalPipe Size
DnOutfeide
DiameterWall
ThicknessInside
Diameter
"A"Inside
Area inSq. Feet
NominalPipe Size
Dn
OutsideDiameter
WallThickness
InsideDiameter
44A"Inside
Area inSq. Feet
D. S. Davis, Special Projects, Inc., Bailey Island, Maine
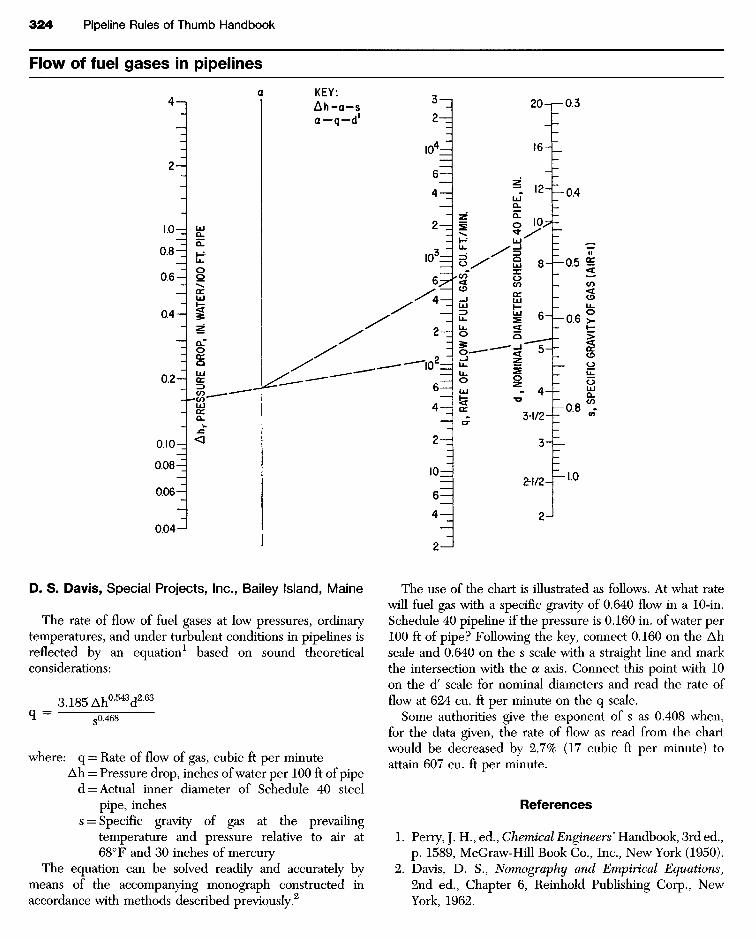
The rate of flow of fuel gases at low pressures, ordinarytemperatures, and under turbulent conditions in pipelines isreflected by an equation1 based on sound theoreticalconsiderations:
_ 3.185 Aha543d2-63
0I ~~ s0.468
where: q = Rate of flow of gas, cubic ft per minuteAh = Pressure drop, inches of water per 100 ft of pipe
d = Actual inner diameter of Schedule 40 steelpipe, inches
s = Specific gravity of gas at the prevailingtemperature and pressure relative to air at68° F and 30 inches of mercury
The equation can be solved readily and accurately bymeans of the accompanying monograph constructed inaccordance with methods described previously.2
The use of the chart is illustrated as follows. At what ratewill fuel gas with a specific gravity of 0.640 flow in a 10-in.Schedule 40 pipeline if the pressure is 0.160 in. of water per100 ft of pipe? Following the key, connect 0.160 on the Ahscale and 0.640 on the s scale with a straight line and markthe intersection with the a axis. Connect this point with 10on the d' scale for nominal diameters and read the rate offlow at 624 cu. ft per minute on the q scale.
Some authorities give the exponent of s as 0.408 when,for the data given, the rate of flow as read from the chartwould be decreased by 2.7% (17 cubic ft per minute) toattain 607 cu. ft per minute.
References
1. Perry, J. H., ed., Chemical Engineers' Handbook, 3rd ed.,p. 1589, McGraw-Hill Book Co., Inc., New York (1950).
2. Davis, D. S., Nomography and Empirical Equations,2nd ed., Chapter 6, Reinhold Publishing Corp., NewYork, 1962.
Flow of fuel gases in pipelines
PRES
SURE
DRO
P, I
N. W
ATER
/100
FT.
PIP
E
q, R
ATE
OF F
LOW
OF
FUEL
GAS
, CU.
FT/
MIN
.
d . N
OMIN
AL D
IAM
ETER
SCH
EDUL
E 40
PIP
E. IN
.
s, S
PECI
FIC
GRA
VITY
OF
GAS
(AIR
= I)
KEY:
Calculate the velocity of gas in a pipeline
1440ZQTd2P
where: V = Velocity of gas, ft/secZ = CompressibilityQ = Volume, million cu. ft/hr at standard conditionsT = Operating temperature, 0Rd = Inside diameter of pipe, inchesP = Operating pressure, psia
Example.Q = 5 MMCFHT = 600Fd = 15.5 in.
P = 500psig (514.7 psia)Z = 0.94 (from compressibility chart)T = 5200R
_ 1440 x 0.94 x 5 x 520240.25 x 514.7
V = 28 ft/secConsideration should be given to acceptable noise levels
(60 to 80 ft/sec) and erosion, especially where the gas maycontain solid particles. Refer to API RP 14E for erosion andcorrosion considerations. If the gas contains liquids, theminimum velocity should be limited to about 10 ft/sec tohelp sweep liquids from the pipe and prevent slugging.
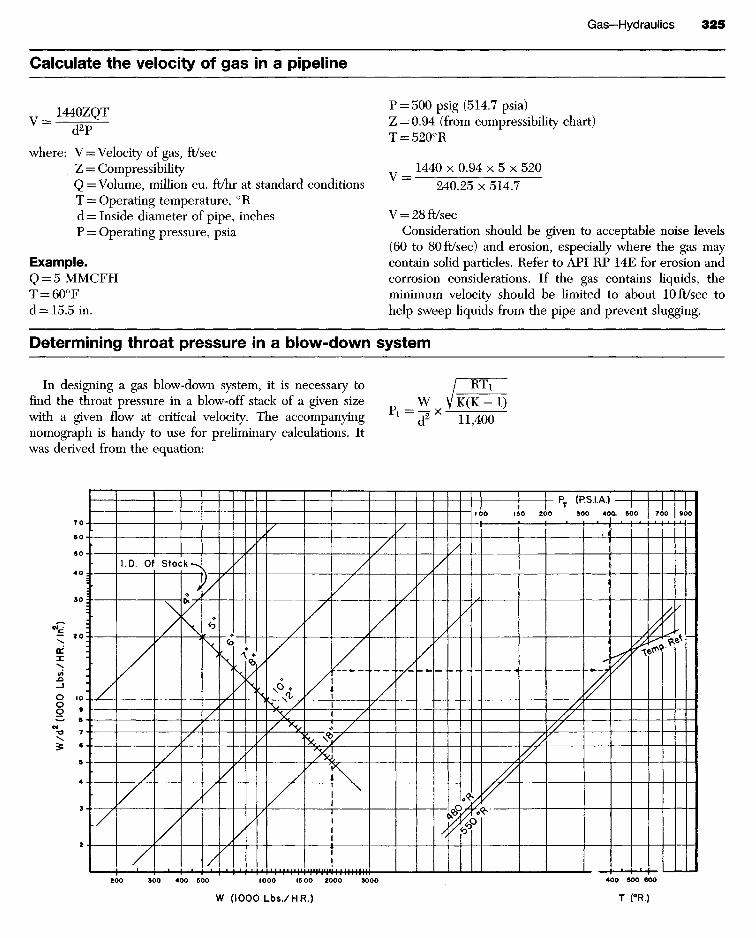
Determining throat pressure in a blow-down system
In designing a gas blow-down system, it is necessary tofind the throat pressure in a blow-off stack of a given sizewith a given flow at critical velocity. The accompanyingnomograph is handy to use for preliminary calculations. Itwas derived from the equation:
W/d
2(l
000
Lbs.
/HR
./ln2)
W (IOOO Lbs./H R.)
I.D. Of Stock
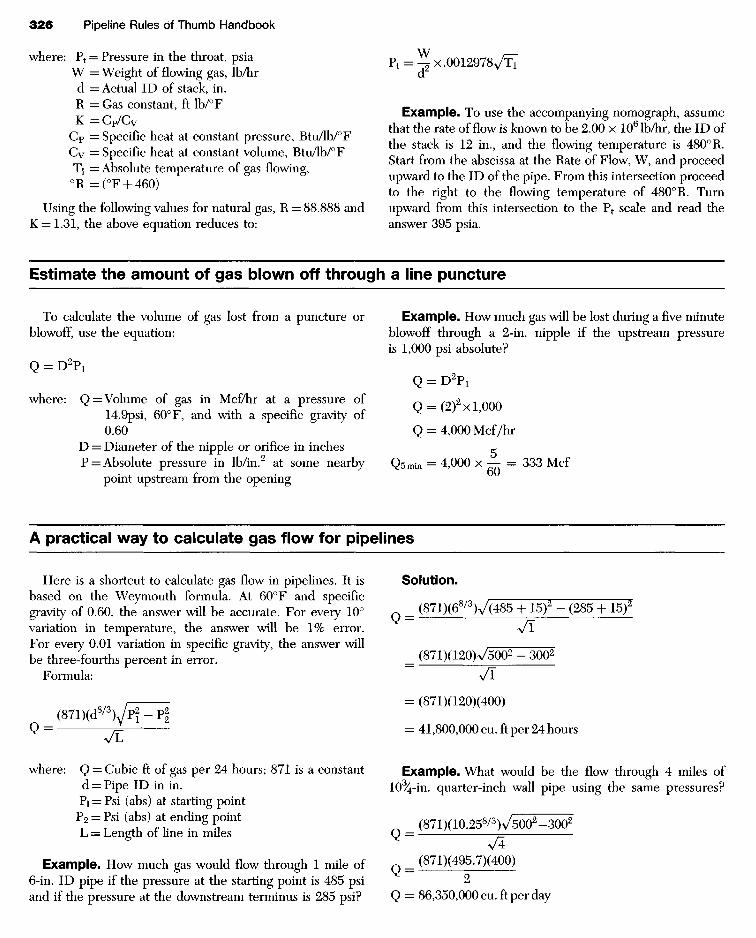
where: Pt = Pressure in the throat, psiaW = Weight of flowing gas, lb/hrd = Actual ID of stack, in.R = Gas constant, ft Ib/0 FK =CP /CV
Cp = Specific heat at constant pressure, Btu/lb/°FC v = Specific heat at constant volume, Btu/lb/°FTi = Absolute temperature of gas flowing,
0R = (0F + 460)
Using the following values for natural gas, R = 88.888 andK = 1.31, the above equation reduces to:
Estimate the amount of gas blown off through a line puncture
To calculate the volume of gas lost from a puncture orblowoff, use the equation:
Q = D2P1
where: Q = Volume of gas in Mcf/hr at a pressure of14.9psi, 600F, and with a specific gravity of0.60
D = Diameter of the nipple or orifice in inchesP = Absolute pressure in lb/in.2 at some nearby
point upstream from the opening
A practical way to calculate gas flow for pipelines
Here is a shortcut to calculate gas flow in pipelines. It isbased on the Weymouth formula. At 600F and specificgravity of 0.60, the answer will be accurate. For every 10°variation in temperature, the answer will be 1% error.For every 0.01 variation in specific gravity, the answer willbe three-fourths percent in error.
Formula:
(871)(d8/3)yP? - V\
where: Q = Cubic ft of gas per 24 hours; 871 is a constantd = Pipe ID in in.Pi = Psi (abs) at starting pointP2 = Psi (abs) at ending pointL = Length of line in miles
Example. How much gas would flow through 1 mile of6-in. ID pipe if the pressure at the starting point is 485 psiand if the pressure at the downstream terminus is 285 psi?
W /—P t = _ X .0012978 V
/ TTd
Example. To use the accompanying nomograph, assumethat the rate of flow is known to be 2.00 x 10⁶ lb/hr, the ID ofthe stack is 12 in., and the flowing temperature is 4800R.Start from the abscissa at the Rate of Flow, W, and proceedupward to the ID of the pipe. From this intersection proceedto the right to the flowing temperature of 4800R. Turnupward from this intersection to the Pt scale and read theanswer 395 psia.
Example. How much gas will be lost during a five minuteblowoff through a 2-in. nipple if the upstream pressureis 1,000 psi absolute?
Q = D2P1
Q = (2)2xl,000
Q = 4,000 Mcf/hr
Q5min = 4,000 x — = 333 McfOvJ
Solution.
(871)(68/3)v/(485 + 15)2 - (285 + 15)2
Q" TT_ (871)(120)V5002 - 3002
" Tf= (871)(120)(400)
= 41,800,000 cu. ft per 24 hours
Example. What would be the flow through 4 miles oflO/4-in. quarter-inch wall pipe using the same pressures?
(871)(10.258/3)v/5002-3002
= (871)(495.7)(400)V 2Q = 86,350,000 cu. ft per day
Rule. Find the volume of the pipe in cubic ft and multiplyby the weight of the gas per cubic ft. To find the latter,multiply the absolute pressure of the gas times 3 and divideby 1,000.
The basis for the latter is that gas with a specific gravityof .60 at 700F weighs 3.06 lb/cu. ft at 1,000 psia. Andeverything else remaining equal, weight of the gas is pro-portional to absolute pressure. Thus, to find the weight ofgas at, say, 500 psia, multiply 3 x 500/1,000 = 1.5 Ib. (1.53 ismore accurate.)
Example. Find the weight of gas in a 1,250-ft aerial rivercrossing where the average pressure reads 625.3 on thegauges; the temperature of the gas is 700F, and specificgravity of gas is .60.
Solution. Change psig to psia:
625.3 + 14.7 = 640 psia
Weight of gas per cubic ft:
6403.06 x —— = 1.959 lb/cu. ft
1,000
Volume of 1,250 ft of 23%-in. ID pipe = 3,685 cu. ft
Weight of gas = 7,217 Ib
This method is fairly accurate; here is the same problemcalculated with the formula:
w^(V)(144)(P a b s)RT
where: W = Weight of gas in IbV = Volume of pipe
Pabs = Absolute pressure of gasR = Universal constant 1,544 -r molecular weight of
gasT = Temperature of gas in 0R
(To find the molecular weight of gas, multiply specificgravity x molecular weight of air, or in this case, .6 x 28.95 =17.37.)
How to calculate the weight of gas in a pipeline
Estimate average pressure in gas pipeline using upstream and downstream pressures
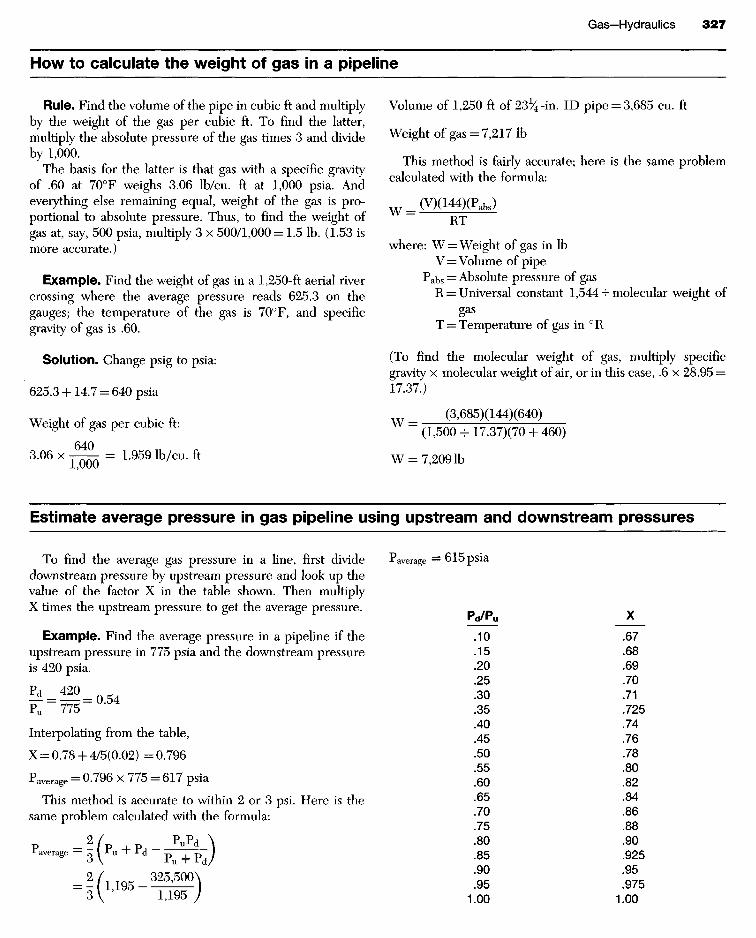
To find the average gas pressure in a line, first dividedownstream pressure by upstream pressure and look up thevalue of the factor X in the table shown. Then multiplyX times the upstream pressure to get the average pressure.
Example. Find the average pressure in a pipeline if theupstream pressure in 775 psia and the downstream pressureis 420 psia.
^ = ^ = 0 . 5 4Pu 775
Interpolating from the table,
X = 0.78+ 4/5(0.02) =0.796
Paverage = 0.796 x 775 = 617 psia
This method is accurate to within 2 or 3 psi. Here is thesame problem calculated with the formula:
Pr average
Paverage = 6 1 5 p s i a
Flow of gas
For gas flow problems as encountered in oil fieldproduction operations, the Fanning equation for pressuredrop may be used. A modified form of this equationemploying units commonly used in oil field practice
FL(MCFD)2STZW = =
20,000 d5Pav
and for determining the friction factor F:
20.14(MCFD)SRw = ;
d/x
where:
P = Pressure drop, psiaF = Friction factor, dimensionlessL = Length of pipe, ft
MCFD = Gas flow at standard condition
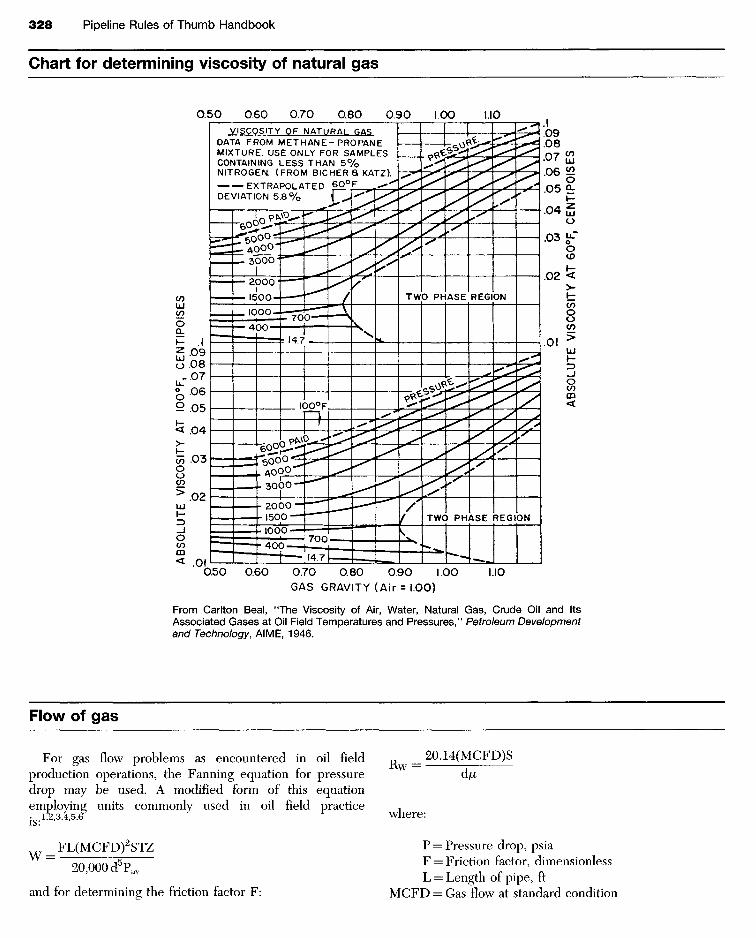
Chart for determining viscosity of natural gas
VISCOSITY OF NATURAL GASDATA FROM METHANE-PROPANEMIXTURE. USE ONLY FOR SAMPLESCONTAINING LESS THAN 5 %NITROGEN. (FROM BICHER a KATZ).
EXTRAPOLATEDDEVIATION 5 . 8 %
TWO PHASE REGION
AB
SO
LU
TE
V
ISC
OS
ITY
AT 6
00F
, C
EN
TIP
OIS
ES
AB
SO
LU
TE
V
ISC
OS
ITY
AT
10
00F
, C
EN
TIP
OIS
ES
TWO PHASE REGION
GAS GRAVITY (Air = I.OO)
From Carlton Beal, 'The Viscosity of Air, Water, Natural Gas, Crude Oil and ItsAssociated Gases at Oil Field Temperatures and Pressures," Petroleum Developmentand Technology, AIME, 1946.
S = Specific gravity of gasT = Absolute temperature ( 0 F+ 460)
Pav = Average flowing pressure, psiad = Internal pipe diameter, inches
Re = Reynolds number, dimensionless/x = Viscosity, centipoises
In actual practice, empirical flow formulas are used bymany to solve the gas flow problems of field productionoperations. The Weymouth formula is the one mostfrequently used since results obtained by its use agreequite closely with actual values. Recent modification of theformula, by including the compressibility factor, Z, made theformula applicable for calculation of high-pressure flowproblems.
The modified formula is as follow:
T /p2 p2\ 1/2
Q=«3.4 xd-x ( 1 ^)
where:Qs = Rate of flow of gas in cubic ft per 24 hours
measured at standard conditionsd = Internal diameter of pipe in inches
P1 = Initial pressure, psi absoluteP2 = Terminal pressure, psi absoluteL = Length of line in milesS = Specific gravity of flowing gas (air= 1.0)T = Absolute temperature of flowing gas
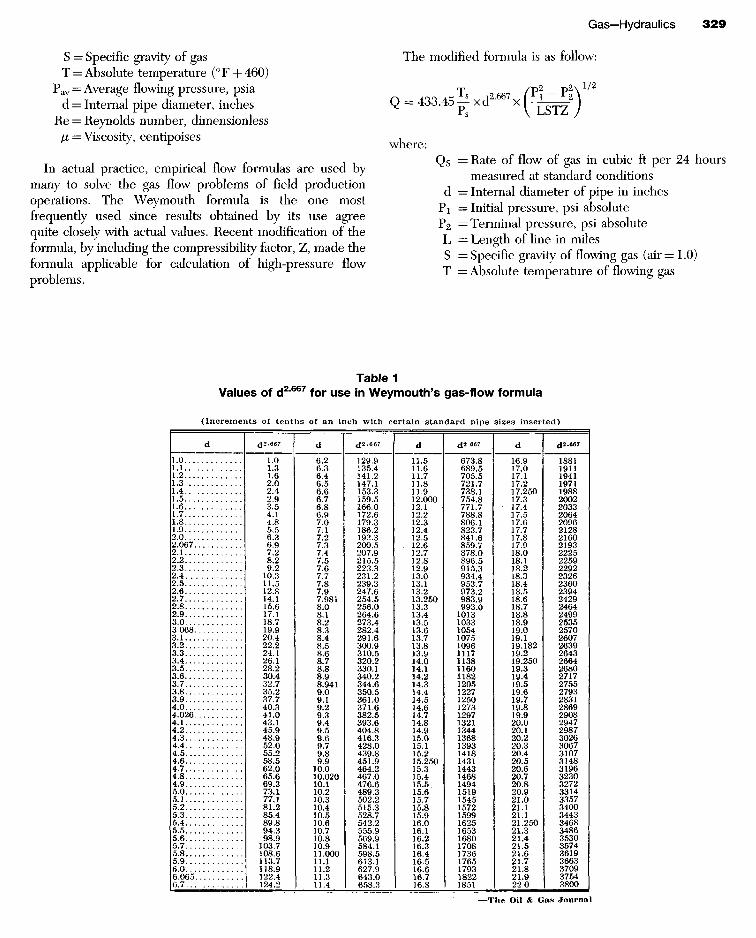
Table 1Values of d2-667 for use in Weymouth's gas-flow formula
(Increments of tenths of an inch with certain standard pipe sizes inserted)
The Oil & Gas Journal
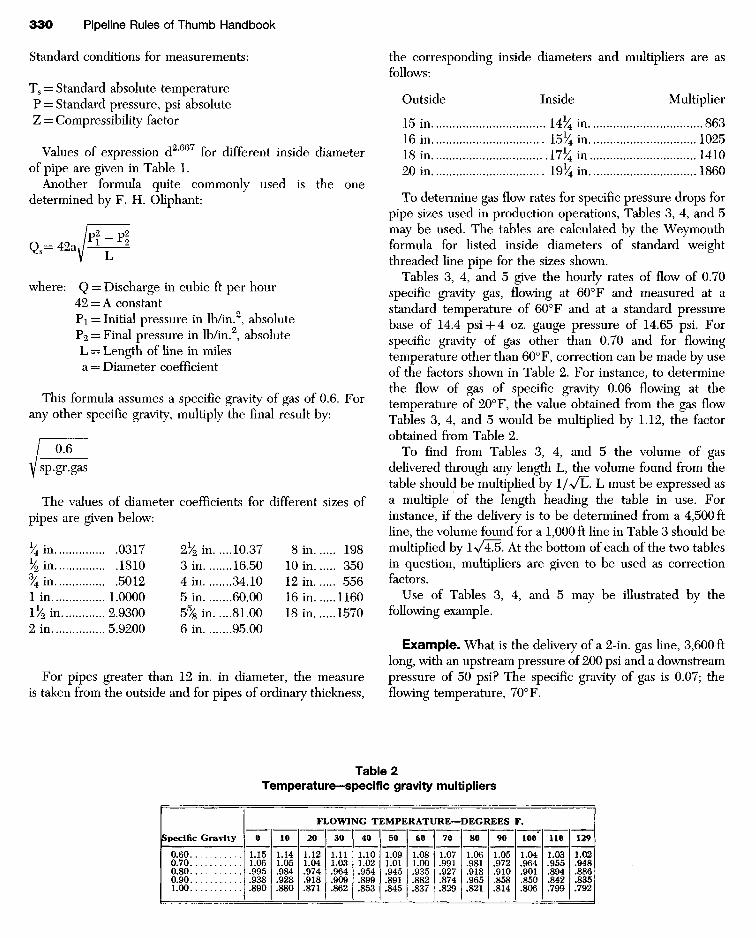
Standard conditions for measurements:
Ts = Standard absolute temperatureP = Standard pressure, psi absoluteZ = Compressibility factor
Values of expression d2 667 for different inside diameterof pipe are given in Table 1.
Another formula quite commonly used is the onedetermined by F. H. Oliphant:
/p2 _ p2
y L-i
where: Q = Discharge in cubic ft per hour42 = A constantPi = Initial pressure in lb/in.2, absoluteP2 = Final pressure in lb/in.2, absoluteL = Length of line in milesa = Diameter coefficient
This formula assumes a specific gravity of gas of 0.6. Forany other specific gravity, multiply the final result by:
/ 0.6ysp.gr.gas
The values of diameter coefficients for different sizes ofpipes are given below:
1Z4Ui 0317 2V2in 10.37 8 in 1981Z2 in 1810 3 in 16.50 10 in 3503 4in 5012 4 in 34.10 12 in 5561 in 1.0000 5 in 60.00 16 in 1160IV2 in 2.9300 5% in 81.00 18 in 15702 in 5.9200 6 in 95.00
For pipes greater than 12 in. in diameter, the measureis taken from the outside and for pipes of ordinary thickness,
the corresponding inside diameters and multipliers are asfollows:
Outside Inside Multiplier
15 in U1Z4 in 86316 in 15V4 in 102518 in 17/4 in 141020 in 19/4 in I860
To determine gas flow rates for specific pressure drops forpipe sizes used in production operations, Tables 3, 4, and 5may be used. The tables are calculated by the Weymouthformula for listed inside diameters of standard weightthreaded line pipe for the sizes shown.
Tables 3, 4, and 5 give the hourly rates of flow of 0.70specific gravity gas, flowing at 600F and measured at astandard temperature of 600F and at a standard pressurebase of 14.4 psi+ 4 oz. gauge pressure of 14.65 psi. Forspecific gravity of gas other than 0.70 and for flowingtemperature other than 600F, correction can be made by useof the factors shown in Table 2. For instance, to determinethe flow of gas of specific gravity 0.06 flowing at thetemperature of 200F, the value obtained from the gas flowTables 3, 4, and 5 would be multiplied by 1.12, the factorobtained from Table 2.
To find from Tables 3, 4, and 5 the volume of gasdelivered through any length L, the volume found from thetable should be multiplied by 1 / V L . L must be expressed asa multiple of the length heading the table in use. Forinstance, if the delivery is to be determined from a 4,500 ftline, the volume found for a 1,000 ft line in Table 3 should bemultiplied by W4.5. At the bottom of each of the two tablesin question, multipliers are given to be used as correctionfactors.
Use of Tables 3, 4, and 5 may be illustrated by thefollowing example.
Example. What is the delivery of a 2-in. gas line, 3,600 ftlong, with an upstream pressure of 200 psi and a downstreampressure of 50 psi? The specific gravity of gas is 0.07; theflowing temperature, 700F.
Table 2Temperature—specific gravity multipliers
Specific Gravity
FLOWING TEMPERATURE—DEGREES F.
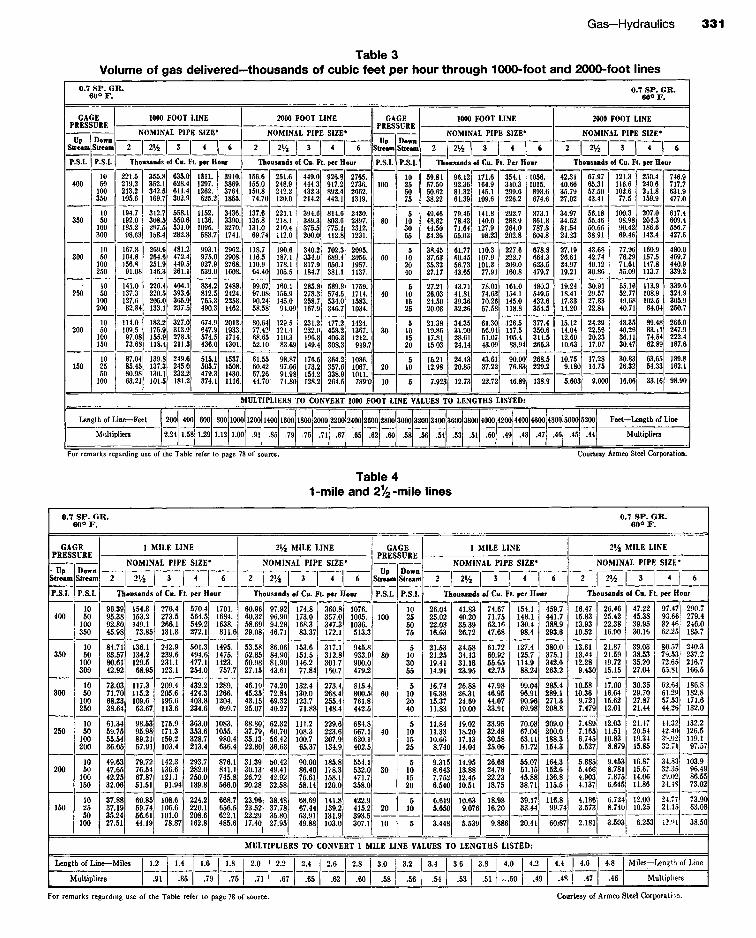
Table 3Volume of gas delivered—thousands of cubic feet per hour through 1000-foot and 2000-foot lines
0.7 SP. GR.60° F.
GAGEPRESSURE
UPStream
P.S.I.
DownStream
P.S.I.
1000 FOOT LINE
NOMINAL PIPE SIZE*
2 2V2 I 3 4 6
Thousands of Cu. Ft. per Hour
2000 FOOT LINE
NOMINAL PIPE SIZE*
2 I 2V2 3 4 6
Thousands of Cu. Ft. per Hour
GAGEPRESSURE
UpStream
P.S.I.
DownStream
P.S.I.
1000 FOOT LINE
NOMINAL PIPE SIZE*
2 % I 3 4 I «Thousands of Cu. Ft. Per Hour
2000 FOOT LINE
NOMINAL PIPE SIZE*
2 I 2 * Z I 4 *Thousands of Cu. Ft. per Hour
MULTIPLIERS TO CONVERT 1000 FOOT LINE VALUES TO LENGTHS LISTED:
Length of Line—Feet
Multipliers
Feet—Length of Line
Multipliers
For remarks regarding use of the Table refer to page 78 of source.
Table 41-mile and 2!4-mile lines
0.7 SP. GR.6 O 0 F .
0.7 SP. GR.6O 0F.
0.7 SP. GR.60° F .
GAGEPRESSURE
.UpStream
P.S.I.
DownStream
P.S.I.
1 MILE LINE
NOMINAL PIPE SIZE*
2 2V2 3 6
Thousands of Cu. Ft. per Hour
2V2 MILE LINE
NOMINAL PIPE SIZE*
2 2V2 3 6
Thousands of Cu. Ft. per Hour
GAGEPRESSURE
UpStream
P.S.I.
DownStream
P.S.I.
1 MILE LINE
NOMINAL PIPE SIZE*
2 2V2 6
Thousands of Cu. Ft. per Hour
2»/2 MILE LINE
NOMINAL PIPE SIZE'
2 2V2 3 4
Thousands of Cu. Ft. per Hour
MULTIPLIERS TO CONVERT 1 MILE LINE VALUES TO LENGTHS LISTED:
Length of Line—Miles
Multipliers
Miles—Length of Line
Multipliers
For remarks regarding use of the Table refer to page 78 of source. Courtesy of Armco Steel Corporation.
For remarks regarding use of the Table refer to page 78 of source.
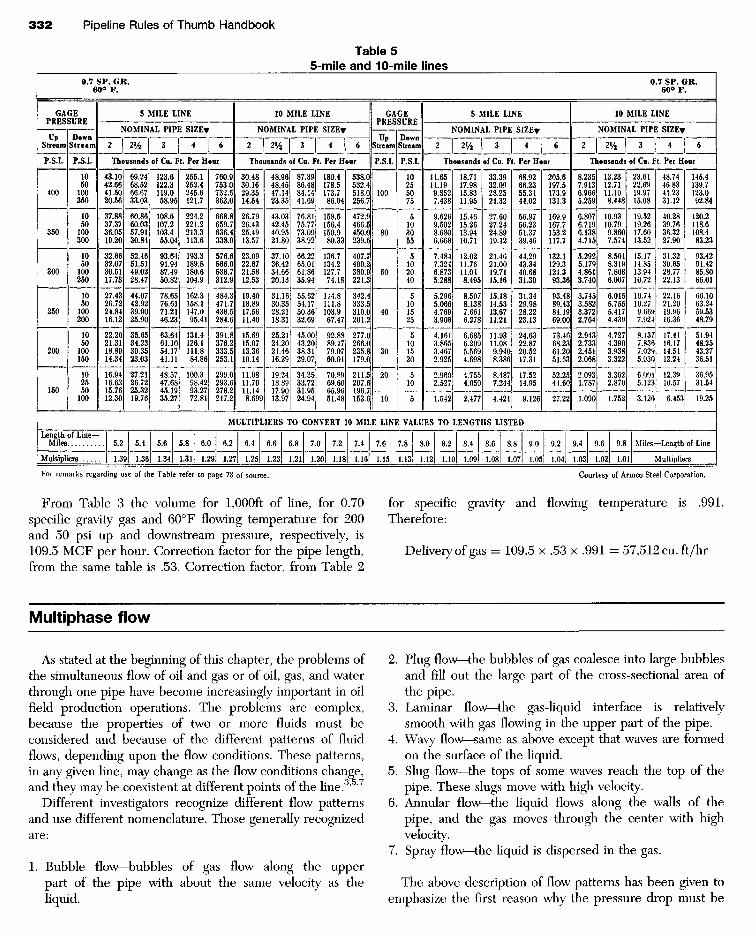
From Table 3 the volume for 1,000ft of line, for 0.70specific gravity gas and 600F flowing temperature for 200and 50 psi up and downstream pressure, respectively, is109.5 MCF per hour. Correction factor for the pipe length,from the same table is .53. Correction factor, from Table 2
Multiphase flow
As stated at the beginning of this chapter, the problems ofthe simultaneous flow of oil and gas or of oil, gas, and waterthrough one pipe have become increasingly important in oilfield production operations. The problems are complex,because the properties of two or more fluids must beconsidered and because of the different patterns of fluidflows, depending upon the flow conditions. These patterns,in any given line, may change as the flow conditions change,and they may be coexistent at different points of the line.3'5'7
Different investigators recognize different flow patternsand use different nomenclature. Those generally recognizedare:
1. Bubble flow-4)ubbles of gas flow along the upperpart of the pipe with about the same velocity as theliquid.
Courtesy of Armco Steel Corporation.
for specific gravity and flowing temperature is .991.Therefore:
Delivery of gas = 109.5 x .53 x .991 = 57,512 cu. ft/hr
2. Plug flow—the bubbles of gas coalesce into large bubblesand fill out the large part of the cross-sectional area ofthe pipe.
3. Laminar flow—the gas-liquid interface is relativelysmooth with gas flowing in the upper part of the pipe.
4. Wavy flow—same as above except that waves are formedon the surface of the liquid.
5. Slug flow—the tops of some waves reach the top of thepipe. These slugs move with high velocity.
6. Annular flow—the liquid flows along the walls of thepipe, and the gas moves through the center with highvelocity.
7. Spray flow—the liquid is dispersed in the gas.
The above description of flow patterns has been given toemphasize the first reason why the pressure drop must be
Table 55-mile and 10-mile lines
0.7 SP. GR.60° F.
0.7 SP. GR.60 0 F.
GAGEPRESSURE
UpStream
P.S.I.
DownStream
P.S.I.
5 MILE LINE
NOMINAL PIPE SIZEv
2 2% 3 I 4 6
Thousands of Cu. Ft. Per Hour
10 MILE LINE
NOMINAL PIPE S I Z E T
2 I 2V2 4 6
Thousands of Cu. Ft. Per Hour
GAGEPRESSURE
UpStream
P.S.I.
DownStream
P.S.I.
5 MILE LINE
NOMINAL PIPE S I Z E T
2 2V2 3 I 4 6
Thousands of Cu. Ft. Per Hour
10 MILE LINE
NOMINAL PIPE SIZEf
2 2V2 3 4 6
Thousands of Cu. Ft. Per Hour
SATURATION PRESSURE,PSI
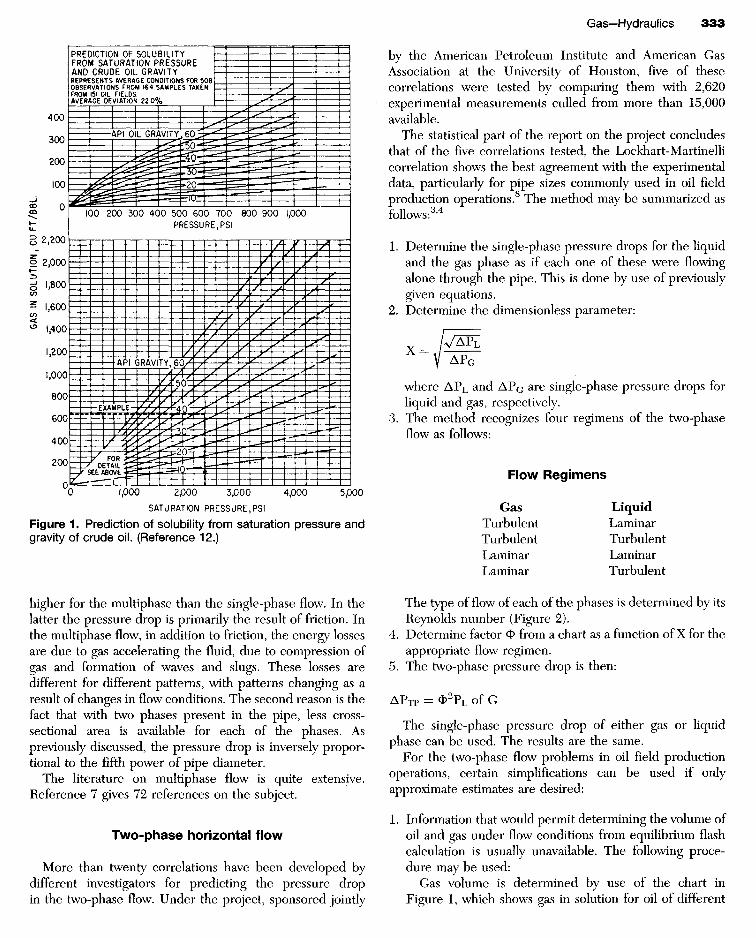
Figure 1. Prediction of solubility from saturation pressure andgravity of crude oil. (Reference 12.)
higher for the multiphase than the single-phase flow. In thelatter the pressure drop is primarily the result of friction. Inthe multiphase flow, in addition to friction, the energy lossesare due to gas accelerating the fluid, due to compression ofgas and formation of waves and slugs. These losses aredifferent for different patterns, with patterns changing as aresult of changes in flow conditions. The second reason is thefact that with two phases present in the pipe, less cross-sectional area is available for each of the phases. Aspreviously discussed, the pressure drop is inversely propor-tional to the fifth power of pipe diameter.
The literature on multiphase flow is quite extensive.Reference 7 gives 72 references on the subject.
Two-phase horizontal flow
More than twenty correlations have been developed bydifferent investigators for predicting the pressure dropin the two-phase flow. Under the project, sponsored jointly
by the American Petroleum Institute and American GasAssociation at the University of Houston, five of thesecorrelations were tested by comparing them with 2,620experimental measurements culled from more than 15,000available.
The statistical part of the report on the project concludesthat of the five correlations tested, the Lockhart-Martinellicorrelation shows the best agreement with the experimentaldata, particularly for pipe sizes commonly used in oil fieldproduction operations.8 The method may be summarized asfollows:3'4
1. Determine the single-phase pressure drops for the liquidand the gas phase as if each one of these were flowingalone through the pipe. This is done by use of previouslygiven equations.
2. Determine the dimensionless parameter:
/VAPZ
where APL and APG are single-phase pressure drops forliquid and gas, respectively.
3. The method recognizes four regimens of the two-phaseflow as follows:
Flow Regimens
Gas LiquidTurbulent LaminarTurbulent TurbulentLaminar LaminarLaminar Turbulent
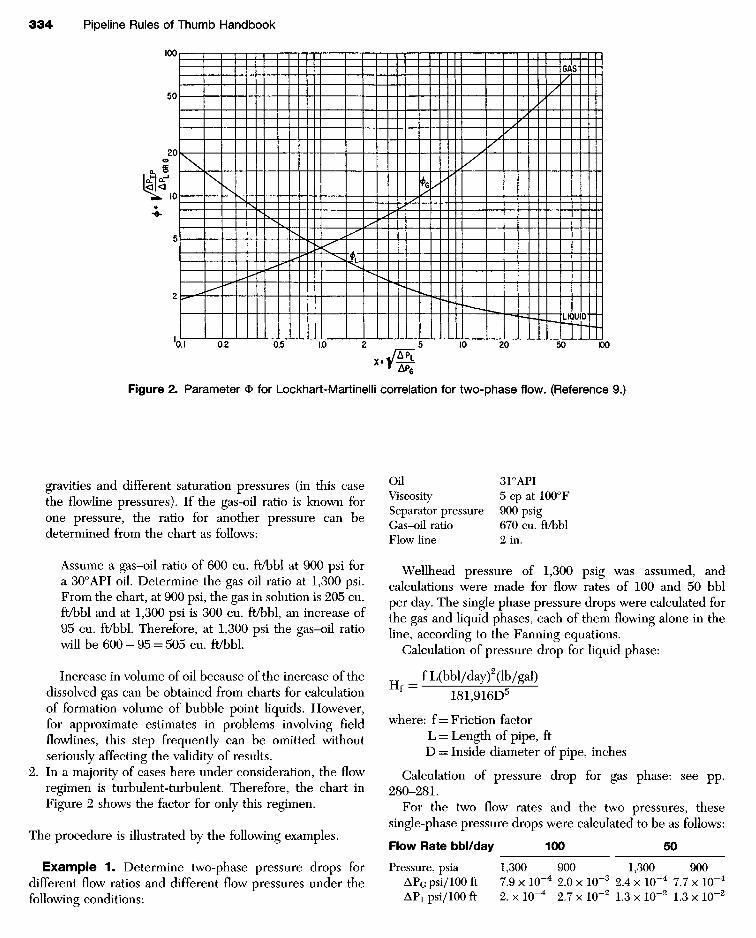
The type of flow of each of the phases is determined by itsReynolds number (Figure 2).
4. Determine factor O from a chart as a function of X for theappropriate flow regimen.
5. The two-phase pressure drop is then:
APTp = O2PL of G
The single-phase pressure drop of either gas or liquidphase can be used. The results are the same.
For the two-phase flow problems in oil field productionoperations, certain simplifications can be used if onlyapproximate estimates are desired:
1. Information that would permit determining the volume ofoil and gas under flow conditions from equilibrium flashcalculation is usually unavailable. The following proce-dure may be used:
Gas volume is determined by use of the chart inFigure 1, which shows gas in solution for oil of different
PREDICTION OF SOLUBILITYFROM SATURATION PRESSUREAND CRUDE OIL GRAVITYREPRESENTS AVERAGE CONDITIONS FOR 508OBSERVATIONS FROM 164 SAMPLES TAKENFROM 151 OIL FIELDS.AVERAGE DEVIATION 22 0 %
PRESSURE.PSI
GA
S IN
S
OL
UT
ION
, C
U. F
T./
BB
L
gravities and different saturation pressures (in this casethe flowline pressures). If the gas-oil ratio is known forone pressure, the ratio for another pressure can bedetermined from the chart as follows:
Assume a gas-oil ratio of 600 cu. ft/bbl at 900 psi fora 300API oil. Determine the gas oil ratio at 1,300 psi.From the chart, at 900 psi, the gas in solution is 205 cu.ft/bbl and at 1,300 psi is 300 cu. ft/bbl, an increase of95 cu. ft/bbl. Therefore, at 1,300 psi the gas-oil ratiowill be 600 - 95 = 505 cu. ft/bbl.
Increase in volume of oil because of the increase of thedissolved gas can be obtained from charts for calculationof formation volume of bubble point liquids. However,for approximate estimates in problems involving fieldflowlines, this step frequently can be omitted withoutseriously affecting the validity of results.
2. In a majority of cases here under consideration, the flowregimen is turbulent-turbulent. Therefore, the chart inFigure 2 shows the factor for only this regimen.
The procedure is illustrated by the following examples.
Example 1. Determine two-phase pressure drops fordifferent flow ratios and different flow pressures under thefollowing conditions:
Oil 31°APIViscosity 5 cp at 1000FSeparator pressure 900 psigGas-oil ratio 670 cu. ft/bblFlow line 2 in.
Wellhead pressure of 1,300 psig was assumed, andcalculations were made for flow rates of 100 and 50 bblper day. The single phase pressure drops were calculated forthe gas and liquid phases, each of them flowing alone in theline, according to the Fanning equations.
Calculation of pressure drop for liquid phase:
H ^fL(bbl/day)2(lb/gal)f 181,916D5
where: f= Friction factorL = Length of pipe, ftD = Inside diameter of pipe, inches
Calculation of pressure drop for gas phase: see pp.280-281.
For the two flow rates and the two pressures, thesesingle-phase pressure drops were calculated to be as follows:
Flow Rate bbl/day 100 50
Pressure, psia 1,300 900 1,300 900APG psi/100 ft 7.9 x 1(T4 2.0 x 10"3 2.4 x 1(T4 7.7 x 1(T4
AP1 psi/100 ft 2. x 1(T4 2.7 x 10"2 1.3 x 1(T2 1.3 x 1(T2
Figure 2. Parameter O for Lockhart-Martinelli correlation for two-phase flow. (Reference 9.)
Then AX= / ^ 5.9 3.8 7.4 4.2YAPG
From Figure 2 <£ 2.0 2.4 1.9 2.3and the two-phasepressure dropPressure drop
APTp = 0LxAPL 0.12 0.16 0.048 0.069
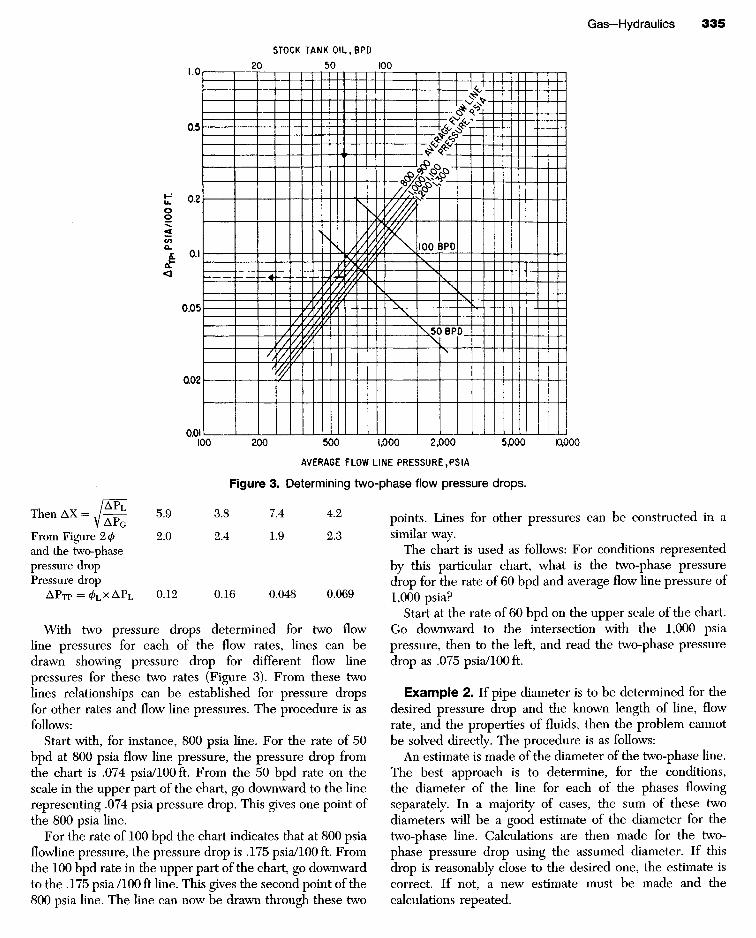
With two pressure drops determined for two flowline pressures for each of the flow rates, lines can bedrawn showing pressure drop for different flow linepressures for these two rates (Figure 3). From these twolines relationships can be established for pressure dropsfor other rates and flow line pressures. The procedure is asfollows:
Start with, for instance, 800 psia line. For the rate of 50bpd at 800 psia flow line pressure, the pressure drop fromthe chart is .074 psia/lOOft. From the 50 bpd rate on thescale in the upper part of the chart, go downward to the linerepresenting .074 psia pressure drop. This gives one point ofthe 800 psia line.
For the rate of 100 bpd the chart indicates that at 800 psiaflowline pressure, the pressure drop is .175 psia/lOOft. Fromthe 100 bpd rate in the upper part of the chart, go downwardto the .175 psia /100 ft line. This gives the second point of the800 psia line. The line can now be drawn through these two
points. Lines for other pressures can be constructed in asimilar way.
The chart is used as follows: For conditions representedby this particular chart, what is the two-phase pressuredrop for the rate of 60 bpd and average flow line pressure of1,000 psia?
Start at the rate of 60 bpd on the upper scale of the chart.Go downward to the intersection with the 1,000 psiapressure, then to the left, and read the two-phase pressuredrop as .075 psia/100 ft.
Example 2. If pipe diameter is to be determined for thedesired pressure drop and the known length of line, flowrate, and the properties of fluids, then the problem cannotbe solved directly. The procedure is as follows:
An estimate is made of the diameter of the two-phase line.The best approach is to determine, for the conditions,the diameter of the line for each of the phases flowingseparately. In a majority of cases, the sum of these twodiameters will be a good estimate of the diameter for thetwo-phase line. Calculations are then made for the two-phase pressure drop using the assumed diameter. If thisdrop is reasonably close to the desired one, the estimate iscorrect. If not, a new estimate must be made and thecalculations repeated.
AVERAGE FLOW LINE PRESSURE,PSIA
Figure 3. Determining two-phase flow pressure drops.
AP
flhP
SIA
/IOO
FT.
Inclined two-phase flow
In hilly terrain additional pressure drop can be expected incase of the two-phase flow. Little published informationis available on the subject. Ovid Baker suggested thefollowing empirical formula:10
AT3 AJ> , 1 . 6 1 N H p L
A P T P H = AP1-P + ^ 7
where: APTPH = Pressure drop, corrected for hilly terrainin psi
APTP = Calculated two-phase pressure drop forhorizontal pipe, psi
N = Number of hillsH = Average height of hills, ft
PL = Density of liquid phase, lb/ft3
Vg = Velocity of gas, ft/sec(based on 100% pipe area)
Horfzontal three-phase flow
Very little is known about the effect on the pressure dropof addition to the gas-oil system of a third phase, an immis-cible liquid, water. Formation of an emulsion results inincreased viscosities. Formulas are available for approximatedetermination of viscosity of emulsion, if viscosity of oil andpercent of water content of oil is known. The point is,however, that it is not known what portion of the water isflowing in emulsified form.
From one published reference11 and from some unpub-lished data, the following conclusions appear to be wellfounded:
1. Within the range of water content of less than 10% ormore than 90%, the flow mechanism appears to approachthat of the two-phase flow.
2. Within the range of water content of from 70% to 90%,the three-phase pressure drop is considerably higher thanfor the two-phase flow.
For solution of three-phase flow problems of oil field flowlines, the following approach has been used. The oil andwater are considered as one phase and the gas as the otherphase. Previously given calculation of a two-phase drop isused. The viscosity of the oil-water mixture is determined asfollows:
_ V x /zo+Vwx/xw
where /xL, /^0 and /xw are viscosities of mixture of oil and ofwater, respectively, and VQ and Vw represent the corre-sponding volumes of oil and water.
No test data are available to determine the accuracyof this approach. Until more information is developed onthe subject, the method may be considered for approximateestimates.
References
1. Cameron Hydraulic Data, 13th ed., Ingersoll-RandCompany, New York, 1962.
2. Flow of Fluids Through Valves, Fittings and Pipe,Technical Paper No. 410, Engineering Division, CraneCompany, Chicago, 1957.
3. Streeter, Victor L., Handbook of Fluid Dynamics,McGraw-Hill Book Company, Inc., New York, 1961.
4. Prof. W. E. Durand's Discussions in Handbook of thePetroleum Industry, David T. Day; John Wiley & Sons,Inc., New York.
5. Baker, Ovid, "Simultaneous Flow of Oil and Gas," TheOil and Gas Journal, July 26, 1954.
6. Campbell, Dr. John M., "Elements of Field Processing,"The Oil and Gas Journal, December 9, 1957.
7. Campbell, Dr. John M., "Problems of Multi-phase PipeLine Flow," in "Flow Calculations in Pipelining," TheOil and Gas Journal, November 4, 1959.
8. Duckler, A. E., Wicks, III, Moye, and Cleveland, R. G.,"Frictional Pressure Drop in Two-Phase Flow," AIChEJournal, January, 1964.
9. Lockhart, R. W., and Martinelli, R. C , "ProposedCorrelation of Data for Isothermal Two-Phase, Two-Component Flow in Pipes," Chemical EngineeringProgress 45: 39-48, (1949).
10. Ovid Baker's discussion of article "How Uphill andDownhill Flow Affect Pressure Drop in Two-Phase PipeLines," by Brigham, W. E., Holstein, E. D., andHuntington, R. L.; The Oil and Gas Journal, November11, 1957.
11. Sobocinski, D. P., and Huntington, R. D., "ConcurrentFlow of Air, Gas, Oil and Water in a Horizontal Line,"Trans. ASME 80: 1,252, 1958.
12. Beal, Carlton, "The Viscosity of Air, Water, Natural Gas,Crude Oil and Its Associated Gases at Oil FieldTemperatures and Pressures," Petroleum Developmentand Technology, AIME, 1946.
13. Switzer, F. G., Pump Fax, Gould Pumps, Inc.14. Pump Talk, The Engineering Department, Dean
Brothers Pumps, Inc., Indianapolis.15. Switzer, F. G., The Centrifugal Pump, Goulds Pumps,
Inc.16. Zalis, A. A., "Don't Be Confused by Rotary Pump Per-
formance Curves," Hydrocarbon Processing and Petro-leum Refiner, Gulf Publishing Company, September,1961.
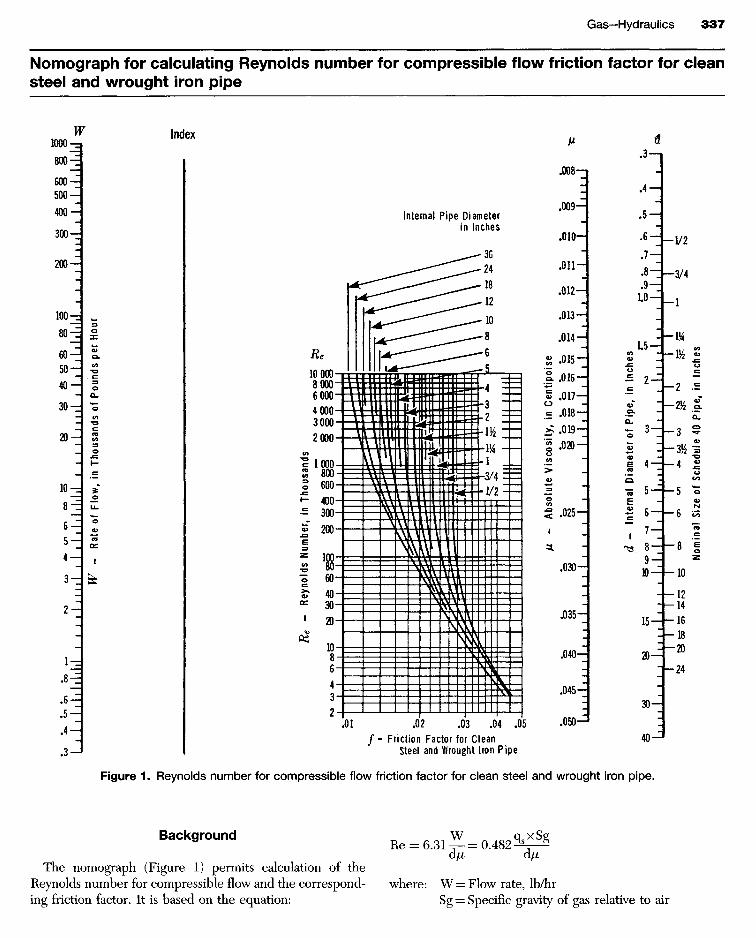
Nomograph for calculating Reynolds number for compressible flow friction factor for cleansteel and wrought iron pipe
Index
Internal Pipe Diameterin Inches
W
- R
ate
of
Flo
w,
in
Th
ou
san
ds
of
Po
un
ds
pe
r H
ou
r
Re
- R
eyn
old
s N
um
ber
, in
Th
ou
san
ds
Ab
solu
te V
isco
sity
, in
Cen
tip
ois
e
d -
Inte
rnal
D
iam
eter
of
Pip
e,
in I
nch
es
No
min
al
Siz
e o
f S
ched
ule
40
Pip
e,
in
Inch
es
/ - Friction Factor for CleanSteel and Wrought Iron Pipe
Figure 1. Reynolds number for compressible flow friction factor for clean steel and wrought iron pipe.
Background
The nomograph (Figure 1) permits calculation of theReynolds number for compressible flow and the correspond-ing friction factor. It is based on the equation:
where: W = Flow rate, lb/hrSg = Specific gravity of gas relative to air

Q'd -
Rat
e of
Flo
w, i
n Mi
llions
of C
ubic
Feet
per D
ay a
t Stan
dard
Con
ditio
ns
Rate
of F
low,
in T
hous
ands
of C
ubic
Feet
per
Minu
te at
Stan
dard
Con
ditio
ns
q'h -
Rat
e of
Flo
w, in
Tho
usan
ds o
f Cub
ic Fe
et p
er H
our a
t Stan
dard
Con
ditio
ns
W -
Rat
e of
Flo
w, in
Tho
usan
ds o
f Pou
nds
per H
our
Spec
ific
Grav
ity
W = 4 5 8 ^m S9
W = pa q\ S9
W = 0.0764 q\ S9
W = 3180 q'd S9
where:Pa = weight density of air at
standard conditions(14.7 psia and 60 F)
Problem: What is the rate of flow inpounds per hour of a gas, which has aspecific gravity of 0.78, and is flowing atthe rate of 1,000,000 cubic feet per hourat standard conditions?
Solution: W = 60,000 pounds per hour.
Figure 2. Equivalent volume and weight flow rates of compressible fluids.
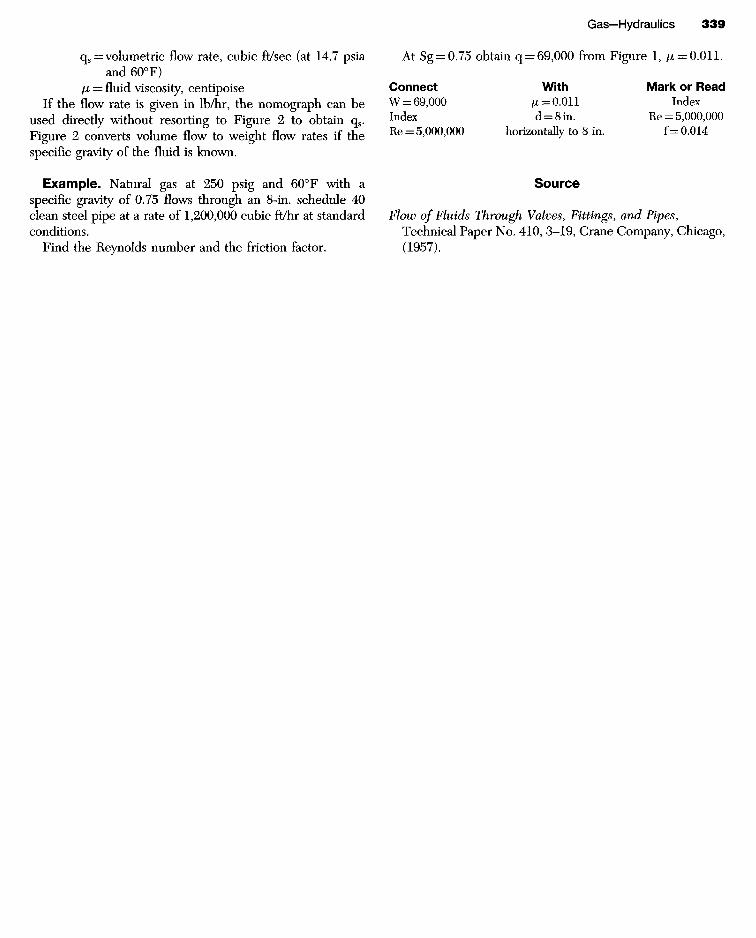
qs = volumetric flow rate, cubic ft/sec (at 14.7 psiaand 600F)
/x = fluid viscosity, centipoiseIf the flow rate is given in lb/hr, the nomograph can be
used directly without resorting to Figure 2 to obtain qs.Figure 2 converts volume flow to weight flow rates if thespecific gravity of the fluid is known.
Example. Natural gas at 250 psig and 600F with aspecific gravity of 0.75 flows through an 8-in. schedule 40clean steel pipe at a rate of 1,200,000 cubic ft/hr at standardconditions.
Find the Reynolds number and the friction factor.
At Sg = 0.75 obtain q = 69,000 from Figure 1, // = 0.011.
Connect With Mark or ReadW = 69,000 /x = 0.011 IndexIndex d = 8in. Re = 5,000,000Re = 5,000,000 horizontally to 8 in. f = 0.014
Source
Flow of Fluids Through Valves, Fittings, and Pipes,Technical Paper No. 410, 3-19, Crane Company, Chicago,(1957).