gas-chromatography/mass spectrometry (gc -ms ... · pdf filegas-chromatography/mass...
TRANSCRIPT

Gas-chromatography/mass spectrometry (GC-MS) Interpretation of EI spectra
Jeremy Keirsey CCIC MSP
Mass Spec Summer Workshop August 17, 2015
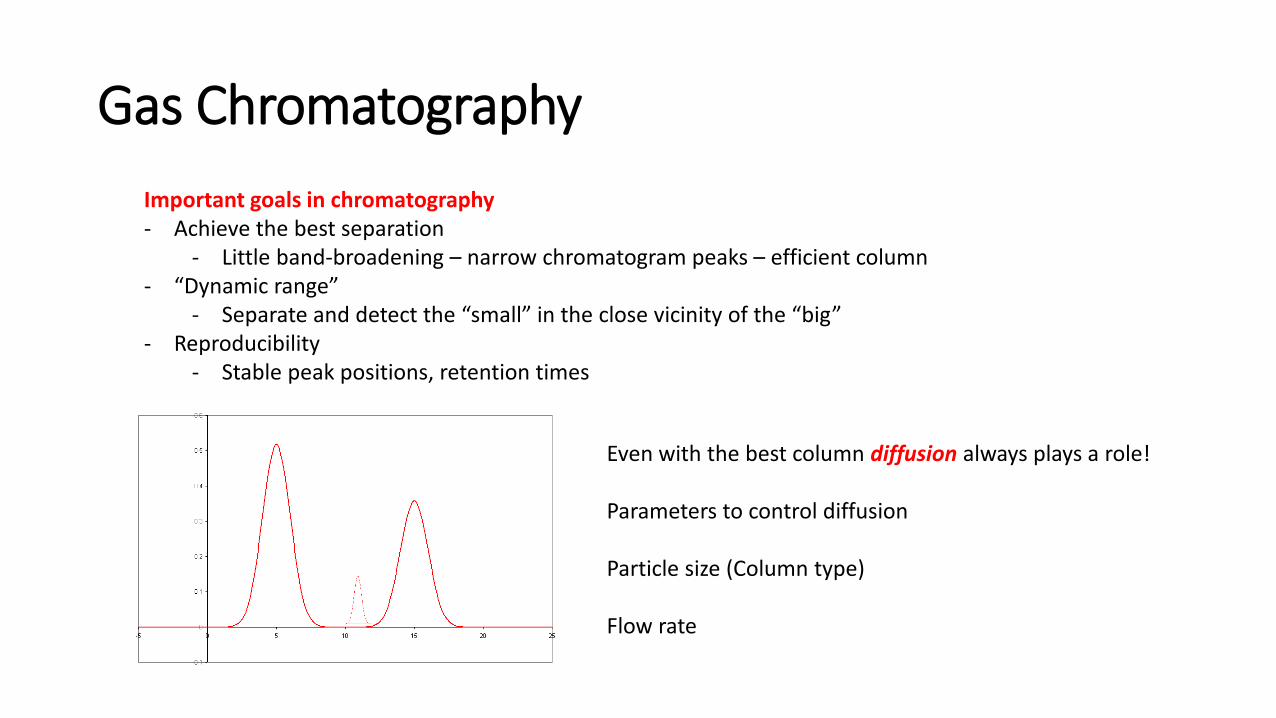
Important goals in chromatography - Achieve the best separation
- Little band-broadening – narrow chromatogram peaks – efficient column - “Dynamic range”
- Separate and detect the “small” in the close vicinity of the “big” - Reproducibility
- Stable peak positions, retention times
Even with the best column diffusion always plays a role! Parameters to control diffusion Particle size (Column type) Flow rate
Gas Chromatography
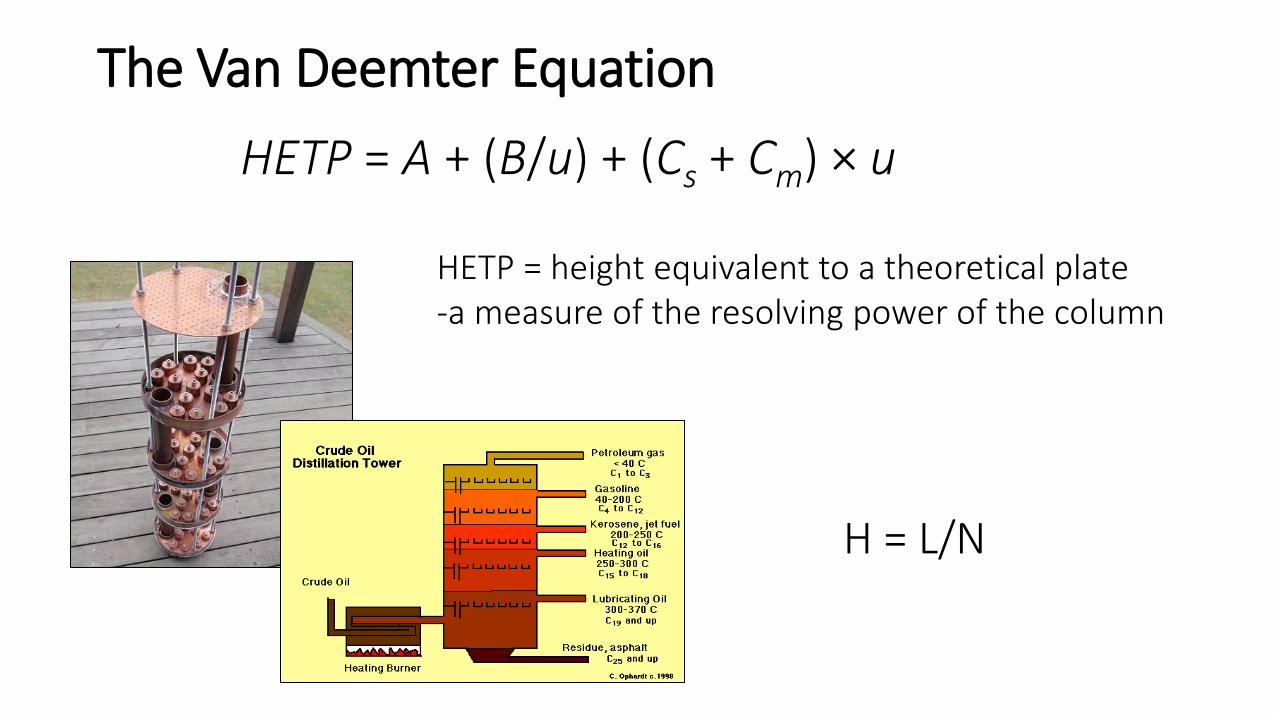
The Van Deemter Equation HETP = A + (B/u) + (Cs + Cm) × u
HETP = height equivalent to a theoretical plate -a measure of the resolving power of the column
H = L/N
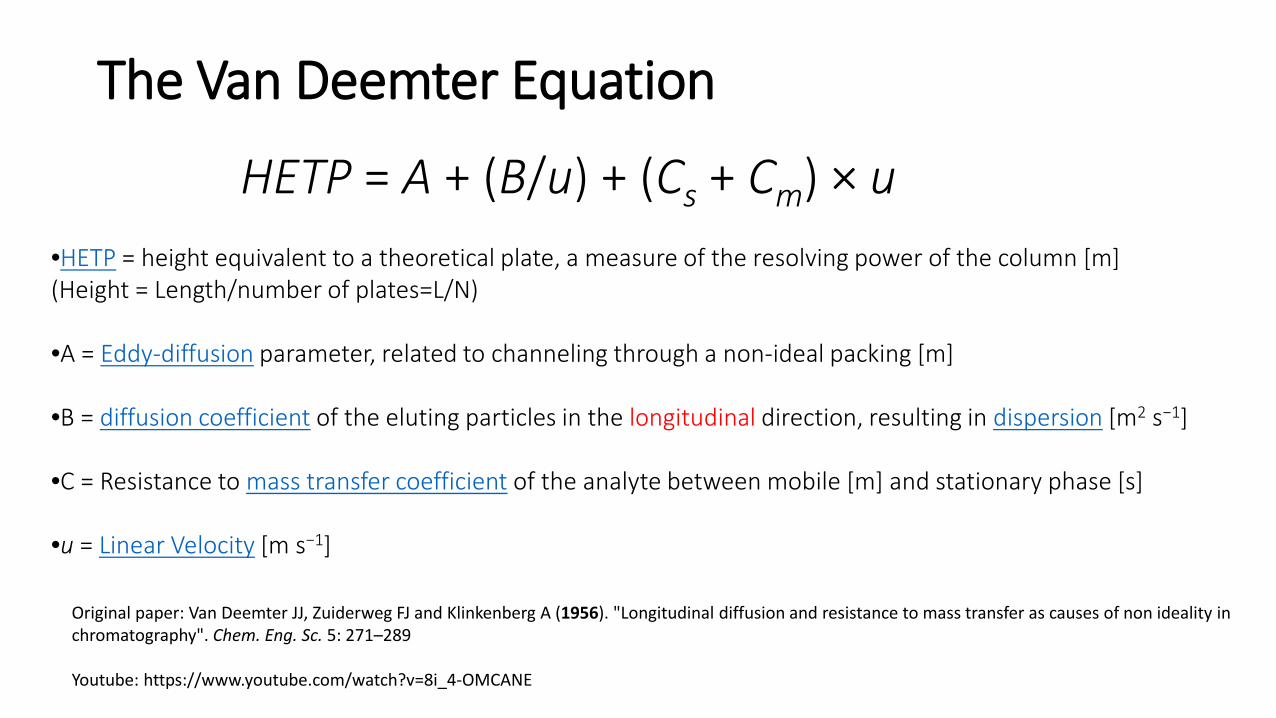
•HETP = height equivalent to a theoretical plate, a measure of the resolving power of the column [m] (Height = Length/number of plates=L/N) •A = Eddy-diffusion parameter, related to channeling through a non-ideal packing [m] •B = diffusion coefficient of the eluting particles in the longitudinal direction, resulting in dispersion [m2 s−1] •C = Resistance to mass transfer coefficient of the analyte between mobile [m] and stationary phase [s]
•u = Linear Velocity [m s−1]
Original paper: Van Deemter JJ, Zuiderweg FJ and Klinkenberg A (1956). "Longitudinal diffusion and resistance to mass transfer as causes of non ideality in chromatography". Chem. Eng. Sc. 5: 271–289 Youtube: https://www.youtube.com/watch?v=8i_4-OMCANE
The Van Deemter Equation
HETP = A + (B/u) + (Cs + Cm) × u
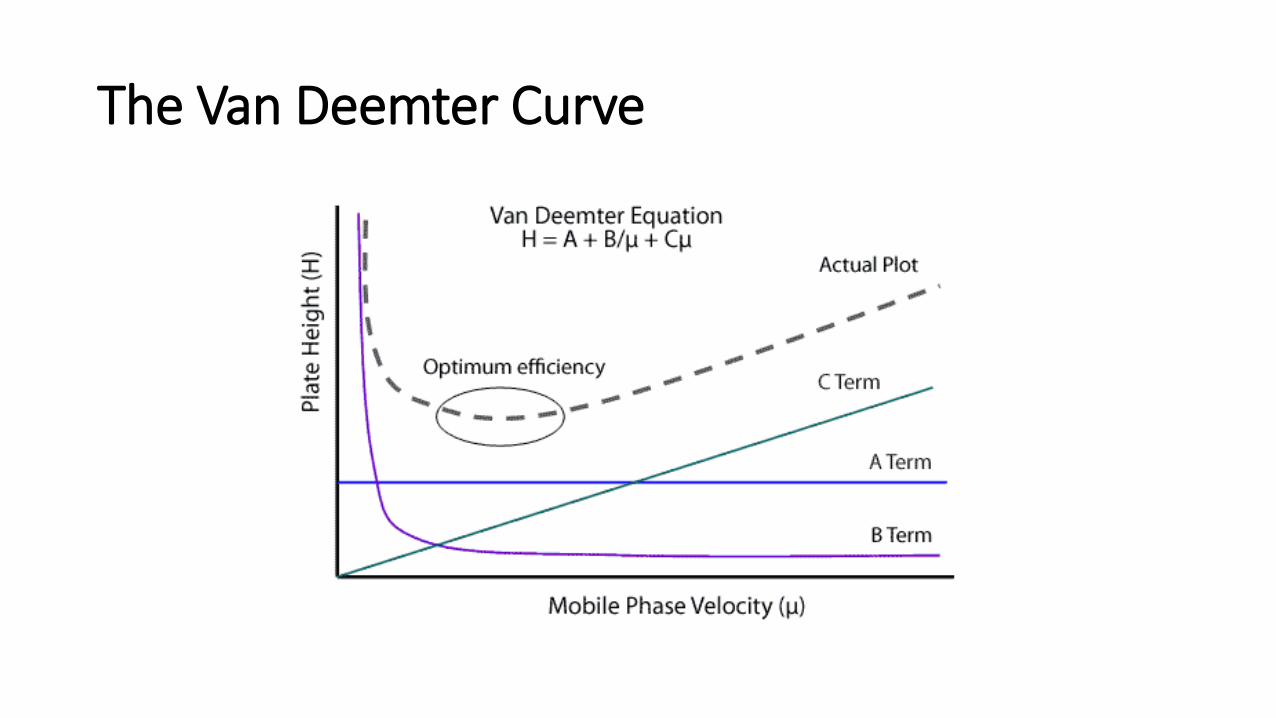
The Van Deemter Curve

Resolution
Solute moving through a column spreads into a Gaussian shape with standard deviation σ. Common Measures of breadth are: 1) The width w½ measured at half-height 2) The width w at the baseline between tangents drawn to the steepest parts of the peak (inflection points).

Derive Van Deemter for Resolution HETP = L/N N = L/N substitute H = σ2/L N = L2/σ2 convert length to time (utility) N = (tr)2/(σ)2 relate σ to w1/2 (2.35σ) and w (4σ) N = 16tr
2/w2
N = 5.55tr
2/w1/22

MS Analyzer: -Quadrupole -Ion trap -Time of flight (TOF) -Orbitrap
GC oven -GC Column
GC controller
Autosampler
GC coupled to Mass Spectrometry (MS)
GC Columns
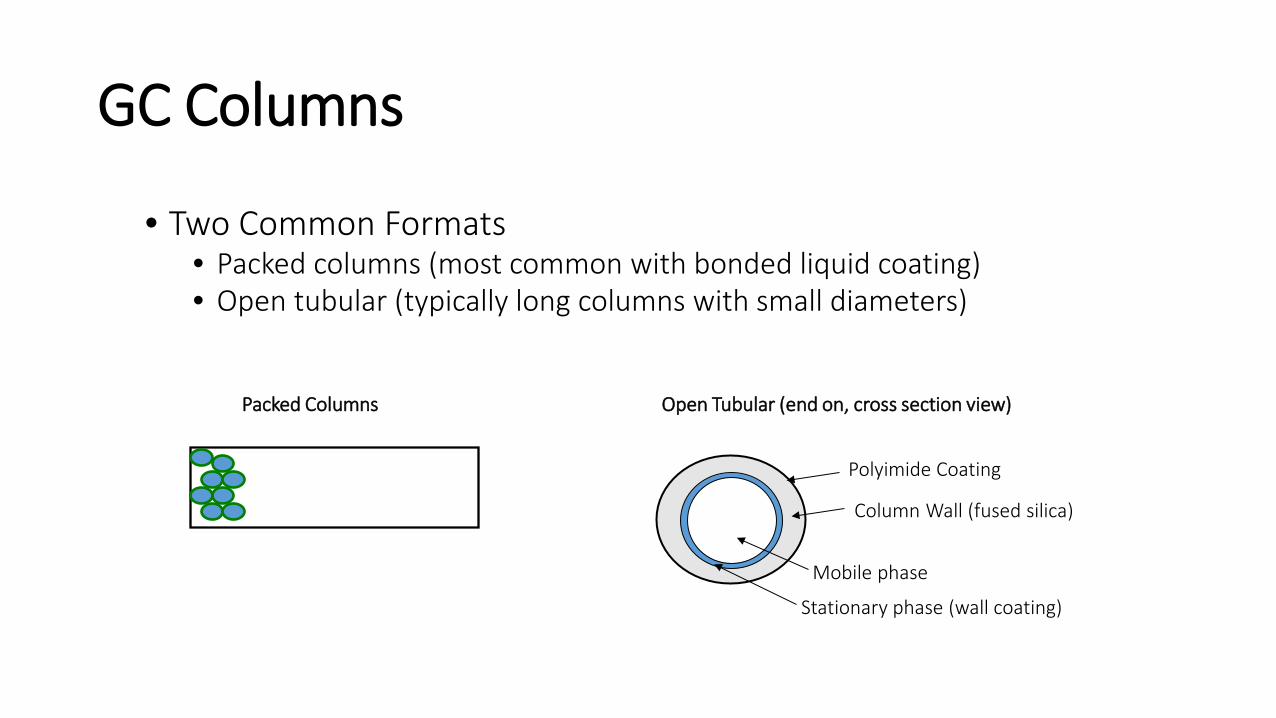
• Two Common Formats • Packed columns (most common with bonded liquid coating) • Open tubular (typically long columns with small diameters)
Packed Columns Open Tubular (end on, cross section view)
Column Wall (fused silica)
Mobile phase
Stationary phase (wall coating)
Polyimide Coating
• Advantages of Open Tubular Columns • Best resolution (negligible A term, small C term in Van Deemter Equation) • More robust • Better sensitivity with many detectors (due to less band broadening vs. lower
mass through column)
• Column Selection • High resolution (thin film, 0.25 mm diameter, 60 m) vs. higher capacity (thick
film, 0.53 mm diameter) • Stationary phase based on polarity
GC Columns
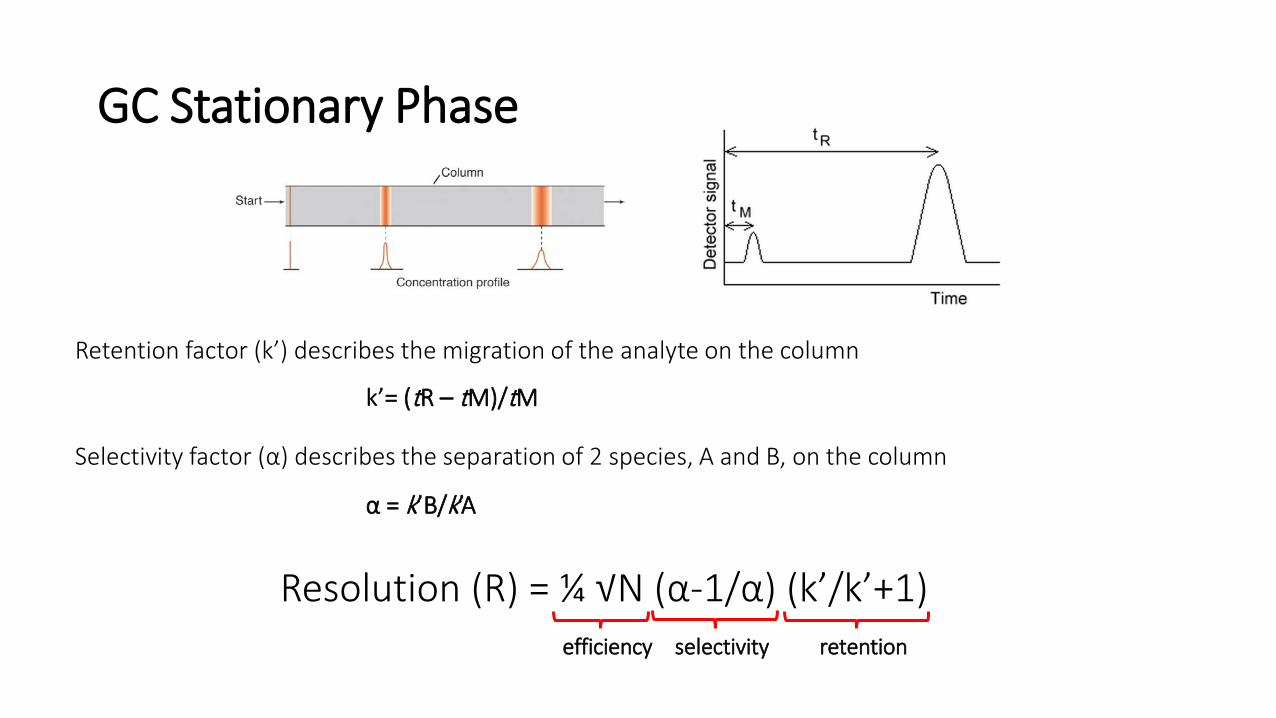
GC Stationary Phase
Selectivity factor (α) describes the separation of 2 species, A and B, on the column
Retention factor (k’) describes the migration of the analyte on the column
k’= (tR – tM)/tM
α = k’B/k’A
Resolution (R) = ¼ √N (α-1/α) (k’/k’+1) efficiency selectivity retention

GC Adjustments • k is adjusted by changing temperature (higher T means smaller k)
• Selection of stationary phase affects k and α values • The α values are adjusted by changing column (will work if there is a difference in solute polarity)
• example: separation of saturated and unsaturated fatty acid methyl esters (FAMEs).
• Retention of C18:0 and C18:1 FAMEs on RTX-5MS columns is very similar (due to similar boiling points) • Retention on more polar columns (RTX-50MS) is greater for the more polar unsaturated FAMEs
• Main concerns of stationary phase are: polarity, functional groups, maximum operating temperature, and column bleed (loss of stationary phase)
• More polar columns suffer from lower maximum temperatures and greater column bleed-derivatize? • Changing carrier gas has no effect on retention
O
CH3
O CH3
O
CH3
O CH3
C18:0 FAME
C18:1 FAME
bp = 369°C
bp = 352°C
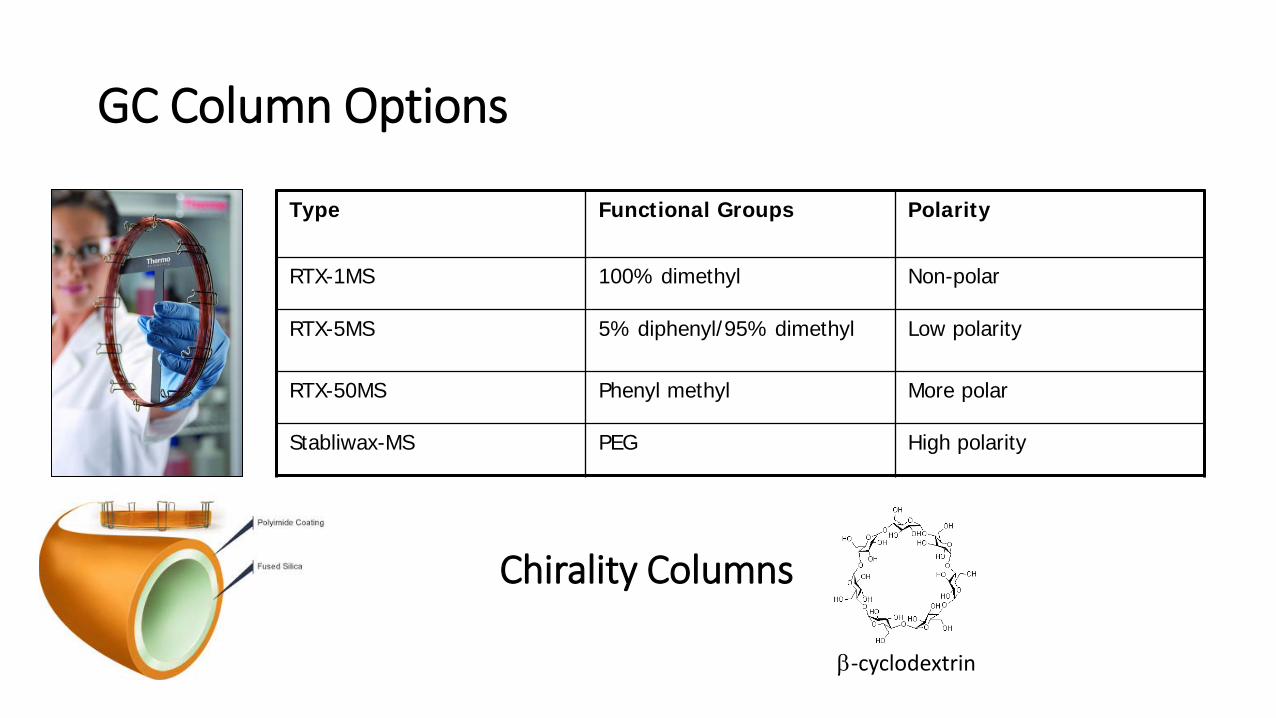
Type Functional Groups Polarity
RTX-1MS 100% dimethyl Non-polar
RTX-5MS 5% diphenyl/95% dimethyl Low polarity
RTX-50MS Phenyl methyl More polar
Stabliwax-MS PEG High polarity
GC Column Options
Chirality Columns
β-cyclodextrin
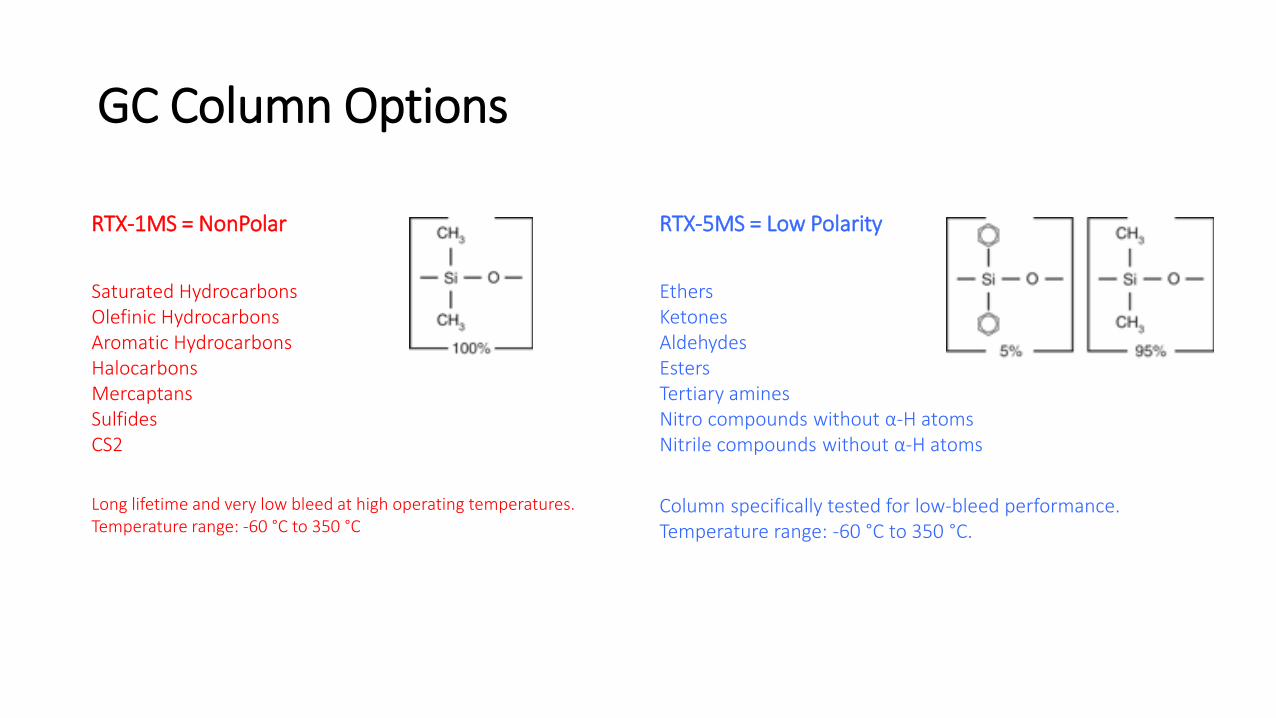
RTX-5MS = Low Polarity RTX-1MS = NonPolar
GC Column Options
Saturated Hydrocarbons Olefinic Hydrocarbons Aromatic Hydrocarbons Halocarbons Mercaptans Sulfides CS2
Long lifetime and very low bleed at high operating temperatures. Temperature range: -60 °C to 350 °C
Ethers Ketones Aldehydes Esters Tertiary amines Nitro compounds without α-H atoms Nitrile compounds without α-H atoms
Column specifically tested for low-bleed performance. Temperature range: -60 °C to 350 °C.
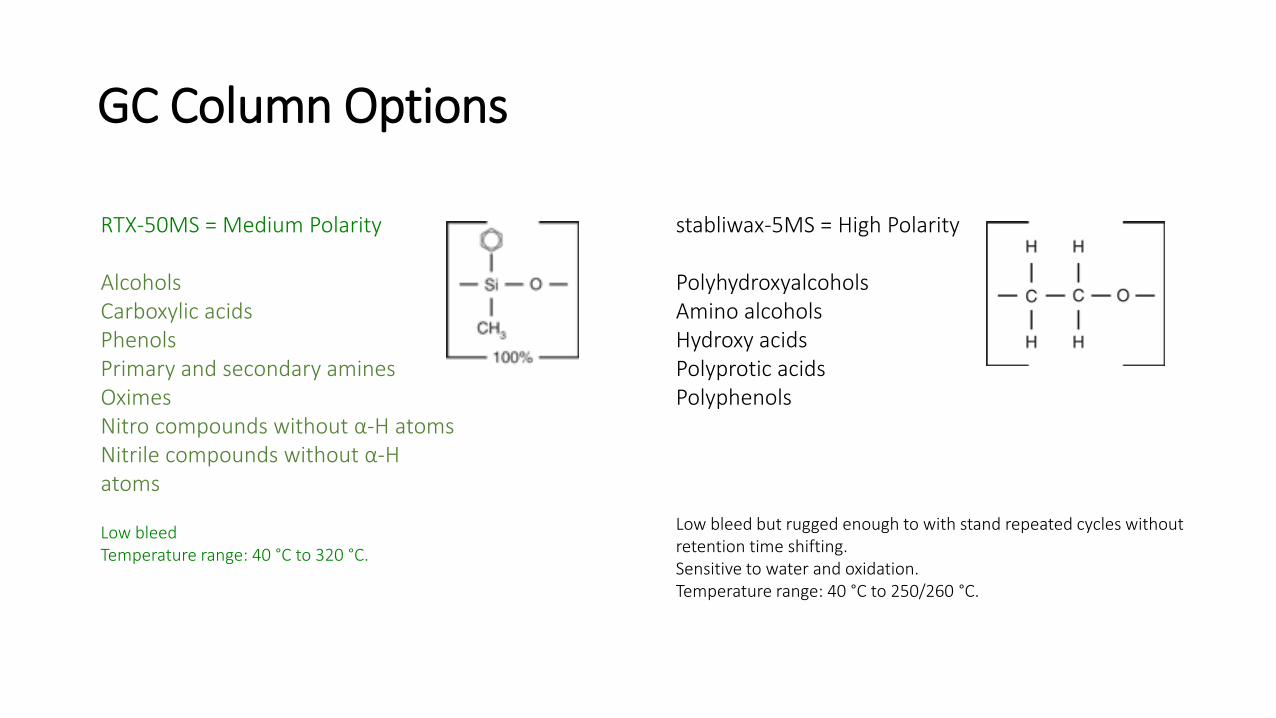
RTX-50MS = Medium Polarity stabliwax-5MS = High Polarity
GC Column Options
Alcohols Carboxylic acids Phenols Primary and secondary amines Oximes Nitro compounds without α-H atoms Nitrile compounds without α-H atoms
Polyhydroxyalcohols Amino alcohols Hydroxy acids Polyprotic acids Polyphenols
Low bleed but rugged enough to with stand repeated cycles without retention time shifting. Sensitive to water and oxidation. Temperature range: 40 °C to 250/260 °C.
Low bleed Temperature range: 40 °C to 320 °C.

http://www.omicsonline.org/open-access/gc-ms-technique-and-its-analytical-applications-in-science-and-technology-2155-9872.1000222.pdf
- Environmental monitoring - Food, beverage, flavor, and fragrance analysis - Forensic and criminal cases - Biological and pesticides detection - Fermentation control - Security and chemical warfare agent detection - Astro chemistry and Geo chemical research - Medicine and Pharmaceutical Applications - Petrochemical and hydrocarbon analysis - Clinical toxicology - Energy and fuel applications - Industrial use - Academics
GC-MS Applications
confirmation test

GC-MS Projects in the MS&P
https://www.youtube.com/watch?v=7yxWBOPNkJ8

GC-Chromatogram
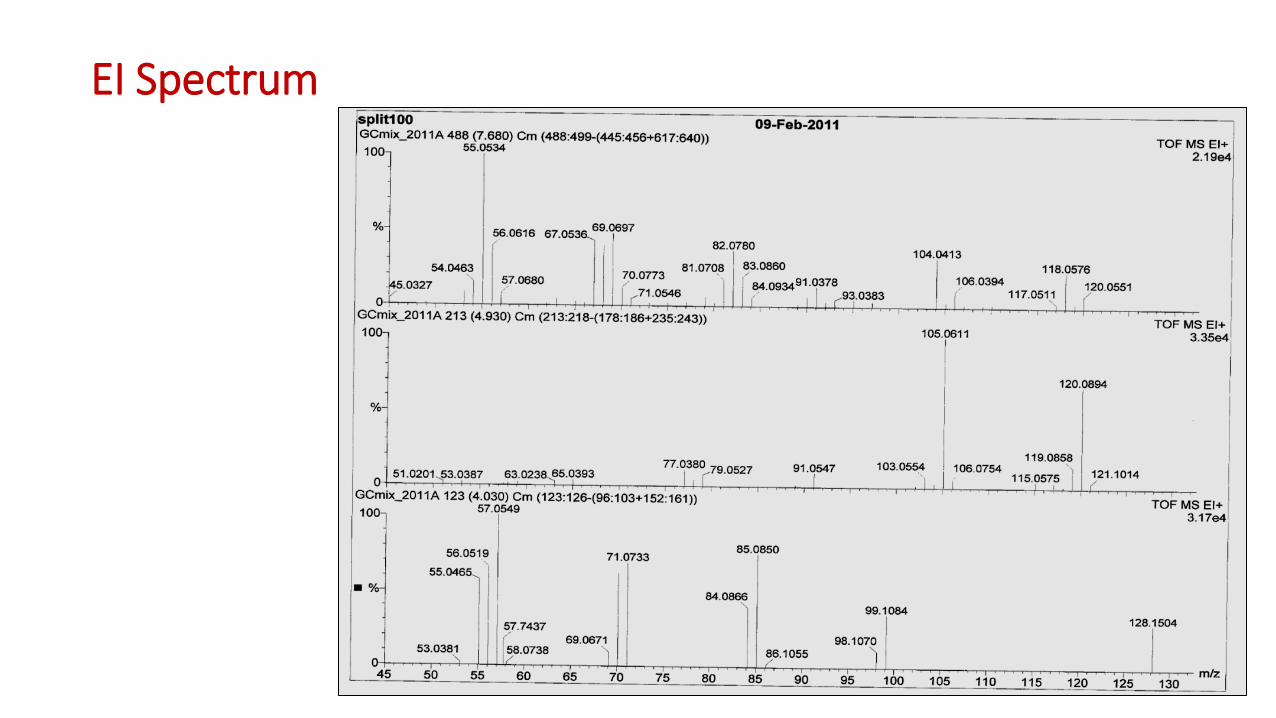
EI Spectrum
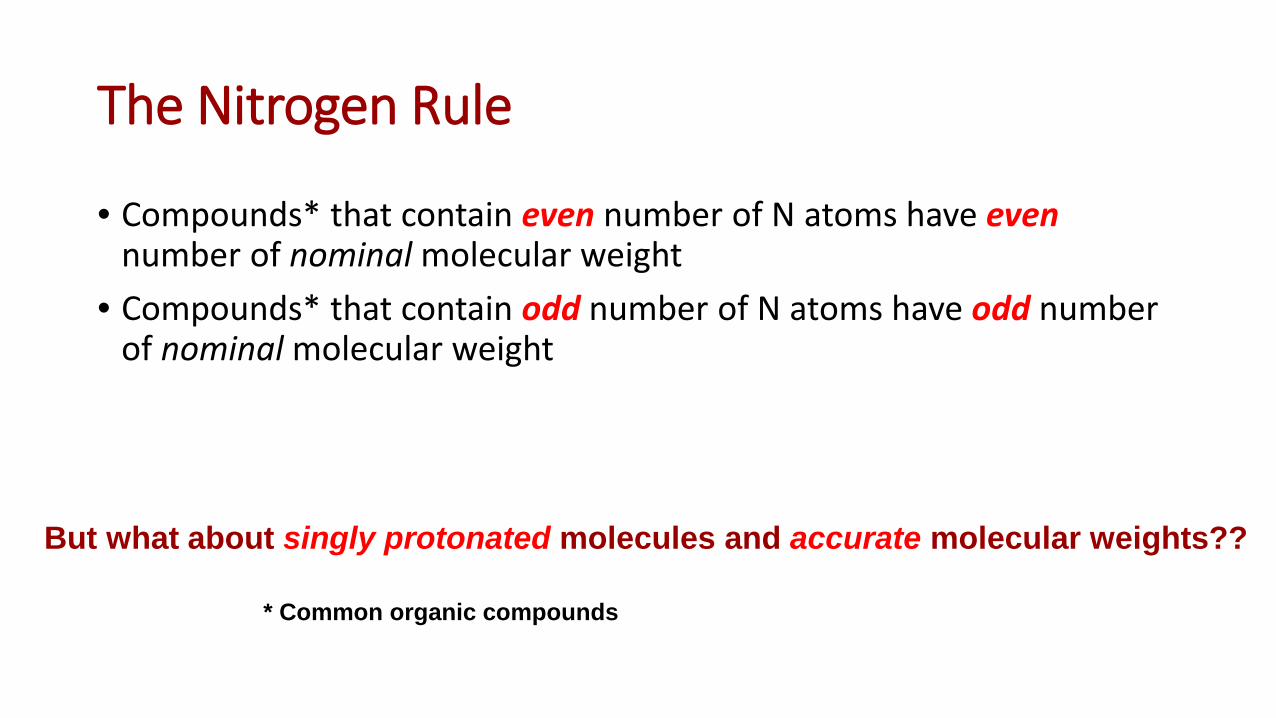
The Nitrogen Rule
• Compounds* that contain even number of N atoms have even number of nominal molecular weight
• Compounds* that contain odd number of N atoms have odd number of nominal molecular weight
But what about singly protonated molecules and accurate molecular weights??
* Common organic compounds
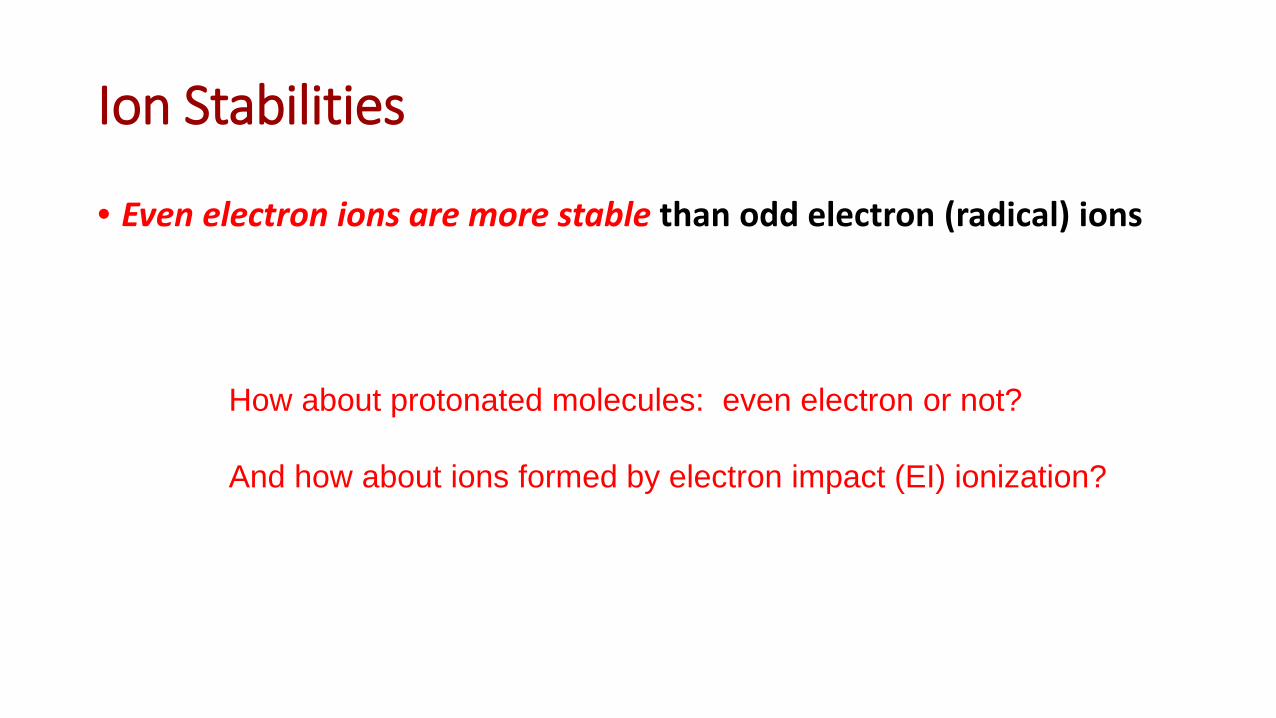
Ion Stabilities
• Even electron ions are more stable than odd electron (radical) ions
How about protonated molecules: even electron or not? And how about ions formed by electron impact (EI) ionization?
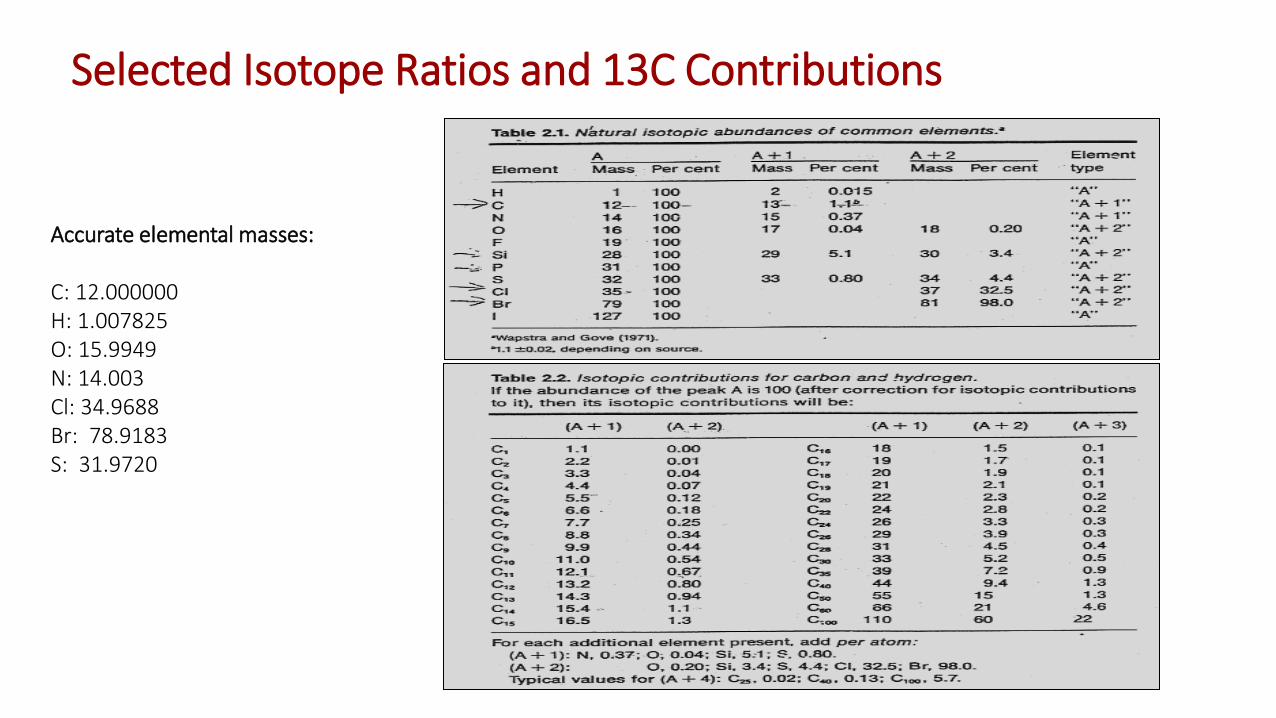
Accurate elemental masses: C: 12.000000 H: 1.007825 O: 15.9949 N: 14.003 Cl: 34.9688 Br: 78.9183 S: 31.9720
Selected Isotope Ratios and 13C Contributions
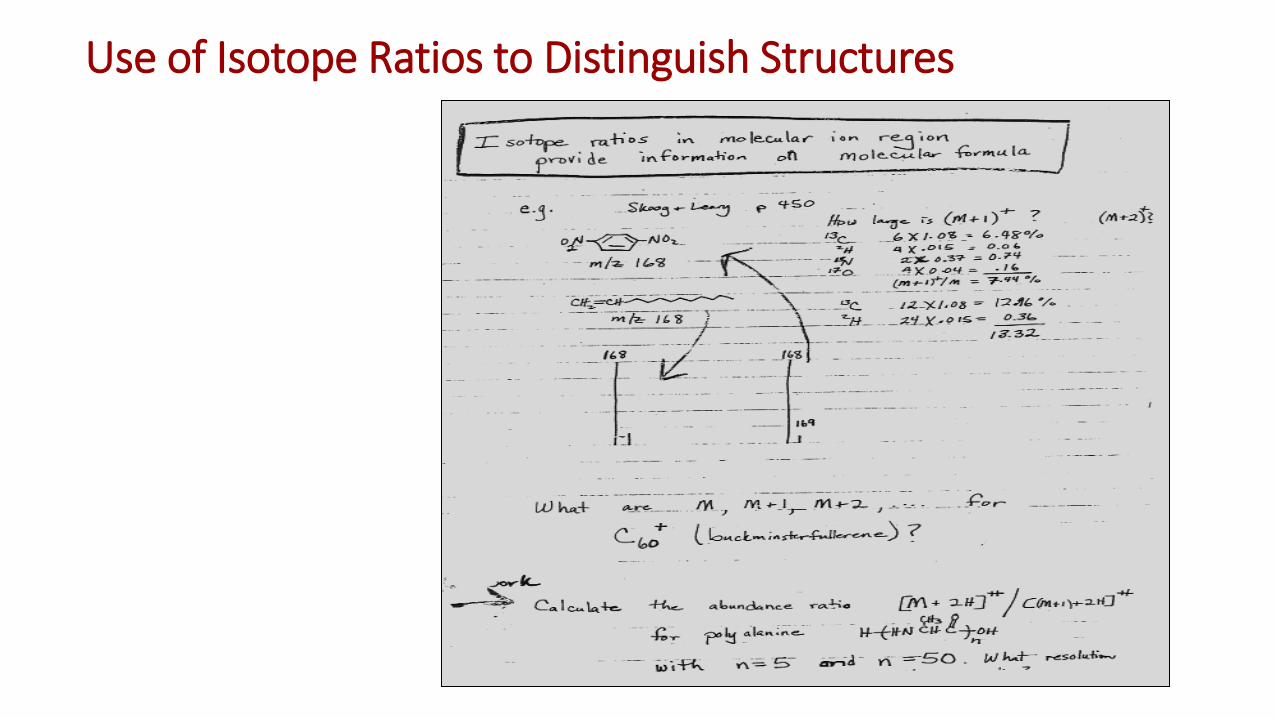
Use of Isotope Ratios to Distinguish Structures
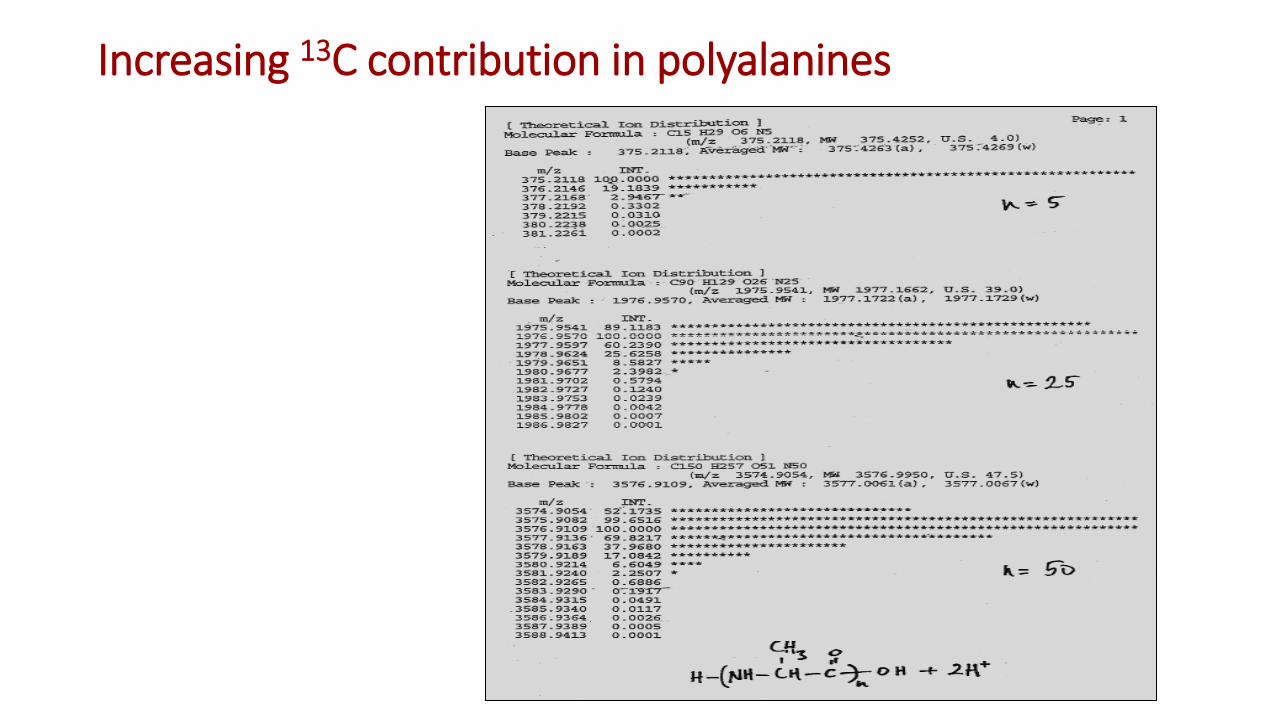
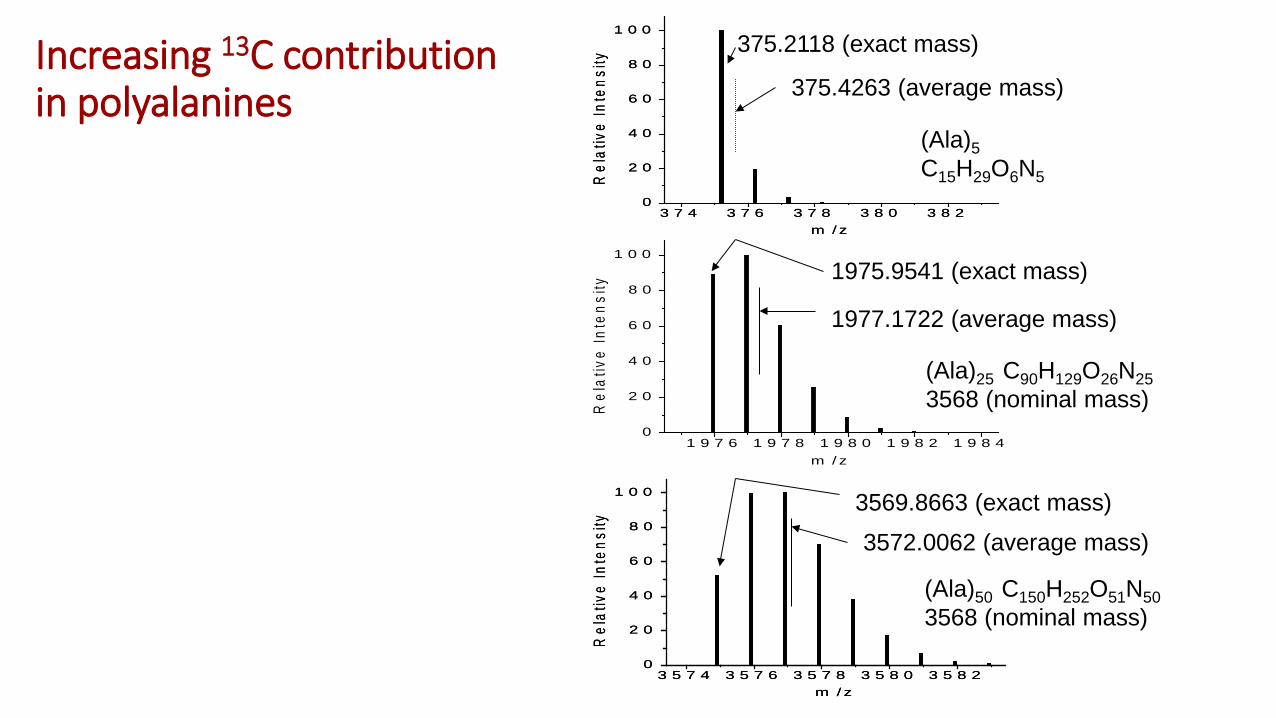
Increasing 13C contribution in polyalanines
3 5 7 4 3 5 7 6 3 5 7 8 3 5 8 0 3 5 8 20
2 0
4 0
6 0
8 0
1 0 0
Rel
ativ
e In
tens
ity
m / z
3 7 4 3 7 6 3 7 8 3 8 0 3 8 20
2 0
4 0
6 0
8 0
1 0 0
Rel
ativ
e In
tens
ity
m / z
(Ala)5 C15H29O6N5
375.2118 (exact mass)
375.4263 (average mass)
3 5 7 4 3 5 7 6 3 5 7 8 3 5 8 0 3 5 8 20
2 0
4 0
6 0
8 0
1 0 0
Rel
ativ
e In
tens
ity
m / z
3 7 4 3 7 6 3 7 8 3 8 0 3 8 20
2 0
4 0
6 0
8 0
1 0 0
Rel
ativ
e In
tens
ity
m / z
1 9 7 6 1 9 7 8 1 9 8 0 1 9 8 2 1 9 8 40
2 0
4 0
6 0
8 0
1 0 0
Rel
ativ
e In
tens
ity
m / z
1975.9541 (exact mass)
1977.1722 (average mass)
3569.8663 (exact mass)
3572.0062 (average mass)
(Ala)50 C150H252O51N50 3568 (nominal mass)
(Ala)25 C90H129O26N25 3568 (nominal mass)
Increasing 13C contribution in polyalanines
3 7 4 3 7 6 3 7 8 3 8 0 3 8 20
2 0
4 0
6 0
8 0
1 0 0
Re
lati
ve
In
ten
sit
y
m / z
3 5 7 0 3 5 7 2 3 5 7 4 3 5 7 6 3 5 7 80
2 0
4 0
6 0
8 0
1 0 0
Re
lati
ve
In
ten
sit
y
m / z
a
b
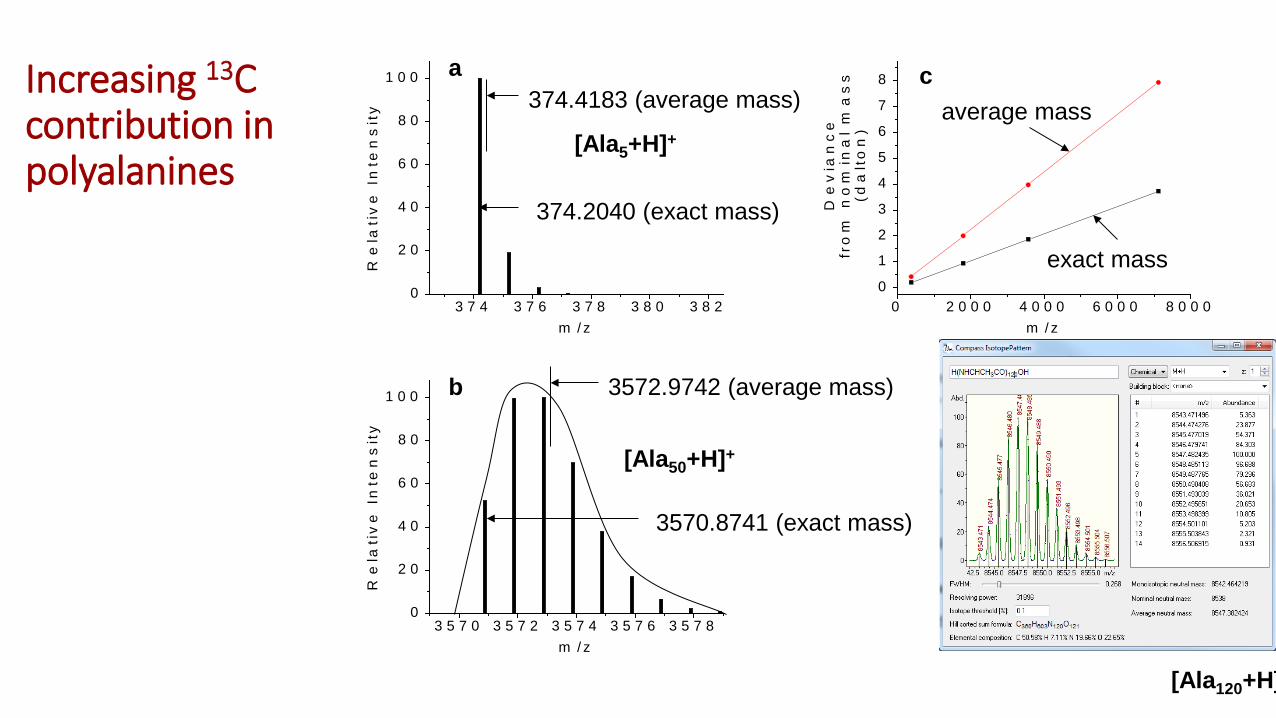
374.4183 (average mass)
374.2040 (exact mass)
3570.8741 (exact mass)
3572.9742 (average mass)
0 2 0 0 0 4 0 0 0 6 0 0 0 8 0 0 00
1
2
3
4
5
6
7
8
De
via
nc
efr
om
no
min
al
ma
ss
(da
lto
n)
m / z
c
[Ala5+H]+
[Ala50+H]+
exact mass
average mass
[Ala120+H]
Increasing 13C contribution in polyalanines
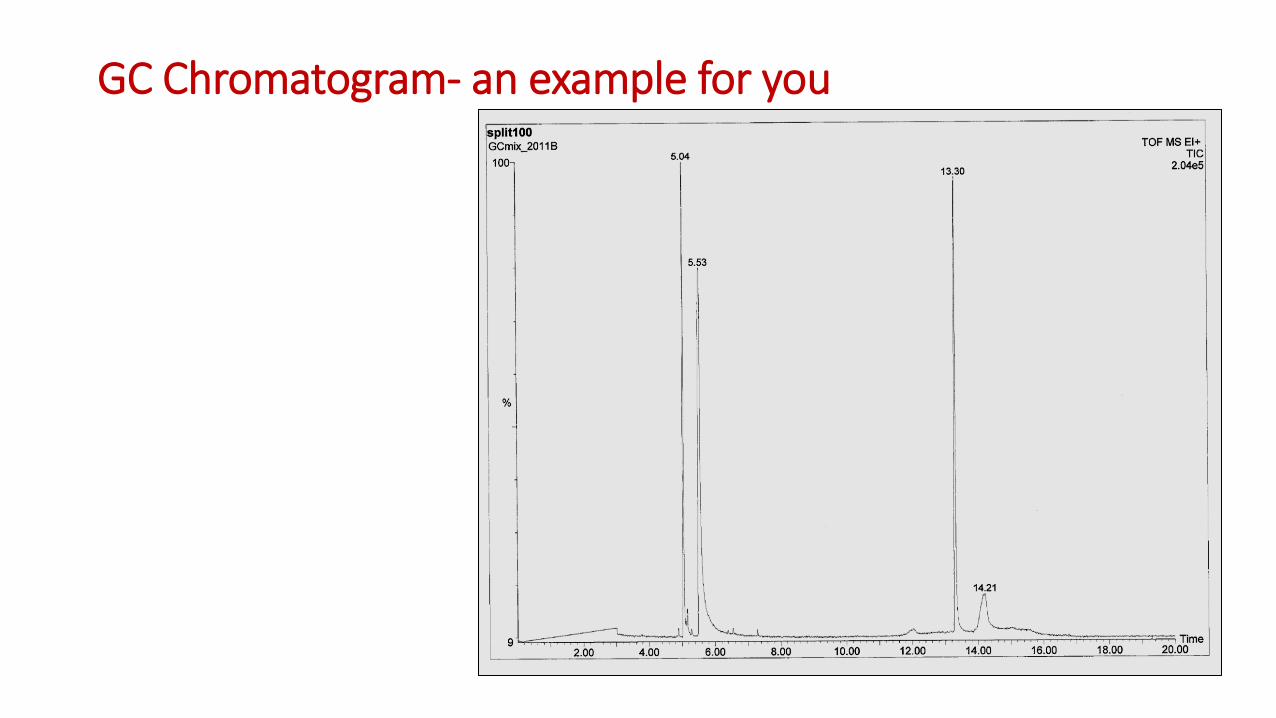
GC Chromatogram- an example for you

EI Spectrum- give the top and bottom a try

Characteristic Isotope Distribution of Selected Transition Metal Elements

255
190 Origin of m/z 190?
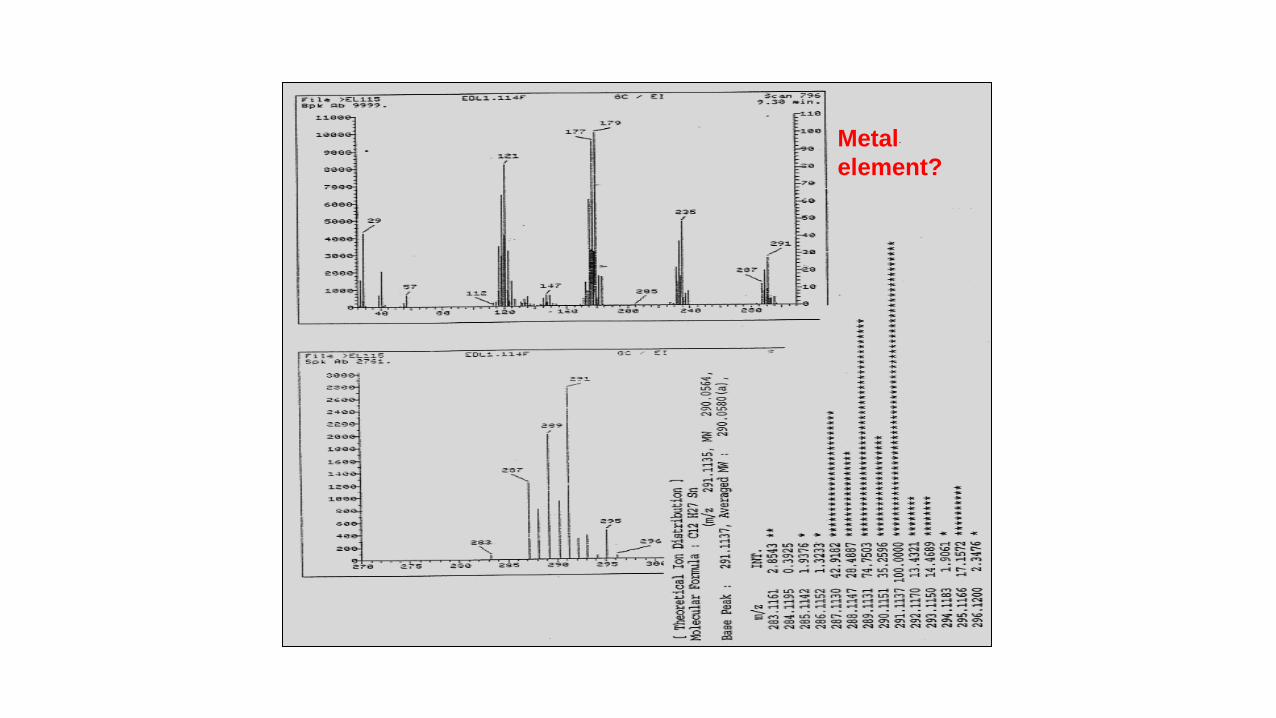
Metal element?
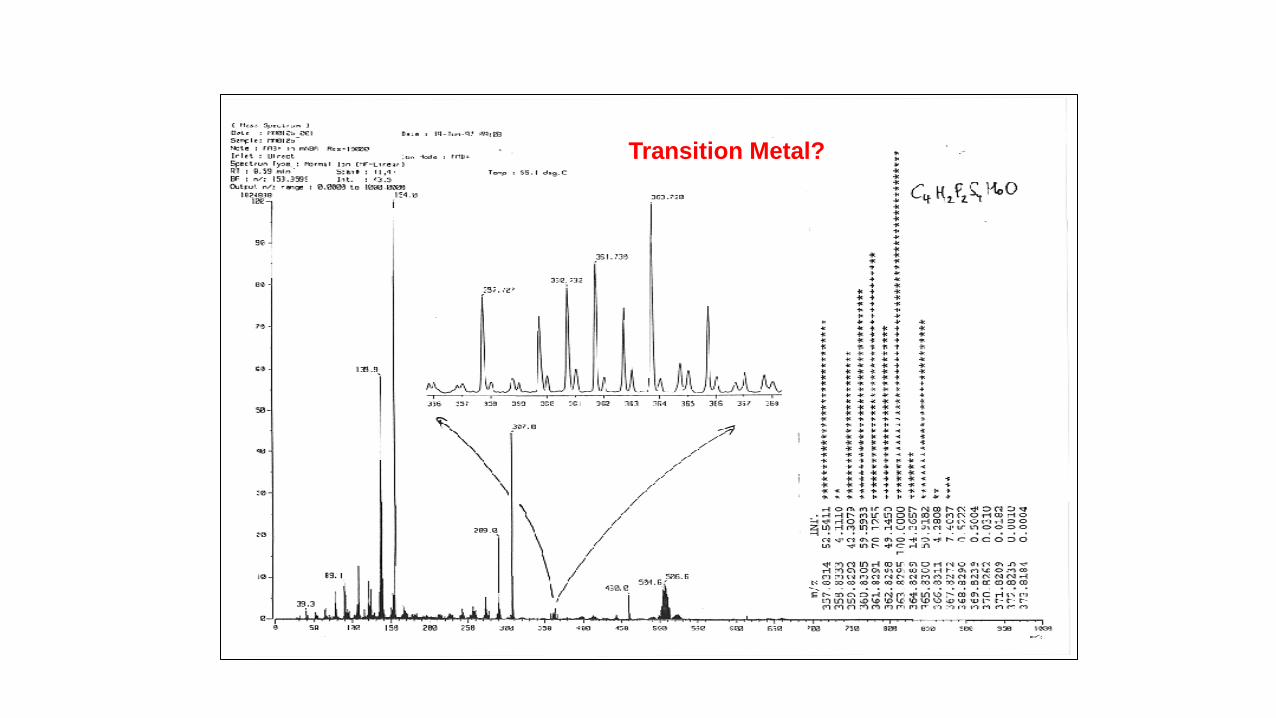
Transition Metal?

Isotope Ratios to Identify Chemical Compositions…No Accurate Mass!
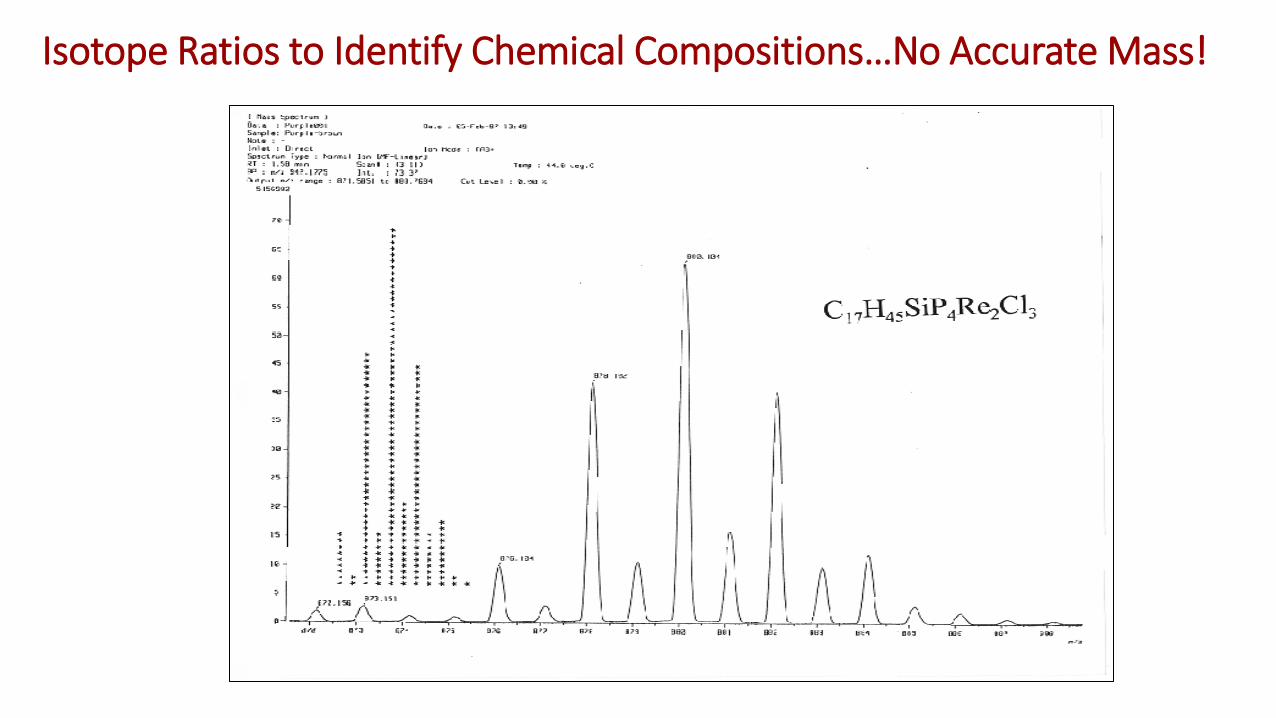
Isotope Ratios to Identify Chemical Compositions…No Accurate Mass!
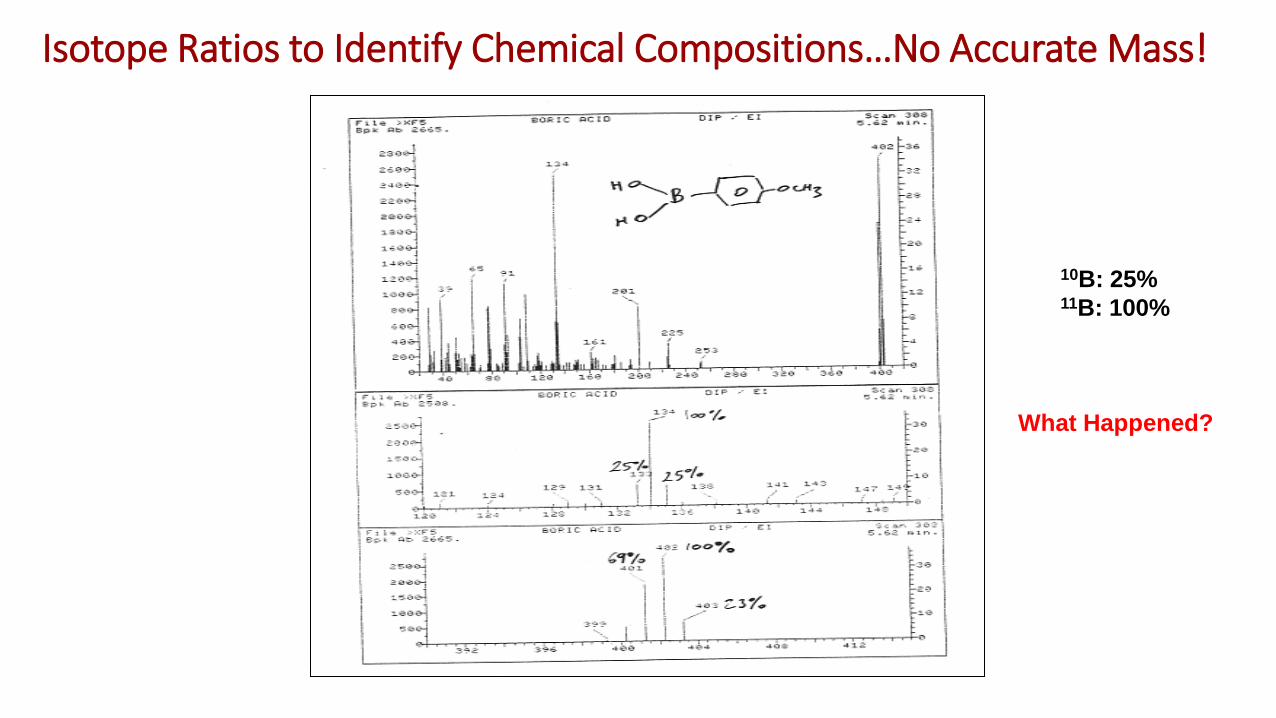
What Happened?
10B: 25% 11B: 100%
Isotope Ratios to Identify Chemical Compositions…No Accurate Mass!
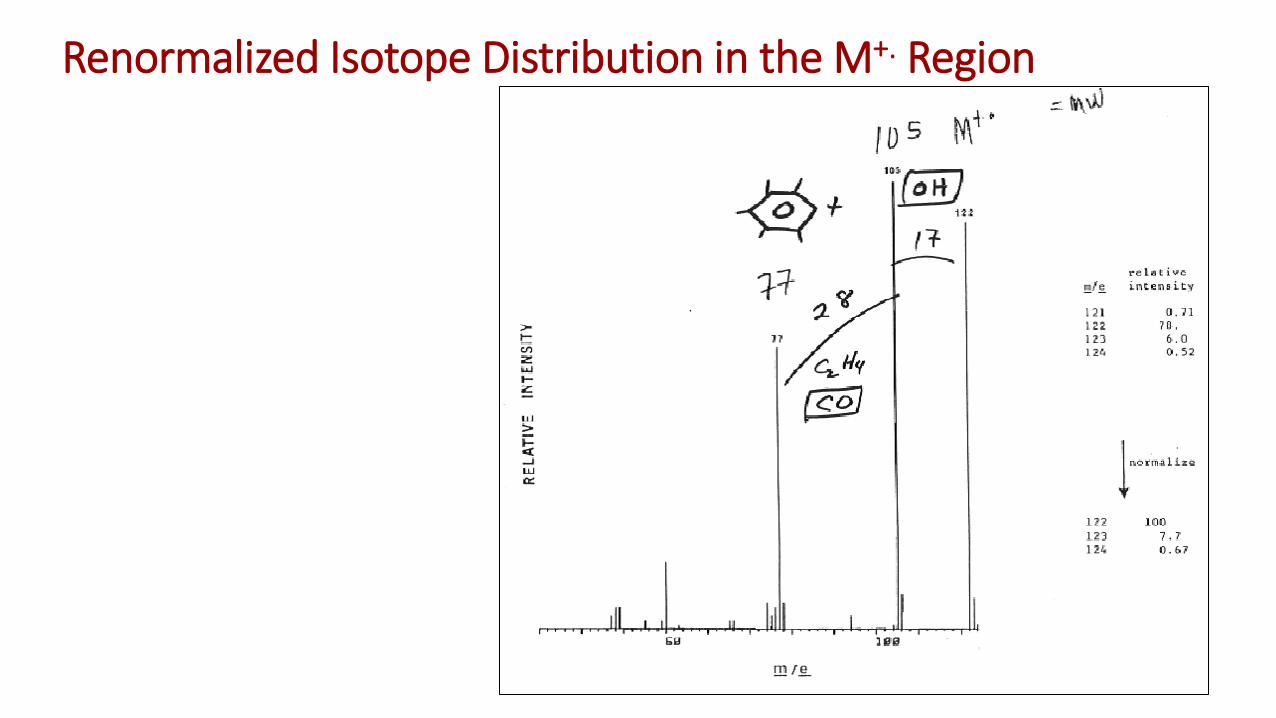
Renormalized Isotope Distribution in the M+. Region

86
43
15
182
105
77
Try these!!
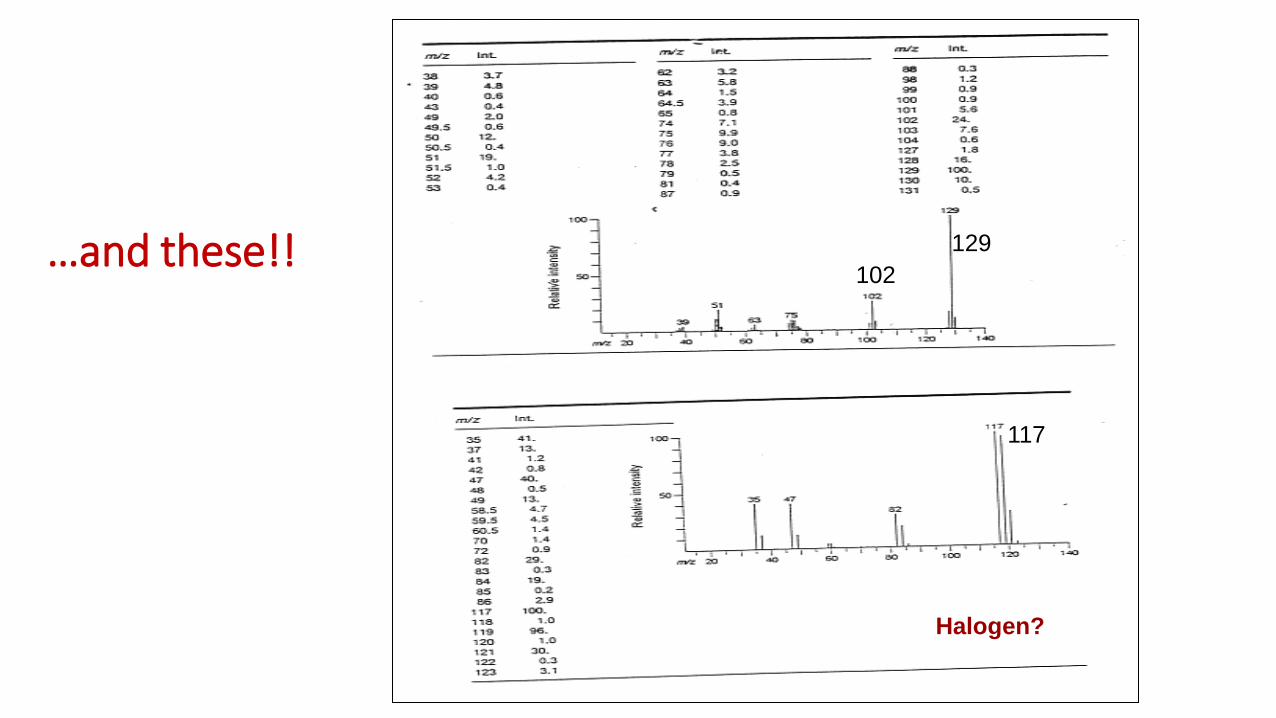
129 102
117
Halogen?
…and these!!
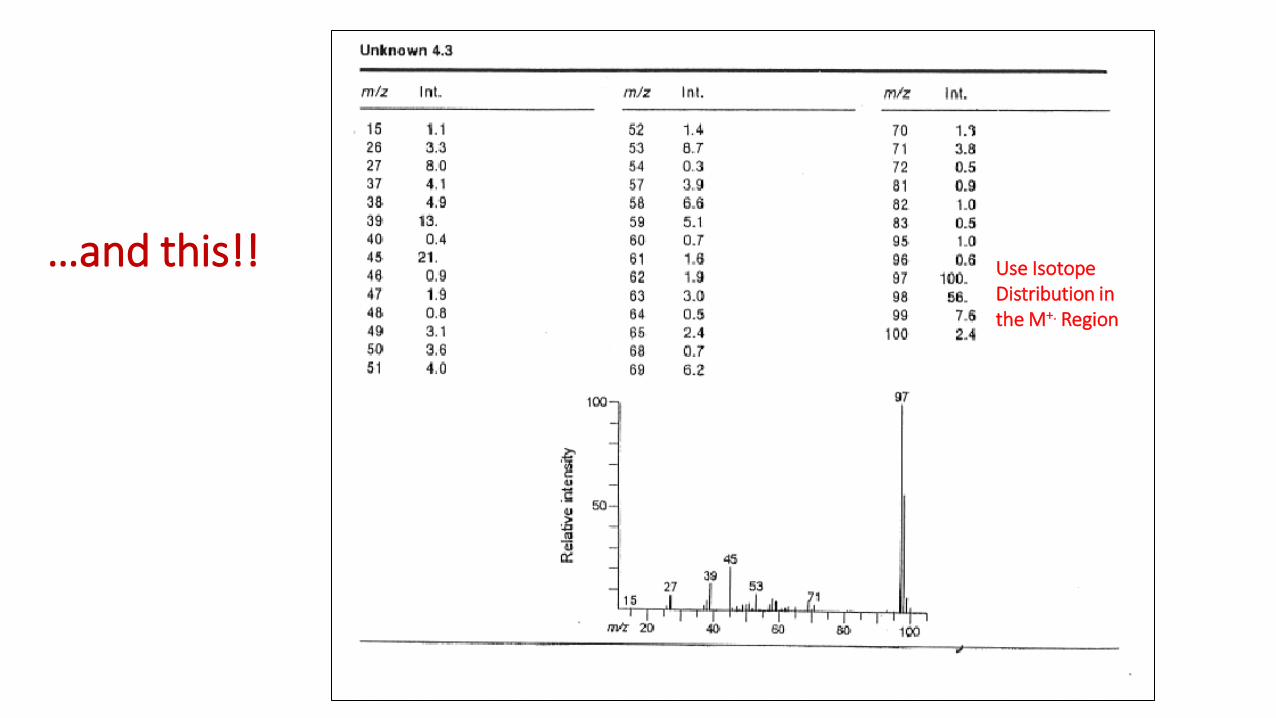
…and this!! Use Isotope Distribution in the M+. Region

…and these!!

GC-MS Projects in the MS&P
https://www.youtube.com/watch?v=7yxWBOPNkJ8

Untargeted GC-MS Analysis of Spider Silk Droppings -the hunt for hormones

Untargeted GC-MS Analysis of Plants Exposed to Crude Oil
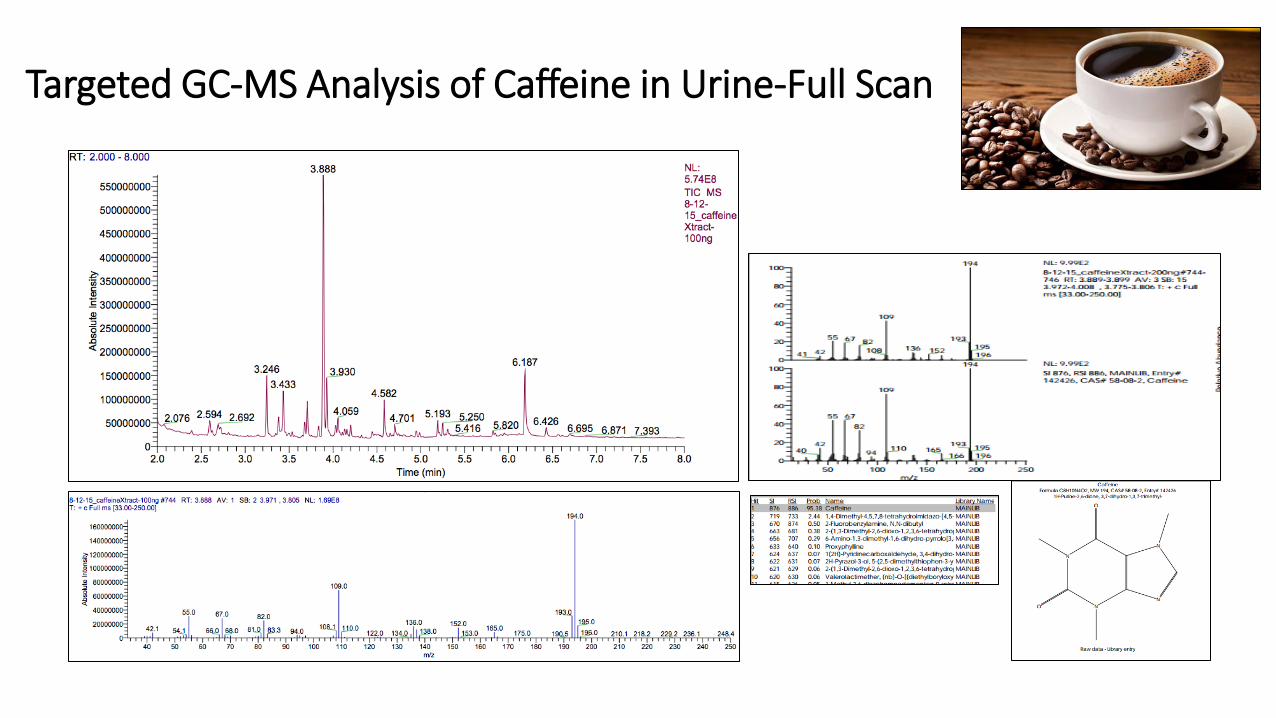
Targeted GC-MS Analysis of Caffeine in Urine-Full Scan

Targeted GC-MS Analysis of Caffeine in Urine-SIM
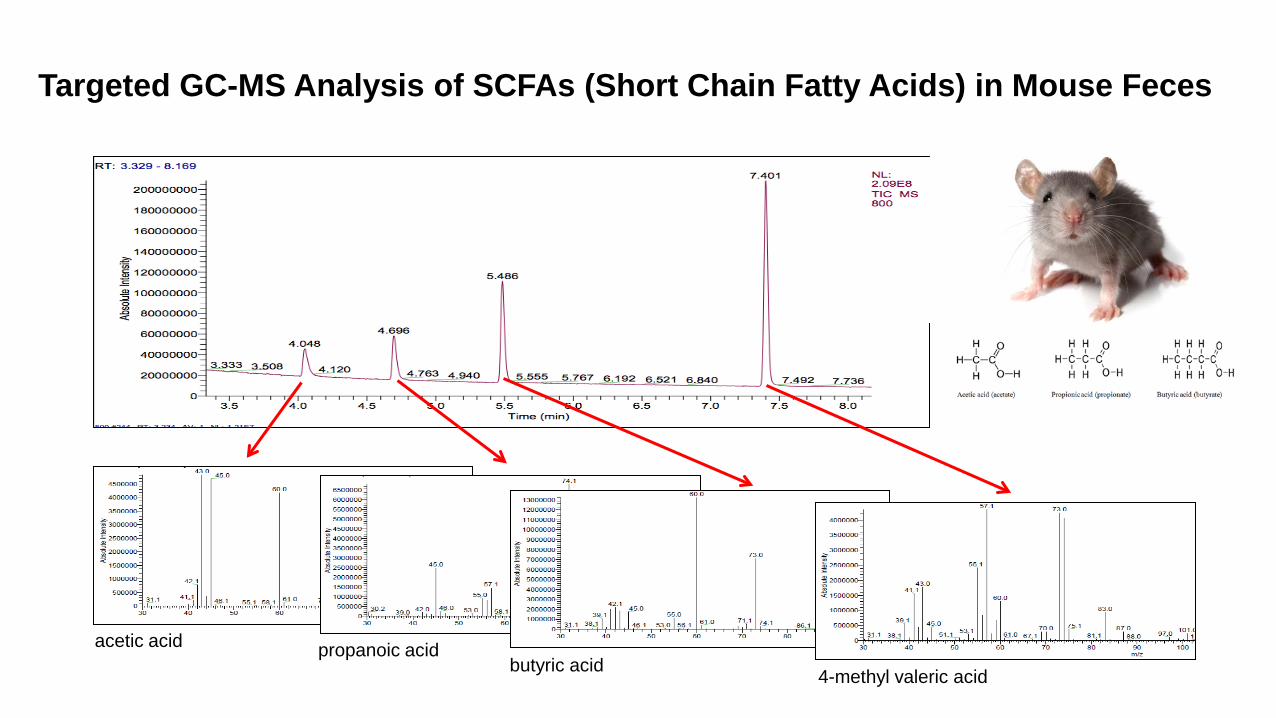
Targeted GC-MS Analysis of SCFAs (Short Chain Fatty Acids) in Mouse Feces
acetic acid propanoic acid butyric acid 4-methyl valeric acid

Quantitative GC-MS Analysis with Xcalibur
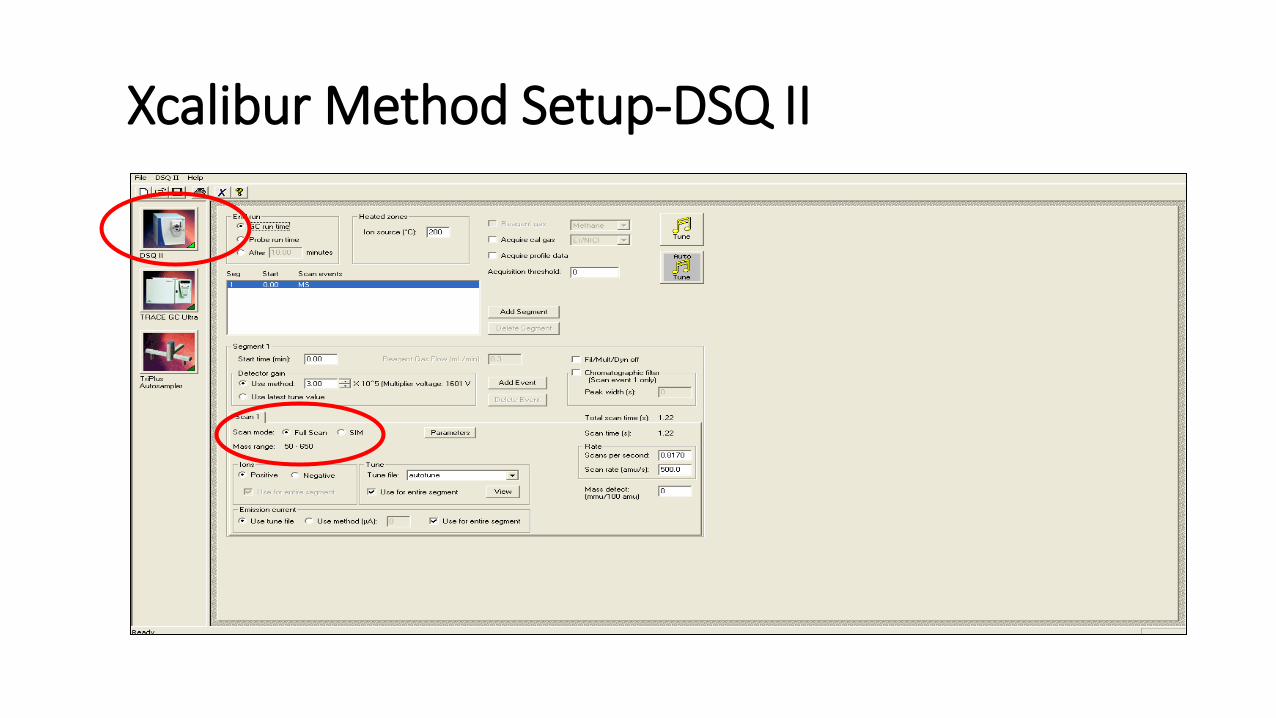
Xcalibur Method Setup-DSQ II

Xcalibur Method Setup-Trace GC Ultra
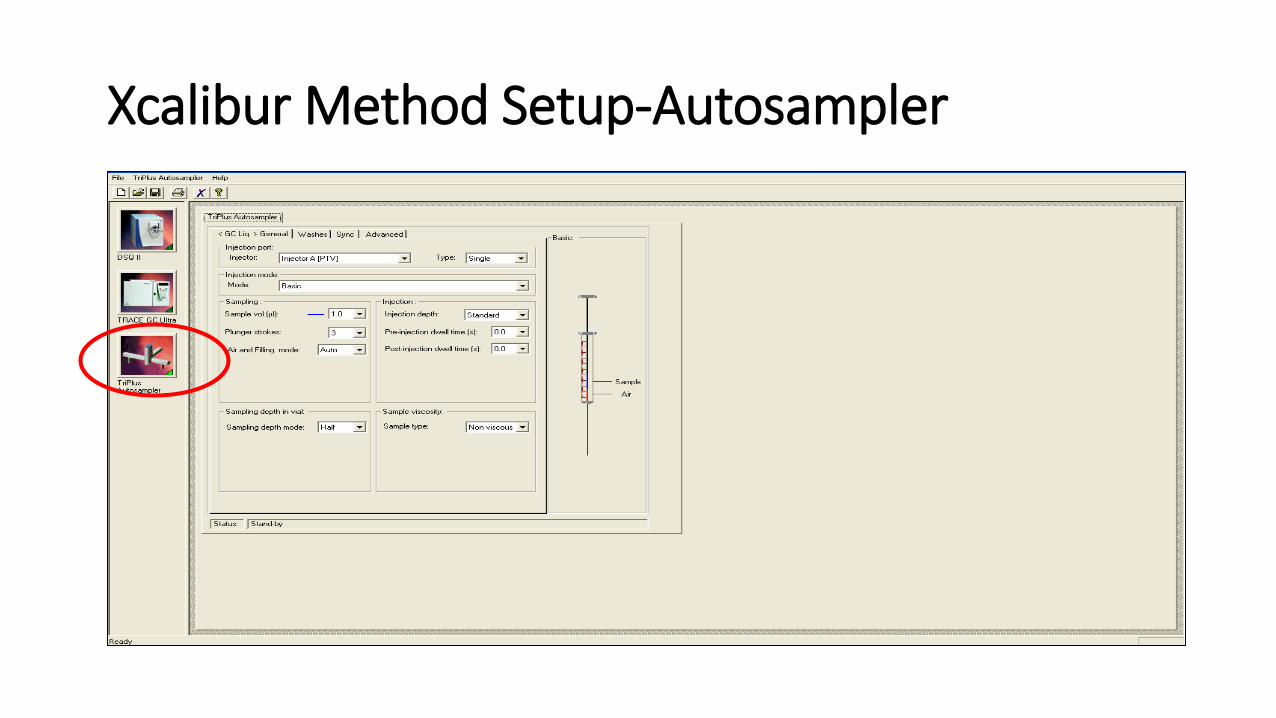
Xcalibur Method Setup-Autosampler

Xcalibur Processing Method Setup

Xcalibur Processing Method Setup-Identification
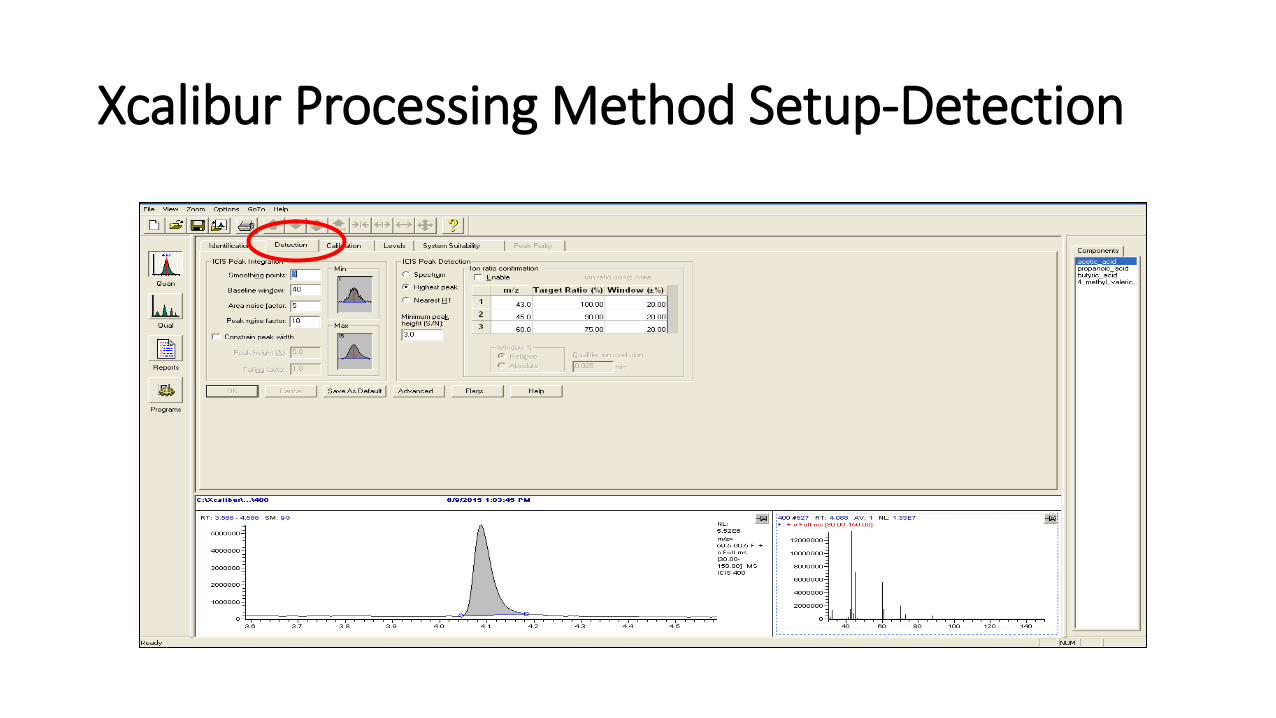
Xcalibur Processing Method Setup-Detection
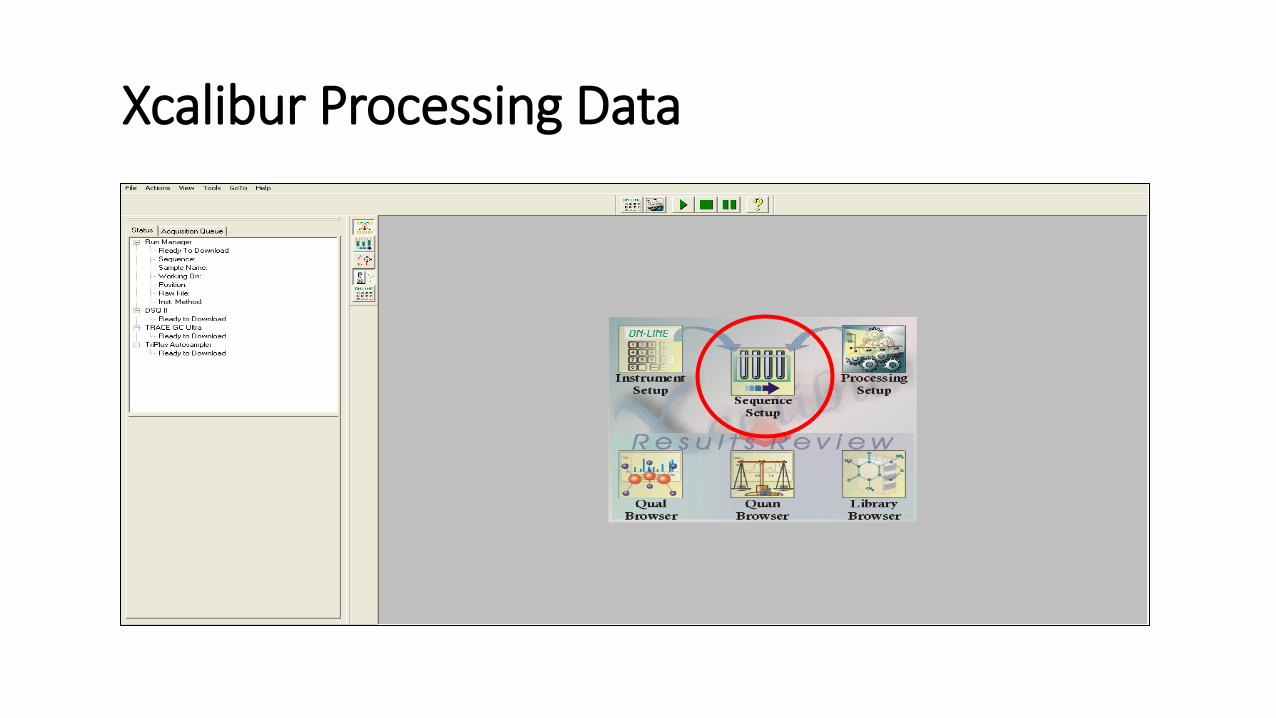
Xcalibur Processing Data

Xcalibur Processing Data
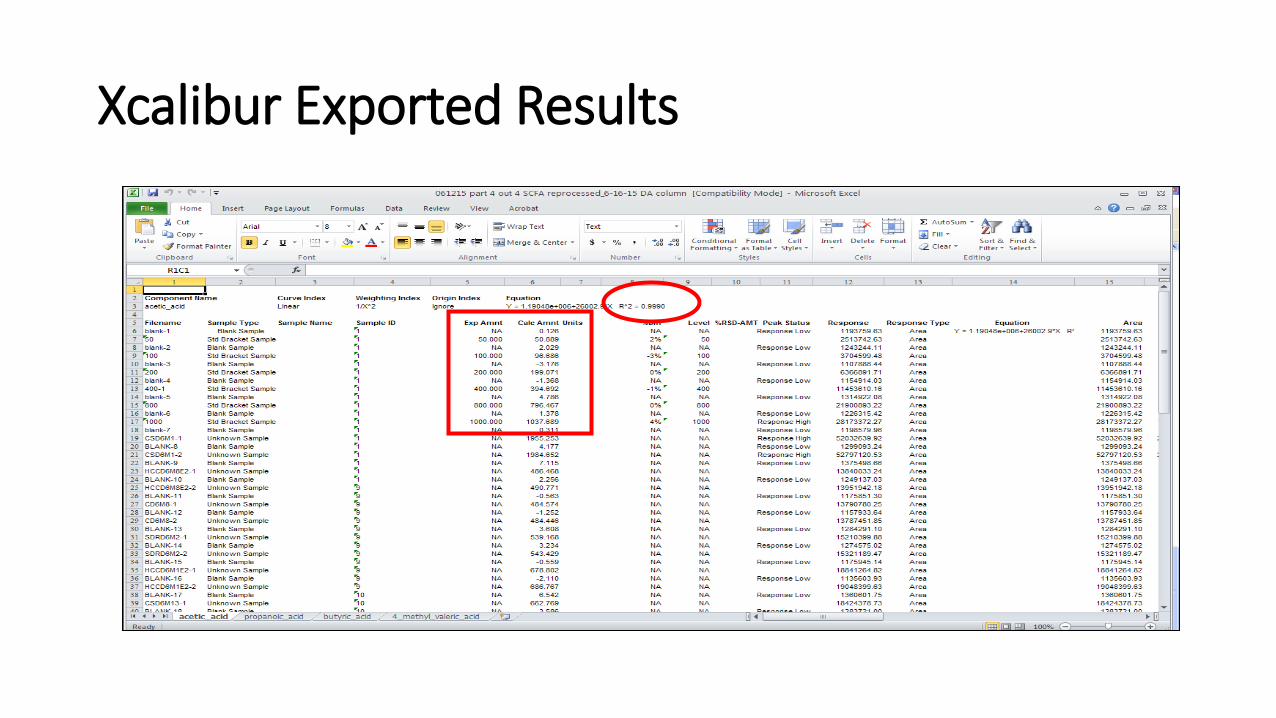
Xcalibur Exported Results

Make Discoveries
0
100
200
300
400
500
600
700
y = 118779x - 3E+06 R² = 0.9991
0
20000000
40000000
60000000
80000000
100000000
120000000
140000000
0 200 400 600 800 1000 1200