gas chromatography - amazon s3 · 510 chapter 21 • gas chromatography created by others that made...
TRANSCRIPT

507
Chapter Outline21.1 Introduction: There’s Something in the Air
21.1A What Is Gas Chromatography?21.1B How Is Gas Chromatography Performed?
21.2 Factors that Affect Gas Chromatography21.2A Requirements for the Analyte21.2B Factors that Determine Retention in Gas Chromatography21.2C Column Efficiency in Gas Chromatography
21.3 Gas Chromatography, Mobile Phases, and Elution Methods21.3A Common Mobile Phases in Gas Chromatography21.3B Elution Methods in Gas Chromatography
21.4 Gas Chromatography Supports and Stationary Phases21.4A Gas Chromatography Support Materials21.4B Gas Chromatography Stationary Phases
21.5 Gas Chromatography Detectors and Sample Handling21.5A Types of Gas Chromatography Detectors21.5B Sample Injection and Pretreatment
Chapter 21
Gas Chromatography
21.1 INTRODUCTION: THERE’S SOMETHING INTHE AIRNews Release—Mexico City, March 31, 2006—“MexicoCity a Living Laboratory for Smog Study”:
Whether this city has the most polluted air in theworld is a matter of debate: indignant Mexicanofficials lobbied to have it striken from the GuinnessBook of World Records this year after it held the titletwo years running. What’s not in question is itsattraction to the hundreds of atmospheric scientistswho are wrapping up a monthlong study of the reachand impact of Mexico City’s pollution.... Scientistsand graduate students have been working 14-hourdays to measure the giant plume of gases, dust andparticles that rise out of Mexico City each day andgenerally drift to the northeast, sometimes as far asthe Gulf of Mexico. Over the course of hours, theemissions mix and are altered by sunlight to createso-called secondary pollutants—some only irritating,others carcinogenic. Using instrument readings fromground equipment, weather balloons, airplanes andNASA satellites, scientists hope to figure out howthey form and how far they travel.1
Problems with smog and air pollution have become com-mon in modern cities and developing nations.2,3 Smog isformed through the reaction of nitrogen oxides with
volatile organic compounds (VOCs), both of which areemitted when fuel is burned by automobiles, industrialplants, and homes (see Figure 21.1). VOCs are made up ofa large group of small organic compounds with boilingpoints below 200°C. These low boiling points allow suchcompounds to easily enter the atmosphere. Once VOCsare in the air, they can react with nitrogen oxides in thepresence of light to form ground-level ozone, the maincomponent of smog.4–7
There has been an ongoing effort in the UnitedStates and Europe to monitor and reduce the causes ofsmog and air pollution. Similar programs are appearingin Mexico and other countries. These programs havehelped to improve air quality in the United States,2 butthere is still a need for worldwide progress in this area.1,3
A crucial part of this effort has been the use of analyticalmethods to monitor the sources of smog and to deter-mine the levels of ozone, nitrogen oxides, and VOCs inair. In this chapter, we will examine the technique of gaschromatography (GC), which is an important tool forexamining VOCs and other volatile chemicals.
21.1A What Is Gas Chromatography?Gas chromatography (GC) is a type of chromatographyin which the mobile phase is a gas.8 The presence of a gasmobile phase makes GC valuable for separating sub-stances like VOCs that occur naturally as gases or that caneasily be placed into a gaseous phase. This same feature
96943_21_ch21_p507-536 1/11/10 8:07 AM Page 507

508 Chapter 21 • Gas Chromatography
Transportation(45.8%)
Area sources(37.5%)
Naturalsources(11.4%)
Sources of NOx and volatileorganic compounds (VOCs)
Industry(5.3%)
FIGURE 21.1 A haze due to smog is present over Mexico Cityduring many days of the year. The volatile organic compounds(VOCs) and nitrogen oxides that create this smog come fromsuch sources as automobiles and public transportation, industry,fires, and natural sources. (This graph is based on data provided inS. Guzman, “Suspiro de Vida,” EJ Magazine, Fall 2003, http://www.ejmagazine.com/2003bsuspiro.html.)
(NOx)
makes GC useful for examining the many volatile chemi-cals that are of interest in fields like environmental testing,forensic analysis, and work in the petroleum industry.
21.1B How Is Gas Chromatography Performed?Figure 21.2 shows a typical system for performing GC.A system that is used to perform GC is called a gaschromatograph.9 The first major component of a gas
chromatograph is the gas source that supplies themobile phase. This source is typically a gas cylinderequipped with pressure regulators to deliver themobile phase at a controlled rate. The second part ofthe gas chromatograph is its injection system, whichoften consists of a heated loop or port into which thesample is placed and converted into a gaseous form.The third part of the system is the column. The columncontains the stationary phase and support material forthe separation of components in a sample. This columnis held in an enclosed area known as the column oventhat maintains the temperature at a well-defined value.The fourth part of the GC system is a detector, andassociated recording device, that monitors samplecomponents as they leave the column.
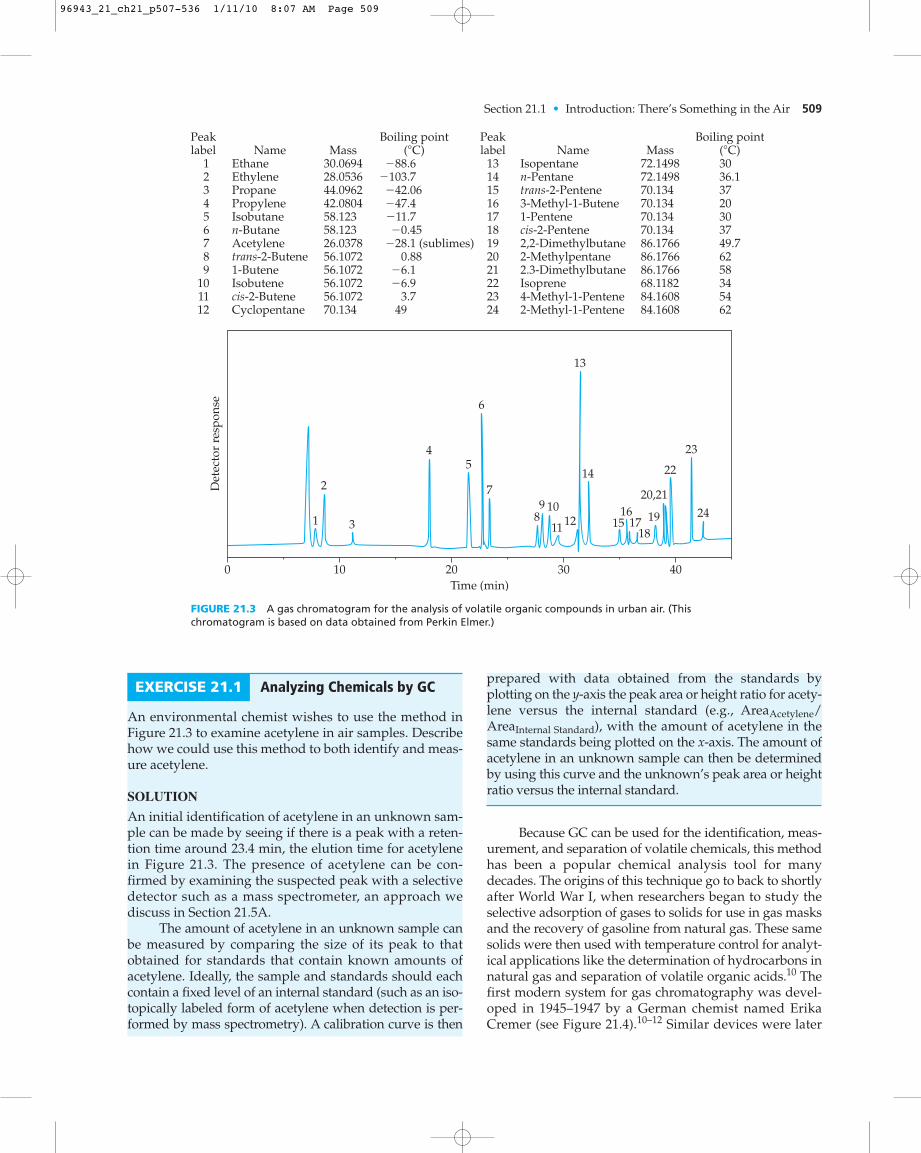
A plot of the detector response versus the time thathas elapsed since sample injection onto a GC system isknown as a gas chromatogram. An example of such a plot isgiven in Figure 21.3. In Chapter 20, we saw how a plot likethis can be used to help identify and measure the compo-nents in an injected sample. Clues to the identity of a peakcan be obtained by comparing the peak’s retention time tothat observed for the injection of a known sample of thesuspected chemical. This process can be further aided bythe use of a detector that can selectively monitor or con-firm the structure of the eluting substance, as we will seein Section 21.5A. Once a peak has been identified, theamount of analyte in this peak can be determined by com-paring the peak’s area or height to that which is obtainedfor the injections of standards that contain the same, or asimilar, analyte. An internal standard is also often used aspart of this process (see Chapter 5) to correct for variationsin analyte content that might have occurred during thesample pretreatment or injection onto the GC system.
Mobile phasesource and
flow control
DetectorFlowmeter
ColumnInjector
Column oven
Data acquisition(and control)
FIGURE 21.2 On the left, a diagram of a typical gas chromatograph and on the right an example of a commercial gas chromatograph.The image on the right does not show the mobile phase source but does include all other components of a typical GC system. (The imageof the commercial instrument is reproduced with permission from Agilent.)
96943_21_ch21_p507-536 1/11/10 8:07 AM Page 508
Section 21.1 • Introduction: There’s Something in the Air 509
Time (min)
1
2
3
45
7
6
89
1112
14
13
1516
1819
20,21
22
23
2417
10
10 20 300 40
Det
ecto
r re
spon
se
NamePeaklabel Mass
Boiling point(�C)
EthaneEthylenePropanePropyleneIsobutanen-ButaneAcetylenetrans-2-Butene1-ButeneIsobutenecis-2-ButeneCyclopentane
123456789
101112
30.069428.053644.096242.080458.12358.12326.037856.107256.107256.107256.107270.134
�88.6 �103.7 �42.06 �47.4 �11.7 �0.45 �28.1 (sublimes) 0.88 �6.1 �6.9 3.7 49
NamePeaklabel Mass
Boiling point(�C)
Isopentanen-Pentanetrans-2-Pentene3-Methyl-1-Butene1-Pentenecis-2-Pentene2,2-Dimethylbutane2-Methylpentane2.3-DimethylbutaneIsoprene4-Methyl-1-Pentene2-Methyl-1-Pentene
131415161718192021222324
72.149872.149870.13470.13470.13470.13486.176686.176686.176668.118284.160884.1608
3036.13720303749.76258345462
FIGURE 21.3 A gas chromatogram for the analysis of volatile organic compounds in urban air. (Thischromatogram is based on data obtained from Perkin Elmer.)
EXERCISE 21.1 Analyzing Chemicals by GC
An environmental chemist wishes to use the method inFigure 21.3 to examine acetylene in air samples. Describehow we could use this method to both identify and meas-ure acetylene.
SOLUTION
An initial identification of acetylene in an unknown sam-ple can be made by seeing if there is a peak with a reten-tion time around 23.4 min, the elution time for acetylenein Figure 21.3. The presence of acetylene can be con-firmed by examining the suspected peak with a selectivedetector such as a mass spectrometer, an approach wediscuss in Section 21.5A.
The amount of acetylene in an unknown sample canbe measured by comparing the size of its peak to thatobtained for standards that contain known amounts ofacetylene. Ideally, the sample and standards should eachcontain a fixed level of an internal standard (such as an iso-topically labeled form of acetylene when detection is per-formed by mass spectrometry). A calibration curve is then
prepared with data obtained from the standards byplotting on the y-axis the peak area or height ratio for acety-lene versus the internal standard (e.g., AreaAcetylene/AreaInternal Standard), with the amount of acetylene in thesame standards being plotted on the x-axis. The amount ofacetylene in an unknown sample can then be determinedby using this curve and the unknown’s peak area or heightratio versus the internal standard.
Because GC can be used for the identification, meas-urement, and separation of volatile chemicals, this methodhas been a popular chemical analysis tool for manydecades. The origins of this technique go to back to shortlyafter World War I, when researchers began to study theselective adsorption of gases to solids for use in gas masksand the recovery of gasoline from natural gas. These samesolids were then used with temperature control for analyt-ical applications like the determination of hydrocarbons innatural gas and separation of volatile organic acids.10 Thefirst modern system for gas chromatography was devel-oped in 1945–1947 by a German chemist named ErikaCremer (see Figure 21.4).10–12 Similar devices were later
96943_21_ch21_p507-536 1/11/10 8:07 AM Page 509

510 Chapter 21 • Gas Chromatography
created by others that made use of partition-based separa-tions, in which liquids were coated onto solids for use asstationary phases. The combined improvement in systemsand columns for GC led to rapid growth in this field overthe 1950s and 1960s.10 Many of the techniques that weredeveloped at that time for the separation and analysis ofgases and volatile chemicals are still in use today.
21.2 FACTORS THAT AFFECT GAS CHROMATOGRAPHY
21.2A Requirements for the Analyte
Volatility and Thermal Stability. To examine a chem-ical by gas chromatography, it is necessary to place thischemical into a gaseous mobile phase so that the analytecan then enter and pass through the GC column. Thisrequirement means that the injected analyte must bevolatile, or able to go easily into the gas phase. The volatil-ity of a chemical is related to its vapor pressure and boil-ing point. For instance, volatile chemicals like those thatare classified as VOCs will have high vapor pressuresand low boiling points. This property is what allowsVOCs to enter the atmosphere and react with nitrogenoxides to form ozone. The same property also makes iteasy for gas chromatography to separate and analyzesuch compounds.
There are several pieces of information we can use tomake an educated guess as to whether a particular ana-lyte will be volatile enough for its examination by gas
chromatography. One valuable piece of information is thesize of the analyte. In general, a chemical with a molarmass above 600 g/mol will have a volatility that is too lowfor work with GC.13 Many smaller chemicals can be ana-lyzed by gas chromatography, but the presence of polarfunctional groups can make it difficult to examine somelow-mass substances. Thus, the boiling point of a chemi-cal should always be considered when determining if thechemical can be studied by GC. A chemical with a boilingpoint below 500°C at 1 atm should be volatile enough forGC analysis.9 This can be confirmed by injecting a sampleof the analyte onto a GC system and seeing if it elutesfrom the column in a reasonable amount of time.14
Erika Cremer
FIGURE 21.4 Erika Cremer (1900–1996) and the first modern GC system that was developed in herlaboratory. Cremer began her work in gas chromatography at the University of Innsbruck in Austria duringWorld War II. Along with creating the first prototype of a modern gas chromatograph, Cremer alsodeveloped many terms and concepts that are still used to describe GC separations. The gas chromatographshown in this figure used a thermal conductivity detector (shown on the far right) to monitor analytes asthey eluted from the column. A chromatogram was recorded on this device by using a team of four students:The first student operated the instrument, the second kept track of the time, the third watched and read offthe results on the detector, and the fourth recorded these results.11,12 (The photo is reproduced withpermission and courtesy of the Archive of the University of Innsbruck; the diagram is from a 1947 dissertationby Fritz Prior, the student who worked with Erika Cremer in building the first gas chromatographic system.)
EXERCISE 21.2 Chemical Volatility in GC
The boiling points and masses of several VOCs are listedin Figure 21.3. How do these values compare with thegeneral properties that are needed to make an analytesuitable for GC?
SOLUTION
All of the VOCs in Figure 21.1 have molar massesbelow 600 g/mol and boiling points well below500°C–550°C (range, –104°C for ethylene to 61°C for 2-methyl-1-pentene). These values agree with the gen-eral guidelines that were given for the analyte require-ments of GC. This explains why GC works so well forsuch chemicals. A closer look at Figure 21.1 indicates
96943_21_ch21_p507-536 1/11/10 8:07 AM Page 510

Section 21.2 • Factors that Affect Gas Chromatography 511
that analytes with the lowest masses and boiling points(ethane and ethylene) elute first from the column, whileanalytes that have higher masses and boiling points(see peaks 19–21 and 22–24) tend to elute much later.This trend indicates that volatility is also an importantfactor in determining the retention of analytes in a GCsystem.
analyte, such as an alcohol or amine group, with fewerpolar groups. This change reduces the intermolecularinteractions of the altered chemical, making it morevolatile and easier to place into the gas phase. The sametype of change also tends to make a compound morethermally stable.
Derivatization is not needed in GC for substanceslike VOCs, but it is needed for larger less volatile chemi-cals like cholesterol (an analyte we studied in Chapter 18).Cholesterol has a relatively low volatility due to both itsmass (387 g/mol) and the presence of an alcohol group inits structure, which can lead to the formation of hydrogenbonds with neighboring molecules. These features causecholesterol to give a broad peak with a long retention timewhen this analyte is injected onto a GC column (seeFigure 21.5). The alcohol group of cholesterol can also leadto the degradation of this compound at high tempera-tures, as occurs when this alcohol group combines with ahydrogen on a neighboring carbon of cholesterol torelease water.17
It is important to notice that each of these prob-lems in the GC analysis of cholesterol is caused by thealcohol group of this compound. This observationsuggests that we could overcome these problems byaltering the alcohol group of cholesterol throughderivatization. As an example, we could replace thehydrogen on this alcohol group with —Si(CH3)3, ortrimethylsilyl (TMS).
(21.1)Trimethylchlorosilane
(TCMS, a TMS reagent)TMS derivative
HO R� HCl�
CH3
SiH3C
CH3
RO
CH3
SiH3C
CH3
Cl
Time (min)
Cholesterol
Alcoholgroup
Cholesteroldecomposition
products
TMS derivativeof cholesterol
After derivatization
Before derivatization
300
H H
H
H
H
HO
60
Det
ecto
r re
spon
se
FIGURE 21.5 Analysis of cholesterol (bottom) before derivatization and (top) afterderivatization on a GC column containing a nondeactivated support. Both chromatogramswere obtained under the same conditions. (Reproduced with permission from W.J.A. VandenHeuvel, “Some Aspects of the Chemistry of Gas-Liquid Chromatography,” in GasChromatography of Steroids in Biological Fluids, M.B. Lipsett, (Ed.), Plenum Press, New York,1965, pp. 277–295.)
Besides being volatile, an analyte must have goodthermal stability if it is to be examined by GC. An ana-lyte that is not thermally stable may degrade at thehigh temperatures that are often used during the injec-tion and separation of samples by GC. This type ofdegradation can make it difficult to detect and meas-ure such an analyte. It is often hard to know in advanceif a particular chemical will be stable enough for analy-sis by GC. This stability can be tested by injecting anew analyte onto a GC system and seeing if this chem-ical produces a chromatogram that has a single well-defined peak with good retention and detectionproperties. If thermal stability is a problem, suchdegradation can sometimes be minimized or elimi-nated by selecting a proper sample injection technique(see Section 21.5B) or by using chemical derivatization,as discussed in the next section.
Chemical Derivatization. Although some analytescan be injected directly onto a GC system, many chemi-cals are not sufficiently volatile or stable for thisapproach. A common solution to this problem is tochange the structure of the analyte to give this chemicala more volatile or more thermally stable form. Theprocess of altering the chemical structure of an analyte isknown as derivatization.15,16 Derivatization in GC typi-cally involves replacing one or more polar groups on an
96943_21_ch21_p507-536 1/11/10 8:07 AM Page 511

512 Chapter 21 • Gas Chromatography
The product of this reaction is known as a TMS-derivative.15,16 The replacement of a hydrogen on the alco-hol group with a bulkier and less polar TMS groupmeans that the derivatized form of cholesterol will bemore thermally stable. Although we have increased themass of our analyte by adding the TMS group (a changein mass of 72 g/mol), we also now have a derivative thatis less likely to form hydrogen bonds than underivatizedcholesterol. This makes the derivative more volatile. Theresult of this change is an improved chromatogram thattakes less time to perform and contains only a singlewell-defined peak for the cholesterol derivative (see topof Figure 21.5).
There are many ways in which chemicals can bederivatized for GC analysis.15,16 Besides increasing thevolatility and thermal stability of a compound, derivatiza-tion can be utilized to change the response of an analyteon certain GC detectors. As an example, derivatizationcan be used to place halogen atoms (I, Cl, Br, or F) onto ananalyte to improve its response on an electron-capturedetector, a device discussed in Section 21.5A.Derivatization can also be used to alter a GC separationby changing the positions of overlapping peaks or by pre-venting broad peaks caused by interactions between thecolumn support and polar groups on an analyte.
21.2B Factors that Determine Retention in Gas Chromatography
In Chapter 20 we learned that there are two general fac-tors that determine the ability of chromatography to sep-arate chemicals: retention and column efficiency. As istrue for any chromatographic method, the retention of acompound in GC will be determined by how much timethis substance spends in the mobile phase versus the sta-tionary phase. In GC this retention will be affected by (1)the volatility of an injected compound, (2) the tempera-ture of the column, and (3) the degree to which the com-pound interacts with the stationary phase.
The low density of gases causes analytes passingthrough a GC column to have little or no interaction withthe mobile phase. As a result, the volatility of an analyteis the main factor that causes this chemical to stay in themobile phase during a GC separation. This fact alsomeans that the most volatile analytes in a sample willtend to spend the most time in the mobile phase andelute the most quickly from a GC column. This idea isillustrated in Figure 21.6, for a sample that consists of agroup of saturated, straight-chain hydrocarbons knownas “n-alkanes.” Compounds like these that have thesame general structure, but which differ in the length ofa single carbon chain, are known as homologs (or a“homologous series”). Volatility decreases and retentionincreases as we increase the size of the carbon chain in agroup of homologs, as is shown in Figure 21.6 in goingfrom peak 1 (obtained for an n-alkane containing a chainwith 6 carbon atoms) to peak 16 (for an n-alkane with achain of 40 carbons).
Temperature also plays an important role in GCseparations. The effects of varying column temperatureare shown in Figure 21.7. Decreasing the column temper-ature leads to longer retention, because this causes theinjected analytes to be less volatile and spend less time inthe mobile phase. Increasing the temperature producesthe opposite effect, with analytes becoming more volatileand passing through the column more quickly as theyspend more time in the mobile phase. This effect is thereason why GC systems contain a column oven for tem-perature control.
Many of the measures of retention discussed inChapter 20 (such as tR, VM, and k) are affected by tem-perature. An alternative measure of retention thatshows a smaller change with temperature is the Kovátsretention index (I).18,19 The Kováts retention index fora chemical is calculated by using Equation 21.2. In thisequation, the retention of an analyte on a particularcolumn is compared to the retention seen at thesame temperature and on the same column for a series
Time (min)
5
10
1
15
300 60
Det
ecto
r re
spon
se
Chemicalname
Peaknumber
Chemicalstructure
Boiling point(�C)
n-Hexanen-Heptanen-Octanen-Nonanen-Decanen-Undecanen-Dodecanen-Tetradecanen-Hexadecanen-Octadecanen-Eicosanen-Tetracosanen-Octacosanen-Dotriacontanen-Hexatriacontanen-Tetracontane
123456789
10111213141516
CH3(CH2)4CH3CH3(CH2)5CH3CH3(CH2)6CH3CH3(CH2)7CH3CH3(CH2)8CH3CH3(CH2)9CH3CH3(CH2)10CH3CH3(CH2)12CH3CH3(CH2)14CH3CH3(CH2)16CH3CH3(CH2)18CH3CH3(CH2)22CH3CH3(CH2)26CH3CH3(CH2)30CH3CH3(CH2)34CH3CH3(CH2)38CH3
6998
126151174196216254287316343391432468498525
FIGURE 21.6 GC separation of a series of n-alkanes. A temperature program was used for analyte elutionduring this separation. (Based on data from Alltech.)
96943_21_ch21_p507-536 1/11/10 8:07 AM Page 512

Section 21.2 • Factors that Affect Gas Chromatography 513
Time (min)2 4 6 8 100 12
Det
ecto
r re
spon
se
2
A
A
A
B
B
B
C
C
C
D
D
D
E
E
E
F
F
F
H
H
H
G
G
G
4 6 80
2 4 60
110�C
100�C
90�C
FIGURE 21.7 GC separation of an eight-component column test mixture at varioustemperatures. The compounds in the sample were (A) n-nonane, (B) n-decane, (C) 1-octanol,(D) n-undecane, (E) 2,6-dimethylphenol, (F) 2,4-dimethylaniline, (G) naphthalene, and (H) n-dodecane.
(Adapted with permission from J.V. Hinshaw, “Optimizing Column Temperature,” LC-GC, 9(1991) 94–98.)
of n-alkanes that are used in this calculation as refer-ence compounds.8
(21.2)
The value of in Equation 21.2 is the adjusted retentiontime for the analyte (Note: We learned in Chapter 20 that
= tR – tM for an analyte, where tR is the retention timeof the analyte and tM is the column void time).20 This
value is compared to (the adjusted retention time foran n-alkane that is found to elute just before the analtye)and (the adjusted retention time for an n-alkanethat elutes just after the analyte). The values of z and(z+1) in Equations 21.2 refer to the number of carbonatoms in the n-alkanes. Because these n-alkanes arehomologs of each other, the n-alkane with z carbon atomsshould elute more quickly than the n-alkane with carbon atoms.
z + 1
t¿R(z+1)
tRzœ
t¿R
tRxœ
I = 100z + 100 #log tœ
Rx - log tœ
Rz
log tœ
R(z + 1) - log tœ
Rz
, , and was injected on the same col-umn under identical conditions.21 These chemicals hadthe following retention times: acenaphthene, 10.40 min;
, 8.04 min; , 12.42 min; , 19.64 min.22
The column void time was found to be 1.33 min. Whatwas the Kováts retention index for acenaphthene onthis column?
SOLUTION
The n-alkanes eluting just before and after acenaphthenewere and . These are the n-alkanes thatshould be used in Kováts retention index of acenaph-thene, making z = 14 and . The adjusted reten-tion time for is
and for it is . The adjusted reten-
tion time for acenaphthene is . We get the following Kováts retention index
when placing these values into Equation 21.2.Kováts retention index for acenaphthene:
= 1460
I = 100 A14 B + 100 #log A9.07 min B - log A6.71 min B
log A11.09 min B - log A6.71 min B
= 9.07 min- 1.33 min)= (10.40 mintœ
Rx
= 11.09 minmin - 1.33 min)(12.42 tœ
R(z+1) =C15H32= 6.71 min (tœ
Rz)= (8.04 min - 1.33 min)tœ
RzC14H30
z + 1 = 15
C15H32C14H30
C16H34C15H32C14H30
C16H34C15H32C14H30
EXERCISE 21.3 Calculating a Kováts Retention Index
A sample of acenaphthene (a common chemical used inplastics) was injected onto a 25 m long � 0.3 mm innerdiameter GC column at 140°C. A sample of the n-alkanes
96943_21_ch21_p507-536 1/11/10 8:07 AM Page 513
514 Chapter 21 • Gas Chromatography
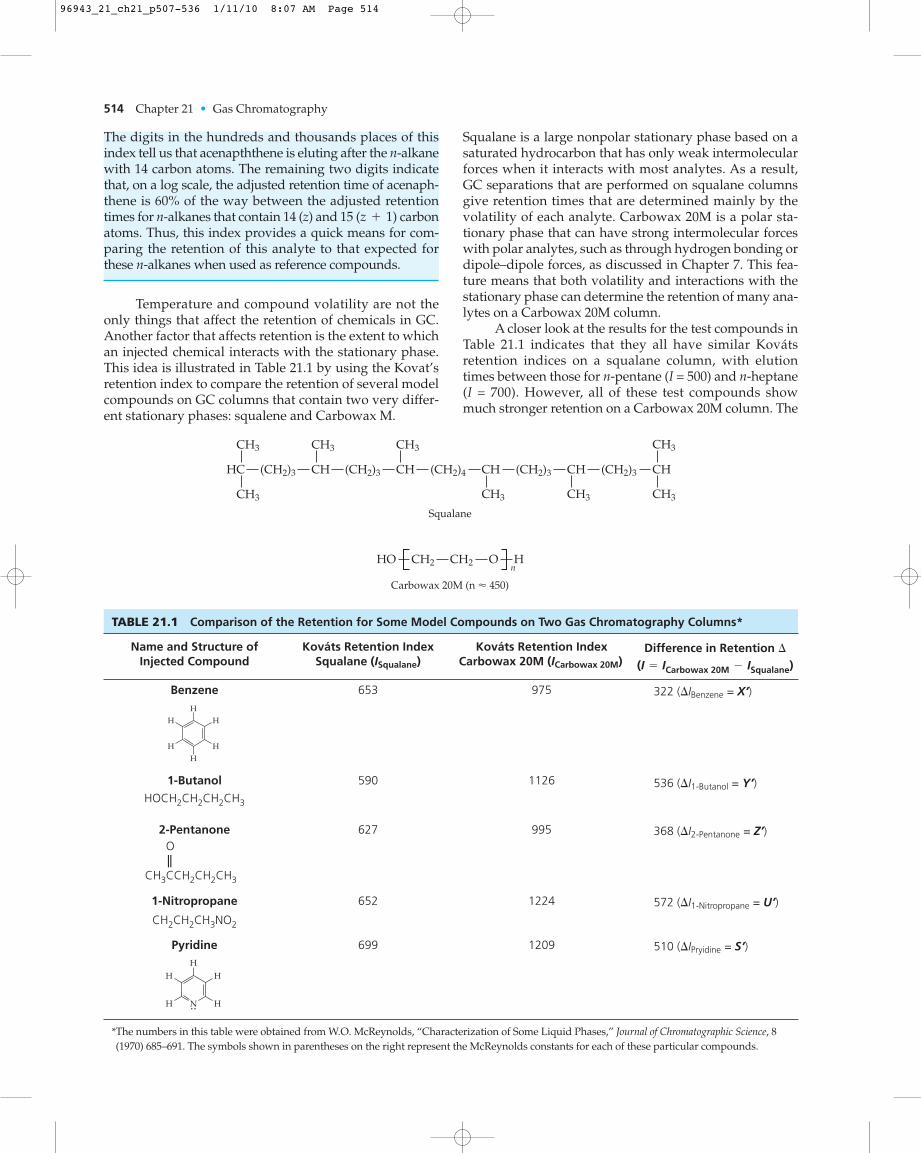
The digits in the hundreds and thousands places of thisindex tell us that acenapththene is eluting after the n-alkanewith 14 carbon atoms. The remaining two digits indicatethat, on a log scale, the adjusted retention time of acenaph-thene is 60% of the way between the adjusted retentiontimes for n-alkanes that contain 14 (z) and 15 carbonatoms. Thus, this index provides a quick means for com-paring the retention of this analyte to that expected forthese n-alkanes when used as reference compounds.
(z + 1)
Squalane is a large nonpolar stationary phase based on asaturated hydrocarbon that has only weak intermolecularforces when it interacts with most analytes. As a result,GC separations that are performed on squalane columnsgive retention times that are determined mainly by thevolatility of each analyte. Carbowax 20M is a polar sta-tionary phase that can have strong intermolecular forceswith polar analytes, such as through hydrogen bonding ordipole–dipole forces, as discussed in Chapter 7. This fea-ture means that both volatility and interactions with thestationary phase can determine the retention of many ana-lytes on a Carbowax 20M column.
A closer look at the results for the test compounds inTable 21.1 indicates that they all have similar Kovátsretention indices on a squalane column, with elutiontimes between those for n-pentane (I = 500) and n-heptane(I = 700). However, all of these test compounds showmuch stronger retention on a Carbowax 20M column. The
Temperature and compound volatility are not theonly things that affect the retention of chemicals in GC.Another factor that affects retention is the extent to whichan injected chemical interacts with the stationary phase.This idea is illustrated in Table 21.1 by using the Kovat’sretention index to compare the retention of several modelcompounds on GC columns that contain two very differ-ent stationary phases: squalene and Carbowax M.
Squalane
CH3
HC
CH3
CH3
(CH2)3 CH
Carbowax 20M (n � 450)
HO CH2 CH2 HO
CH3
(CH2)3 CH
CH3
(CH2)4 CH
CH3
(CH2)3 CH
CH3
CH3
(CH2)3 CH
n
TABLE 21.1 Comparison of the Retention for Some Model Compounds on Two Gas Chromatography Columns*
Name and Structure ofInjected Compound
Kováts Retention IndexSqualane (ISqualane)
Kováts Retention IndexCarbowax 20M (ICarbowax 20M)
Difference in Retention �(I = ICarbowax 20M - ISqualane)
Benzene 653 975 322 (�IBenzene = X’)
1-Butanol 590 1126 536 (�I1-Butanol = Y’)HOCH2CH2CH2CH3
2-Pentanone 627 995 368 (�I2-Pentanone = Z’)
CH3CCH2CH2CH3
��O
1-Nitropropane 652 1224 572 (�I1-Nitropropane = U’)CH2CH2CH3NO2
Pyridine 699 1209 510 (�IPryidine = S’)
*The numbers in this table were obtained from W.O. McReynolds, “Characterization of Some Liquid Phases,” Journal of Chromatographic Science, 8(1970) 685–691. The symbols shown in parentheses on the right represent the McReynolds constants for each of these particular compounds.
H
H
H
H
H
H
H
H
H
H
H N
96943_21_ch21_p507-536 1/11/10 8:07 AM Page 514

Section 21.3 • Gas Chromatography, Mobile Phases, and Elution Methods 515
reason for this effect is that these compounds now havestronger interactions with the stationary phase in theCarbowax 20M column. In addition, this increase in reten-tion is largest for analytes that can undergo strong hydro-gen bonding or that have large dipole moments, such as1-butanol, pyridine, and 1-nitropropane. This type ofcomparison based on the injection of a particular set oftest compounds is valuable as a means for comparing theretention properties of various GC stationary phases. Thistopic is discussed further in Box 21.1.
21.2C Column Efficiency in Gas Chromatography
One benefit of using a gas as the mobile phase is thisgives GC very high efficiency and narrow peaks (e.g.,see Figures 21.3 and 21.6). These sharp and narrowpeaks make it easy to measure small quantities of ana-lytes and allow GC to separate a large number of com-pounds in a single run. There are several reasons for thehigh efficiency of GC systems. Many of these reasonsare related to the fact that a gas is being used as themobile phase. The low density of gases means that ana-lytes in these gases can move about quickly by diffu-sion. This feature is important because most processesthat cause peak broadening in chromatography will bereduced by the presence of fast diffusion, with longitu-dinal diffusion being the main exception (see Chapter20). The presence of less peak broadening, in turn,makes it easier for the column to discriminate betweenthe analyte and other sample components.
Low viscosity is another feature of gases that pro-motes high efficiency in GC. As the viscosity goes downfor a mobile phase, it is possible to use a longer column.A longer column will have a larger number of theoreticalplates, which will increase the resolution of separations
that are performed on that column (see Chapter 20). Apoint will eventually be reached in which an increase incolumn length creates too much pressure for the mobilephase to pass through the column. Fortunately, the muchlower viscosity of gases versus liquids means that muchlonger and more efficient columns can typically be usedin GC than in liquid chromatography, a method we willdiscuss in Chapter 22.
21.3 GAS CHROMATOGRAPHY, MOBILEPHASES, AND ELUTION METHODS
21.3A Common Mobile Phases in Gas Chromatography
Like any type of chromatography, the mobile phase inGC is used to apply and transport compounds throughthe column. One important difference between GC andother chromatographic techniques is that a gas mobilephase will play little or no role in determining a com-pound’s retention. Instead, retention is determined bythe compound’s volatility, the column temperature, andinteractions of injected chemicals with the stationaryphase. Because the main purpose of the mobile phase inGC is to simply move solutes along the column, themobile phase in this technique is often referred to as thecarrier gas.8
Examples of common carrier gases used in GC arehydrogen (H2), helium (He), nitrogen (N2), and argon(Ar). All of these gases are relatively inexpensive, easy toobtain, and (with the exception of hydrogen) inert andsafe to use. These gases are usually provided by a stan-dard gas cylinder, but sometimes they are supplied by agas generator connected to the GC system. For instance, agenerator might be used to isolate nitrogen from air or to
BOX 21.1
Comparing Gas Chromatography Stationary Phases
The compounds shown in Table 21.1 are often used to com-pare and evaluate the retention properties of GC stationaryphases. This approach makes use of values known asMcReynolds constants.23 The McReynolds constants for a GCstationary phase are determined by measuring the Kovátsretention indices for model compounds on both the stationaryphase of interest and on a nonpolar reference stationary phase(squalane) at the same temperature. The difference in I foreach compound on the two stationary phases (�I) is thendetermined by using Equation 21.3.
(21.3)
The compounds in Table 21.1 have been selected for evalu-ating GC columns because these compounds represent chemicalswith several possible types of intermolecular forces. Benzene is ageneral model for compounds that can mainly interact throughdispersion forces with a stationary phase. 1-Nitropropanerepresents compounds that have dipole moments and strong
¢I = ITest Stationary Phase - ISqualane
dipole-related interactions. 1-Butanol can take part in hydrogenbonding and can act as either a proton acceptor or proton donor.2-Pentanone contains a carbonyl group, which also allows it totake part in hydrogen bonding as a proton acceptor. The aromaticnitrogen in pyridine makes it act as a base that can also formhydrogen bonds and act as a proton acceptor.
It is common for manufacturers of GC stationary phasesto give the values of the McReynolds constants when theydescribe their products. McReynolds constants also provide away for scientists to compare different GC stationary phasesand choose those that will work best in most applications. Wewill see an example of such a list later when we discuss sta-tionary phases that are recommended for gas–liquid chro-matography (Section 21.4B). By convention, the value of �Ithat is reported in these lists is referred to as X’ if it was meas-ured for benzene, Y’ for 1-butanol, Z’ for 2-pentanone, U’ for1-nitropropane, and S’ for pyridine. The average of these �Ivalues is also sometimes reported.16
96943_21_ch21_p507-536 1/11/10 8:07 AM Page 515

516 Chapter 21 • Gas Chromatography
produce H2 by passing an electrical current throughwater, breaking the water down into oxygen and hydro-gen gas.
The carrier gas should always have high purity toavoid contamination or damage to the column and GCsystem. Impurities like water, oxygen, organic sub-stances, and particulate matter can be removed by pass-ing the carrier gas through a series of traps and filtersbefore it enters the column. The carrier-gas source shouldalso be equipped with regulators for pressure and flow-rate control. In some cases, it is necessary to use specialdevices to maintain a constant flow rate as the tempera-ture or pressure of the system is varied. This is especiallyimportant when the column conditions are changed overtime, as will be discussed in the next section.
21.3B Elution Methods in Gas Chromatography
The General Elution Problem. We saw earlier thattemperature is an important factor in determining howstrongly a compound will be retained in a GC column. Ifthe same temperature is used throughout this separation,this is called an isothermal method (where “isothermal”means “constant temperature”).8 An isothermal methodworks well if the sample is relatively simple or has only afew known compounds. This is generally used for sam-ples containing only relatively volatile analytes (e.g., low-mass compounds with boiling points below 100°C).16 Themain strength of this approach is its simplicity. The factthat no cooling down or reequilibration period is neededbetween samples also helps minimize the time thatelapses between sample injections.
Using the same conditions throughout a GC separa-tion is convenient, but it creates a problem when one isworking with complex samples. A complex sample willprobably contain chemicals with a wide range of volatili-ties or interactions with the stationary phase. An exampleis shown in Figure 21.8 for the analysis of n-alkanes thathave 10 to 18 carbons in their structure . Some ofthese chemicals pass through the columnquickly, creating peaks with low retention and makingthese peaks difficult to resolve. Other chemicals in thesample (e.g., ) are well resolved, but go through thecolumn too slowly and give broad peaks with long elutiontimes. We would ideally prefer for all of injected chemi-cals to come out between these extremes, like the peaksshown for which are well resolved, but also passthrough the column in a reasonable amount of time.
It is often difficult in chromatography or in anyother separation method to find a single set of conditionsthat can separate all the components of a complex samplewith adequate resolution and in a reasonable amount oftime. This difficulty is known as the general elutionproblem. One way of dealing with this problem is to varythe separation conditions during the analysis of a sample,giving an approach called gradient elution (or gradientprogramming).8 A typical method using gradient elution
C14-C17
C18
(C10-C13)(C10-C18)
will begin with conditions that allow early eluting com-pounds to stay on the column longer, helping them tobecome better separated. The conditions are then changedover time to help other compounds also elute with goodresolution and within a satisfactory amount of time.
Temperature Programming. The most common wayof performing gradient elution in GC is to vary the tem-perature of the column over time. This technique isknown as temperature programming.8 An example oftemperature programming is given in Figure 21.9 for thesame set of n-alkanes that were injected in Figure 21.8under isothermal conditions. This method makes use ofthe known relationship between analyte retention andcolumn temperature in GC, where an increase in temper-ature leads to a decrease in retention. This relationshipcan be used to improve the separation in Figure 21.8 bystarting at a lower temperature so that the most volatilesubstances in the sample are more stronglyretained. The temperature can then be graduallyincreased to allow other analytes in the sample to elute
(C10-C13)
Time (min)
C14
C15
C16
C17
C18
20 10864
Det
ecto
r re
spon
se
FIGURE 21.8 An example of the general elution problem asshown by the separation of the n-alkanes decane through octadecane at constant temperature.
(Reproduced with permission from S. Nygren, “Faster GC AnalysesPerformed by Flow Programming in Short Capillary Columns,”Journal of High Resolution Chromatography, 2 (1979) 319–323.)
(C18 = C18H38)(C10 = C10H22)
96943_21_ch21_p507-536 1/11/10 8:07 AM Page 516

Section 21.4 • Gas Chromatography Supports and Stationary Phases 517
with reasonable retention times while still being resolvedfrom each other.
A temperature program usually begins with an ini-tial isothermal step at a relatively low column tempera-ture. It is during this step that the sample is injected,allowing the most volatile compounds to interact withthe column and be separated. The next step in the tem-perature program is known as the temperature ramp; itis during this step that analytes with intermediate orhigh boiling points are eluted from the column. A linearchange in temperature over time is generally usedbecause of its simplicity and ability to elute compoundswith a large range of volatilities. The rate at which thetemperature is increased during the ramp will varyfrom one GC method to the next, but is often in therange of 1–30°C/min.9 In some cases, a nonlinearchange in temperature or a series of linear ramps canalso be used.
After the temperature ramp has been completed,the third part of a temperature program is an isothermalstep in which the temperature is held for some period oftime at the upper limit of the ramp. This step is optionalbut useful in making sure that all analytes have time toelute and in ensuring that there are no low volatilitysubstances that remain on the column from one sample
injection to the next. The fourth step in the temperatureprogram is a cooling-down period in which the columnis returned back to its initial temperature. It is importantto allow sufficient time for this cooling process. If this isnot done, the temperature of the GC column may be toohigh when the next sample is applied, meaning the mostvolatile compounds in the sample will travel too quicklythrough the column and will not be adequately sepa-rated. Box 21.2 shows how both isothermal elution andtemperature programming have been used in importantanalytical applications of GC.
21.4 GAS CHROMATOGRAPHY SUPPORTSAND STATIONARY PHASES
21.4A Gas Chromatography Support Materials
Packed Columns. GC columns can be placed into oneof two major categories based on the type of supportthat they employ: packed columns and open-tubularcolumns. A packed column is filled with small supportparticles that act as an adsorbent or that are coated withthe desired stationary phase.8,9 In GC a packed column ismade up of a glass or metal tube that is usually 1–2 m longand a few millimeters in diameter.
Time (min)Inject
sample
Injectsample
20 31 4 5
Det
ecto
r re
spon
se
C10
C11
C12
C13C14 C15 C16 C17 C18
Time
Col
umn
tem
pera
ture
Temperature program
FIGURE 21.9 Separation of the n-alkanes decane through octadecane by temperature programming. The plot on the left shows the temperature program that was usedand the plot on the right shows the resulting chromatogram.
(Reproduced with permission from S. Nygren, ‘Faster GC Analyses Performed by Flow Programmingin Short Capillary Columns,” Journal of High Resolution Chromatography, 2 (1979) 319–323.)
(C18 = C18H38)(C10 = C10H22)
96943_21_ch21_p507-536 1/11/10 8:07 AM Page 517

518 Chapter 21 • Gas Chromatography
BOX 21.2
Analytical Chemistry in Space
One application of GC has been its use in the study of spaceand other planets. For example, GC systems have recentlybeen sent on a probe to study the atmosphere and surface ofTitan and are planned for future robot probes to explore thesurface of Mars.24,25 GC systems were also present on thetwo U.S. Viking probes that landed on Mars in the late1970s. The location of this device on the Viking lander isshown in Figure 21.10, which included a gas chromatographand mass spectrometric detector. A robotic arm served as thesurface sampler to acquire samples of Martian soil for analy-sis by the GC system, which then separated any volatile com-pounds in the sample prior to their detection andidentification. The goal of this analysis was to determine ifany organic compounds were present in Martian soil as a testfor the possible existence of life on that planet.26 Due to thelarge number of possible compounds that could have been
present, temperature programming was employed as part ofthis analysis.
GC systems have also been included on probes sent bythe United States and former Soviet Union to Venus.27,28 Forinstance, in 1978 a Pioneer–Venus probe used a GC system toanalyze the atmosphere of Venus as the probe descendedtoward the planet surface. A profile of the atmosphere wasgenerated by analyzing the major gases at regular intervalsduring the probe’s descent. Because this analysis involved amuch smaller number of possible analytes than the Mars lan-der (major gases versus trace organic compounds), an isother-mal elution method was employed. One benefit of usingisothermal elution instead of temperature programming inthis case was it allowed more rapid processing of samplesduring descent of the probe, because no reequilibration ofcolumn temperature was required at the end of each analysis.
Effluent ventnear footpad(not shown) Atmospheric
inlet
Soil processor
Surface sampler
Gas chromatograph/mass spectrometer
FIGURE 21.10 Location of the gas chromatograph, equipped with a mass spectrometer as thedetector, on the Mars Viking lander.
(Adapted with permission from D. R. Rushneck et al., “Viking Gas Chromatograph-MassSpectrometer,” Reviews of Scientific Instrumentation, 49 (1978) 817–834.)
96943_21_ch21_p507-536 1/11/10 8:07 AM Page 518
Section 21.4 • Gas Chromatography Supports and Stationary Phases 519
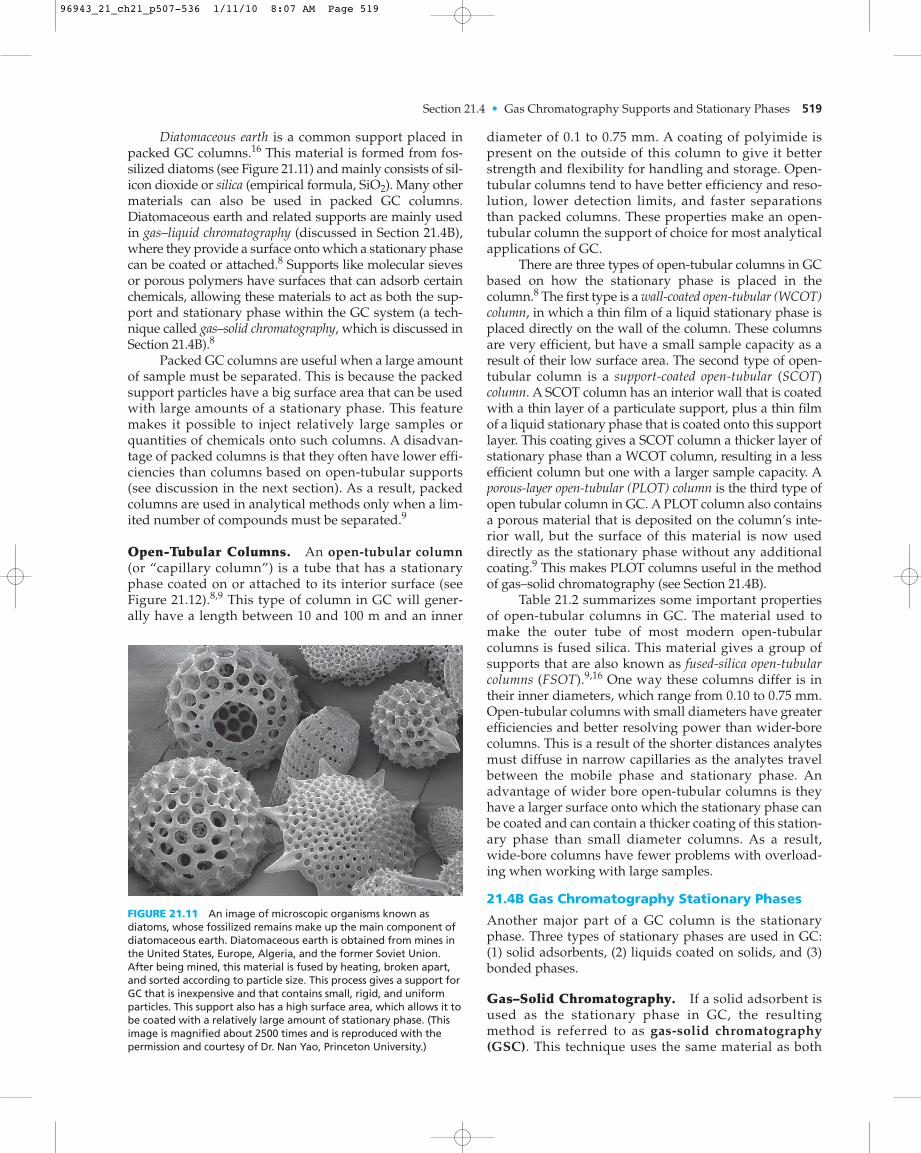
Diatomaceous earth is a common support placed inpacked GC columns.16 This material is formed from fos-silized diatoms (see Figure 21.11) and mainly consists of sil-icon dioxide or silica (empirical formula, ). Many othermaterials can also be used in packed GC columns.Diatomaceous earth and related supports are mainly usedin gas–liquid chromatography (discussed in Section 21.4B),where they provide a surface onto which a stationary phasecan be coated or attached.8 Supports like molecular sievesor porous polymers have surfaces that can adsorb certainchemicals, allowing these materials to act as both the sup-port and stationary phase within the GC system (a tech-nique called gas–solid chromatography, which is discussed inSection 21.4B).8
Packed GC columns are useful when a large amountof sample must be separated. This is because the packedsupport particles have a big surface area that can be usedwith large amounts of a stationary phase. This featuremakes it possible to inject relatively large samples orquantities of chemicals onto such columns. A disadvan-tage of packed columns is that they often have lower effi-ciencies than columns based on open-tubular supports(see discussion in the next section). As a result, packedcolumns are used in analytical methods only when a lim-ited number of compounds must be separated.9
Open-Tubular Columns. An open-tubular column(or “capillary column”) is a tube that has a stationaryphase coated on or attached to its interior surface (seeFigure 21.12).8,9 This type of column in GC will gener-ally have a length between 10 and 100 m and an inner
SiO2
diameter of 0.1 to 0.75 mm. A coating of polyimide ispresent on the outside of this column to give it betterstrength and flexibility for handling and storage. Open-tubular columns tend to have better efficiency and reso-lution, lower detection limits, and faster separationsthan packed columns. These properties make an open-tubular column the support of choice for most analyticalapplications of GC.
There are three types of open-tubular columns in GCbased on how the stationary phase is placed in thecolumn.8 The first type is a wall-coated open-tubular (WCOT)column, in which a thin film of a liquid stationary phase isplaced directly on the wall of the column. These columnsare very efficient, but have a small sample capacity as aresult of their low surface area. The second type of open-tubular column is a support-coated open-tubular (SCOT)column. A SCOT column has an interior wall that is coatedwith a thin layer of a particulate support, plus a thin filmof a liquid stationary phase that is coated onto this supportlayer. This coating gives a SCOT column a thicker layer ofstationary phase than a WCOT column, resulting in a lessefficient column but one with a larger sample capacity. Aporous-layer open-tubular (PLOT) column is the third type ofopen tubular column in GC. A PLOT column also containsa porous material that is deposited on the column’s inte-rior wall, but the surface of this material is now useddirectly as the stationary phase without any additionalcoating.9 This makes PLOT columns useful in the methodof gas–solid chromatography (see Section 21.4B).
Table 21.2 summarizes some important propertiesof open-tubular columns in GC. The material used tomake the outer tube of most modern open-tubularcolumns is fused silica. This material gives a group ofsupports that are also known as fused-silica open-tubularcolumns (FSOT).9,16 One way these columns differ is intheir inner diameters, which range from 0.10 to 0.75 mm.Open-tubular columns with small diameters have greaterefficiencies and better resolving power than wider-borecolumns. This is a result of the shorter distances analytesmust diffuse in narrow capillaries as the analytes travelbetween the mobile phase and stationary phase. Anadvantage of wider bore open-tubular columns is theyhave a larger surface onto which the stationary phase canbe coated and can contain a thicker coating of this station-ary phase than small diameter columns. As a result,wide-bore columns have fewer problems with overload-ing when working with large samples.
21.4B Gas Chromatography Stationary Phases
Another major part of a GC column is the stationaryphase. Three types of stationary phases are used in GC:(1) solid adsorbents, (2) liquids coated on solids, and (3)bonded phases.
Gas–Solid Chromatography. If a solid adsorbent isused as the stationary phase in GC, the resultingmethod is referred to as gas-solid chromatography(GSC). This technique uses the same material as both
FIGURE 21.11 An image of microscopic organisms known asdiatoms, whose fossilized remains make up the main component ofdiatomaceous earth. Diatomaceous earth is obtained from mines inthe United States, Europe, Algeria, and the former Soviet Union.After being mined, this material is fused by heating, broken apart,and sorted according to particle size. This process gives a support forGC that is inexpensive and that contains small, rigid, and uniformparticles. This support also has a high surface area, which allows it tobe coated with a relatively large amount of stationary phase. (Thisimage is magnified about 2500 times and is reproduced with thepermission and courtesy of Dr. Nan Yao, Princeton University.)
96943_21_ch21_p507-536 1/11/10 8:07 AM Page 519

520 Chapter 21 • Gas Chromatography
the support and stationary phase, with retentionoccurring through the adsorption of analytes to thesupport’s surface.8 An example of a support for GSC isa molecular sieve (see Figure 21.13).9,16 A molecularsieve is a porous material that is composed of a mix-ture of silica , alumina , water, and anoxide of an alkali or alkaline earth metal, such assodium or calcium. When these are combined in a
(Al2O3)(SiO2)
particular ratio, they produce a support with a series ofpores with well-defined sizes and binding regions. Theability of an analyte to adsorb to this support willdepend on the size of the analyte and the strength withwhich it interacts with the support’s surface.Molecular sieves are useful in retaining such things assmall hydrocarbons and gases like hydrogen, oxygen,carbon monoxide, and nitrogen.9,16
General dimensions
Type of Stationary Phase
Stationary phasecoating 0.1–0.5 �m thickon inner wall of capillary
Coil of capillary tubing10–100 m in length
Outercapillary
Liquid stationaryphase coating
Solid support �liquid stationary
phase coating Solid support
Wall-coated open tubularcolumn (WCOT)
Support-coated open tubularcolumn (SCOT)
Porous-layer open tubularcolumn (PLOT)
Polyimide coating onouter wall of capillary
Inner diameter of0.1–0.75 mm
FIGURE 21.12 The top image shows typical dimensions of an open-tubular column in GC and thebottom image shows various ways in which the support and stationary phase can be placed within anopen-tubular column.
TABLE 21.2 Properties of Common Types of Gas Chromatography Columns*
Type of Column Column Efficiency (plates/meter) Maximum Sample Injection Volume (ML)
Packed columns
2 mm inner diameter 2000 10
Open-tubular columns
0.75 mm inner diameter (megabore) 1100 6
0.53 mm inner diameter (wide-bore) 1000 5
0.32 mm inner diameter (medium-bore) 3200 2
0.25 mm inner diameter (narrow-bore) 4000 1
0.10 mm inner diameter (ultranarrow-bore) 10000 0.5
*These results are for the following amounts of stationary phase: packed column, 5% w/w coating; 0.10 mm inner diameter open-tubularcolumn, coating; 0.25 mm inner diameter column, coating; 0.32 mm inner diameter column, coating; 0.53 mm innerdiameter column, thick coating; 0.75 mm inner diameter column, thick coating.13,18 The values in this table are approximate andwill vary with column length, the amount of stationary phase, and type of stationary phase or analyte.
5.0 mm5.0 mm1.0 mm1.0 mm0.2 mm
96943_21_ch21_p507-536 1/11/10 8:07 AM Page 520

Section 21.4 • Gas Chromatography Supports and Stationary Phases 521
polarity of the support and its functional groups will alsoaffect how analytes will bind to them. Nonpolar supportslike porous polystyrene will have only weak intermolec-ular forces and be fairly nonselective in their binding.Polar supports like molecular sieves, silica, and aluminatend to have strong binding, particularly for compoundsthat are polar and that can form hydrogen bonds.9,16
Gas–Liquid Chromatography. Another type of GCmethod is one in which a chemical coating or layer isplaced onto the support and used as the stationary phase.This method is known as gas–liquid chromatography(GLC), and it is the most common type of gas chromatog-raphy.8 Table 21.3 lists several types of liquids that areused as stationary phases in GLC. All of these liquidshave high boiling points and low volatilities, whichallows them to stay within the column at the relativelyhigh temperatures that are often used in GC for sampleinjection and elution. These liquids are also “wettable,”which means they are easy to place onto a support in athin, uniform layer.
Many of the stationary phases in Table 21.3 arebased on a polysiloxane. A polysiloxane has the followinggeneral structure.16
R1
Si
R2
O
n
R3
Si
R4
O
m
Other supports that can be used in GSC includeorganic polymers such as porous polystyrene and inor-ganic substances such as silica or alumina. These sup-ports can be placed in either packed columns or inporous-layer open-tubular columns.29 The extent towhich an analyte will bind to these materials will bedetermined by the support’s total surface area, the size ofthe support’s pores, and the functional groups located onthe support’s surface. Increasing the surface area of aGSC support will increase the phase ratio and result inhigher retention for analytes. Pore size is importantbecause only compounds smaller than these pores will beable to contact the surface area within this space. The
TABLE 21.3 Recommended Stationary Phases for Gas–Liquid Chromatography
Stationary Phasea Relative Polarityb
100% dimethylpolysiloxane 16 (Nonpolar)
5% phenyl–95% methylpolysiloxane 33
14% cyanopropylphenyl–86% methylpolysiloxane 67
50% phenyl–50% methylpolysiloxane 119
50% trifluoropropyl–50% methylpolysiloxane 146
50% cyanopropylmethyl–50% phenylmethylpolysiloxane 228
Polyethylene glycol 322 (Polar)
aThese data are from the following references: R.L. Grob, Modern Practice of Gas Chromatography, 3rd ed.,Wiley, New York, 1995; S.O. Falwell, “Modern Gas Chromatographic Instrumentation,” In AnalyticalInstrumentation Handbook, G.W. Ewing, Ed., Marcel Dekker, New York, 1997, Chapter 23; H.M. McNair,“Method Development in Gas Chromatography,” LC-GC, 11 (1993) 794–800.
bThese rankings are based on the McReynolds constant for benzene (X’), which is used here as an overallmeasure of stationary phase polarity.
This structure consists of a backbone of silicon and oxy-gen atoms attached in long strings of Si—O—Si bonds. InGLC, the total size of these chains varies from molecularmasses of a few thousand up to over a million,16 whichgives these polymers a low volatility. The remaining twobonds on each silicon atom are attached to side groups
that can have a variety of structures. These(R1-R4)
FIGURE 21.13 Structure of a molecular sieve (also known as azeolite). The small circles show the positions of oxygen atoms,while the larger circles represent silicon or aluminum atoms. Thearrangement of these atoms gives a material with a well-definedstructure or pore size, which can be used to adsorb some gases andother chemical species. (Reproduced with permission from S. Burgmay, Bryn Mawr University.)
96943_21_ch21_p507-536 1/11/10 8:07 AM Page 521

522 Chapter 21 • Gas Chromatography
groups range from methyl groups (the least polar ofthese side chains) to cyanopropyl groups (the mostpolar). In some polysiloxanes only one type of sidegroup is used throughout the entire chain, while in oth-ers, a mixture of two or more groups is employed. It ispossible by altering the amount and type of these groupsto produce stationary phases with a variety of polaritiesand specificities. This flexibility, plus their good temper-ature stability, has made polysiloxanes popular as sta-tionary phases for GLC.
Bonded Phases. One difficulty with using a liquidstationary phase in GC is that even the most nonvolatileliquid will slowly vaporize or break apart and leave thecolumn over time. This process is known as columnbleed.16,20 This loss of stationary phase will change theretention characteristics of the column. Column bleedcan also cause some GC detectors to have a high back-ground and a noisy signal as the stationary phase leavesthe column and enters the detector. Various techniquesare used to minimize column bleed. One approach is touse a stationary phase that is covalently attached to thesupport, resulting in a bonded phase.16,20 A bondedphase can be produced by reacting groups on a poly-siloxane stationary phase with silanol groups (general for-mula, —Si—OH) that are located on the surface of asilica support. A second approach for minimizing col-umn bleed is to cross-link the stationary phase. Thisapproach forms a cross-linked stationary phase that nowhas a larger and more thermally stable structure.16,20
Either a bonded phase or cross-linked stationary phasewill provide a more stable column that can be used at
higher temperatures than columns that contain a coatedstationary phase. It is for this reason that bonded andcross-linked stationary phases are preferred in analyticalapplications of GC.
21.5 GAS CHROMATOGRAPHY DETECTORSAND SAMPLE HANDLING21.5A Types of Gas Chromatography Detectors
The detector of a GC system is used to determine whensomething is eluting from the column, to measure theamount of this substance and, in some cases, to help iden-tify it. The most common detectors that are employed inGC are listed in Table 21.4. Some of these detectors aregeneral detectors that respond to a wide range of sub-stances, while others are selective detectors that respondto only a particular set of compounds.
General Detectors. The thermal conductivitydetector (TCD) can be used for both organic and inor-ganic compounds. A TCD measures the ability of theeluting carrier gas and analyte mixture to conduct heataway from a hot-wire filament, a property known as“thermal conductivity.” This ability will vary as differentanalytes elute from the GC column, providing a meansfor both detecting and measuring these analytes.9,16,20
One common type of TCD is based on an electroniccircuit known as a “Wheatstone bridge” (see Figure 21.14).A circuit consists of four resistors that are arranged in aparallel circuit, with two resistors being present ineach side. When these resistors are properly balancedelectronically, the voltage difference across the center of
TABLE 21.4 Properties of Common Gas Chromatography Detectors*
Detector Name Compounds Detected Detection Limitsa
General detectors
Thermal conductivity detector (TCD) Universal—all compounds 10–9 g
Flame ionization detector (FID) All organic compounds 10–12 g carbon
Selective detectors
Nitrogen-phosphorus detector (NPD) Nitrogen and phosphorus-containing compounds 10–14–10–13 g Nitrogen10–14–10–13 g Phosphorus
Electron capture detector (ECD) Compounds with electronegative groups 10–15–10–13 g
Structure-specific detectors
Mass spectrometry Universal—full-scan mode 10–10–10–9 g (Full-scan mode)
Selective—SIM mode 10–12–10–11 g (SIM mode)
*These data were obtained from the manufacturers of these detectors and the following references: B. Erickson, “Measuring Nitrogen andPhosphorus in the Presence of Hydrocarbons,” Analytical Chemistry, 70 (1998) 599A–602A; D. Noble, “Electron Capture Detection for GC,”Analytical Chemistry, 67 (1995) 439A–442A.
aThe FID, NPD, and ECD are flow-sensitive detectors with detection limits best expressed in terms of mass of detected analyte per time (e.g.,g/s); the detection limits for these devices given here are given for a one-second pulse of analyte so they may be given in units of g/s. The TCDis a concentration-sensitive detector with a detection limit that should be expressed as grams of detected analyte per unit volume; the precedingdetection limit is for a 1 s interval at a carrier-gas flow rate of 6 mL/min or 0.1 mL/s.
96943_21_ch21_p507-536 1/11/10 8:07 AM Page 522

Section 21.5 • Gas Chromatography Detectors and Sample Handling 523
the circuit will be equal to zero. But if any of these resistorshas changes in its electrical properties, a nonzero voltagewill be produced. When this circuit is used in a TCD, atleast two of the resistors consist of wire filaments that areexposed to the pure carrier gas or analyte/carrier-gas mix-ture that is eluting from the GC column. When a current ispassed through the Wheatstone bridge, the resistors willbegin to heat up. Some of this heat will be removed by thegas that surrounds the two exposed resistors. If the gasessurrounding these two resistors are not the same (as willoccur when analytes are eluting from the column), theamount of heat that is removed from the two resistors willdiffer. This causes the circuit to become unbalanced andgives an electrical signal that is related to the amount ofanalyte that is eluting from the column.
The carrier gas that is used with a TCD should havea thermal conductivity that is as different as possiblefrom the thermal conductivities of any compounds thatare to be detected. Table 21.5 shows the thermal conduc-tivities for common GC carrier gases and a few represen-tative analytes. Hydrogen and helium are often usedwith a TCD because they are the two carrier gases withthe greatest difference in thermal conductivities versusmost analytes. Helium is most commonly used with aTCD in the United States because of its safety; however,hydrogen is often used in other countries or in caseswhere helium is the analyte to be measured. The mainadvantage of a TCD is its ability to respond to any ana-lyte that is different from the carrier gas and is present ina sufficient quantity to be measured. This makes a TCDvaluable in detecting a large range of organic and inor-ganic compounds. A TCD is also nondestructive, whichmakes it possible to pass analytes onto a second type ofdetector for further analysis or to collect these analytes
after they exit the TCD. One disadvantage of a TCD is itwill respond to impurities in the carrier gas, to a station-ary phase that is bleeding from the column, or to air thatis leaking into the GC system. A TCD can also be sensi-tive to changes in separation conditions, such as mightoccur during temperature programming. Another disad-vantage of a TCD is it has a relatively poor lower limit ofdetection compared to other common GC detectors. As aresult, the TCD is mostly used with relatively high con-centration samples and for analytes that do not give agood response on other detectors, such as , , CO,
, , , and .The flame ionization detector (FID) is another type
of general GC detector. A FID detects organic compoundsby measuring their ability to produce ions when they areburned in a flame.9,16,20 The design of a typical FID isshown in Figure 21.15. The flame in the FID is usuallyformed by burning the eluting compounds in a mixtureof hydrogen and air. An additional amount of a “makeupgas” like nitrogen is sometimes combined with the carriergas and hydrogen before entry into the flame; this is doneto help provide a steady, optimum flow rate for detection.Positively charged ions produced by the flame are col-lected by a negative electrode that surrounds the flame.As these ions are produced they create a current at theelectrode, thereby allowing the presence of the elutingcompound to be detected.
CO2NO2SO2H2ON2H2
R2
R4
Current
Column eluent(carrier gas� analytes)
Reference streamof carrier gas
Voltagemeasurement
R1
R3
� �
FIGURE 21.14 A simple Wheatstone bridge circuit used inthermal conductivity detectors for GC. The symbols , , , and
represent the four resistors that are present in this circuit. Thematerial in the exposed resisters is made up of a material such astungsten or a tungsten-rhenium alloy that will change in its abilityto carry a current as its temperature varies. This particular drawingshows a two-cell detector. A four-cell detector design can also beused in which the carrier gas/analyte mixture is passed over two ofthe resistors (e.g., and ) and the carrier-gas reference streamis allowed to pass over the other two resistors ( and ).R4R1
R3R2
R4
R3R2R1
TABLE 21.5 Thermal Conductivities of RepresentativeCompounds and Carrier Gases
ThermalConductivity(mW/m · K)a
MolarMass
(g/mol)
Inorganic compounds
Hydrogen (H2) 240 2.02
Helium (He) 193 4.00
Nitrogen (N2) 34 28.01
Argon (Ar) 23 39.95
Oxygen (O2) 37 32.00
Carbon Dioxide (CO2) 29 44.01
Organic compounds
Methane (CH4) 54 16.04
Ethane (CH3CH3) 39 30.07
Propane (CH3CH2CH3) 34 44.10
n-Butane (CH3CH2CH2CH3) 32 58.12
n-Pentane (CH3CH2CH2CH2CH3) 29 72.15
aThe listed values are for pure gases at a pressure of one atmosphereand at a temperature of 150°C. These conditions are roughly thesame temperature and pressure conditions as are present within atypical thermal conductivity detector.
96943_21_ch21_p507-536 1/11/10 8:07 AM Page 523

524 Chapter 21 • Gas Chromatography
As the carrier gas and analytes are passed into a FID,they are combined with a stream of hydrogen and passedinto the center of the flame while air is allowed to enterthrough the flame’s exterior. This process creates a flamethat has a hydrogen-rich area in the middle and a largeamount of oxygen around its exterior. When organic ana-lytes enter this flame, they initially encounter the hydrogen-rich region, where bonds are broken between carbon andmost of the other atoms in organic compounds. This leads tothe formation of ions that can undergo an acid–basereaction with water in the flame to produce . Whenthese gas-phase ions reach the collector electrode,they give a response that is related to the number of carbonatoms in the original analyte.
One advantage of using a FID for the analysis oforganic compounds is that this detector gives little or nosignal for many small inorganic compounds like He, Ar,and (typical carrier gases) or , , and (com-mon contaminants of carrier gases). This provides theFID with a low background signal and creates limits ofdetection for organic compounds that are 100- to 1000-fold lower than those that can be obtained with aTCD. The FID can also be used with temperature pro-gramming and has a large linear range, making it a goodchoice when sensitive detection is needed for the routineanalysis of organic compounds. A disadvantage of theFID is it is a destructive detector that breaks down ana-lytes during the process of their measurement. This pre-vents a FID from being connected directly to other typesof detectors or techniques for compound analysis. It ispossible, though, to split the carrier gas stream after theGC column so that part goes to a FID and the other partgoes to a different detector.
Selective Detectors. A second group of GC detectorsare those that are specific for a particular type of chemical.One example is the nitrogen-phosphorus detector (NPD),
H2OCO2O2N2
H3O+
H3O+
CHO+
which is selective for the determination of nitrogen- orphosphorus-containing compounds.9,16,20 The NPD is sim-ilar to a flame ionization detector in that it is based on themeasurement of ions that are produced from eluting com-pounds. However, an NPD does not use a flame for ionproduction. An NPD instead generates ions by using ther-mal heating at or above a surface that can supply electronsto any electronegative species that surround it, formingnegatively charged ions. This mechanism of ion formationis particularly efficient for nitrogen or phosphorus-containing compounds, which makes the NPD selectivefor such chemicals.
Modern NPD detectors make use of the schemeshown in Figure 21.16. As is true for the FID, gas streamsof both hydrogen and air are mixed together with theanalytes and carrier gas that are eluting from the GC col-umn. But in an NPD the flow rate of hydrogen is kept at alevel that is too slow to produce a self-sustaining flame.What happens instead is the hydrogen and analytes arepassed over an electrically heated bead that containsrubidium. The heated surface of this bead causes someanalytes and hydrogen to dissociate into carbon radicalsand free hydrogen atoms. Nitrogen- or phosphorus-containing molecules that enter this heated region tend tobreak apart to form CN or radicals. These radicalscontain unpaired electrons and are highly electronega-tive, so they tend to acquire additional electrons from theheated bead. The exact way in which this process hap-pens is not totally clear, but it is known that this processresults in negative ions like or . These ions arethen collected at an electrode and create a current that isused to detect and measure an eluting analyte.
The greatest strength of the NPD is its goodselectivity and low limits of detection for nitrogen- andphosphorus-containing compounds. In fact, the NPDprovides the lowest available detection limits for the GCanalysis of such substances. Like a FID, the NPD does notdetect many common carrier gases or impurities. When
PO2 -CN-
# PO2#
Hydrogen
Air
Collectingelectrode
Carrier gas andanalytes elutingfrom GC column
FIGURE 21.15 A flame ionization detector.
Hydrogen
Makeup gas
Air
Electrode (�)
Heating coilBead containing
rubidium
Column eluent(carrier gas � analytes)
FIGURE 21.16 A nitrogen–phosphorus detector.
96943_21_ch21_p507-536 1/11/10 8:07 AM Page 524
Section 21.5 • Gas Chromatography Detectors and Sample Handling 525
using an NPD, it is necessary to periodically change theheated material, because this material will slowlydegrade over time. It is also important to carefully controlheating of the bead and the flow rate of hydrogenthrough the NPD to obtain a stable signal for this detec-tor. Several carrier gases can be used with an NPD, butthe heating conditions and hydrogen flow rate need to beoptimized for each of these mobile phases.
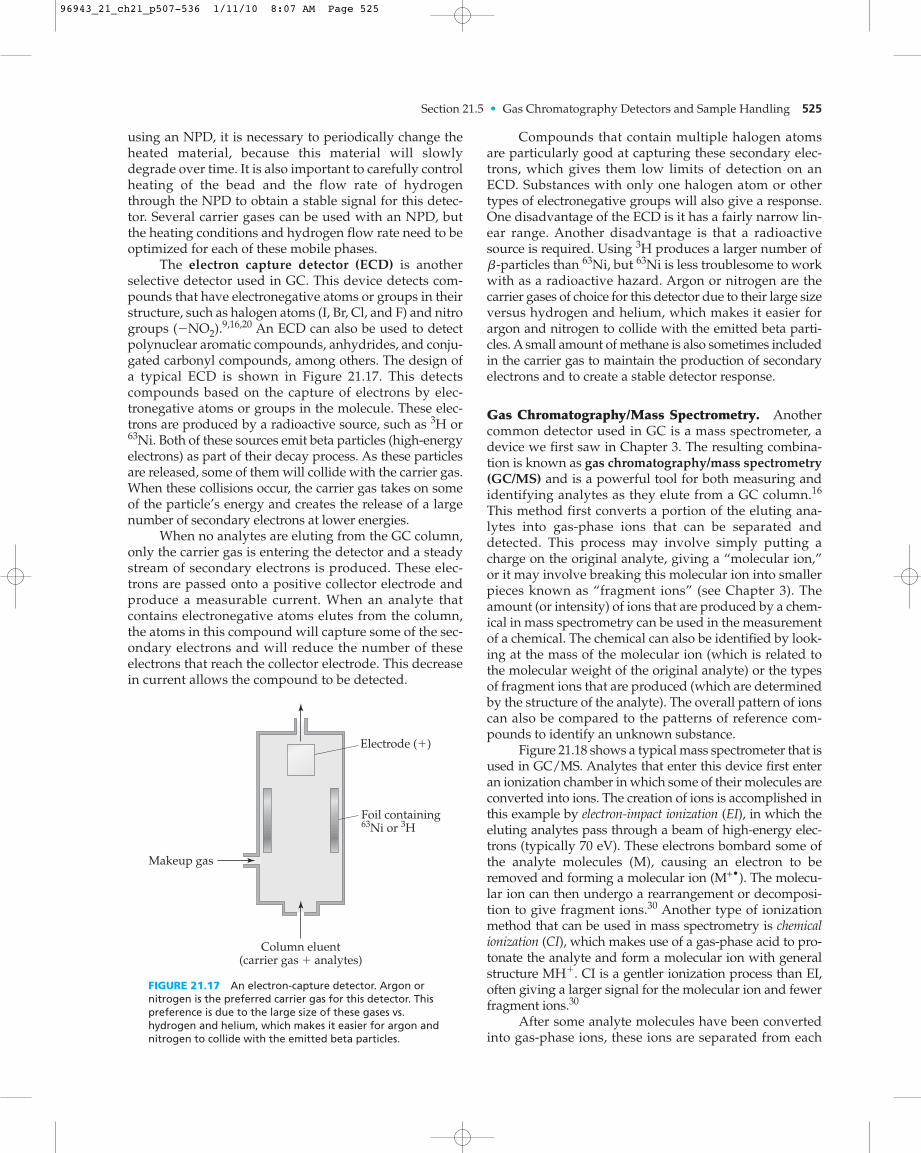
The electron capture detector (ECD) is anotherselective detector used in GC. This device detects com-pounds that have electronegative atoms or groups in theirstructure, such as halogen atoms (I, Br, Cl, and F) and nitrogroups .9,16,20 An ECD can also be used to detectpolynuclear aromatic compounds, anhydrides, and conju-gated carbonyl compounds, among others. The design ofa typical ECD is shown in Figure 21.17. This detectscompounds based on the capture of electrons by elec-tronegative atoms or groups in the molecule. These elec-trons are produced by a radioactive source, such as or
. Both of these sources emit beta particles (high-energyelectrons) as part of their decay process. As these particlesare released, some of them will collide with the carrier gas.When these collisions occur, the carrier gas takes on someof the particle’s energy and creates the release of a largenumber of secondary electrons at lower energies.
When no analytes are eluting from the GC column,only the carrier gas is entering the detector and a steadystream of secondary electrons is produced. These elec-trons are passed onto a positive collector electrode andproduce a measurable current. When an analyte thatcontains electronegative atoms elutes from the column,the atoms in this compound will capture some of the sec-ondary electrons and will reduce the number of theseelectrons that reach the collector electrode. This decreasein current allows the compound to be detected.
63Ni
3H
(-NO2)
Compounds that contain multiple halogen atomsare particularly good at capturing these secondary elec-trons, which gives them low limits of detection on anECD. Substances with only one halogen atom or othertypes of electronegative groups will also give a response.One disadvantage of the ECD is it has a fairly narrow lin-ear range. Another disadvantage is that a radioactivesource is required. Using produces a larger number of
-particles than , but is less troublesome to workwith as a radioactive hazard. Argon or nitrogen are thecarrier gases of choice for this detector due to their large sizeversus hydrogen and helium, which makes it easier forargon and nitrogen to collide with the emitted beta parti-cles. A small amount of methane is also sometimes includedin the carrier gas to maintain the production of secondaryelectrons and to create a stable detector response.
Gas Chromatography/Mass Spectrometry. Anothercommon detector used in GC is a mass spectrometer, adevice we first saw in Chapter 3. The resulting combina-tion is known as gas chromatography/mass spectrometry(GC/MS) and is a powerful tool for both measuring andidentifying analytes as they elute from a GC column.16
This method first converts a portion of the eluting ana-lytes into gas-phase ions that can be separated anddetected. This process may involve simply putting acharge on the original analyte, giving a “molecular ion,”or it may involve breaking this molecular ion into smallerpieces known as “fragment ions” (see Chapter 3). Theamount (or intensity) of ions that are produced by a chem-ical in mass spectrometry can be used in the measurementof a chemical. The chemical can also be identified by look-ing at the mass of the molecular ion (which is related tothe molecular weight of the original analyte) or the typesof fragment ions that are produced (which are determinedby the structure of the analyte). The overall pattern of ionscan also be compared to the patterns of reference com-pounds to identify an unknown substance.
Figure 21.18 shows a typical mass spectrometer that isused in GC/MS. Analytes that enter this device first enteran ionization chamber in which some of their molecules areconverted into ions. The creation of ions is accomplished inthis example by electron-impact ionization (EI), in which theeluting analytes pass through a beam of high-energy elec-trons (typically 70 eV). These electrons bombard some ofthe analyte molecules (M), causing an electron to beremoved and forming a molecular ion (M+•). The molecu-lar ion can then undergo a rearrangement or decomposi-tion to give fragment ions.30 Another type of ionizationmethod that can be used in mass spectrometry is chemicalionization (CI), which makes use of a gas-phase acid to pro-tonate the analyte and form a molecular ion with generalstructure . CI is a gentler ionization process than EI,often giving a larger signal for the molecular ion and fewerfragment ions.30
After some analyte molecules have been convertedinto gas-phase ions, these ions are separated from each
MH+
63Ni63Nib
3H
Makeup gas
Electrode (�)
Foil containing63Ni or 3H
Column eluent(carrier gas � analytes)
FIGURE 21.17 An electron-capture detector. Argon ornitrogen is the preferred carrier gas for this detector. Thispreference is due to the large size of these gases vs.hydrogen and helium, which makes it easier for argon andnitrogen to collide with the emitted beta particles.
96943_21_ch21_p507-536 1/11/10 8:07 AM Page 525

526 Chapter 21 • Gas Chromatography
other based on their mass-to-charge ratios. In Figure 21.18,this separation occurs in a quadrupole mass analyzer. Thisdevice uses a series of four parallel rods that are held atwell-defined AC and DC potentials. Each opposing pairof rods is held at the same potential and any two neigh-boring rods are held at exactly opposite potentials. Overtime, the potentials on these rods are continuously varied.This creates a varying electric field through which onlyions with a certain mass-to-charge ratio will be able topass. If the potentials on the rods are altered over time,ions with different mass-to-charge ratios can be collectedand measured.30
There are several ways of viewing the informationobtained in GC/MS. The first way is to use a mass spectrum.
As we saw in Chapter 3, a mass spectrum is a plot of theintensity of each ion that is detected over a range of mass-to-charge ratios. In the case of GC/MS, this plot is made forthe data that are collected at a particular retention time(generally 50–600 atomic mass units). This type of plot canbe used to identify a chemical in a chromatographic peak.The second type of graph that is employed in GC/MS is amass chromatogram, which is a plot of the number of ionsthat are measured at each elution time. A mass chro-matogram can be constructed by using the intensitiesmeasured for all measured ions (see Figure 21.19) or it canbe prepared using only ions with particular mass-to-chargeratios. It is this last property that allows GC/MS to be uti-lized as a general detector or selective detector.
Inlet fromGC column
Ionization source(EI ionization)
Ions producedfrom analytes
Ion detector
Quadrupolemass analyzer
Stable ion path
Unstable ion path
e� e� ��
�
��
��
FIGURE 21.18 A transmission quadrupole mass spectrometer with an electron-impact ionization source foruse in gas chromatography/mass spectrometry (GC/MS). Other mass spectrometers that can be used in GC/MSinclude ion traps, time-of-flight instruments, and magnetic-sector instruments.
Time (min)
AnalyteMethanolHexaneBenzeneHeptaneTolueneOctaneXylene (o,m,p)StyreneNaphthalene
Retention time1.63 min2.13 min2.54 min2.91 min3.72 min4.09 min4.92 min5.17 min7.82 min
1.63
2.13
2.54
2.91
3.72
4.097.82
5.174.92
10 843 65 72
100
60
40
20
80
0
70
50
30
90
10
Rel
ativ
e ab
und
ance
FIGURE 21.19 A chromatogram obtained by gas chromatography/mass spectrommetry(GC/MS) for a VOC standard. This sample contained 10 ppb of 11 different volatileorganic compounds. (Reproduced with permission from S. Basiaga, University ofNebraska, Lincoln.)
96943_21_ch21_p507-536 1/11/10 8:07 AM Page 526

Section 21.5 • Gas Chromatography Detectors and Sample Handling 527
The use of GC/MS as a general detector by collect-ing information on a wide range of ions is known as thefull-scan mode of GC/MS. The full-scan mode is useful forlooking at a broad range of compounds in a single analy-sis or for determining the identity of an unknown com-pound from its mass spectrum. The use of GC/MS tocollect information on only a few ions is called selected ionmonitoring (SIM). In this approach, only a few ions char-acteristic of the compounds of interest are examined. SIMis employed when low detection limits are desired andwhen it is known in advance what compounds are to beanalyzed and what types of ions they produce in themass spectrometer. SIM provides detection limits that areroughly 100- to 1000-times lower than the full-scan modebecause it monitors ions at only a few mass-to-chargeratios instead of ions covering a wide mass range. Thisdifference allows SIM to spend more time collecting a sig-nal for ions that are related to a particular analyte, whichhelps improve the limit of detection for the analyte whilealso avoiding interferences from other compounds in thesample by providing a means for more specific detection.
EXERCISE 21.4 Selected Ion Monitoring in Gas Chromatography/MassSpectrometry
An analyst wishes to modify the GC/MS method inFigure 21.19 to create a selective method for for styrenethat can be used in the presence of o-xylene. Mass spectraare collected for each of these two compounds when they
Mass-to-change ratio (m/z)
50 65 79
106
91
6040 160120100 14080
Rel
ativ
e io
n ab
und
ance
Mass-to-change ratio (m/z)
50
63
78
104
91
6040 160120100 14080
Rel
ativ
e io
n ab
und
ance
o-Xylene(MW � 106)
Styrene(MW � 104)
FIGURE 21.20 Mass spectra for separate samples of o-xylene and styrene, as obtainedby gas chromatography/mass spectrometry (GC/MS) using electron impact ionization.
are injected separately onto this GC/MS system (seeFigure 21.20). From these results, explain how we couldmodify this GC/MS method to perform a selective analy-sis for styrene.
SOLUTION
This problem requires that SIM be used. The mass spec-trum for styrene contains the largest number of ions at amass-to-charge ratio of 104 (the molecular ion), witha reasonable number of ions also being produced at amass-to-charge ratio of 78 (a fragment ion). The massspectrum for o-xylene has only a small number of ions atthese mass-to-charge ratios. Thus, all that is required tomodify this method is to set up the mass analyzer sothat it now only monitors ions with mass-to-chargeratios of 104 (the first choice) or 78 (the second choice).Although information on other compounds in the sam-ple will now be lost, this change should produce a tech-nique that is more selective and has a lower detectionlimit for styrene.
21.5B Sample Injection and Pretreatment
Gas Samples. Because GC requires that analytes enterthe gas phase for analysis, gaseous analytes and samplesare natural candidates for this technique. If an analyte ispresent as a gas at moderate-to-high concentrations, itshould be possible to directly sample and inject this gas
96943_21_ch21_p507-536 1/11/10 8:07 AM Page 527

528 Chapter 21 • Gas Chromatography
onto a GC system. This approach can be performed bypassing the sample through a gas-tight valve like the oneshown in Figure 21.21. Instead of using this type ofvalve, a gas-tight syringe could also be used to inject aknown volume of gas into a GC system.
For trace components of gases like the volatileorganic compounds (VOCs) that are found in air, it is oftennecessary to collect and concentrate these analytes beforethey are examined by GC. One way this collection andconcentration can be performed is by passing a large vol-ume of the gas sample through a solid-phase extractioncartridge or through a liquid into which the analytes willdissolve. Another way of collecting analytes in a gas is touse a cold trap (or “cryogenic trap”). This second approachinvolves passing the gas through a hollow tube or coil thatis kept at a low temperature. As the analytes enter this tubeor coil, they will condense and be collected. After these
substances have been collected, they can be released andpassed into the GC system by raising the temperature.
Liquid Samples. Liquid samples are frequently used inGC. For example, GC has been used to analyze VOCs inthe blood of people who are routinely exposed to air pollu-tion. Figure 21.22 shows various ways in which a liquidsample might be placed into a GC system. When usingcolumns that can handle relatively large sample volumes( for packed columns or wide-bore open-tubularcolumns), direct injection can be used for a liquid sample.20
Direct injection uses a calibrated microsyringe to apply thedesired volume of sample to the system. The microsyringeis passed through a gas-tight septum and into a heatedchamber where the liquid sample and its contents arevaporized and swept by the carrier gas into the column.This approach allows essentially 100% transfer of the ana-lytes into the column. The main limitation of direct injec-tions is that they cannot be used with many open-tubularcolumns, which often require smaller sample volumes thanthose that can be accurately delivered with a microsyringe.
Split injection is a common way of overcoming thislast problem. In split injection a microsyringe is again usedto inject a liquid sample into a GC system. As the sample isconverted into a gas in the injection area, its vapors aredivided so that only a small portion (0.01%–10%) goes intothe column (the remainder going to a side vent).20 Thisprocedure allows the volume of sample that reaches thecolumn to be greatly reduced. The result is a lower chanceof overloading the column with the sample, especially fornarrow-bore or moderate-bore open-tubular columns.Split injection works well for relatively concentrated sam-ples, but can be difficult to use for trace analysis, becausemuch of the sample is discarded during the injectionprocess. Another problem with split injection is that ana-lytes with different volatilities may not have equal frac-tions that enter the column. This effect can create a variablerecovery for analytes and can affect their measurement.
Splitless injection is a type of direct injection that isspecifically performed on a system that can also be usedfor split injection. This approach is again carried out with
6–10 mL
Sample loop
Sample loading position
Sample inWaste
To columnCarrier gas
Sample injection position
Sample inWaste
To columnCarrier gas
FIGURE 21.21 A sampling valve for the injection of gas samplesonto a gas chromatography (GC) system. The paths that the sampleand carrier gas take through the valve are shown for both the sampleloading position and the sample injection position of the valve.
Carriergas
Septumpurge
Splitoutlet
Injectorinsert
Column
Carriergas
Injectorinsert
Column
Carriergas
Splitless injectionSplit injectionDirect injection On-Column injection
Septumpurge
Injectorinsert
Column
Carriergas Injector
Oven
Plug of sample liquid
Sample of liquidforming film
Column
FIGURE 21.22 Common gas chromatography (GC) injection techniques for liquid samples. The dotted regions in each diagram representthe injected sample components after they have entered the vapor phase.
(Reproduced with permission from K. Grob, “Injection Techniques in Capillary GC,” Analytical Chemistry, 66 (1994) 1009A–1019A.)
96943_21_ch21_p507-536 1/11/10 8:08 AM Page 528

Section 21.5 • Gas Chromatography Detectors and Sample Handling 529
microsyringes and open-tubular columns, but the sidevent of the injection system is now kept closed so thatmost of the injected and vaporized sample will go intothe column.2 After the analytes have entered the column,the side vent is opened to flush out any undesired vaporsfrom the injection chamber before the next sample isapplied. Because little sample is lost during its injection,this approach is better to use than split injection whenperforming a trace analysis. However, splitless injectiondoes have greater difficulty with overloading the columnby a sample.
Another way of applying a liquid sample to a GCsystem is cold on-column injection. In this technique amicrosyringe containing the sample is passed through the“injector” and directly into the column or an uncoatedprecolumn. The region around the syringe is initially keptcool so that the sample can be deposited in the column asa liquid film. This liquid is later heated, causing the ana-lytes to enter the carrier gas to begin their passagethrough the column.20 Because the sample is applieddirectly to the column or precolumn in this method,essentially 100% of each analyte is available for measure-ment. This approach can have problems if there are anylow-volatility substances in the sample, which will accu-mulate at the top of the column or precolumn and alterthe properties of the GC system over time. In this situa-tion, splitless injection is preferred because it allows suchcomponents to be removed between injections.
It is quite common for some pretreatment to berequired before a liquid sample can be analyzed by GC.In Section 21.2A we saw how derivatization is often usedto convert analytes into a more volatile or thermally sta-ble form. This is one type of sample pretreatment.Another common type of pretreatment is when analytesare moved from their original sample into a solvent thatis more suitable for injection onto a GC system. In partic-ular, water and aqueous samples (such as blood) shouldnot be injected directly onto most GC columns. Waterbinds strongly to many GC columns and can create prob-lems with the long-term behavior and reproducibility ofthese columns. In addition, the water may contain dis-solved solids, salts, or other nonvolatile compounds thatare not suitable for injection onto a GC system.
To avoid these problems with water, aqueous sam-ples are often pretreated before GC analysis by usingliquid–liquid extraction, solid-phase extraction, or solid-phase microextraction (methods discussed in Chapter 20).Both liquid–liquid extraction and solid-phase extractionare used to transfer analytes from water to a more volatilesolvent and to help remove the analytes from nonvolatilesubstances in the sample. These methods can also be usedwith solvent evaporation to reduce the final volume of theextract and increase the concentration of analyte in thisextract for easier detection.14 In solid-phase microextrac-tion, analytes can be extracted from an aqueous sampleby using a coated fiber that is later placed directly into
the GC system. This approach again removes analytesfrom water or nonvolatile substances in the sample.Solid-phase microextraction also reduces column over-loading effects because little or no liquid is injected alongwith the analytes.
Headspace analysis is another technique that makesit possible to avoid the introduction of water and non-volatile compounds into a GC system. Headspace analy-sis is based on the fact that volatile analytes in a liquid orsolid sample will also be present in the vapor phase (or“headspace”) that is located above the sample. If a por-tion of this headspace is collected, it can be used to meas-ure volatile analytes without interference from other, lessvolatile compounds that were in the original sample.20
This approach is often used to examine VOCs in water.Headspace analysis can be carried out in two ways:
the static method and the dynamic method (seeFigure 21.23). In the static method, the sample is placed inan enclosed container and its contents are allowed to dis-tribute between the sample and its vapor phase. Afterequilibrium has been reached, a portion of the vaporphase is collected and injected onto a GC system. In thedynamic method (also called the “purge-and-trap” tech-nique), an inert gas is passed through the sample to carryaway volatile compounds. This gas is then passedthrough a cold trap or solid adsorbent to collect and con-centrate these volatile solutes for analysis. Although thedynamic technique requires more time and effort than thestatic method, it is more reproducible and allows betterdetection of compounds with relatively low volatilities.
Solid Samples. GC can also be adapted for work withchemicals that are adsorbed or held within solid samples.An example of this would be the use of GC to measureVOCs that are adsorbed by soil. A common way of han-dling this type of analysis is to first extract the com-pounds of interest from the solid material. This can beaccomplished by using liquid–liquid extraction or super-critical fluid extraction (see Chapter 20). The extractedanalytes are then placed into an organic solvent andtreated as liquid samples, as described in the last section.
It is also possible to analyze some solids without per-forming an extraction. For instance, headspace analysiscan be used to examine volatile compounds that are pres-ent in a solid. For less volatile substances, the method ofthermal desorption can be employed. This method involvesplacing a known quantity of the solid into a chamberwhere the solid can be heated. As this solid is heated, itsvolatile components will enter the gas phase, allowingthem to be trapped or placed into a GC system for testing.
The general makeup of a solid can also be examinedby using a method known as pyrolysis gas chromatography(or pyrolysis GC).16,20 This technique is useful for solidsubstances like plastics and polymers that are not volatileand cannot be easily derivatized into a volatile form.Pyrolysis GC involves heating a solid sample in a
96943_21_ch21_p507-536 1/11/10 8:08 AM Page 529
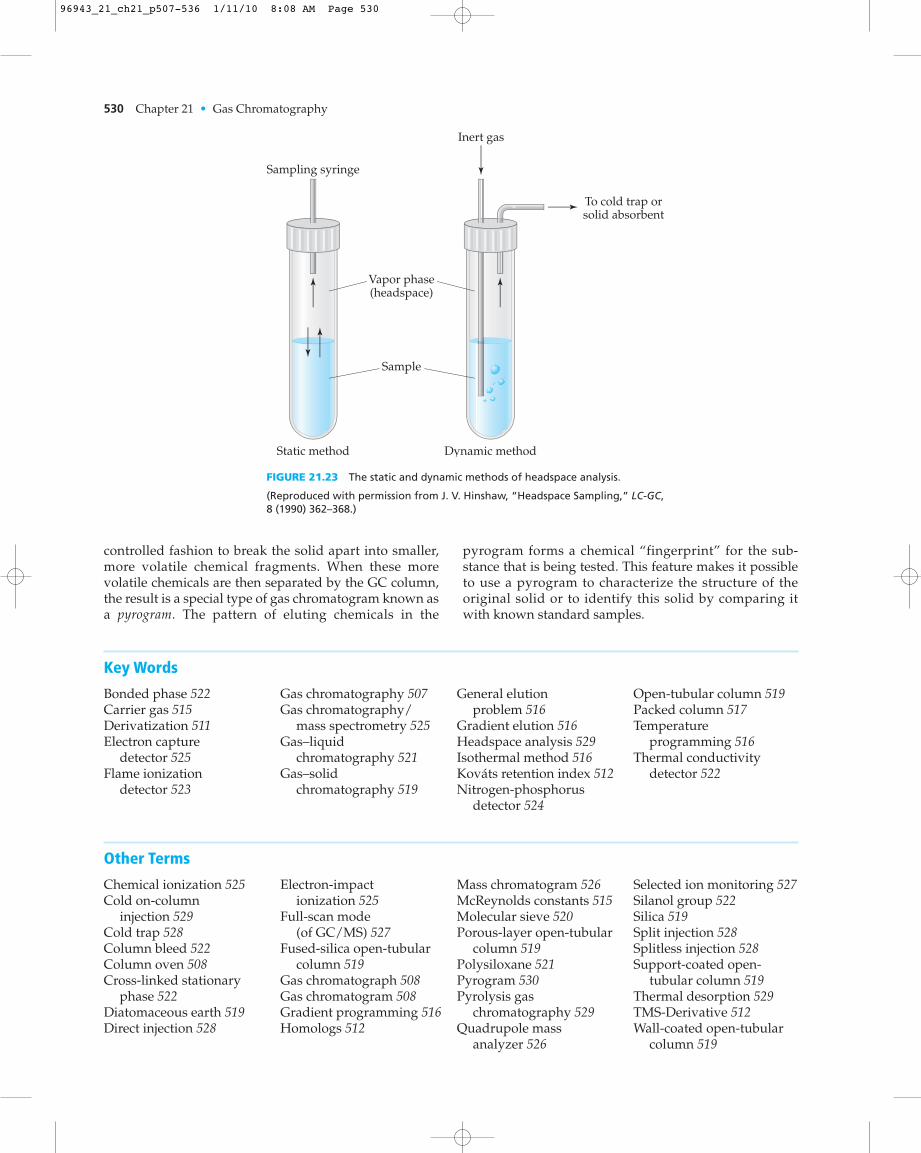
530 Chapter 21 • Gas Chromatography
Dynamic method
Vapor phase(headspace)
Inert gas
Sampling syringe
To cold trap orsolid absorbent
Sample
Static method
FIGURE 21.23 The static and dynamic methods of headspace analysis.
(Reproduced with permission from J. V. Hinshaw, “Headspace Sampling,” LC-GC,8 (1990) 362–368.)
Key Words
Bonded phase 522Carrier gas 515Derivatization 511Electron capture
detector 525Flame ionization
detector 523
Gas chromatography 507Gas chromatography/
mass spectrometry 525Gas–liquid
chromatography 521Gas–solid
chromatography 519
General elution problem 516
Gradient elution 516Headspace analysis 529Isothermal method 516Kováts retention index 512Nitrogen-phosphorus
detector 524
Open-tubular column 519Packed column 517Temperature
programming 516Thermal conductivity
detector 522
Other Terms
Chemical ionization 525Cold on-column
injection 529Cold trap 528Column bleed 522Column oven 508Cross-linked stationary
phase 522Diatomaceous earth 519Direct injection 528
Electron-impact ionization 525
Full-scan mode (of GC/MS) 527
Fused-silica open-tubularcolumn 519
Gas chromatograph 508Gas chromatogram 508Gradient programming 516Homologs 512
Mass chromatogram 526McReynolds constants 515Molecular sieve 520Porous-layer open-tubular
column 519Polysiloxane 521Pyrogram 530Pyrolysis gas
chromatography 529Quadrupole mass
analyzer 526
Selected ion monitoring 527Silanol group 522Silica 519Split injection 528Splitless injection 528Support-coated open-
tubular column 519Thermal desorption 529TMS-Derivative 512Wall-coated open-tubular
column 519
controlled fashion to break the solid apart into smaller,more volatile chemical fragments. When these morevolatile chemicals are then separated by the GC column,the result is a special type of gas chromatogram known asa pyrogram. The pattern of eluting chemicals in the
pyrogram forms a chemical “fingerprint” for the sub-stance that is being tested. This feature makes it possibleto use a pyrogram to characterize the structure of theoriginal solid or to identify this solid by comparing itwith known standard samples.
96943_21_ch21_p507-536 1/11/10 8:08 AM Page 530

• Questions 531
WHAT IS GAS CHROMATOGRAPHY AND HOW IS IT PERFORMED?
1. What is “gas chromatography” and how is it used in chem-ical analysis?
2. Name each of the main components of a basic GC chro-matograph. Explain the function of each component.
3. Define each of the following terms: (a) gas chromatogram,(b) gas chromatograph, and (c) column oven. How is each ofthese used in gas chromatography?
4. Discuss how GC can be used for chemical separation andmeasurement.
5. The amount of morphine in a blood sample is determinedby GC. First, a 2 mL sample of blood is adjusted to pH 9.9and of nalorphine is added as an internal standard.The morphine and nalorphine are then extracted into atoluene:hexane:isoamyl alcohol mixture, evaporated to dry-ness, and derivatized with N-methyl-bis-trifluoroacetamide(MBTFA). Out of a total volume of approximately ,
is then injected onto a GC system and analyzed. Thefollowing results are obtained for the sample and a series ofstandards. What was the concentration of morphine in theunknown sample?
1 mL40 mL
20 mg
REQUIREMENTS FOR THE ANALYTE
7. What general characteristics should a compound have if it isto be analyzed by gas chromatography?
8. Which of the following chemicals should be suitable foranalysis by GC? Explain your answers. (Note: bp is the boil-ing point at 1 atm.)(a) Toluene ( , bp 110.6°C)(b) Naphthalene ( , bp 218°C)(c) Decanoic acid ( , bp 270°C)(d) Melene ( , bp 380°C)
9. If the chemicals in Problem 8 were injected onto a nonpolarGC column, what would be their expected elution orderbased on volatility?
10. What is meant by the term “thermal stability”? Why is ther-mal stability important in GC?
11. Discuss how it can be determined experimentally whether achemical has sufficient thermal stability for analysis by GC.What are some general ways in which problems with ther-mal stability can be overcome in GC?
12. What is meant by chemical “derivatization”? What aresome reasons for the use of chemical derivatization in GC?
13. What is a “TMS derivative”? How can this make a com-pound more suitable for GC?
14. The structure of dicamba, a common herbicide, is shownbelow. Draw a reaction that shows how this compoundwould react with trimethylchlorosilane when this reagent isused to derivatize dicamba for analysis by GC. Explain howthis reaction changes the structure of dicamba so that it isnow easier to examine by gas chromatography.
15. The following reaction is for the derivatization of a car-boxylic acid with methanol in the presence of . Theresult is a derivative known as a “methyl ester.”
Explain why this type of derivatization might be useful inGC in terms of the changes it produces in volatility or ther-mal stability.
FACTORS THAT DETERMINE RETENTION IN GAS CHROMATOGRAPHY
16. Explain why chemical volatility is important in GC. In gen-eral, how does an increase in volatility affect the retention ofa chemical in GC?
17. What is meant by the term “homologs”? What kind ofbehavior is expected when a mixture of homologs is injectedonto a GC system?
O O
Carboxylicacid
(analyte)
COH CH3OH�RBF3
Methanol(derivatizing
agent)
Methyl esterderivative
COCH3 H2O�R
BF3
Dicamba
O
Cl
Cl
OH
CH3
O
C30H60
C9H19CO2HC10H8
C7H8
Questions
Relative Peak Area
Concentration (ng/mL)
MBTFA-Morphine
MBTFA-Nalorphine
0 0.1 56.020 15.2 49.2
40 32.5 52.4
60 50.1 54.1
80 65.3 52.3
Unknown 45.8 53.9
6. The following data were obtained on a GC/MS systemusing toluene as a VOC standard and a fixed amount ofdeuterated toluene as an internal standard.
Relative Peak Height
Toluene Concentration(ppb)
Toluene Deuterated Toluene
0 12 233100 76 228
200 167 247
300 250 249
400 291 218
(a) An unknown sample that is injected under the sameconditions as the standards gives a relative peak heightof 178 for toluene and 229 for deuterated toluene. Whatis the concentration of toluene in this sample?
(b) The detector that is used in this GC system has aresponse factor of 0.71 of isopentane vs. toluene. If asample gives a relative peak height of 88 for isopentaneand 238 for deuterated toluene, what is the approximateconcentration of isopentane in this sample?
96943_21_ch21_p507-536 1/11/10 8:08 AM Page 531

532 Chapter 21 • Gas Chromatography
18. What is the expected elution order in GC for each of the fol-lowing homologous compounds?(a) An alcohol sample that contains 1-butanol
, ethanol , methanol, and 1-propanol
(b) Diesel fuel that contains benzene , ethylbenzene, and toluene
(c) A sample of butter that contains butyric acidand caproic acid ( ,
also known as hexanoic acid)19. How does temperature affect the retention of compounds
on GC columns? What happens to the retention of a chemi-cal in GC as the temperature is increased?
20. What is the Kováts retention index? How is it calculated?How is it used in GC?
21. Injection of ethane, propane, butane, pentane, hexane, hep-tane, and octane on a squalene column under isothermalconditions gives retention times of 3.51, 4.98, 7.30, 11.00,16.85, 26.12, and 40.8 min, respectively. Air, which is nonre-tained, elutes at 1.00 min. An injection of benzene, butanol,nitropropane, pyridine, and 2-pentanone under the sameconditions gives retention times of 20.00, 6.50, 4.10, 10.05,and 10.35 min. What are the Kováts retention indexes forbenzene, butanol, nitropropane, pyridine, and 2-pentanoneunder these conditions?
22. A new GC column that is used under the same conditions asin Problem 21 gives retention times for the n-alkanes ethane
through octane that are equal to 3.00, 3.82,4.98, 6.62, 8.94, 12.22, and 16.80 min. Air, which is nonre-tained by this column, elutes at 1.00 min under these condi-tions. The injection of benzene, butanol, nitropropane,pyridine, and 2-pentanone gives retention times of 13.05,5.30, 4.10, 6.60, and 14.10 min, respectively.(a) What are the Kováts retention indexes for benzene,
butanol, nitropropane, pyridine, and 2-pentanone onthis new column?
(b) How do the Kováts retention indexes calculated for thisnew GC column compare to those obtained inProblem 21 for a GC column that contains squalane asthe stationary phase? What information does this tellyou about the retention properties of this new column?
23. A useful feature of the Kováts retention index it that a plotof I or log(t R) versus the number of carbon atoms in a chainfor a series of homologs gives a linear relationship underisothermal conditions. Based on such a trend, what are theexpected adjusted retention times and retention times fornonane and decane when using the samecolumn and conditions that were employed in Problem 22?
COLUMN EFFICIENCY IN GAS CHROMATOGRAPHY24. Explain how the low density and low viscosity of a gas both
help to provide high efficiency in gas chromatography.25. Explain why columns in GC can often be made much longer
or used at higher flow rates than columns used in liquidchromatography.
26. Using the information provided in Table 21.2, estimate thetotal number of theoretical plates that would be expectedfor each of the following GC columns. What would be theapproximate plate heights for these same columns?(a) A 2 m long and 2 mm inner-diameter packed column(b) A 20 m long and 0.32 mm inner diameter open-tubular
column(c) A 50 m long and 0.10 mm inner diameter open-tubular
column
(C10H22)(C9H20)
¿
(C8H18)(C2H6)
CH3(CH2)4CO2H(CH3(CH2)2CO2H)
(C6H5CH3)(C6H5CH2CH3)(C6H6)
(CH3(CH2)2OH)(CH3OH)(CH3CH2OH)(CH3(CH2)3OH)
27. A chromatogram for the analysis of volatile organic com-pounds in unleaded gasoline using a 100 m long columngave a separation that had 400,000 theoretical plates. Basedon this information, estimate the baseline widths that wouldbe expected for peaks due to n-pentane ,toluene and 1,2,4-trimethylbenzene
in this separation. You may assume that eachpeak has a Gaussian shape.
COMMON MOBILE PHASES IN GAS CHROMATOGRAPHY
28. What is the role of the mobile phase in GC?29. What is meant by the term “carrier gas”? What carrier gases
are often used in GC?30. Why is it important to use high-purity gases in GC? What
types of impurities can be found in the carrier gas?31. Why are pressure and flow-rate control important for the
carrier gas in GC?
ELUTION METHODS IN GAS CHROMATOGRAPHY
32. In GC, what is meant by the term “isothermal method”?What are the advantages of an isothermal method?
33. What is the “general elution problem”? Explain how this prob-lem can affect the separation of a complex sample mixture.
34. What is “gradient elution”? How does gradient elution helpsolve the general elution problem?
35. What is “temperature programming”? Explain why temper-ature programming can be used in GC to help solve the gen-eral elution problem.
36. Describe the typical steps in a temperature program for GC.Explain the purpose for each of these steps.
GAS CHROMATOGRAPHY SUPPORT MATERIALS
37. What is a “packed column”? What are typical dimensions ofa packed column in GC?
38. What is diatomaceous earth? How is this used in GC?39. Under what circumstances is it helpful to use a packed col-
umn in GC? What are the disadvantages of packed columnsin GC?
40. What is an “open-tubular column”? What are the typicaldimensions of an open-tubular column in GC?
41. Compare and contrast each of the following items.(a) Wall-coated open-tubular column(b) Support-coated open-tubular column(c) Porous-layer open-tubular column
42. What is a “fused-silica open-tubular column”? How is thisused in GC?
GAS CHROMATOGRAPHY STATIONARY PHASES
43. What is “gas-solid chromatography”? What general typesof stationary phases are used in gas–solid chromatography?
44. What is a “molecular sieve”? How are molecular sievesused in gas–solid chromatography?
45. What is “gas–liquid chromatography”? What general typesof stationary phases are used in this method?
46. What is the general structure of a polysiloxane? Why are poly-siloxanes useful as stationary phases in gas chromatography?
47. What is “column bleed”? What causes column bleed in GC?48. Define each of the following terms. How are these items
used to overcome column bleed in GC?(a) Bonded phase(b) Silanol group(c) Cross-linked stationary phase
(tR = 58 min)(tR = 33 min)
(tR = 10 min)
96943_21_ch21_p507-536 1/11/10 8:08 AM Page 532

• Questions 533
�O
Parathion
O OCl
P
S
SN�
N
OHHO
N
Imipramine
Ethylene glycol
TYPES OF GAS CHROMATOGRAPHY DETECTORS
49. Describe the way in which each of the following general GCdetectors produces a signal. What properties of an analytewill determine its ability to produce a signal on each ofthese detectors?(a) Thermal conductivity detector(b) Flame ionization detector
50. Describe the way in which each of the following selectiveGC detectors produces a signal. What properties of an ana-lyte will determine its ability to produce a signal on each ofthese detectors?(a) Nitrogen-phosphorus detector(b) Electron-capture detector
51. Which of the following compounds would you expect to pro-vide a good response on a nitrogen-phosphorus detector?(a) Parathio(b) Imipramine(c) Ethylene glycol
53. What is “gas chromatography/mass spectrometry”?Explain why this approach can be used for either the gen-eral or selective detection of analytes.
54. What is a molecular ion? What is a fragment ion? Whatinformation is provided by each of these different types ofions in mass spectrometry?
55. What is “electron-impact ionization”? What is “chemicalionization”? How are each of these techniques used in massspectrometry?
56. Explain how a quadrupole mass spectrometer can be usedto separate ions with different mass-to-charge ratios.
57. Define or describe each of the following terms as related toGC/MS.(a) Mass spectrum(b) Mass chromatogram(c) Full-scan mode(d) Selected ion monitoring
58. Which common GC detector would you recommend foreach of the following situations? Explain the reasons foreach choice.(a) The analysis of urine samples at the Olympics to
determine if any athletes are taking performance-enhancing drugs
(b) The trace analysis of polychlorinated biphenyls inwater samples
(c) Determination of oxygen, carbon dioxide, and water assemi-trace components in a sample of helium
SAMPLE INJECTION AND PRETREATMENT59. Describe how gaseous samples are typically injected or
placed into a GC system.60. Describe each of the following approaches for the injection
of liquids into a GC system. What are the advantages anddisadvantages for each of these approaches?(a) Direct injection(b) Split injection(c) Splitless injection(d) On-column injection
61. Why does the direct injection of water-based samples createproblems with many GC columns? Discuss how this prob-lem can be avoided through the use of an extraction.
62. What is “headspace analysis”? How is this used in GC?63. Describe the dynamic and static methods of headspace
analysis.64. Explain how the contents of a solid sample can be analyzed
by GC by using an extraction.65. Define each of the following items and describe how they
are used in GC.(a) Thermal desorption(b) Pyrolysis gas chromatography(c) Pyrogram
66. Discuss some of the reasons behind each of the followingselections of sample injection or pretreatment methods.(a) In EPA method 505, GC is used for the analysis of chlori-
nated pesticides in drinking water following extractionof the original sample with hexane.
(b) A company uses pyrolysis-GC to characterize thedegree of branching that occurs within a preparation ofthe high-density polyethylene (HDPE).
(c) Headspace analysis is used by a police laboratory forthe determination of blood-alcohol levels.
(d) Endrin (used in the past as an insecticide) tends torearrange to form endrin aldehyde or endrin ketone when
52. Which of the following compounds would you expect toprovide a good response on an electron capture detector? (a) DDT(b) Tetrahydrofuran(c) Freon-12
DDT
Tetrahydrofuran
O
Cl
Freon-12
Cl
ClF
F
Cl
Cl
Cl
Cl
96943_21_ch21_p507-536 1/11/10 8:08 AM Page 533

534 Chapter 21 • Gas Chromatography
it is applied to a GC system by splitless injection, but doesnot do so when PTV or cold on-column injection is used.
CHALLENGE PROBLEMS
67. Look up the boiling points (if available) and molar masses foreach of the following compounds, using resources such as theCRC Handbook of Chemistry and Physics or the Merck Index.31,32
Use this information to determine whether each of thesechemicals can be examined by GC without derivatization.(a) Glucose(b) Quinoline(c) Erythromycin(d) Insulin(e) Triheptylamine(f) Coumarin
68. Some data on the thermal stability of chemicals can also beobtained from resources like the CRC Handbook of Chemistryand Physics and the Merck Index.31,32 For example, bothReferences 31 and 32 indicate whether a compound is ther-mally unstable by providing an abbreviation like “d,” “dec,”or “decomp” next to the information given on the com-pound’s melting points and/or boiling points. Based on thisinformation, determine which of the following chemicalshave low thermal stabilities and give the approximate tem-peratures at which they begin to decompose.(a) Benzene(b) Glycine(c) Folic acid(d) tert-Butylamine(e) Tetradecane(f) Pyruvic acid
69. The following retention times were measured for 1-octanol,2,4-dimethylaniline, and n-dodecane by GC on a columnwhere the void time was 0.55 min.33
789 for 2-pentanone, 895 for 1-nitropropane, and 901 for pyri-dine. What are the McReynolds constants for OV-17?
71. A catalog lists the following data for some commercial GCcolumns. Based on this information, rank these columns interms of (a) their overall polarity, and (b) their ability toretain compounds like benzene, butanol, pyridine, nitro-propane, and 2-pentanone. Which columns are the mostsimilar in your rankings? Which have the greatest differ-ences? Explain how you arrived at your answers.
72. The proper selection of a stationary phase for GC willdepend on factors such as the physical nature and chemicalproperties of the analytes, the different chemical interactionsof these analytes, and the temperatures to be used during theseparation. For instance, gas–solid chromatography is gener-ally the method of choice when working with very volatileanalytes that occur as gases at room temperature, while GLCtends to work better for less volatile analytes. Explain eachof the following choices of stationary phases for GC.(a) A petroleum chemist uses a PLOT column containing a
polystyrene/divinyl benzene porous polymer for theanalysis of saturated hydrocarbons (methanethrough n-decane).
(b) An OV-1 column (which contains 100%dimethylpolysiloxane as the stationary phase) isemployed for the analysis of volatile organic com-pounds in air.
(c) A chemist switches from a DB-5 column (which contains5% phenyl-95% methylpolysiloxane as the stationaryphase) to a Carbowax 20M column for analyzing a mix-ture of alcohols like methanol, ethanol, n-propanol, and2-propanol.
73. Although the carrier gas does not affect solute retention, thechoice of which gas to use as the mobile phase is importantin other ways to a GC method. Factors that need to be con-sidered in choosing a carrier gas include the type of detectorthat is being used and possible risks or hazards involved inusing the gas.(a) Discuss the relative risks that would be associated with
the use of hydrogen, helium, nitrogen, or argon as car-rier gases. What types of chemical or physical hazardsare associated with each of these gases?
(b) What detectors discussed in this chapter can be usedwith each of the following gases: hydrogen, helium,nitrogen, or argon? Explain how this is related to theprinciples behind the operation of these GC detectors.
(c) One advantage of using a low-mass carrier gas like hydro-gen or helium is that this produces much faster rates ofcompound diffusion than heavier carrier gases, such asnitrogen or argon. How do you think the use of a low-masscarrier gas will affect the efficiency of a GC separation?
C1-C10
Retention Time (min)
Temperature(°C)
1-Octanol 2,4-Dimethylaniline n-Dodecane
80 8.50 13.74 17.16
90 5.57 8.87 10.56
100 3.86 5.92 6.86
110 2.79 4.27 4.72
120 2.10 3.12 3.31
130 1.60 2.37 2.46
(a) Make a plot of the retention time versus column temper-ature T (in °C) for each of these compounds. Whatobservations can you make from these graphs?
(b) Make a second series of graphs in which the logarithm ofeach compound’s adjusted retention time, or log ( ), isplotted versus 1/T (now expressed in kelvin). What obser-vations can you make from this new group of graphs?
(c) Based on the results in Part (b), discuss the relativeadvantages of using log( ) instead of tR as measure ofretention when calculating a Kováts retention index.
70. The same compounds listed in Table 21.1 were used to exam-ine a commercial column that contained a liquid stationaryphase with the tradename “OV-17.” This column gaveKováts retention indices of 772 for benzene, 748 for 1-butanol,
tRœ
tRœ
McReynolds Constants
Type of Column X’ Y’ Z’ U’ S’
Diglycerol 371 826 560 676 854
Ethofat 60/40 191 382 244 380 333
Igepal CO-630 192 381 353 382 344
OV-1 16 55 44 65 42
96943_21_ch21_p507-536 1/11/10 8:08 AM Page 534

• References 535
TOPICS FOR REPORTS AND DISCUSSION74. The speed and efficiency of GC have made this technique
popular for chemical separation and analysis in a largenumber of fields.9,16 Obtain information on how GC isemployed in one or more of the following areas.(a) Clinical chemistry(b) Environmental science(c) Forensic science(d) Petroleum chemistry(e) Polymer science(f) Food science
75. Contact an analytical laboratory in your area that makes useof gas chromatography. Discuss how GC is used in this lab-oratory and describe the types of analytes and samples it isused to examine.
76. For several years there has been interest in developing GCcolumns with temperature limits above those of mostcurrent GC columns. This has led to an area known as high-temperature gas chromatography (HTGC).16 Look up informa-tion on the types of columns that are used in this technique.What advantages can be gained by having a column with ahigher upper temperature limit? What are some applica-tions of HTGC?
77. In cryogenic gas chromatography, the GC system is modifiedso that it can be used to perform separations that are farbelow room temperature.16 What specific modificationsare made in the GC system in order for this approach to beused? What types of analytes do you think would be bestanalyzed under these low-temperature conditions? Howmight the use of a lower temperature affect the types ofstationary phases that can be used in the GC method?What types of stationary phases are most often used insuch separations?
78. Beside temperature programming, another type of gradientelution that can be used in GC is flow programming (alsocalled pressure programming).8,9,16 Obtain information on thistechnique and discuss how it is performed. What are theadvantages of this method compared to temperature pro-gramming? What are its disadvantages? Give some exam-ples of its applications.
79. Besides the detectors that have been mentioned in this chap-ter, there are many other types of monitoring devices thatcan be used with GC columns. A few examples are listedbelow. Find information on one or more of these detectors.Report on the principles behind the detector’s operationand compare it to other GC detectors discussed in this text.State what types of compounds can be monitored by thedetector and discuss for some its typical applications inchemical analysis.9,13,16
(a) Electrolytic-conductivity detector(b) Flame photometric detector(c) Photoionization detector(d) Thermionic emission detector(e) Gas density balance(f) Sulfur chemiluminescence detector
80. The earliest commercial systems for gas chromatographyfirst appeared approximately 50 years ago.34 Obtain moreinformation on the history of GC instrumentation and writea report that summarizes developments that have occurredin this field.
81. The area of high-speed gas chromatography (or fast GC) is anarea of ongoing research.35 Describe this technique and howit is performed. What are the advantages of this approach?What are its disadvantages? How does its instrumentationdiffer from that used in normal GC? What are some applica-tions of this method?
1. S. Enriquez, “Mexico City a Living Laboratory for SmogStudy,” Los Angeles Times, March 31, 2006, A.20.
2. J. M. Lentz and W. J. Kelley, “Clearing the Air in LosAngeles,” Scientific American, 268 (1993) 32–39.
3. D. Cyranoski and I. Fuyuno, “Climatologists Seek ClearView of Asia’s Smog,” Nature, 434 (2005) 128.
4. S. Sillman, “Photochemical Smog: Ozone and ItsPrecursors,” Handbook of Weather, Climate and Water, 1 (2003)227–242.
5. P. B. Kelter, J. D. Carr and A. Scott, Chemistry: A World ofChoices, WCB/McGraw-Hill, St. Louis, MO, 1999,Chapter 12.
6. Photochemical Smog: Contribution of Volatile OrganicCompounds, Organization for Economic Co-operation andDevelopment (OECD), Paris, 1982.
7. Photochemical Oxidants, World Health Organization,Switzerland, Geneva, 1979.
8. J. Inczedy, T. Lengyel, and A. M. Ure, Compendium ofAnalytical Nomenclature, 3rd ed., Blackwell Science, Malden,MA, 1997.
9. S. O. Falwell, “Modern Gas ChromatographicInstrumentation,” In Analytical Instrumentation Handbook, G.W. Ewing, Ed., Marcel Dekker, New York, 1997, Chapter 23.
10. H. A. Laitinen and G. W. Ewing, A History of AnalyticalChemistry, Maple Press, New York, 1977, Chapter 5.
11. L. S. Grinstein, R. K. Rose, and M. H. Rafailovich, Women inChemistry and Physics: A Biobibliographic Sourcebook,Greenwood Press, Westport, CT, (1993), 129–135.
12. J. V. Hinshaw, “Handling Fast Peaks,” LC-GC, 19 (2001)1136–1140.
13. R. L. Grob, Modern Practice of Gas Chromatography, 3rd ed.,Wiley, New York, 1995.
14. H. M. McNair, “Method Development in GasChromatography,” LC-GC, 11 (1993) 794–800.
15. J. Drozd, Chemical Derivatization in Gas Chromatography,Elsevier, Amserdam, the Netherlands, 1981.
16. C. F. Poole and S. K. Poole, Chromatography Today, Elsevier,Amserdam, the Netherlands, 1991, Chapter 8.
17. W. J. A. VandenHeuvel, “Some Aspects of the Chemistry ofGas-Liquid Chromatography,” In Gas Chromatography ofSteroids in Biological Fluids, M. B. Lipsett Ed., Plenum Press,New York, (1965), 277–295.
18. E. sz. Kováts, “Gas Chromatographic Characterization ofOrganic Substances in the Retention Index System,”Advances in Chromatography, Vol. 1, J. C. Giddings and R. A.Keller, Eds., Marcel Dekker, New York, 1965, Chapter 7.
References
96943_21_ch21_p507-536 1/11/10 8:08 AM Page 535

536 Chapter 21 • Gas Chromatography
19. L. S. Ettre, “Retention Index Systems. Its Utilization forSubstance Identification and Liquid-PhaseCharacterization,” Chromatographia, 6 (1973) 489–495.
20. J. V. Hinshaw, “A Compendium of GC Terms andTechniques,” LC-GC, 10 (1992) 516–522.
21. W. J. A. VandenHeuvel, “Some Aspects of the Chemistry ofGas-Liquid Chromatography,” In Gas Chromatography ofSteroids in Biological Fluids, M. B. Lipsett, Ed., Plenum Press,New York, (1965), 277–295.
22. J. F. Sprouse and A. Varano, “Development of a GCRetention Index Library,” American Laboratory, 16 (1984)54–68.
23. W. O. McReynolds, “Characterization of Some Liquid Phases,”Journal of Chromatographic Science, 8 (1970) 685–691.
24. S. O. Akapo, J. M. Dimandja, D. R. Kojiro, J. R. Valentin, andG. C. Carle, “Gas Chromatography in Space,” Journal ofChromatography A, 843 (1999) 147–162.
25. M. C. Pietrogrande, M. G. Zampolli, F. Dondi, C. Szopa, R.Sternberg, A. Buch, and F. Raulin, “In Situ Analysis of theMartial Soil by Gas Chromatography: Decoding of ComplexChromatograms of Organic Molecules of ExobiologicalInterest,” Journal of Chromatography A, 1071 (2005) 255–261.
26. D. R. Rushneck et al., “Viking Gas Chromatograph-MassSpectrometer,” Reviews of Scientific Instrumentation, 49 (1978)817–834.
27. V. I. Oyama, G. C. Carle, F. Woeller, J. B. Pollack, R. T.Reynolds, and R. A. Craig, “Pioneer Venus Gas
Chromatography of the Lower Atmosphere of Venus,”Journal of Geophysical Research, 85 (1980) 7891–7901.
28. B. G. Gel’man, Y. V. Drozdov, V. V. Mel’nikov, V. A. Rotin, V.N. Khokhlov, V. B. Bondarev, G. G. Dol’nikov, A. V.D’yachkov, D. F. Nenarokov, L. M. Mukhin, N. V. Porshnev,and A. A. Fursov, “Chemical Analysis of Aerosol in theVenusian Cloud Layer by Reaction Gas Chromatography onBoard the Vega Landers,” Document NASA-TM-88421,National Aeronautics and Space Administration,Washington, DC, (1986), 1–6.
29. Z. Ji and R. E. Majors, “Porous-Layer Open-TubularCapillary GC Columns and Their Applications,” LC-GC, 16(1998) 620–632.
30. D. A. Skoog, E. J. Holler, and T. A. Nieman, Principles ofInstrumental Analysis, 5th ed., Harcourt Brace, Philadelphia,PA, 1998.
31. D. R. Lide, Ed., CRC Handbook of Chemistry and Physics, 83rded., CRC Press, Boca Raton, FL, 2002.
32. M. Windholz, Ed., The Merck Index, 10th ed., Merck & Co.,Rahway, NJ, 1983.
33. J. V. Hinshaw, “Optimizing Column Temperature,” LC-GC, 9(1991) 94–98.
34. L. S. Ettre, “Fifty Years of GC Instrumentation,” LC-GCEurope, 18 (2005) 416–421.
35. R. Sacks, H. Smith and M. Nowak, “High-Speed GasChromatography,” Analytical Chemistry, 70 (1998) 29A–37A.
96943_21_ch21_p507-536 1/11/10 8:08 AM Page 536